Investment Portfolio Dashboard

Digital Marketing KPI Dashboard With Goal Conversion Rate Ideas PDF
The following slide showcases a marketing KPI dashboard. The various metrics highlighted in the slide are total sessions, bounce rate, goal completions, goal conversion rate, top channels which generated revenue. Pitch your topic with ease and precision using this Digital Marketing KPI Dashboard With Goal Conversion Rate Ideas PDF. This layout presents information on Rate, Goal, Conversions. It is also available for immediate download and adjustment. So, changes can be made in the color, design, graphics or any other component to create a unique layout.

Email Marketing KPI Dashboard With Bounce Rate Demonstration PDF
The following slide showcases KPI dashboard which allows marketers to track the email marketing campaign performance. Information covered in this slide is related to total subscribers, types of email sent, open, clicks, bounces and unsubscribed etc. Showcasing this set of slides titled Email Marketing KPI Dashboard With Bounce Rate Demonstration PDF. The topics addressed in these templates are Organic, Paid, Information. All the content presented in this PPT design is completely editable. Download it and make adjustments in color, background, font etc. as per your unique business setting

KPI Dashboard Highlighting Results Of SEO Campaign Topics PDF
The following slide showcases marketing KPI dashboard which shows the performance measuring metrics of SEO campaign. The metrics covered in the slide are most viewed pages from SEO, most search engines used, traffic type, top known keywords etc. Pitch your topic with ease and precision using this KPI Dashboard Highlighting Results Of SEO Campaign Topics PDF. This layout presents information on Search Engines, Traffic, Organic. It is also available for immediate download and adjustment. So, changes can be made in the color, design, graphics or any other component to create a unique layout.
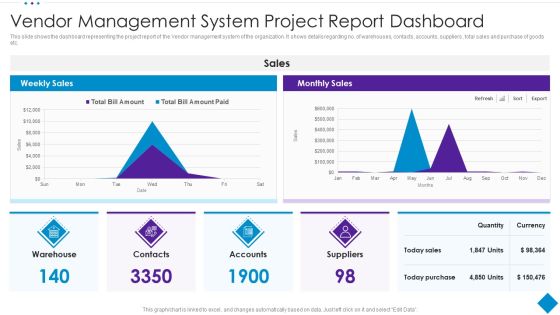
Vendor Management System Project Report Dashboard Template PDF
This slide shows the dashboard representing the project report of the Vendor management system of the organization. It shows details regarding no. of warehouses, contacts, accounts, suppliers , total sales and purchase of goods etc. Showcasing this set of slides titled Vendor Management System Project Report Dashboard Template PDF. The topics addressed in these templates are Purchase, Sales, Suppliers. All the content presented in this PPT design is completely editable. Download it and make adjustments in color, background, font etc. as per your unique business setting.

Team Mentoring Dashboard With Client And Training Details Sample PDF
This slide covers all the information related to the clients to whom coaching has been provided and in certain number of hours how many sessions they attended. It also includes the total earnings , coaching hours and the name of top clients.Pitch your topic with ease and precision using this Team Mentoring Dashboard With Client And Training Details Sample PDF This layout presents information on Team Mentoring Dashboard With Client And Training Details It is also available for immediate download and adjustment. So, changes can be made in the color, design, graphics or any other component to create a unique layout.

Dashboard To Track Referral Marketing Recommendation Program Results Structure PDF
The following slide showcases KPI dashboard which can be used by marketers to track and analyze referral program results. The template provides information about revenue generated, paying customers, promotors, clicks, cancelled customers etc. Showcasing this set of slides titled Dashboard To Track Referral Marketing Recommendation Program Results Structure PDF. The topics addressed in these templates are Revenue Generated, Recurring Revenue, Paying Customers. All the content presented in this PPT design is completely editable. Download it and make adjustments in color, background, font etc. as per your unique business setting.

KPI Dashboard Highlighting Customer Recommendation Program Results Rules PDF
The following slide showcases a comprehensive dashboard which can be used to track customer referral program results. It provides information about total participants enrolled, invites, clicks, converts, tweets, facebook shares etc. Pitch your topic with ease and precision using this KPI Dashboard Highlighting Customer Recommendation Program Results Rules PDF. This layout presents information on Participants, Invites, Converts. It is also available for immediate download and adjustment. So, changes can be made in the color, design, graphics or any other component to create a unique layout.

Dashboard For Business To Business Market Division Inspiration PDF
This slide illustrates the market segmentation dashboard for B2B which can benefit them to improve the focus and boost the revenue of the organization. It includes the Division according to industries and company size. Showcasing this set of slides titled Dashboard For Business To Business Market Division Inspiration PDF. The topics addressed in these templates are Industries, Service, Automobiles. All the content presented in this PPT design is completely editable. Download it and make adjustments in color, background, font etc. as per your unique business setting.
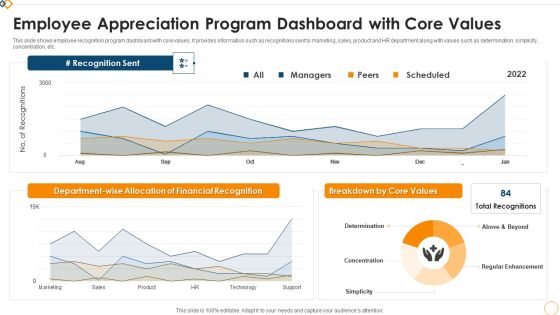
Employee Appreciation Program Dashboard With Core Values Themes PDF
This slide shows employee recognition program dashboard with core values. It provides information such as recognitions sent to marketing, sales, product and HR department along with values such as determination, simplicity, concentration, etc. Showcasing this set of slides titled Employee Appreciation Program Dashboard With Core Values Themes PDF. The topics addressed in these templates are Regular Enhancement, Determination, Concentration. All the content presented in this PPT design is completely editable. Download it and make adjustments in color, background, font etc. as per your unique business setting.
Performance Evaluation KPI Dashboard For 360 Degree Review Icons PDF
This slide covers 360 degree employee feedback dashboard. It includes metrics such as highest rated area, lowest rated area, potential blind spots, peer ratings, self rating, gap analysis, etc. Showcasing this set of slides titled Performance Evaluation KPI Dashboard For 360 Degree Review Icons PDF. The topics addressed in these templates are Highest Rated, Lowest Areas, Potential Spots. All the content presented in this PPT design is completely editable. Download it and make adjustments in color, background, font etc. as per your unique business setting.

Revenue And Customer Acquisition Analysis Strategic Administration Dashboard Clipart PDF
This slide shows the dashboard representing analysis of the revenue and customers acquired by the organization. It shows comparison between current and previous year revenue and customer acquisition.Pitch your topic with ease and precision using this Revenue And Customer Acquisition Analysis Strategic Administration Dashboard Clipart PDF This layout presents information on Revenue Customer, Compared Previous, Customer Acquisition It is also available for immediate download and adjustment. So, changes can be made in the color, design, graphics or any other component to create a unique layout.
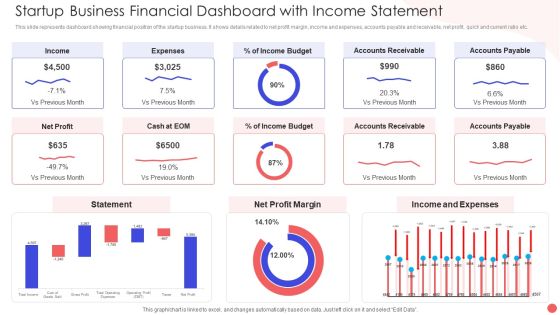
Startup Business Financial Dashboard With Income Statement Portrait PDF
This slide represents dashboard showing financial position of the startup business. It shows details related to net profit margin, income and expenses, accounts payable and receivable, net profit, quick and current ratio etc. Showcasing this set of slides titled Startup Business Financial Dashboard With Income Statement Portrait PDF. The topics addressed in these templates are Accounts Receivable Income, Income And Expenses, Net Profit Margin. All the content presented in this PPT design is completely editable. Download it and make adjustments in color, background, font etc. as per your unique business setting.
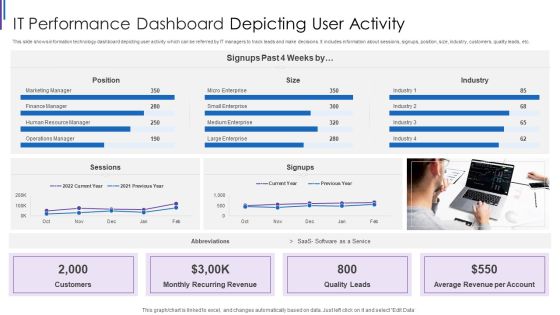
IT Performance Dashboard Depicting User Activity Inspiration PDF
This slide shows information technology dashboard depicting user activity which can be referred by IT managers to track leads and make decisions. It includes information about sessions, signups, position, size, industry, customers, quality leads, etc. Pitch your topic with ease and precision using this IT Performance Dashboard Depicting User Activity Inspiration PDF. This layout presents information on Monthly Recurring Revenue, Average Revenue Per, Account Quality Leads, Customers Position Sessions. It is also available for immediate download and adjustment. So, changes can be made in the color, design, graphics or any other component to create a unique layout.
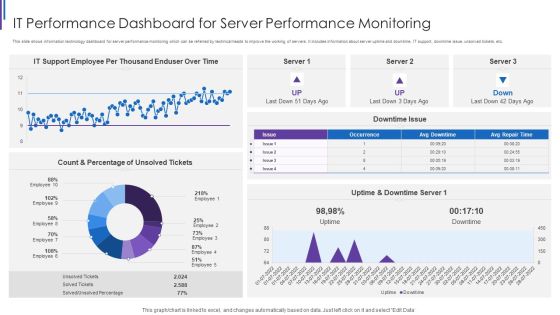
IT Performance Dashboard For Server Performance Monitoring Portrait PDF
This slide shows information technology dashboard for server performance monitoring which can be referred by technical heads to improve the working of servers. It includes information about server uptime and downtime, IT support, downtime issue, unsolved tickets, etc. Showcasing this set of slides titled IT Performance Dashboard For Server Performance Monitoring Portrait PDF. The topics addressed in these templates are IT Support Employee, Per Thousand Enduser, Uptime And Downtime, Count And Percentage. All the content presented in this PPT design is completely editable. Download it and make adjustments in color, background, font etc. as per your unique business setting.
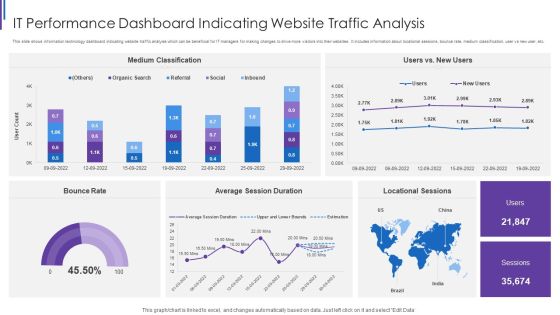
IT Performance Dashboard Indicating Website Traffic Analysis Background PDF
This slide shows information technology dashboard indicating website traffic analysis which can be beneficial for IT managers for making changes to drive more visitors into their websites. It includes information about locational sessions, bounce rate, medium classification, user vs new user, etc. Pitch your topic with ease and precision using this IT Performance Dashboard Indicating Website Traffic Analysis Background PDF. This layout presents information on Medium Classification Rate, Average Session Duration, Locational Sessions Bounce. It is also available for immediate download and adjustment. So, changes can be made in the color, design, graphics or any other component to create a unique layout.

Dashboard Of Maintenance Management Software Ppt Slides Slideshow PDF
This slide shows the maintenance management software dashboard that depicts schedule compliance, closed work orders, work requests, mean time to repair, current offline assets, high priority work orders and low stock items. Showcasing this set of slides titled Dashboard Of Maintenance Management Software Ppt Slides Slideshow PDF. The topics addressed in these templates are Closed Work Orders, Work Requests Mean, Time To Repair, Current Offline Assets. All the content presented in this PPT design is completely editable. Download it and make adjustments in color, background, font etc. as per your unique business setting.

Maintenance KPI Dashboard With Production Volume Ppt Gallery Influencers PDF
This slide presents maintenance dashboard which covers quick stats, top products, returned items, downtime causes with quantity ordered, revenues, sold items, active machines, broken machine, missing parts, price, etc. Showcasing this set of slides titled Maintenance KPI Dashboard With Production Volume Ppt Gallery Influencers PDF. The topics addressed in these templates are Top 5 Products, Downtime Causes Missing, Return Items Active. All the content presented in this PPT design is completely editable. Download it and make adjustments in color, background, font etc. as per your unique business setting.
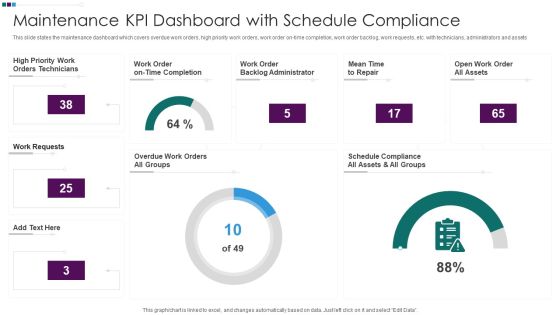
Maintenance KPI Dashboard With Schedule Compliance Ppt Styles Demonstration PDF
This slide states the maintenance dashboard which covers overdue work orders, high priority work orders, work order on-time completion, work order backlog, work requests, etc. with technicians, administrators and assets. Pitch your topic with ease and precision using this Maintenance KPI Dashboard With Schedule Compliance Ppt Styles Demonstration PDF. This layout presents information on High Priority Work, Work Order Backlog, Mean Time Repair, Open Work Order. It is also available for immediate download and adjustment. So, changes can be made in the color, design, graphics or any other component to create a unique layout.
Maintenance Software Dashboard With Charts Ppt Icon Slide Download PDF
This slide shows the dashboard of maintenance software which covers tasks per subsystem, highest maintenance time, task count, mean time to repair per level with motherboard, camera, propeller assembly, ground controller, motor , etc. Pitch your topic with ease and precision using this Maintenance Software Dashboard With Charts Ppt Icon Slide Download PDF. This layout presents information on 10 Highest Mean, Time To Repair, 10 Highest Task, Task Per Subsystem, 10 Highest Maintenance. It is also available for immediate download and adjustment. So, changes can be made in the color, design, graphics or any other component to create a unique layout.

Solid Waste Management Process KPI Dashboard Pictures PDF
Following slide highlights KPI dashboard for solid waste management which shows metrics like total material recycled by various categories, CO2 emissions by year, savings returned etc. Management can track such metrics to ensure waste management program is on track or not.Showcasing this set of slides titled Solid Waste Management Process KPI Dashboard Pictures PDF The topics addressed in these templates are Recycled Category, Sent Recycling, Tones Recycle All the content presented in this PPT design is completely editable. Download it and make adjustments in color, background, font etc. as per your unique business setting.

TCM For Technical Analysis Dashboard Indicating Intervention Time Background PDF
This Slide shows technology change management dashboard indicating Change and Release Management which can be referred by It managers for effective handling of technical change. It includes information about operational, unassigned, overhead, hold, conflicts and rejected change. Showcasing this set of slides titled TCM For Technical Analysis Dashboard Indicating Intervention Time Background PDF. The topics addressed in these templates are Operational Change, Unassigned Changes, Change Overhead. All the content presented in this PPT design is completely editable. Download it and make adjustments in color, background, font etc. as per your unique business setting.

HR Analytical Workforce Administration Kpi Dashboard Introduction PDF
The below slide provides an insights to various KPAs of HR analytics. It includes elements such as extra time worked, leave hours, job order wise workforce expenses, expected versus actual hours etc. Showcasing this set of slides titled HR Analytical Workforce Administration Kpi Dashboard Introduction PDF. The topics addressed in these templates are Workforce Expenses, Administration KPI Dashboard. All the content presented in this PPT design is completely editable. Download it and make adjustments in color, background, font etc. as per your unique business setting.

Capacity Allotment Management Dashboard With Staff Demand Rules PDF
This slide shows Capacity Allocation Dashboard with Staff Demand which can be beneficial for project managers to effectively manage multiple tasks with optimum time allocation of workers. It includes information about capacity forecast, staff demand, allocation audit, users, etc. Showcasing this set of slides titled Capacity Allotment Management Dashboard With Staff Demand Rules PDF. The topics addressed in these templates are Capacity Forecast, Allocation Audit, Unstaffed Demand. All the content presented in this PPT design is completely editable. Download it and make adjustments in color, background, font etc. as per your unique business setting.

Project Health Monitoring Dashboard For Quality Administration Plan Clipart PDF
This slide illustrates quality management dashboard that can help organization to plan and identify the defects and fatal errors of project. Its key elements are total tasks, sample, quality score, defect analysis, quality score and sampling percentage. Pitch your topic with ease and precision using this Project Health Monitoring Dashboard For Quality Administration Plan Clipart PDF. This layout presents information on Quality Score, Quality Administration Plan, Defects Analysis. It is also available for immediate download and adjustment. So, changes can be made in the color, design, graphics or any other component to create a unique layout.

Insurance Analytics Corporation Clients Claims Dashboard Summary PDF
This slide illustrates clients claim status statistics of a insurance corporation. It includes total claims, monthly claims, claims amount by type, percentage of claims, denied and received claims line graph. Showcasing this set of slides titled Insurance Analytics Corporation Clients Claims Dashboard Summary PDF. The topics addressed in these templates are Insurance Analytics Corporation, Clients Claims Dashboard. All the content presented in this PPT design is completely editable. Download it and make adjustments in color, background, font etc. as per your unique business setting.

Insurance Analytics Corporation Sales Insights Dashboard Structure PDF
This slide illustrates facts and figures in relation to sales and overall policy status. It includes total policies and premiums in current and previous year, quarterly premium revenue and monthly policy status. Pitch your topic with ease and precision using this Insurance Analytics Corporation Sales Insights Dashboard Structure PDF. This layout presents information on Quarterly Premium Revenue, Sales Insights Dashboard, Insurance Analytics Corporation. It is also available for immediate download and adjustment. So, changes can be made in the color, design, graphics or any other component to create a unique layout.

Computer Security Dashboard With Incident And Threat Management Rules PDF
This slide shows the dashboard of cyber security with incidents and threat management. It includes overall progress, risk identified , number of critical incidents, initiative , incident and threat management etc.Showcasing this set of slides titled Computer Security Dashboard With Incident And Threat Management Rules PDF The topics addressed in these templates are Critical Incidents, Risks Identified, Compliance All the content presented in this PPT design is completely editable. Download it and make adjustments in color, background, font etc. as per your unique business setting.
Weekly Tracking Dashboard For Social Media Content Inspiration PDF
This slide showcases weekly content tracking dashboard that can help organization to track the statistics of social media blogs and videos. Its key components are avg impressions per post, avg reach per post, avg engagement rate and avg click through rate.Showcasing this set of slides titled Weekly Tracking Dashboard For Social Media Content Inspiration PDF The topics addressed in these templates are Impressions Per, Impression On Facebook, Posts Reactions All the content presented in this PPT design is completely editable. Download it and make adjustments in color, background, font etc. as per your unique business setting.
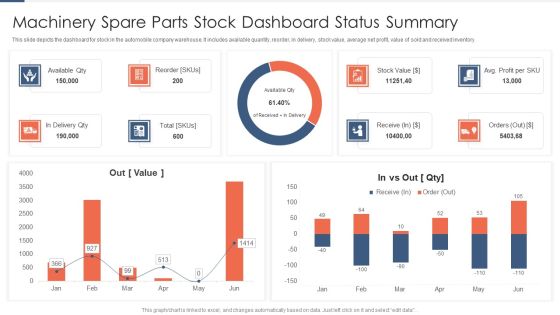
Machinery Spare Parts Stock Dashboard Status Summary Topics PDF
This slide depicts the dashboard for stock in the automobile company warehouse. It includes available quantity, reorder, in delivery, stock value, average net profit, value of sold and received inventory. Pitch your topic with ease and precision using this Machinery Spare Parts Stock Dashboard Status Summary Topics PDF. This layout presents information on Available Qty, Delivery Qty, Reorder. It is also available for immediate download and adjustment. So, changes can be made in the color, design, graphics or any other component to create a unique layout.
Marketing And Operations Dashboard For Ecommerce Business Icons PDF
This slide covers sales and operations dashboard for ecommerce business. It involves details such as total sales generated, number of brands, total revenue generated, number of units sold and gender and age range breakdown. Showcasing this set of slides titled Marketing And Operations Dashboard For Ecommerce Business Icons PDF. The topics addressed in these templates are Total Sales Generated, Total Revenue Generated, Returning Consumers. All the content presented in this PPT design is completely editable. Download it and make adjustments in color, background, font etc. as per your unique business setting.

Marketing And Operations Dashboard To Drive Effective Productivity Background PDF
This slide covers sales and operations dashboard to drive effective productivity. It involves details such as number of account assigned, working accounts, engaged accounts and total account activity. Pitch your topic with ease and precision using this Marketing And Operations Dashboard To Drive Effective Productivity Background PDF. This layout presents information on Total Account Activity, Number Of Working Account, Engaged Account. It is also available for immediate download and adjustment. So, changes can be made in the color, design, graphics or any other component to create a unique layout.
Gross Profit Margin Dashboard With Revenue Vs Expenses Icons PDF
This slide showcases dashboard that can help organization to evaluate the revenue generated and expenses incurred in conducting operations. It also showcases gross profit and margin of last financial year. Pitch your topic with ease and precision using this Gross Profit Margin Dashboard With Revenue Vs Expenses Icons PDF. This layout presents information on Gross Profit Margin, EBITDA Margin, Net Profit Margin. It is also available for immediate download and adjustment. So, changes can be made in the color, design, graphics or any other component to create a unique layout.

Ecommerce Marketing Activities KPI Dashboard To Analyse Performance Guidelines PDF
This slide covers ecommerce marketing KPI dashboard to track performance. It involves details such as ecommerce revenue generated, number of new customers, repeat buying rate, attribute revenue and conversion rate and attributed revenue and conversion rate by marketing channel.Pitch your topic with ease and precision using this Ecommerce Marketing Activities KPI Dashboard To Analyse Performance Guidelines PDF. This layout presents information on Revenue Generated, Ecommerce Revenue, Generate Conversion. It is also available for immediate download and adjustment. So, changes can be made in the color, design, graphics or any other component to create a unique layout.
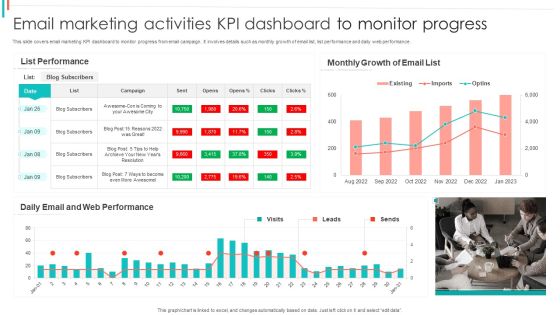
Email Marketing Activities KPI Dashboard To Monitor Progress Pictures PDF
This slide covers email marketing KPI dashboard to monitor progress from email campaign. It involves details such as monthly growth of email list, list performance and daily web performance.Showcasing this set of slides titled Email Marketing Activities KPI Dashboard To Monitor Progress Pictures PDF. The topics addressed in these templates are List Performance, Monthly Growth, Web Performance. All the content presented in this PPT design is completely editable. Download it and make adjustments in color, background, font etc. as per your unique business setting.

SEO Marketing Activities KPI Dashboard With Major Leads Formats PDF
This slide covers CMO marketing KPI dashboard to improve performance visibility of marketing. It involves details such as conversion metrics, quality of trial leads, engagement from social media and top channels.Showcasing this set of slides titled SEO Marketing Activities KPI Dashboard With Major Leads Formats PDF. The topics addressed in these templates are Conversion Metrics, Media Engagement, Conversion Rate. All the content presented in this PPT design is completely editable. Download it and make adjustments in color, background, font etc. as per your unique business setting.
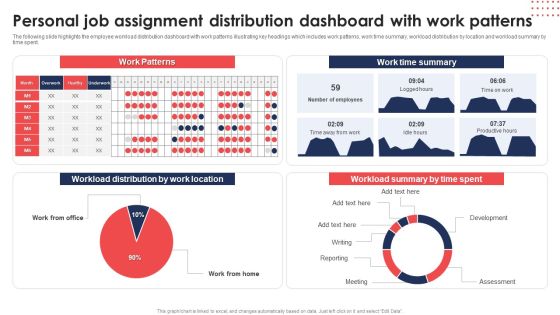
Personal Job Assignment Distribution Dashboard With Work Patterns Diagrams PDF
The following slide highlights the employee workload distribution dashboard with work patterns illustrating key headings which includes work patterns, work time summary, workload distribution by location and workload summary by time spent. Showcasing this set of slides titled Personal Job Assignment Distribution Dashboard With Work Patterns Diagrams PDF. The topics addressed in these templates are Work Patterns, Workload Distribution, Work Location. All the content presented in this PPT design is completely editable. Download it and make adjustments in color, background, font etc. as per your unique business setting.
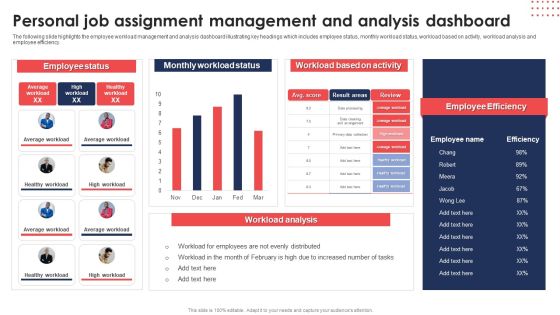
Personal Job Assignment Management And Analysis Dashboard Diagrams PDF
The following slide highlights the employee workload management and analysis dashboard illustrating key headings which includes employee status, monthly workload status, workload based on activity, workload analysis and employee efficiency. Pitch your topic with ease and precision using thisPersonal Job Assignment Management And Analysis Dashboard Diagrams PDF. This layout presents information on Employee Status, Monthly Workload Status, Workload Based Activity. It is also available for immediate download and adjustment. So, changes can be made in the color, design, graphics or any other component to create a unique layout.

Personal Job Assignment Management Dashboard With Progress Background PDF
The following slide highlights the employee workload management dashboard with progress illustrating key headings which includes monthly task status, time, progress, task, employee work status and workload. Showcasing this set of slides titled Personal Job Assignment Management Dashboard With Progress Background PDF. The topics addressed in these templates are Monthly Task Status, Time, Progress, Employee Work Status. All the content presented in this PPT design is completely editable. Download it and make adjustments in color, background, font etc. as per your unique business setting.

Dashboard For Education Institutes With Student Retention Metrics Slides PDF
This slide covers dashboard for tracking student and faculty members details. It include metrics such as faculty to student ratio, student attendance rate, faculty retention rate, student enrollment details, examination results overview, etc. Showcasing this set of slides titled Dashboard For Education Institutes With Student Retention Metrics Slides PDF. The topics addressed in these templates are Student Enrollment Details, Examination Results Overview, Faculty Student Ratio. All the content presented in this PPT design is completely editable. Download it and make adjustments in color, background, font etc. as per your unique business setting.
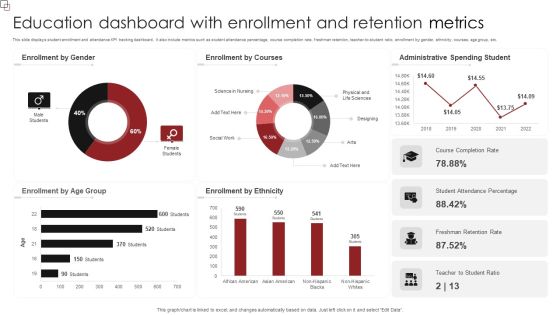
Education Dashboard With Enrollment And Retention Metrics Sample PDF
This slide displays student enrollment and attendance KPI tracking dashboard. It also include metrics such as student attendance percentage, course completion rate, freshman retention, teacher-to-student ratio, enrollment by gender, ethnicity, courses, age group, etc. Pitch your topic with ease and precision using this Education Dashboard With Enrollment And Retention Metrics Sample PDF. This layout presents information on Enrollment Gender, Enrollment Courses, Administrative Spending Student. It is also available for immediate download and adjustment. So, changes can be made in the color, design, graphics or any other component to create a unique layout.

Business Process Management Dashboard Showing Pending Processes Graphics PDF
This slide shows the dashboard of business management by calculating the number of processes that are running as well as the ones that are completed. It also shows the unsettled or remaining process with average process duration. Showcasing this set of slides titled Business Process Management Dashboard Showing Pending Processes Graphics PDF. The topics addressed in these templates are Average Process, Time Span, Number Operations. All the content presented in this PPT design is completely editable. Download it and make adjustments in color, background, font etc. as per your unique business setting.
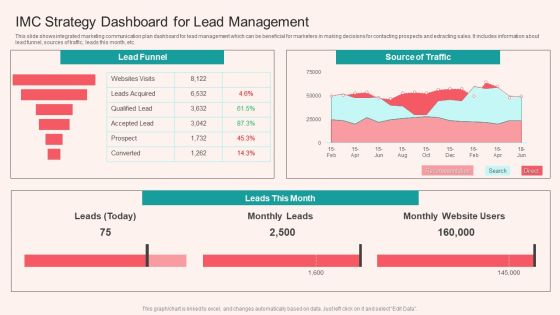
IMC Strategy Dashboard For Lead Management Infographics PDF
This slide shows integrated marketing communication plan dashboard for lead management which can be beneficial for marketers in making decisions for contacting prospects and extracting sales. It includes information about lead funnel, sources of traffic, leads this month, etc. Showcasing this set of slides titled IMC Strategy Dashboard For Lead Management Infographics PDF. The topics addressed in these templates are Source Of Traffic, Lead Funnel. All the content presented in this PPT design is completely editable. Download it and make adjustments in color, background, font etc. as per your unique business setting.
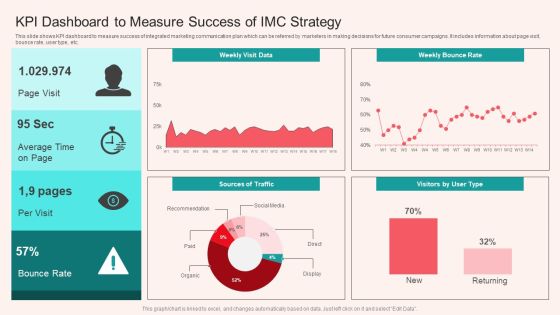
KPI Dashboard To Measure Success Of IMC Strategy Microsoft PDF
This slide shows KPI dashboard to measure success of integrated marketing communication plan which can be referred by marketers in making decisions for future consumer campaigns. It includes information about page visit, bounce rate, user type, etc. Pitch your topic with ease and precision using this KPI Dashboard To Measure Success Of IMC Strategy Microsoft PDF. This layout presents information on Average, Bounce Rate. It is also available for immediate download and adjustment. So, changes can be made in the color, design, graphics or any other component to create a unique layout.
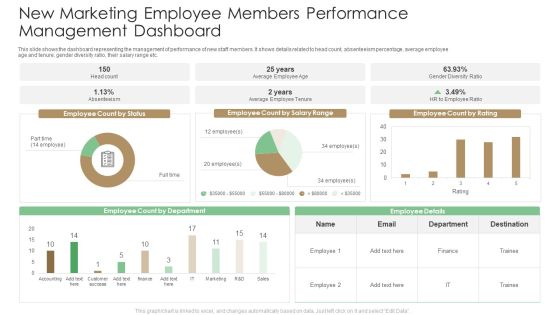
New Marketing Employee Members Performance Management Dashboard Summary PDF
This slide shows the dashboard representing the management of performance of new staff members. It shows details related to head count, absenteeism percentage, average employee age and tenure, gender diversity ratio, their salary range etc. Pitch your topic with ease and precision using this New Marketing Employee Members Performance Management Dashboard Summary PDF. This layout presents information on Employee Ratio, Average Employee Tenure. It is also available for immediate download and adjustment. So, changes can be made in the color, design, graphics or any other component to create a unique layout.

Audience Demographics Dashboard For Customer Targeting Tactics Slides PDF
This slide shows audience demographics dashboard for consumer targeting strategies which can be referred by marketers to plan out their product positioning tactics. It includes details about interests of audience, audience age, gender, globally classified, category of market, usage of smartphone, etc. Showcasing this set of slides titled Audience Demographics Dashboard For Customer Targeting Tactics Slides PDF. The topics addressed in these templates are Globally Classified Audience, Audience Market Category, Audience Age. All the content presented in this PPT design is completely editable. Download it and make adjustments in color, background, font etc. as per your unique business setting.
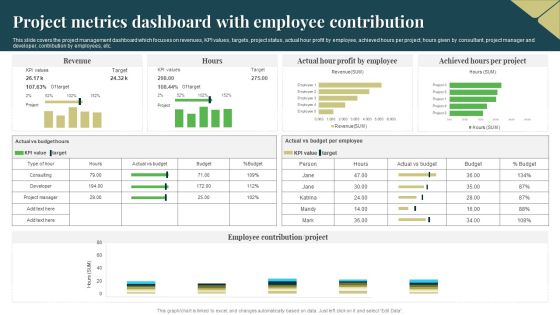
Project Metrics Dashboard With Employee Contribution Guidelines PDF
This slide covers the project management dashboard which focuses on revenues, KPI values, targets, project status, actual hour profit by employee, achieved hours per project, hours given by consultant, project manager and developer, contribution by employees, etc. Showcasing this set of slides titled Project Metrics Dashboard With Employee Contribution Guidelines PDF. The topics addressed in these templates are Target, Revenue, Profit By Employee. All the content presented in this PPT design is completely editable. Download it and make adjustments in color, background, font etc. as per your unique business setting.

Project Metrics Dashboard With Outstanding Issues Themes PDF
This slide shows the project management dashboard which includes the status, ongoing activities such as building system and interface, preparing quality standards, issues such as finding test manager, descoping risky items with burndown chart, timeline, etc. Showcasing this set of slides titled Project Metrics Dashboard With Outstanding Issues Themes PDF. The topics addressed in these templates are Quality, System, Project Timeline. All the content presented in this PPT design is completely editable. Download it and make adjustments in color, background, font etc. as per your unique business setting.
Project Metrics Dashboard With Revenues And Expenses Icons PDF
This slide shows the project management dashboard which covers the name, priorities, indicators and status which includes strategic priorities, research and development, administration, performance management, etc. With purchases in last 30 days and tasks. Showcasing this set of slides titled Project Metrics Dashboard With Revenues And Expenses Icons PDF. The topics addressed in these templates are Performance Management, Research And Development, Strategic Priorities. All the content presented in this PPT design is completely editable. Download it and make adjustments in color, background, font etc. as per your unique business setting.
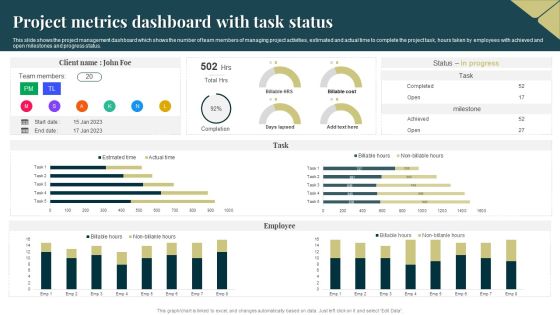
Project Metrics Dashboard With Task Status Rules PDF
This slide shows the project management dashboard which shows the number of team members of managing project activities, estimated and actual time to complete the project task, hours taken by employees with achieved and open milestones and progress status. Pitch your topic with ease and precision using this Project Metrics Dashboard With Task Status Rules PDF. This layout presents information on Team Members, Employee. It is also available for immediate download and adjustment. So, changes can be made in the color, design, graphics or any other component to create a unique layout.
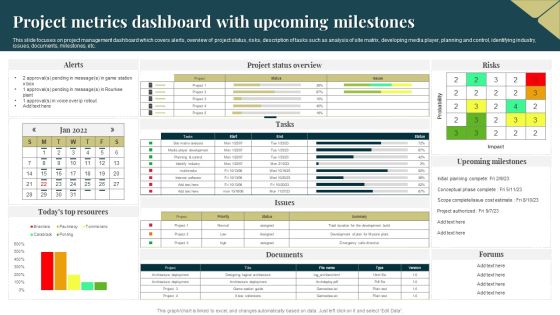
Project Metrics Dashboard With Upcoming Milestones Demonstration PDF
This slide focuses on project management dashboard which covers alerts, overview of project status, risks, description of tasks such as analysis of site matrix, developing media player, planning and control, identifying industry, issues, documents, milestones, etc. Pitch your topic with ease and precision using this Project Metrics Dashboard With Upcoming Milestones Demonstration PDF. This layout presents information on Probability, Project, Risks. It is also available for immediate download and adjustment. So, changes can be made in the color, design, graphics or any other component to create a unique layout.
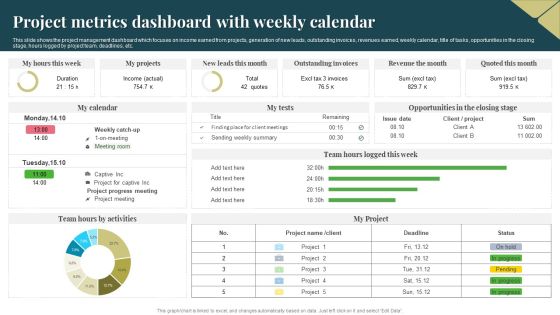
Project Metrics Dashboard With Weekly Calendar Download PDF
This slide shows the project management dashboard which focuses on income earned from projects, generation of new leads, outstanding invoices, revenues earned, weekly calendar, title of tasks, opportunities in the closing stage, hours logged by project team, deadlines, etc. Pitch your topic with ease and precision using this Project Metrics Dashboard With Weekly Calendar Download PDF. This layout presents information on Income, Revenue, Project. It is also available for immediate download and adjustment. So, changes can be made in the color, design, graphics or any other component to create a unique layout.
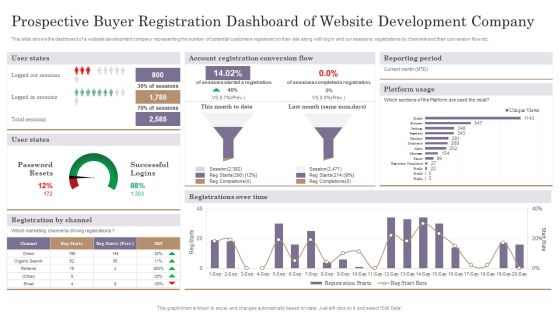
Prospective Buyer Registration Dashboard Of Website Development Company Sample PDF
This slide shows the dashboard of a website development company representing the number of potential customers registered on their site along with log in and our sessions, registrations by channels and their conversion flow etc. Showcasing this set of slides titled Prospective Buyer Registration Dashboard Of Website Development Company Sample PDF. The topics addressed in these templates are Account Registration, Reporting Period, Registrations Over. All the content presented in this PPT design is completely editable. Download it and make adjustments in color, background, font etc. as per your unique business setting.

Dashboard For Customer Satisfaction Survey Outcome Results Topics PDF
This slide showcases outcome of customer satisfaction survey that can help organization to gain insight about customer requirements and implement strategies to reduce customer churn rate in future. It also showcases product recommendation and improvement feedback from customers. Pitch your topic with ease and precision using this Dashboard For Customer Satisfaction Survey Outcome Results Topics PDF. This layout presents information on Dashboard, Customer Satisfaction, Survey Outcome Results. It is also available for immediate download and adjustment. So, changes can be made in the color, design, graphics or any other component to create a unique layout.

Dashboard For Customer Satisfaction Survey Outcome Demonstration PDF
This slide outlines customer satisfaction survey outcome dashboard that can help organization to analyze the ratings and determine areas of improvement in customer service and make changes in strategies to increase the satisfied customers in future. Its key components are survey response rate, total invitations, total responses and CSAT score. Showcasing this set of slides titled Dashboard For Customer Satisfaction Survey Outcome Demonstration PDF. The topics addressed in these templates are Total Invitations, Survey Response Rate, Total Responses. All the content presented in this PPT design is completely editable. Download it and make adjustments in color, background, font etc. as per your unique business setting.

Employee Coaching And Performance Management Dashboard Microsoft PDF
This slide showcase employee coaching and performance management dashboard which can benefit team managers in training their employees with simultaneous view of their progress. It includes information about overall team performance, management of team, progress of rating, coaching progress and objectives. Showcasing this set of slides titled Employee Coaching And Performance Management Dashboard Microsoft PDF. The topics addressed in these templates are Overall Team Performance, Management Of Team, Objectives, Progress Of Rating. All the content presented in this PPT design is completely editable. Download it and make adjustments in color, background, font etc. as per your unique business setting.
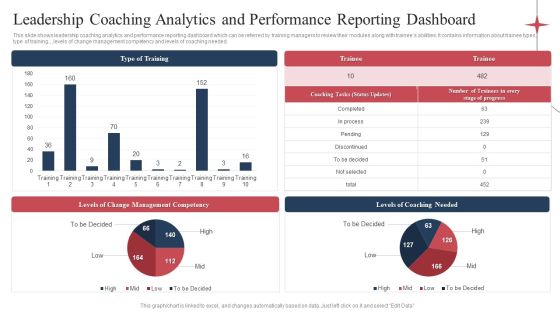
Leadership Coaching Analytics And Performance Reporting Dashboard Demonstration PDF
This slide shows leadership coaching analytics and performance reporting dashboard which can be referred by training managers to review their modules along with trainees abilities. It contains information about trainee types, type of training., ,levels of change management competency and levels of coaching needed. Pitch your topic with ease and precision using this Leadership Coaching Analytics And Performance Reporting Dashboard Demonstration PDF. This layout presents information on Levels Coaching Needed, Levels Change Management, Type Training. It is also available for immediate download and adjustment. So, changes can be made in the color, design, graphics or any other component to create a unique layout.

Cyber Security Team Analytics Dashboard With KPI Metrics Icons PDF
The following slide shows cyber analytics dashboard to monitor and inspect threats and accordingly plan preventive actions. It includes open and resolved incidents and tickets. Pitch your topic with ease and precision using this Cyber Security Team Analytics Dashboard With KPI Metrics Icons PDF. This layout presents information on Energy Security Team, Digital Security Center, Security Operations Center. It is also available for immediate download and adjustment. So, changes can be made in the color, design, graphics or any other component to create a unique layout.
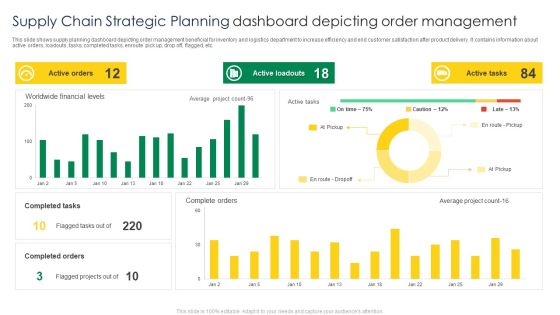
Supply Chain Strategic Planning Dashboard Depicting Order Management Mockup PDF
This slide shows supply planning dashboard depicting order management beneficial for inventory and logistics department to increase efficiency and end customer satisfaction after product delivery. It contains information about active orders, loadouts, tasks, completed tasks, enroute pick up, drop off, flagged, etc. Pitch your topic with ease and precision using this Supply Chain Strategic Planning Dashboard Depicting Order Management Mockup PDF. This layout presents information on Active Orders, Active Loadouts, Active Tasks. It is also available for immediate download and adjustment. So, changes can be made in the color, design, graphics or any other component to create a unique layout.

Business Opportunity Dashboard With Customer Metrics Information PDF
This Slide illustrates market opportunity dashboard with customer metrics which contains favorable net promoter score NPS, standard customers, growth rate, cumulative average of customer location, net income vs projection, customer distribution, sales by representatives, etc. Pitch your topic with ease and precision using this Business Opportunity Dashboard With Customer Metrics Information PDF. This layout presents information on Customer Distribution, Growth Rate, Top Customers Locations. It is also available for immediate download and adjustment. So, changes can be made in the color, design, graphics or any other component to create a unique layout.

Dashboard Showing IT Risk Control Strategies Risk Management Portrait PDF
This slide shows the dashboard that depicts the information technology risk management which focuses on the percentage of potential risks, risk analysis progress, response progress, risk rating breakdown with vulnerabilities such as encryption vulnerabilities, physical security , etc. Showcasing this set of slides titled Dashboard Showing IT Risk Control Strategies Risk Management Portrait PDF. The topics addressed in these templates are Risk Analysis Progress, Risk Heat Map, Action Plan Breakdown. All the content presented in this PPT design is completely editable. Download it and make adjustments in color, background, font etc. as per your unique business setting.
 Home
Home