AI PPT Maker
Templates
PPT Bundles
Design Services
Business PPTs
Business Plan
Management
Strategy
Introduction PPT
Roadmap
Self Introduction
Timelines
Process
Marketing
Agenda
Technology
Medical
Startup Business Plan
Cyber Security
Dashboards
SWOT
Proposals
Education
Pitch Deck
Digital Marketing
KPIs
Project Management
Product Management
Artificial Intelligence
Target Market
Communication
Supply Chain
Google Slides
Research Services
 One Pagers
All Categories
-
Home
- Customer Favorites
- Investment Portfolio Dashboard
Investment Portfolio Dashboard

Dashboard To Track Performance Of Digital Loan Applications Pictures PDF
This slide covers dashboard to assess outcomes for loan applications applied by customer through various omnichannel banking services. It includes results based on elements such as debt restructuring, commercial property loans, credit card along with branch based loans, approval rates, etc. Find a pre designed and impeccable Dashboard To Track Performance Of Digital Loan Applications Pictures PDF. The templates can ace your presentation without additional effort. You can download these easy to edit presentation templates to make your presentation stand out from others. So, what are you waiting for Download the template from Slidegeeks today and give a unique touch to your presentation.
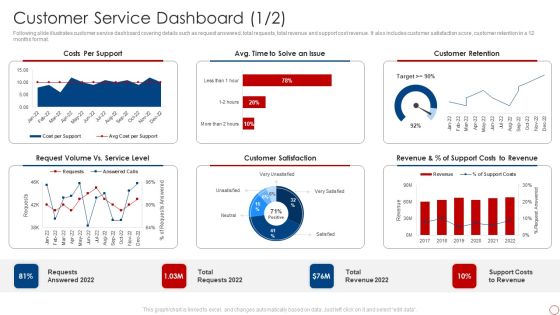
Kpis For Evaluating Business Sustainability Customer Service Dashboard Designs PDF
Following slide illustrates customer service dashboard covering details such as request answered, total requests, total revenue and support cost revenue. It also includes customer satisfaction score, customer retention in a 12 months format. Deliver and pitch your topic in the best possible manner with this Kpis For Evaluating Business Sustainability Customer Service Dashboard Designs PDF. Use them to share invaluable insights on Costs Per Support, Customer Retention, Customer Satisfaction and impress your audience. This template can be altered and modified as per your expectations. So, grab it now.

KPI Dashboard Showcasing New Product Management Project Themes PDF
This slide represents KPI dashboard showcasing new product development project which can be used by managers to track performance. It provides information regarding cost by stage, resource availability and resource stage. Pitch your topic with ease and precision using this KPI Dashboard Showcasing New Product Management Project Themes PDF. This layout presents information on Cost By Stage, Resource By Stage, Resource Availability By Role. It is also available for immediate download and adjustment. So, changes can be made in the color, design, graphics or any other component to create a unique layout.

Construction Project Metrics Dashboard Showing Resource Allocation Professional PDF
This slide shows the project management dashboard which covers the allocation of resources among workers including their job profiles such as resource manager, consultant, director consulting services, etc. with actions like finding project for worker, searching candidates. Showcasing this set of slides titled Construction Project Metrics Dashboard Showing Resource Allocation Professional PDF. The topics addressed in these templates are Resource Manager, Services, Project. All the content presented in this PPT design is completely editable. Download it and make adjustments in color, background, font etc. as per your unique business setting.

Procurement Cost Planning And Project Management Dashboard Demonstration PDF
Showcasing this set of slides titled procurement cost planning and project management dashboard demonstration pdf. The topics addressed in these templates are cost reduction, cost savings, cost avoidance. All the content presented in this PPT design is completely editable. Download it and make adjustments in color, background, font etc. as per your unique business setting.

Project Management Dashboard Depicting Resource Planning Management Diagrams PDF
This slide focuses on the project management dashboard which shows resourcing plan that also includes tasks of project such as planning, analysis, recruiting, monitoring and implementing with team members with their availability and absence, etc. Pitch your topic with ease and precision using this Project Management Dashboard Depicting Resource Planning Management Diagrams PDF. This layout presents information on Project Manager, Team Manager, Implementing It is also available for immediate download and adjustment. So, changes can be made in the color, design, graphics or any other component to create a unique layout.
Employee Performance Tracking And Management Dashboard Designs PDF
This slide showcases a dashboard presenting various metrics to measure and analyze employee overall performance. It outlines information about average absenteeism rate, yearly average overtime hours, training costs and overall labor effectiveness. Formulating a presentation can take up a lot of effort and time, so the content and message should always be the primary focus. The visuals of the PowerPoint can enhance the presenters message, so our Employee Performance Tracking And Management Dashboard Designs PDF was created to help save time. Instead of worrying about the design, the presenter can concentrate on the message while our designers work on creating the ideal templates for whatever situation is needed. Slidegeeks has experts for everything from amazing designs to valuable content, we have put everything into Employee Performance Tracking And Management Dashboard Designs PDF

Google Ads Dashboard With Campaign Cost And Returns Template PDF
Showcasing this set of slides titled google ads dashboard with campaign cost and returns template pdf. The topics addressed in these templates are value, revenue, cost. All the content presented in this PPT design is completely editable. Download it and make adjustments in color, background, font etc. as per your unique business setting.
Monthly Sales Performance Tracking And Monitoring Dashboard Designs PDF
This slide showcases a dashboard presenting various metrics to measure and analyze sales performance for revenue growth. It includes key components such as number of sales, revenue, profit, cost, sales revenue, sales increment, cost analysis and cross sell. Make sure to capture your audiences attention in your business displays with our gratis customizable Monthly Sales Performance Tracking And Monitoring Dashboard Designs PDF. These are great for business strategies, office conferences, capital raising or task suggestions. If you desire to acquire more customers for your tech business and ensure they stay satisfied, create your own sales presentation with these plain slides.

Non Profit Fundraising Plan For Organization Dashboard Clipart PDF
The purpose of this slide is to showcase result of fundraising plan in the form of dashboard. The various kpis covered in the slide are net funds raised, online donations, donations secured, fundraising ROI, donation by different sources etc. Showcasing this set of slides titled Non Profit Fundraising Plan For Organization Dashboard Clipart PDF. The topics addressed in these templates are Donation By Sources, Growth, Cost. All the content presented in this PPT design is completely editable. Download it and make adjustments in color, background, font etc. as per your unique business setting.

Construction Project Engineering Performance Metrics Dashboard Ideas PDF
This slide covers construction project engineering KPI dashboard to analyse work status. It involves KPIs such as work status, projects by stage, completion percentage of projects, utilized duration, budget variance and workload. Showcasing this set of slides titled Construction Project Engineering Performance Metrics Dashboard Ideas PDF. The topics addressed in these templates are Budget Variance, Resource, Project. All the content presented in this PPT design is completely editable. Download it and make adjustments in color, background, font etc. as per your unique business setting.

Construction Project Tracking And Control KPI Dashboard Summary PDF
Mentioned slide displays construction project monitoring and control KPI dashboard which can be used by construction manager to track various metrics. Construction manager can track metrics like project work status, projects by stages, project completion percentage, utilized duration, budget variance , workload etc. Showcasing this set of slides titled Construction Project Tracking And Control KPI Dashboard Summary PDF. The topics addressed in these templates are Budget Variance, Resources By Project, Utilized Duration. All the content presented in this PPT design is completely editable. Download it and make adjustments in color, background, font etc. as per your unique business setting.

Stocks Market Capitalization Fundamental Trend Analysis Dashboard Designs PDF
This slide represents the dashboard showing the fundamental analysis of the stock market. It includes data related to top 10 stock market capitalization, top 10 stocks by EPS and top 5 stocks by net profit.Showcasing this set of slides titled Stocks Market Capitalization Fundamental Trend Analysis Dashboard Designs PDF. The topics addressed in these templates are Market Capitalization, Net Profit. All the content presented in this PPT design is completely editable. Download it and make adjustments in color, background, font etc. as per your unique business setting.
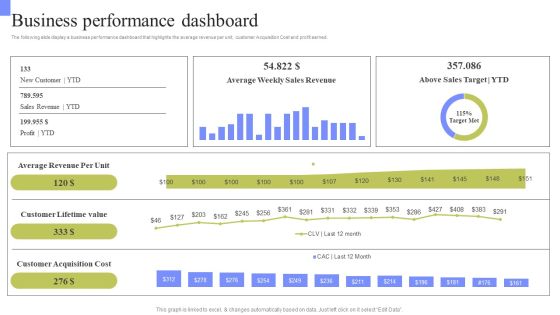
Periodic Revenue Model Business Performance Dashboard Rules PDF
The following slide display a business performance dashboard that highlights the average revenue per unit, customer Acquisition Cost and profit earned. This Periodic Revenue Model Business Performance Dashboard Rules PDF from Slidegeeks makes it easy to present information on your topic with precision. It provides customization options, so you can make changes to the colors, design, graphics, or any other component to create a unique layout. It is also available for immediate download, so you can begin using it right away. Slidegeeks has done good research to ensure that you have everything you need to make your presentation stand out. Make a name out there for a brilliant performance.

Dashboard To Track Energy Efficiency After Campaign Implementation Pictures PDF
This slide consists of a Dashboard which can be used to track energy saving which will be used by managers to track effectiveness of program implementation. The key performance indicators include electric vs gas allocation, equipment activity, changes in costs, budget load etc. Showcasing this set of slides titled Dashboard To Track Energy Efficiency After Campaign Implementation Pictures PDF. The topics addressed in these templates are Equipment Activity, Budget Load, Cost Projection. All the content presented in this PPT design is completely editable. Download it and make adjustments in color, background, font etc. as per your unique business setting.

Dashboard To Track Project Limitations By Development Stages Ideas PDF
This slide showcases KPI dashboard to keep check on major project constraints for avoiding unforeseen company losses. It further includes elements such as budget risks and cost. Pitch your topic with ease and precision using this Dashboard To Track Project Limitations By Development Stages Ideas PDF. This layout presents information on Budget By Project Tasks, Risks. It is also available for immediate download and adjustment. So, changes can be made in the color, design, graphics or any other component to create a unique layout.
KPI Dashboard To Monitor Land Asset Management Practices Clipart PDF
Following slide demonstrate KPI dashboard for tracking expenses incurred on real estate asset maintenance and to reduce operational cost. It includes elements such as net income, monthly income and expenses, last quarter rent collection status, rental revenue , budget, etc. Pitch your topic with ease and precision using this KPI Dashboard To Monitor Land Asset Management Practices Clipart PDF. This layout presents information on Revenue, Budget, Income. It is also available for immediate download and adjustment. So, changes can be made in the color, design, graphics or any other component to create a unique layout.

Periodic Revenue Model Recurring Revenue Dashboard Infographics PDF
The following slide display recurring revenue generated over the year, the following dashboard displays MRR, churn rate net recurring revenue and growth rate. Slidegeeks is one of the best resources for PowerPoint templates. You can download easily and regulate Periodic Revenue Model Recurring Revenue Dashboard Infographics PDF for your personal presentations from our wonderful collection. A few clicks is all it takes to discover and get the most relevant and appropriate templates. Use our Templates to add a unique zing and appeal to your presentation and meetings. All the slides are easy to edit and you can use them even for advertisement purposes.
Projection Model Predictive Analytics Model Performance Tracking Dashboard Microsoft PDF
This slide represents the predictive analytics model performance tracking dashboard, and it covers the details of total visitors, total buyers, total products added to the cart, filters by date and category, visitors to clients conversion rate, and so on. Find a pre-designed and impeccable Projection Model Predictive Analytics Model Performance Tracking Dashboard Microsoft PDF. The templates can ace your presentation without additional effort. You can download these easy-to-edit presentation templates to make your presentation stand out from others. So, what are you waiting for Download the template from Slidegeeks today and give a unique touch to your presentation.
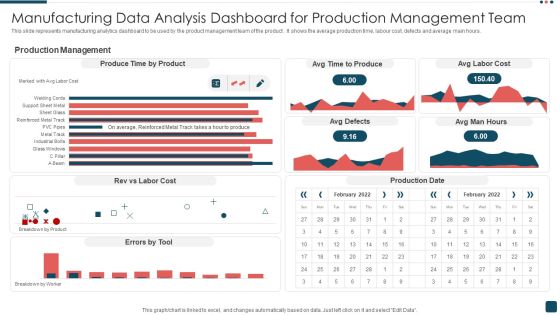
Manufacturing Data Analysis Dashboard For Production Management Team Summary PDF
This slide represents manufacturing analytics dashboard to be used by the product management team of the product . It shows the average production time, labour cost, defects and average main hours. Pitch your topic with ease and precision using this Manufacturing Data Analysis Dashboard For Production Management Team Summary PDF. This layout presents information on Production Management, Product, Cost. It is also available for immediate download and adjustment. So, changes can be made in the color, design, graphics or any other component to create a unique layout.

Product Manufacturing Data Analytics Kpis Dashboard Guidelines PDF
This slide represents the data analytics dashboard for production manufacturing and management. It includes details related to KPIs such as rework quantity, labor cost, performance, overall equipment effectiveness etc. Showcasing this set of slides titled Product Manufacturing Data Analytics Kpis Dashboard Guidelines PDF. The topics addressed in these templates are Quantity, Rework Quantity, Manufacturing Cost, Labor Cot. All the content presented in this PPT design is completely editable. Download it and make adjustments in color, background, font etc. as per your unique business setting.

Automation Project Status Dashboard Of Consulting Firm Report Background PDF
This slide showcases project status dashboard that provides a concise visual of key indicators progress and allow to compare actual performance with pre-built objectives. Key metrics covered are cost performance, time v or s project phase, timeline v or s resource capacity. Showcasing this set of slides titled Automation Project Status Dashboard Of Consulting Firm Report Background PDF. The topics addressed in these templates are Project Phase, Planned Value, Cost Performance Index. All the content presented in this PPT design is completely editable. Download it and make adjustments in color, background, font etc. as per your unique business setting.

KPI Dashboard For Measuring Information Technology Business Performance Designs PDF
This slide shows KPI dashboard for measuring information technology business performance which can be referred by technical organizations to analyze their annual performance. It includes information about monthly recurring revenue, customer acquisition cost, signups and paying customers, visitors and signups, runway, etc. Showcasing this set of slides titled KPI Dashboard For Measuring Information Technology Business Performance Designs PDF. The topics addressed in these templates are Signups And Paying, Customers Monthly Growth, Visitors And Signups, Monthly Average Revenue. All the content presented in this PPT design is completely editable. Download it and make adjustments in color, background, font etc. as per your unique business setting.

Metric Dashboard To Track Supplier Diversity And Performance Designs PDF
This slide represents KPI dashboard for tracking supplier diversity in organization and measure performance. It provides information regarding organization spending cost, supplier count, diversity type, status etc. Pitch your topic with ease and precision using this Metric Dashboard To Track Supplier Diversity And Performance Designs PDF. This layout presents information on Diversity Type, Diversity Status, Diverse Supplier. It is also available for immediate download and adjustment. So, changes can be made in the color, design, graphics or any other component to create a unique layout.

KPI Dashboard To Track Amazon Performance Designs PDF
This slide provides information regarding dashboard to monitor Amazon performance. The KPIs include tracking of product sales, conversion rate, advertising spends, session, organic sales, etc. Do you have to make sure that everyone on your team knows about any specific topic I yes, then you should give KPI Dashboard To Track Amazon Performance Designs PDF a try. Our experts have put a lot of knowledge and effort into creating this impeccable KPI Dashboard To Track Amazon Performance Designs PDF. You can use this template for your upcoming presentations, as the slides are perfect to represent even the tiniest detail. You can download these templates from the Slidegeeks website and these are easy to edit. So grab these today

IT Project Time Scheduling Dashboard With Task Progress Sample PDF
This slide exhibits IT project time management dashboard with task progress. It contains information about project or task entry, time taken, budget, etc. which can be beneficial in tracking an IT projects weekly budget and time. Showcasing this set of slides titled it project time scheduling dashboard with task progress sample pdf. The topics addressed in these templates are project, budget. All the content presented in this PPT design is completely editable. Download it and make adjustments in color, background, font etc. as per your unique business setting.
Website Performance Tracking And Monitoring Dashboard Designs PDF
The following slide showcases a dashboard to track and measure website performance. It includes key elements such as visits, average session duration, bounce rate, page views, goal conversion, visits by week, traffic sources, top channels by conversions, etc. Explore a selection of the finest Website Performance Tracking And Monitoring Dashboard Designs PDF here. With a plethora of professionally designed and pre made slide templates, you can quickly and easily find the right one for your upcoming presentation. You can use our Website Performance Tracking And Monitoring Dashboard Designs PDF to effectively convey your message to a wider audience. Slidegeeks has done a lot of research before preparing these presentation templates. The content can be personalized and the slides are highly editable. Grab templates today from Slidegeeks.

Customer Segmentation And Behavioral Analysis Customer Segmentation Dashboard Designs PDF
The following slide presents a customer segmentation dashboard distributing customers on demographics basis. It includes key components such as gender, technology adoption lifecycle, education and brand innovation consent. If you are looking for a format to display your unique thoughts, then the professionally designed Customer Segmentation And Behavioral Analysis Customer Segmentation Dashboard Designs PDF is the one for you. You can use it as a Google Slides template or a PowerPoint template. Incorporate impressive visuals, symbols, images, and other charts. Modify or reorganize the text boxes as you desire. Experiment with shade schemes and font pairings. Alter, share or cooperate with other people on your work. Download Customer Segmentation And Behavioral Analysis Customer Segmentation Dashboard Designs PDF and find out how to give a successful presentation. Present a perfect display to your team and make your presentation unforgettable.

Automated Internet Marketing Dashboard With Key Metrics Information PDF
The following slide highlights dashboard for digital advertising for graphical representation of marketing performance. It includes components such as cost of advertisements, cost per click, advertisements, no. of page views etc. Showcasing this set of slides titled Automated Internet Marketing Dashboard With Key Metrics Information PDF. The topics addressed in these templates are Cost Advertisements, Clicks Advertisement, Cost Per Click. All the content presented in this PPT design is completely editable. Download it and make adjustments in color, background, font etc. as per your unique business setting.
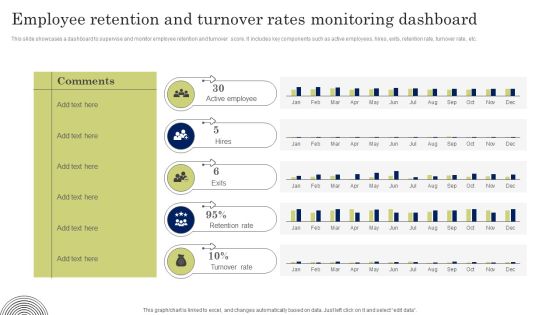
Employee Retention And Turnover Rates Monitoring Dashboard Designs PDF
This slide showcases a dashboard to supervise and monitor employee retention and turnover score. It includes key components such as active employees, hires, exits, retention rate, turnover rate, etc. Whether you have daily or monthly meetings, a brilliant presentation is necessary. Employee Retention And Turnover Rates Monitoring Dashboard Designs PDF can be your best option for delivering a presentation. Represent everything in detail using Employee Retention And Turnover Rates Monitoring Dashboard Designs PDF and make yourself stand out in meetings. The template is versatile and follows a structure that will cater to your requirements. All the templates prepared by Slidegeeks are easy to download and edit. Our research experts have taken care of the corporate themes as well. So, give it a try and see the results.

Dashboard Showing Outcomes Summary Of Project Information PDF
This slide provides the dashboard that depicts the summary of project results which also includes task status, priority, budget, pending items with quarterly statements such as kick-off meetings, staffing, testing, hardware configuration, etc.Showcasing this set of slides titled Dashboard Showing Outcomes Summary Of Project Information PDF The topics addressed in these templates are Hardware Configuration, Agree On Objectives, Final Resource All the content presented in this PPT design is completely editable. Download it and make adjustments in color, background, font etc. as per your unique business setting.

Ecommerce Data Driven Marketing Performance Analysis Dashboard Professional PDF
This slide represents the key metrics dashboard to track and analyze the performance of ecommerce business after implementing data driven marketing strategies. It includes details related to key metrics such as ecommerce revenue, new customers, repeat purchase rate etc. Get a simple yet stunning designed Ecommerce Data Driven Marketing Performance Analysis Dashboard Professional PDF. It is the best one to establish the tone in your meetings. It is an excellent way to make your presentations highly effective. So, download this PPT today from Slidegeeks and see the positive impacts. Our easy-to-edit Ecommerce Data Driven Marketing Performance Analysis Dashboard Professional PDF can be your go-to option for all upcoming conferences and meetings. So, what are you waiting for Grab this template today.
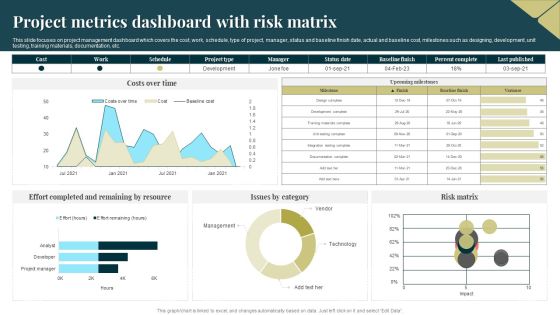
Project Metrics Dashboard With Risk Matrix Microsoft PDF
This slide focuses on project management dashboard which covers the cost, work, schedule, type of project, manager, status and baseline finish date, actual and baseline cost, milestones such as designing, development, unit testing, training materials, documentation, etc. Showcasing this set of slides titled Project Metrics Dashboard With Risk Matrix Microsoft PDF. The topics addressed in these templates are Risk Matrix, Resource, Management. All the content presented in this PPT design is completely editable. Download it and make adjustments in color, background, font etc. as per your unique business setting.
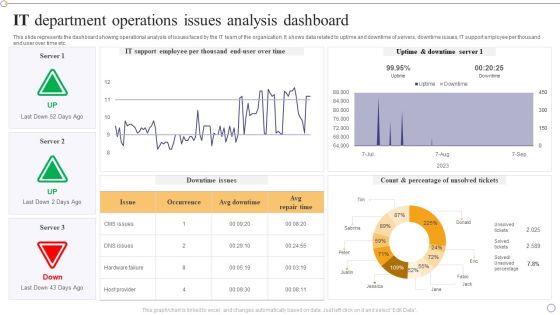
IT Department Operations Issues Analysis Dashboard Designs PDF
This slide represents the dashboard showing operational analysis of issues faced by the IT team of the organization. It shows data related to uptime and downtime of servers, downtime issues, IT support employee per thousand end user over time etc.Pitch your topic with ease and precision using this IT Department Operations Issues Analysis Dashboard Designs PDF. This layout presents information on Support Employee, Uptime Downtime, Percentage Unsolved. It is also available for immediate download and adjustment. So, changes can be made in the color, design, graphics or any other component to create a unique layout.

Personnel Salary Dashboard For Executive Management And Workers Rules PDF
The following slide highlights the employee payroll dashboard for executive, management and workers illustrating key headings which includes country, pay period, pay groups, payroll summary, payroll results, payroll details, payroll preparation, payroll processing and worker data. Showcasing this set of slides titled Personnel Salary Dashboard For Executive Management And Workers Rules PDF. The topics addressed in these templates are Management, Executive, Employees Fund. All the content presented in this PPT design is completely editable. Download it and make adjustments in color, background, font etc. as per your unique business setting.

Dashboard Showcasing Business Revenue Target Vs Accomplishment Assessment Information PDF
This slide represents dashboard showcasing company revenue target vs achievement analysis which helps track business growth. It provides information regarding metrics such as monthly production targets, business revenue targets and generated, monthly budgeted cost and expenses per lead. Showcasing this set of slides titled Dashboard Showcasing Business Revenue Target Vs Accomplishment Assessment Information PDF. The topics addressed in these templates are Total Revenue, Target, Achievement. All the content presented in this PPT design is completely editable. Download it and make adjustments in color, background, font etc. as per your unique business setting.
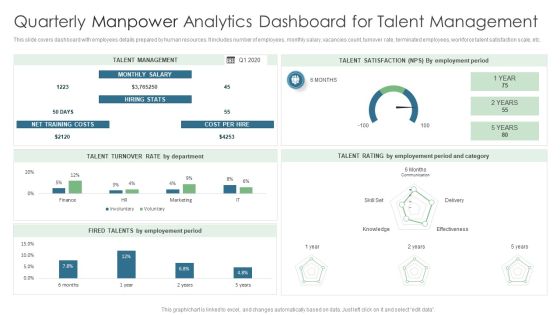
Quarterly Manpower Analytics Dashboard For Talent Management Infographics PDF
This slide covers dashboard with employees details prepared by human resources. It includes number of employees, monthly salary, vacancies count, turnover rate, terminated employees, workforce talent satisfaction scale, etc. Showcasing this set of slides titled Quarterly Manpower Analytics Dashboard For Talent Management Infographics PDF. The topics addressed in these templates are Talent Management, Cost Per Hire, Net Training Costs. All the content presented in this PPT design is completely editable. Download it and make adjustments in color, background, font etc. as per your unique business setting.
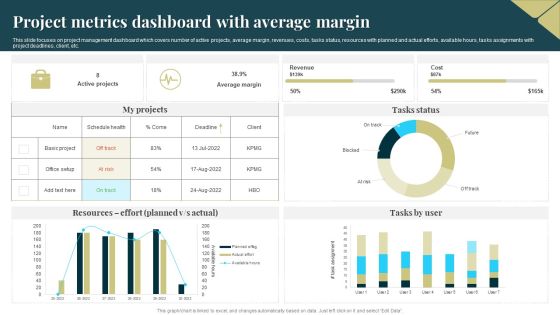
Project Metrics Dashboard With Average Margin Sample PDF
This slide focuses on project management dashboard which covers number of active projects, average margin, revenues, costs, tasks status, resources with planned and actual efforts, available hours, tasks assignments with project deadlines, client, etc. Pitch your topic with ease and precision using this Project Metrics Dashboard With Average Margin Sample PDF. This layout presents information on Average Margin, Revenue, Cost. It is also available for immediate download and adjustment. So, changes can be made in the color, design, graphics or any other component to create a unique layout.
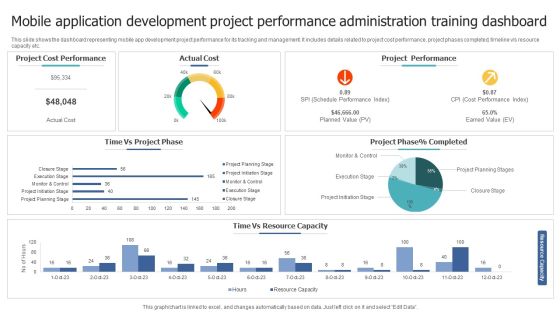
Mobile Application Development Project Performance Administration Training Dashboard Inspiration PDF
This slide shows the dashboard representing mobile app development project performance for its tracking and management. It includes details related to project cost performance, project phases completed, timeline v or s resource capacity etc. Showcasing this set of slides titled Mobile Application Development Project Performance Administration Training Dashboard Inspiration PDF. The topics addressed in these templates are Project Cost Performance, Project Performance, Planned Value. All the content presented in this PPT design is completely editable. Download it and make adjustments in color, background, font etc. as per your unique business setting.
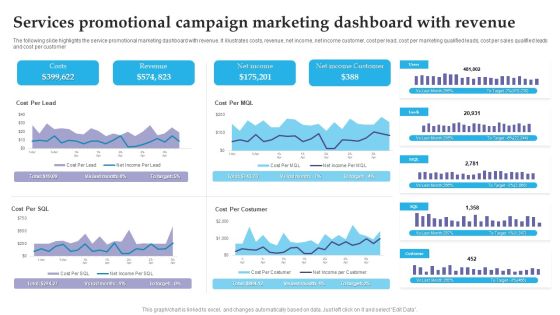
Services Promotional Campaign Marketing Dashboard With Revenue Brochure PDF
The following slide highlights the service promotional marketing dashboard with revenue. It illustrates costs, revenue, net income, net income customer, cost per lead, cost per marketing qualified leads, cost per sales qualified leads and cost per customer. Pitch your topic with ease and precision using this Services Promotional Campaign Marketing Dashboard With Revenue Brochure PDF. This layout presents information on Costs, Revenue, Net Income. It is also available for immediate download and adjustment. So, changes can be made in the color, design, graphics or any other component to create a unique layout.

Dashboard To Monitor Logistics Chains Warehouse Operations Diagrams PDF
Following slide depicts a dashboard which can be used by supplier to get a centralized, real-time view of key metrics and data points related to the logistics performance. Key performance metrics are related to due receipts, number of products received,items in transit, items due for pickup etc. Pitch your topic with ease and precision using this Dashboard To Monitor Logistics Chains Warehouse Operations Diagrams PDF. This layout presents information on Product Status, Pickup List Status, Best Selling Products. It is also available for immediate download and adjustment. So, changes can be made in the color, design, graphics or any other component to create a unique layout.

Digital Marketing Campaign Performance Monitoring Dashboard Pictures PDF
This slide represents the dashboard for measuring and monitoring the performance of digital marketing campaign. It includes information related to the advertisement cost, cost per conversion, no. of clicks, conversion rate, impressions, cost per click, click through rate and cost per thousand impressions of the project.Pitch your topic with ease and precision using this Digital Marketing Campaign Performance Monitoring Dashboard Pictures PDF. This layout presents information on Conversion Rate, Per Conversion, Cost Per Thousand. It is also available for immediate download and adjustment. So, changes can be made in the color, design, graphics or any other component to create a unique layout.

Digital Advertising Campaign Dashboard For Effective Performance Management Sample PDF
This slide represents dashboard showcasing digital marketing campaign performance which helps track project progress. It provides information regarding campaign cost, conversions, ad impressions, cost per click etc. Pitch your topic with ease and precision using this Digital Advertising Campaign Dashboard For Effective Performance Management Sample PDF. This layout presents information on Total Campaign Cost, Conversions, Ad Impressions, Cost Per Click, Cost Per Ad Impressions. It is also available for immediate download and adjustment. So, changes can be made in the color, design, graphics or any other component to create a unique layout.

Prospective Buyer Retention Dashboard With Key Performance Indicators Themes PDF
This slide shows the dashboard representing the key performance metrics for retention of potential customers of the organization. It shows no. of active users, churn rate, cost of customer acquisition, their life time value, monthly recurring revenue etc.Pitch your topic with ease and precision using this Prospective Buyer Retention Dashboard With Key Performance Indicators Themes PDF. This layout presents information on Recurring Revenue, Revenue Growth, Customer Acquisition. It is also available for immediate download and adjustment. So, changes can be made in the color, design, graphics or any other component to create a unique layout.

Personnel Management Dashboard With Salary And Overtime Data Ideas PDF
The following slide highlights the payroll management dashboard with salary and overtime data illustrating key headings which includes employee cost, average salary, overtime per day, Average base salary and average overtime cost. Pitch your topic with ease and precision using this Personnel Management Dashboard With Salary And Overtime Data Ideas PDF. This layout presents information on Average, Customer Service, Cost. It is also available for immediate download and adjustment. So, changes can be made in the color, design, graphics or any other component to create a unique layout.

Dashboard Depicting Digital Advertising Marketing Campaign Ppt Summary Elements PDF
This slide represents dashboard for advertising campaign report .It includes social media costs , clicks , cost per action , conversions to help businesses in increasing sales of products and services. Showcasing this set of slides titled Dashboard Depicting Digital Advertising Marketing Campaign Ppt Summary Elements PDF. The topics addressed in these templates are Social Media Cost, Social Media Clicks, Adwords Clicks, Adwords Cost . All the content presented in this PPT design is completely editable. Download it and make adjustments in color, background, font etc. as per your unique business setting.

Maintenance KPI Dashboard With Work Orders Ppt Gallery Model PDF
This slide focuses on maintenance dashboard which covers percentage of delayed start, finish, man hours actual versus estimate and work type such as preventive maintenance, calibration, corrective and emergency maintenance. Showcasing this set of slides titled Maintenance KPI Dashboard With Work Orders Ppt Gallery Model PDF. The topics addressed in these templates are Preventive Maintenance Callibration, Man Hours Actual, Delayed Finish Percent. All the content presented in this PPT design is completely editable. Download it and make adjustments in color, background, font etc. as per your unique business setting.

Dashboard To Analyse Effectiveness Of Promotions Execution Plan Diagrams PDF
This slide depicts analysis dashboard for tracking marketing activities with implementations and continuously updates data so businesses can track the marketing effectiveness. The various key performing indicators are cost, conversions and channel performance. Showcasing this set of slides titled Dashboard To Analyse Effectiveness Of Promotions Execution Plan Diagrams PDF. The topics addressed in these templates are Channel Performance, Cost, Conversions. All the content presented in this PPT design is completely editable. Download it and make adjustments in color, background, font etc. as per your unique business setting.
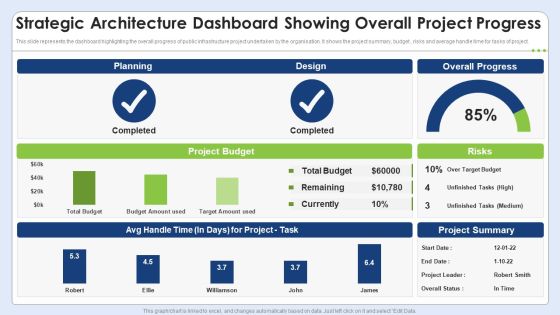
Strategic Architecture Dashboard Showing Overall Project Progress Introduction PDF
This slide represents the dashboard highlighting the overall progress of public infrastructure project undertaken by the organisation. It shows the project summary, budget , risks and average handle time for tasks of project. Showcasing this set of slides titled Strategic Architecture Dashboard Showing Overall Project Progress Introduction PDF. The topics addressed in these templates are Budget, Risks, Target. All the content presented in this PPT design is completely editable. Download it and make adjustments in color, background, font etc. as per your unique business setting.
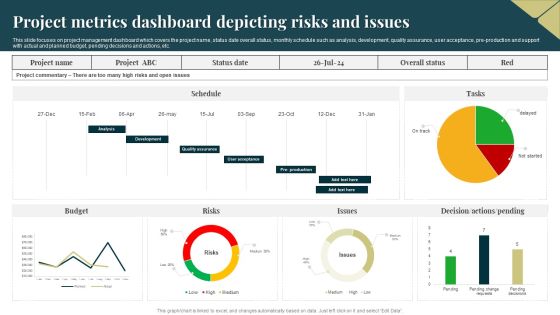
Project Metrics Dashboard Depicting Risks And Issues Rules PDF
This slide focuses on project management dashboard which covers the project name, status date overall status, monthly schedule such as analysis, development, quality assurance, user acceptance, pre production and support with actual and planned budget, pending decisions and actions, etc. Showcasing this set of slides titled Project Metrics Dashboard Depicting Risks And Issues Rules PDF. The topics addressed in these templates are Budget, Risks, Project. All the content presented in this PPT design is completely editable. Download it and make adjustments in color, background, font etc. as per your unique business setting.
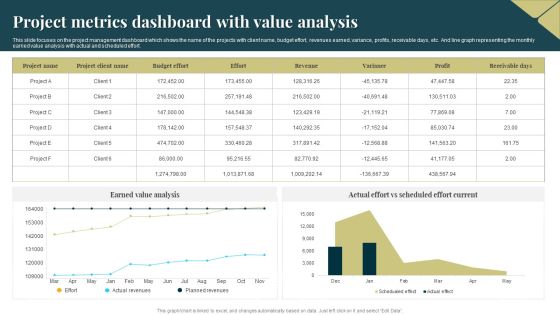
Project Metrics Dashboard With Value Analysis Introduction PDF
This slide focuses on the project management dashboard which shows the name of the projects with client name, budget effort, revenues earned, variance, profits, receivable days, etc. And line graph representing the monthly earned value analysis with actual and scheduled effort. Showcasing this set of slides titled Project Metrics Dashboard With Value Analysis Introduction PDF. The topics addressed in these templates are Budget Effort, Revenues, Earned Value Analysis. All the content presented in this PPT design is completely editable. Download it and make adjustments in color, background, font etc. as per your unique business setting.

Product Management Project Performance With Workload KPI Dashboard Structure PDF
This slide provides dashboard showcasing product development project performance progress which helps managers identify areas of improvement. It provides information such as project budget overview, issue breakdown, workload management and hour spent on project. Pitch your topic with ease and precision using this Product Management Project Performance With Workload KPI Dashboard Structure PDF. This layout presents information on Project Budget Overview, Workload Management. It is also available for immediate download and adjustment. So, changes can be made in the color, design, graphics or any other component to create a unique layout.
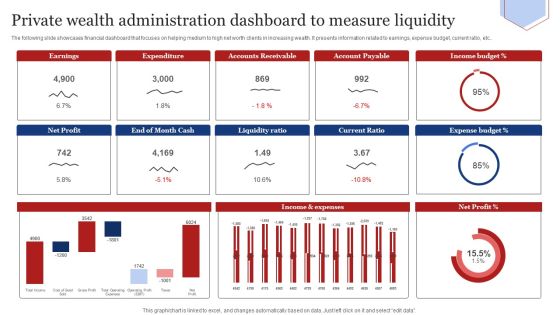
Private Wealth Administration Dashboard To Measure Liquidity Infographics PDF
The following slide showcases financial dashboard that focuses on helping medium to high net worth clients in increasing wealth. It presents information related to earnings, expense budget, current ratio, etc. Showcasing this set of slides titled Private Wealth Administration Dashboard To Measure Liquidity Infographics PDF. The topics addressed in these templates are Liquidity Ratio, Current Ratio, Expense Budget. All the content presented in this PPT design is completely editable. Download it and make adjustments in color, background, font etc. as per your unique business setting.

Continuous Process Improvement KPI Dashboard For IT Industry Clipart PDF
Following slide depicts the IT industry KPI dashboard which will assist in generating more of profit by improving strategic plan according to changing environment with clients preferences .The KPI mentioned in a slide are such as risk analysis, outstanding task , upcoming task, budget analysis, etc. Pitch your topic with ease and precision using this Continuous Process Improvement KPI Dashboard For IT Industry Clipart PDF. This layout presents information on Overall Progress, Risk Analysis, Budget Analysis. It is also available for immediate download and adjustment. So, changes can be made in the color, design, graphics or any other component to create a unique layout.

Company Payout Dashboard For Transaction Data Collection Themes PDF
The slide covers a dashboard to highlight the status of current and previous transactions. Various elements included are card details, my cash, my savings, money sent, amount transfers, transaction history, etc. Pitch your topic with ease and precision using this Company Payout Dashboard For Transaction Data Collection Themes PDF. This layout presents information on Amount Transfers, Earning Month, Previous Transaction. It is also available for immediate download and adjustment. So, changes can be made in the color, design, graphics or any other component to create a unique layout.

Dashboard For Technological Smart Homes Security System Management Designs PDF
This side showcase the dashboard of security system management for tracking and forecasting matrices for better functioning of devices. It include the statistic data such as temperature, power consumed, devices working, and list of devices connected. Showcasing this set of slides titled Dashboard For Technological Smart Homes Security System Management Designs PDF. The topics addressed in these templates are Smart Light, Smart Heating, Smart Cooling. All the content presented in this PPT design is completely editable. Download it and make adjustments in color, background, font etc. as per your unique business setting.

Dashboard To Measure Display Advertising Campaigns Performance Graphics PDF
This slide provides a dashboard to monitor the display advertising campaign performance in order to reduce overall marketing cost. It incorporates advertising cost, average number of clicks and impressions, clicks per day, revenue by campaign, etc. Formulating a presentation can take up a lot of effort and time, so the content and message should always be the primary focus. The visuals of the PowerPoint can enhance the presenters message, so our Dashboard To Measure Display Advertising Campaigns Performance Graphics PDF was created to help save time. Instead of worrying about the design, the presenter can concentrate on the message while our designers work on creating the ideal templates for whatever situation is needed. Slidegeeks has experts for everything from amazing designs to valuable content, we have put everything into Dashboard To Measure Display Advertising Campaigns Performance Graphics PDF

Dashboard For Big Healthcare Data Analytics Graphics PDF
This slide showcase the dashboard for big data analytics in healthcare. It includes elements such as bed occupancy rate, patient turnover rate, efficiency and costs, missed and cancelled appointment rate. Showcasing this set of slides titled Dashboard For Big Healthcare Data Analytics Graphics PDF. The topics addressed in these templates are Satisfaction Service Indicators, Occupancy, Forecasted Patient Turnover. All the content presented in this PPT design is completely editable. Download it and make adjustments in color, background, font etc. as per your unique business setting.
Performance Tracking Dashboard For Reinforcement Learning Model Sample PDF
This slide represents the performance tracking dashboard for the reinforcement learning model based on different time frames and categories. From laying roadmaps to briefing everything in detail, our templates are perfect for you. You can set the stage with your presentation slides. All you have to do is download these easy to edit and customizable templates. Performance Tracking Dashboard For Reinforcement Learning Model Sample PDF will help you deliver an outstanding performance that everyone would remember and praise you for. Do download this presentation today.
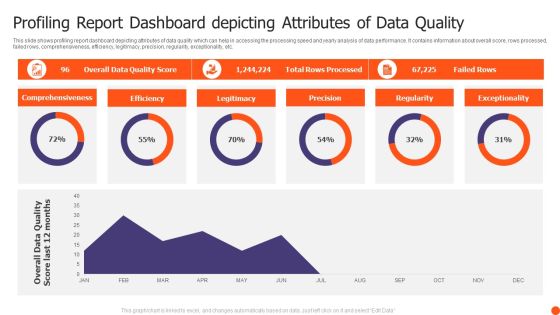
Profiling Report Dashboard Depicting Attributes Of Data Quality Themes PDF
This slide shows profiling report dashboard depicting attributes of data quality which can help in accessing the processing speed and yearly analysis of data performance. It contains information about overall score, rows processed, failed rows, comprehensiveness, efficiency, legitimacy, precision, regularity, exceptionality, etc. Pitch your topic with ease and precision using this Profiling Report Dashboard Depicting Attributes Of Data Quality Themes PDF. This layout presents information on Comprehensiveness, Efficiency, Legitimacy, Precision. It is also available for immediate download and adjustment. So, changes can be made in the color, design, graphics or any other component to create a unique layout.
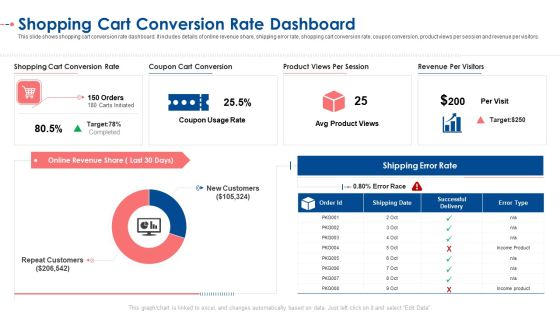
Shopping Cart Conversion Rate Dashboard Ppt Model Graphics PDF
This slide shows shopping cart conversion rate dashboard. It includes details of online revenue share, shipping error rate, shopping cart conversion rate, coupon conversion, product views per session and revenue per visitors. Deliver an awe-inspiring pitch with this creative shopping cart conversion rate dashboard ppt model graphics pdf. bundle. Topics like shopping cart conversion rate, coupon cart conversion, product views per session, revenue per visitors, avg product views can be discussed with this completely editable template. It is available for immediate download depending on the needs and requirements of the user.

Client Consultancy Services Business Performance Dashboard Ppt File Layout PDF
This slide shows dashboard to determine overall performance and customer satisfaction of consultancy business. It includes various elements such as total revenue, percentage of support cost, cost per support, average time to solve problem etc. Showcasing this set of slides titled Client Consultancy Services Business Performance Dashboard Ppt File Layout PDF. The topics addressed in these templates are Revenue And Percentage, Support Cost, Cost Per Support. All the content presented in this PPT design is completely editable. Download it and make adjustments in color, background, font etc. as per your unique business setting.

Health And Risk KPI Dashboard Ppt Pictures Designs Download PDF
The slide highlights the health and safety key performance indicator dashboard illustrating key headings which includes key objectives, inspections, total reports vs over due reports, injuries by body part and accident trends. Pitch your topic with ease and precision using this Health And Risk KPI Dashboard Ppt Pictures Designs Download PDF. This layout presents information on Key Objectives, Inspections, Accidents Trends. It is also available for immediate download and adjustment. So, changes can be made in the color, design, graphics or any other component to create a unique layout.
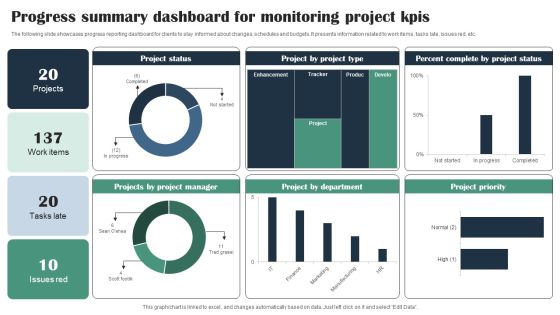
Progress Summary Dashboard For Monitoring Project Kpis Infographics PDF
The following slide showcases progress reporting dashboard for clients to stay informed about changes, schedules and budgets. It presents information related to work items, tasks late, issues red, etc. Pitch your topic with ease and precision using this Progress Summary Dashboard For Monitoring Project Kpis Infographics PDF. This layout presents information on Project Status, Project Manager, Project Type, Percent Complete. It is also available for immediate download and adjustment. So, changes can be made in the color, design, graphics or any other component to create a unique layout.

Business Development Program Dashboard For Training Program Evaluation Infographics PDF
This slide showcases dashboard that can help organization to evaluate the training program implemented in organization. Its key components are training cost, number of participants, hours of training, cost per participant and occupancy rate. Get a simple yet stunning designed Business Development Program Dashboard For Training Program Evaluation Infographics PDF. It is the best one to establish the tone in your meetings. It is an excellent way to make your presentations highly effective. So, download this PPT today from Slidegeeks and see the positive impacts. Our easy-to-edit Business Development Program Dashboard For Training Program Evaluation Infographics PDF can be your go-to option for all upcoming conferences and meetings. So, what are you waiting for Grab this template today.
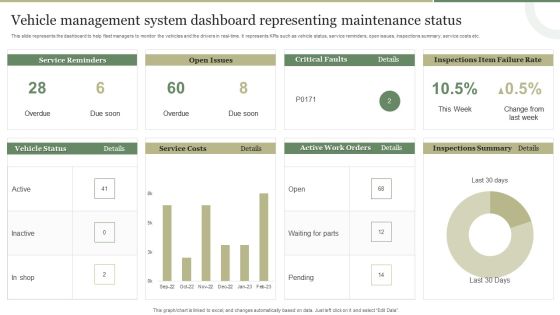
Vehicle Management System Dashboard Representing Maintenance Status Template PDF
This slide represents the dashboard representing the key metrics of the vehicle management system to monitor the vehicles and drivers in real-time. It includes key metrics such as service reminders, fuel costs, open issues, recent comments etc. Pitch your topic with ease and precision using this Vehicle Management System Dashboard Representing Maintenance Status Template PDF This layout presents information on Fuel Costs, Total Cost, Service Reminder, Recent Comments. It is also available for immediate download and adjustment. So, changes can be made in the color, design, graphics or any other component to create a unique layout.
Employee Talent Management Procedure Tracking Dashboard With Kpis Download PDF
This slide represents dashboard of the human resource department for tracking the performance and management of organizations workforce. It includes details related to monthly new hires, total active employees, suite people metrics along with key performance indicators. Showcasing this set of slides titled Employee Talent Management Procedure Tracking Dashboard With Kpis Download PDF. The topics addressed in these templates are Total Active Employees, Employees, Suite People Metrics. All the content presented in this PPT design is completely editable. Download it and make adjustments in color, background, font etc. as per your unique business setting.
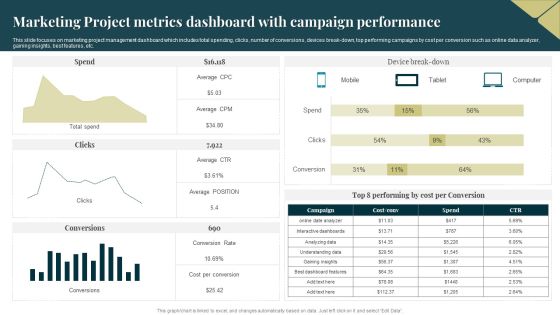
Marketing Project Metrics Dashboard With Campaign Performance Topics PDF
This slide focuses on marketing project management dashboard which includes total spending, clicks, number of conversions, devices break down, top performing campaigns by cost per conversion such as online data analyzer, gaining insights, best features, etc. Showcasing this set of slides titled Marketing Project Metrics Dashboard With Campaign Performance Topics PDF. The topics addressed in these templates are Average, Cost, Analyzing Data. All the content presented in this PPT design is completely editable. Download it and make adjustments in color, background, font etc. as per your unique business setting.

Dashboard Highlighting Product Kpis For Enhancement Strategy Structure PDF
This slide illustrates dashboard indicating product kpis for improvement plan which can be referred by organizations to review sales campaign performance. It includes information about top products in revenue, online vs. Offline transactions, increased sales by campaign and cost of products sold. Showcasing this set of slides titled Dashboard Highlighting Product Kpis For Enhancement Strategy Structure PDF. The topics addressed in these templates are Revenue, Products, Cost. All the content presented in this PPT design is completely editable. Download it and make adjustments in color, background, font etc. as per your unique business setting.

Revenue Dashboard Of Digital Consultation Service Ppt Designs
This template shows the revenue generation dashboard of an online consulting business. The purpose of this slide is to measure the current and past revenue generation with new clients. It includes KPIs such as average comparison with revenue, CAC, etc. Pitch your topic with ease and precision using this Revenue Dashboard Of Digital Consultation Service Ppt Designs. This layout presents information on Revenue, Digital, Consultation. It is also available for immediate download and adjustment. So, changes can be made in the color, design, graphics or any other component to create a unique layout.
Dashboard Representing Employee Virtual Onboarding Statistics Designs PDF
The slide showcases dashboard representing statistics related to workforce remote onboarding in organizations. It contains KPIs such as total employees, working remotely , currently working, employee location, employees in department etc. Showcasing this set of slides titled Dashboard Representing Employee Virtual Onboarding Statistics Designs PDF. The topics addressed in these templates are Working Remotely, Currently Working, Employees Department. All the content presented in this PPT design is completely editable. Download it and make adjustments in color, background, font etc. as per your unique business setting.

Marketing KPI Dashboard With Lead To Conversion Structure PDF
The following slide showcases KPI dashboard which can be used to monitor the performance of marketing campaign. The key metrics mentioned in the slide are average daily impressions, cost per click, leads to conversion rate, cost per conversion etc. Showcasing this set of slides titled Marketing KPI Dashboard With Lead To Conversion Structure PDF. The topics addressed in these templates are Impressions, Optimization, Cost. All the content presented in this PPT design is completely editable. Download it and make adjustments in color, background, font etc. as per your unique business setting.

Project Metrics Dashboard With Launch Date Formats PDF
This slide covers the project management dashboard which includes status of project phases such as planning, designing, development and testing that also focuses on launch date of project, overdue tasks with date, deadline, etc. and workload on employees. Showcasing this set of slides titled Project Metrics Dashboard With Launch Date Formats PDF. The topics addressed in these templates are Budget, Project Launch Data, Development. All the content presented in this PPT design is completely editable. Download it and make adjustments in color, background, font etc. as per your unique business setting.
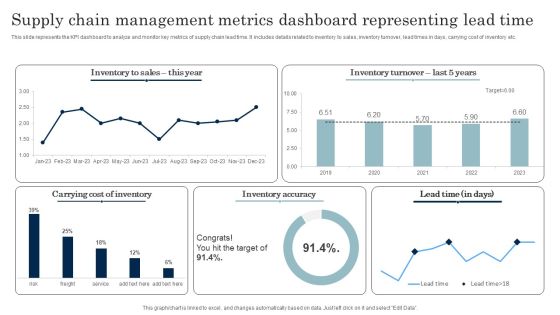
Supply Chain Management Metrics Dashboard Representing Lead Time Download PDF
This slide represents the KPI dashboard to analyze and monitor key metrics of supply chain lead time. It includes details related to inventory to sales, inventory turnover, lead times in days, carrying cost of inventory etc. Pitch your topic with ease and precision using this Supply Chain Management Metrics Dashboard Representing Lead Time Download PDF. This layout presents information on Inventory Accuracy, Carrying Cost Of Inventory. It is also available for immediate download and adjustment. So, changes can be made in the color, design, graphics or any other component to create a unique layout.

Business Intelligence Dashboard Showcasing Fleet Management Metrics Elements PDF
This slide showcases BI dashboard to ensure smooth working of shipping and logistics operations. It includes KPIs such as vehicle cost trend, price per unit, fuel consumption, distance, accident, etc. Showcasing this set of slides titled Business Intelligence Dashboard Showcasing Fleet Management Metrics Elements PDF. The topics addressed in these templates are Cost Trend, Price Per Unit Trend, Vehicle Cost Trend. All the content presented in this PPT design is completely editable. Download it and make adjustments in color, background, font etc. as per your unique business setting.

Display Ad Campaigning Dashboard To Monitor Productivity Infographics PDF
This slide showcases KPI dashboard for display advertising for real- time tracking of key marketing metrices, It includes elements such as cost, clicks, impressions, CTR, conversion rate, CPC, etc. Showcasing this set of slides titled Display Ad Campaigning Dashboard To Monitor Productivity Infographics PDF. The topics addressed in these templates are Cost Per Conversion, Conversions, Ad Impressions. All the content presented in this PPT design is completely editable. Download it and make adjustments in color, background, font etc. as per your unique business setting.

Design Software Playbook Engineers Project Management Dashboard Mockup PDF
This slide covers project evaluation dashboard including planning, design , development and testing for evaluating the project while proceeding to closure. Slidegeeks is here to make your presentations a breeze with Design Software Playbook Engineers Project Management Dashboard Mockup PDF With our easy-to-use and customizable templates, you can focus on delivering your ideas rather than worrying about formatting. With a variety of designs to choose from, you are sure to find one that suits your needs. And with animations and unique photos, illustrations, and fonts, you can make your presentation pop. So whether you are giving a sales pitch or presenting to the board, make sure to check out Slidegeeks first.

Team Learning And Performance Improvement Plan Analysis Dashboard Designs PDF
This slide shows dashboard representing the analysis of the successful implementation of the team learning and development plan. It represents the different programs held for training purpose along with the number of people trained, man days. Showcasing this set of slides titled Team Learning And Performance Improvement Plan Analysis Dashboard Designs PDF The topics addressed in these templates are Assessment Training, Business Or Vertical, Based Leadership All the content presented in this PPT design is completely editable. Download it and make adjustments in color, background, font etc. as per your unique business setting.

Support Team New Employee Members Performance Dashboard Designs PDF
This slide shows the dashboard representing the performance evaluation of the new staff members of the support team staff. It shoes details related to occupancy rate, net promoter score, average first contact resolution rate etc. Pitch your topic with ease and precision using this Support Team New Employee Members Performance Dashboard Designs PDF. This layout presents information on Target Range, Occupancy Rate, Contact Resolution Rate. It is also available for immediate download and adjustment. So, changes can be made in the color, design, graphics or any other component to create a unique layout.

Retail Analytics Dashboard To Measure Merchandise Planning Effectiveness Designs PDF
Do you have to make sure that everyone on your team knows about any specific topic I yes, then you should give Retail Analytics Dashboard To Measure Merchandise Planning Effectiveness Designs PDF a try. Our experts have put a lot of knowledge and effort into creating this impeccable Retail Analytics Dashboard To Measure Merchandise Planning Effectiveness Designs PDF. You can use this template for your upcoming presentations, as the slides are perfect to represent even the tiniest detail. You can download these templates from the Slidegeeks website and these are easy to edit. So grab these today.

New Orders Logistics Management Dashboard With Delivery Status Designs PDF
This slide showcases shipping management dashboard that can help company to daily track the status of their new orders shipped. Its key components are recent orders, items ordered, items shipped and total shipped orders. Pitch your topic with ease and precision using this New Orders Logistics Management Dashboard With Delivery Status Designs PDF. This layout presents information on Recent Orders, Current Shipping Status, New Orders. It is also available for immediate download and adjustment. So, changes can be made in the color, design, graphics or any other component to create a unique layout.

Customer Service Time Utilization Analysis Kpi Dashboard Designs PDF
The following slide highlights the time that customer expects e-mail response to enhance loyal customer base. It includes elements of response time immediate, less than one hr., within a day, two day etc. Showcasing this set of slides titled Customer Service Time Utilization Analysis Kpi Dashboard Designs PDF. The topics addressed in these templates are Customer Service, Time Utilization Analysis, KPI Dashboard. All the content presented in this PPT design is completely editable. Download it and make adjustments in color, background, font etc. as per your unique business setting.

Ad Word Marketing Campaign Management Dashboard Designs PDF
This slide showcases a dashboard for managing ad word campaign to assists marketers in optimizing their ads and PPC performance. It highlights element such as sessions, users, page view per sessions, average time on page, conversions, date period, goals completion and top acquisition channels. Find a pre designed and impeccable Ad Word Marketing Campaign Management Dashboard Designs PDF. The templates can ace your presentation without additional effort. You can download these easy to edit presentation templates to make your presentation stand out from others. So, what are you waiting for Download the template from Slidegeeks today and give a unique touch to your presentation.

Deploying And Managing Recurring Recurring Revenue Dashboard Designs PDF
The following slide display recurring revenue generated over the year, the following dashboard displays MRR, churn rate net recurring revenue and growth rate. Make sure to capture your audiences attention in your business displays with our gratis customizable Deploying And Managing Recurring Recurring Revenue Dashboard Designs PDF. These are great for business strategies, office conferences, capital raising or task suggestions. If you desire to acquire more customers for your tech business and ensure they stay satisfied, create your own sales presentation with these plain slides.

Saas Company Management Dashboard With Key Kpl Template PDF
The purpose of this slide is to showcase various metrics of SaaS company in the form of dashboard. The metrics could be, Paying customers, monthly recurring revenue MRR, customer acquisition cost CAC, etc. Showcasing this set of slides titled Saas Company Management Dashboard With Key Kpl Template PDF. The topics addressed in these templates are Monthly Recurring Revenue, Customer Acquisition Cost, Customer Lifetime Value, Average Revenue Per Unit. All the content presented in this PPT design is completely editable. Download it and make adjustments in color, background, font etc. as per your unique business setting.
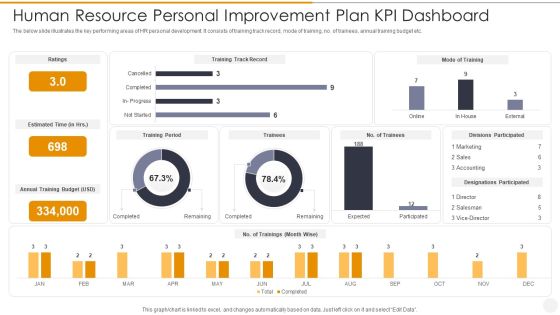
Human Resource Personal Improvement Plan Kpi Dashboard Topics PDF
The below slide illustrates the key performing areas of HR personal development. It consists of training track record, mode of training, no. of trainees, annual training budget etc. Showcasing this set of slides titled Human Resource Personal Improvement Plan Kpi Dashboard Topics PDF. The topics addressed in these templates are Sales, Marketing, Accounting. All the content presented in this PPT design is completely editable. Download it and make adjustments in color, background, font etc. as per your unique business setting.

Supply Chain Strategic Planning Dashboard Showing Shipping Status Structure PDF
This slide showcase supply chain planning dashboard showing shipping status which includes orders, present data, worldwide financial levels, monthly key performance indicators KPIs, etc. This can be beneficial for order management department for efficient delivery of products. Showcasing this set of slides titled Supply Chain Strategic Planning Dashboard Showing Shipping Status Structure PDF. The topics addressed in these templates are Worldwide Financial Levels, Present Data, Customer. All the content presented in this PPT design is completely editable. Download it and make adjustments in color, background, font etc. as per your unique business setting.

Logistics KPI Carrier Management Dashboard For Ecommerce Company Microsoft PDF
The following slide highlights the transportation carrier management dashboard for Ecommerce company depicting vehicle status, yearly cost, maintenance cost, cost breakdown, vehicle life span, empty miles and insurance by vehicle type. Pitch your topic with ease and precision using this Logistics KPI Carrier Management Dashboard For Ecommerce Company Microsoft PDF. This layout presents information on Mini Trucks, 13 Trailers, Empty Miles, Vehicle Life Span. It is also available for immediate download and adjustment. So, changes can be made in the color, design, graphics or any other component to create a unique layout.

Marketing Dashboard To Track Marketing Progress Ppt Tips PDF
This slide represents dashboard to track marketing campaign progress. It includes advertisement costs , total clicks, click-through rate, conversion rate, cost per thousand impression etc. Pitch your topic with ease and precision using this Marketing Dashboard To Track Marketing Progress Ppt Tips PDF. This layout presents information on Total Clicks, Total Impression, Total Conversion Rate, Cost Per Click. It is also available for immediate download and adjustment. So, changes can be made in the color, design, graphics or any other component to create a unique layout.
Google Adwords Strategic Campaign Performance Tracking Dashboard Icons PDF
This slide showcases KPI dashboard for real time tracking of performance metrics for google adwords campaign. It includes elements such as cost interactions, impressions, device, etc. Showcasing this set of slides titled Google Adwords Strategic Campaign Performance Tracking Dashboard Icons PDF. The topics addressed in these templates are Campaign Performance Device, Interaction Rate Cost Device, Daily Cost Device. All the content presented in this PPT design is completely editable. Download it and make adjustments in color, background, font etc. as per your unique business setting.

Energy Monitoring Dashboard With Emission Rate Mockup PDF
The slide showcases energy monitoring dashboard which showcases the monthly energy consumption and emission rate of a facility. It covers cost predicted, change in cost, usage estimate, energy intensity and carbon footprint or emission rate. Pitch your topic with ease and precision using this Energy Monitoring Dashboard With Emission Rate Mockup PDF. This layout presents information on Active Appliances, Cost Predicted, Energy Intensity. It is also available for immediate download and adjustment. So, changes can be made in the color, design, graphics or any other component to create a unique layout.
Global Medicare Outpatients Inpatients Kpi Dashboard Template PDF
This slide shows global healthcare KPIs related to outpatients-inpatients through dashboard. It include Key performance indicators such as average global patients, average treatment cost etc. Pitch your topic with ease and precision using this Global Medicare Outpatients Inpatients Kpi Dashboard Template PDF. This layout presents information on Average Treatment Cost, Average Global Patients, Average Available Staff. It is also available for immediate download and adjustment. So, changes can be made in the color, design, graphics or any other component to create a unique layout.

Marketing And Operations Dashboard For Distribution Company Guidelines PDF
This slide covers sales and operations dashboard for distribution company. It involves details such as total sales by location, gross margin, monthly sales trends, average revenue and sales by major customers. Pitch your topic with ease and precision using this Marketing And Operations Dashboard For Distribution Company Guidelines PDF. This layout presents information on Gross Margin, Actual Vs Budget, Product. It is also available for immediate download and adjustment. So, changes can be made in the color, design, graphics or any other component to create a unique layout.

Dashboard To Track Several Projects Performance By Firm Template PDF
This slide provides information regarding the dashboard which will help team in tracking different activities associated to multiple projects by monitoring resources, tasks status, bugs and features closed, etc. Do you have an important presentation coming up Are you looking for something that will make your presentation stand out from the rest Look no further than Dashboard To Track Several Projects Performance By Firm Template PDF. With our professional designs, you can trust that your presentation will pop and make delivering it a smooth process. And with Slidegeeks, you can trust that your presentation will be unique and memorable. So why wait Grab Dashboard To Track Several Projects Performance By Firm Template PDF today and make your presentation stand out from the rest.
Performance Kpi Dashboard For Project Tracking And Control Pictures PDF
This slide covers project monitoring and control dashboard which can be used by PM. It provides information about metrics such as project health, actual budget, at risk project, start and finish date of the project. Showcasing this set of slides titled Performance Kpi Dashboard For Project Tracking And Control Pictures PDF. The topics addressed in these templates are Finance, Customer Support, Business Development. All the content presented in this PPT design is completely editable. Download it and make adjustments in color, background, font etc. as per your unique business setting.

Advertising And Marketing Campaign Strategy Success Communication Dashboard Inspiration PDF
This slide depicts a multi channel dashboard for tracking advertising and marketing campaign plan success which provides real time data to track the performance of marketing efforts. The various key performing indicators are cost, conversions and channel performance Showcasing this set of slides titled Advertising And Marketing Campaign Strategy Success Communication Dashboard Inspiration PDF. The topics addressed in these templates are Conversions, Spend, Channel. All the content presented in this PPT design is completely editable. Download it and make adjustments in color, background, font etc. as per your unique business setting.

DSS Software Program Augmented Intelligence Information Tracking Dashboard Background PDF
This slide depicts the information tracking dashboard by augmented intelligence model covering the data analysis. Data analysis includes image analysis, storage size, new users on the cloud platform, etc. Do you have to make sure that everyone on your team knows about any specific topic I yes, then you should give DSS Software Program Augmented Intelligence Information Tracking Dashboard Background PDF a try. Our experts have put a lot of knowledge and effort into creating this impeccable DSS Software Program Augmented Intelligence Information Tracking Dashboard Background PDF. You can use this template for your upcoming presentations, as the slides are perfect to represent even the tiniest detail. You can download these templates from the Slidegeeks website and these are easy to edit. So grab these today.

CRM Dashboard For Tracking Sales Pipeline Brochure PDF
This slide covers the CRM KPI dashboard for monitoring lead status in the sales funnel. It includes metrics such as open pipeline value, open pipeline by product package, pipeline value forecast, etc. Crafting an eye catching presentation has never been more straightforward. Let your presentation shine with this tasteful yet straightforward CRM Dashboard For Tracking Sales Pipeline Brochure PDF template. It offers a minimalistic and classy look that is great for making a statement. The colors have been employed intelligently to add a bit of playfulness while still remaining professional. Construct the ideal CRM Dashboard For Tracking Sales Pipeline Brochure PDF that effortlessly grabs the attention of your audience Begin now and be certain to wow your customers.

Dashboard Analytics Of Real Time Website Traffic Data Information PDF
The slide showcases a real time dashboard used to analyse, track, and report on the website traffic data in real time with the help of interactive data visualizations. It covers latest data sources, latest devices, views per minute, views per second, latest locations and latest website visitors. Showcasing this set of slides titled Dashboard Analytics Of Real Time Website Traffic Data Information PDF. The topics addressed in these templates are Latest Data Sources, Latest Devices, Views Per Second. All the content presented in this PPT design is completely editable. Download it and make adjustments in color, background, font etc. as per your unique business setting.
Employee Performance Tracking And Management Dashboard Ideas PDF
This slide showcases a dashboard presenting various metrics to measure and analyze employee overall performance. It outlines information about average absenteeism rate, yearly average overtime hours, training costs and overall labor effectiveness. Do you have an important presentation coming up Are you looking for something that will make your presentation stand out from the rest Look no further than Employee Performance Tracking And Management Dashboard Ideas PDF. With our professional designs, you can trust that your presentation will pop and make delivering it a smooth process. And with Slidegeeks, you can trust that your presentation will be unique and memorable. So why wait Grab Employee Performance Tracking And Management Dashboard Ideas PDF today and make your presentation stand out from the rest.

Project Metrics Dashboard With Overall Progress Brochure PDF
This slide covers the project management dashboard which includes risks, overdue tasks, employees over budget, workloads, planning, designing, development and testing with current target amount, launch date, usage of targeted amount, etc. Pitch your topic with ease and precision using this Project Metrics Dashboard With Overall Progress Brochure PDF. This layout presents information on Design, Planning, Development. It is also available for immediate download and adjustment. So, changes can be made in the color, design, graphics or any other component to create a unique layout.

Cloud Data Transformation Dashboard For Application Analytics Information PDF
This slide shows data migration best practices dashboard for application analytics. It includes information about software as a service applications, app workload analysis, migration details, document, business unit. Pitch your topic with ease and precision using this Cloud Data Transformation Dashboard For Application Analytics Information PDF. This layout presents information on Software Service Applications, App Workload Analysis, Migration Details. It is also available for immediate download and adjustment. So, changes can be made in the color, design, graphics or any other component to create a unique layout.

Sales Work Action Plan Analysis Dashboard Brochure PDF
This slide covers the dashboard for analyzing the sales plan implemented in an organization. The purpose of this template is to assess strategical and operational aspects of the company. It includes key performance indicators such as number of sales, revenue, profit, cost, etc. Showcasing this set of slides titled Sales Work Action Plan Analysis Dashboard Brochure PDF. The topics addressed in these templates are Sales Revenue, Cost Breakdown, Accumulated Revenue. All the content presented in this PPT design is completely editable. Download it and make adjustments in color, background, font etc. as per your unique business setting.

Automated Dashboard To Track Status Of Order Request Themes PDF
The following slide highlights automated dashboard which can be used to track the status of pleased orders, and manage the inventory across various outlets. The key performance indicators are order, summary, inventory, summary, cost of goods sold, financial statement. Showcasing this set of slides titled Automated Dashboard To Track Status Of Order Request Themes PDF. The topics addressed in these templates are Inventory Value, Inventory Summary, Cost. All the content presented in this PPT design is completely editable. Download it and make adjustments in color, background, font etc. as per your unique business setting.

Project Management Plan Dashboard With Overdue Tasks Slides PDF
This slide represents the project plan dashboard which is useful to analyse the effectiveness of the project with the help of multiple parameters such as- budget, workload, launch date and upcoming deadlines. Showcasing this set of slides titled Project Management Plan Dashboard With Overdue Tasks Slides PDF. The topics addressed in these templates are Development, Design, Planning. All the content presented in this PPT design is completely editable. Download it and make adjustments in color, background, font etc. as per your unique business setting.

Dashboard Showcasing Project Management And Service Delivery Status Demonstration PDF
This slide represents dashboard which shows project management with delivery status that helps track progress and drive efficiency. It provides information regarding project budget, overdue tasks and delivery dates. Showcasing this set of slides titled Dashboard Showcasing Project Management And Service Delivery Status Demonstration PDF. The topics addressed in these templates are Planning Phase, Product Designing, Development Stage, Inspection. All the content presented in this PPT design is completely editable. Download it and make adjustments in color, background, font etc. as per your unique business setting.
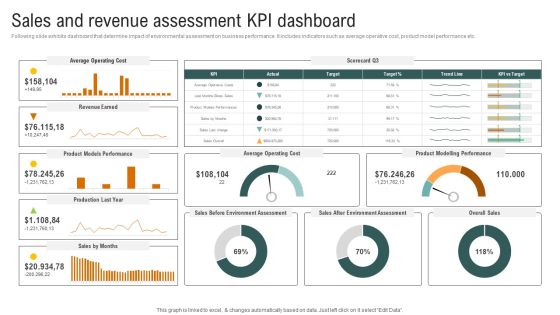
Sales And Revenue Assessment Kpi Dashboard Brochure PDF
Following slide exhibits dashboard that determine impact of environmental assessment on business performance. It includes indicators such as average operative cost, product model performance etc. If your project calls for a presentation, then Slidegeeks is your go-to partner because we have professionally designed, easy-to-edit templates that are perfect for any presentation. After downloading, you can easily edit Sales And Revenue Assessment Kpi Dashboard Brochure PDF and make the changes accordingly. You can rearrange slides or fill them with different images. Check out all the handy templates

Customer Service Measurement KPI Dashboard Ppt Infographics Themes PDF
Mentioned slide portrays customer service measurement KPI dashboard that includes metrics namely request volume vs. service level, customer satisfaction, customer retention, costs per support and average time to solve issue. If your project calls for a presentation, then Slidegeeks is your go-to partner because we have professionally designed, easy-to-edit templates that are perfect for any presentation. After downloading, you can easily edit Customer Service Measurement KPI Dashboard Ppt Infographics Themes PDF and make the changes accordingly. You can rearrange slides or fill them with different images. Check out all the handy templates
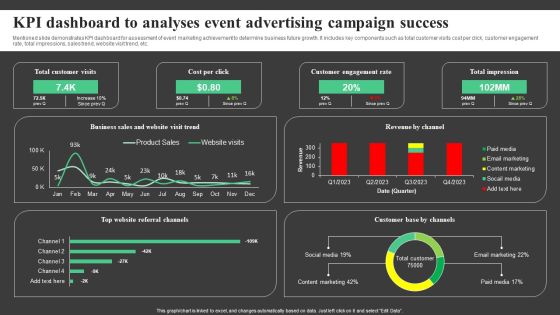
KPI Dashboard To Analyses Event Advertising Campaign Success Topics PDF
Mentioned slide demonstrates KPI dashboard for assessment of event marketing achievement to determine business future growth. It includes key components such as total customer visits cost per click, customer engagement rate, total impressions, sales trend, website visit trend, etc. Showcasing this set of slides titled KPI Dashboard To Analyses Event Advertising Campaign Success Topics PDF. The topics addressed in these templates are Total Customer Visits, Cost Per Click, Customer Engagement Rate . All the content presented in this PPT design is completely editable. Download it and make adjustments in color, background, font etc. as per your unique business setting.

Dashboard For Hiring Data Analysis By Recruitment Team Formats PDF
The slide highlights the dashboard for hiring data analysis by recruitment team depicting of open job positions, jobs approved, candidates in recruitment pipeline and job assigned to team.Pitch your topic with ease and precision using this Dashboard For Hiring Data Analysis By Recruitment Team Formats PDF This layout presents information on Candidates Recruitment, Marketing Communication, Approved It is also available for immediate download and adjustment. So, changes can be made in the color, design, graphics or any other component to create a unique layout.
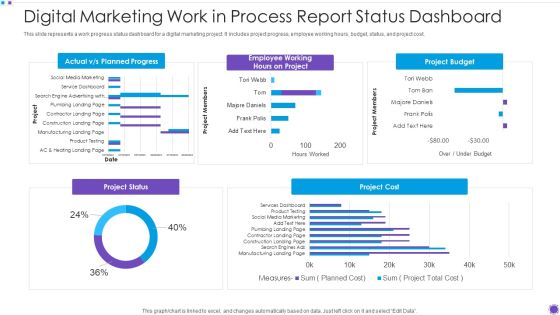
Digital Marketing Work In Process Report Status Dashboard Background PDF
Showcasing this set of slides titled digital marketing work in process report status dashboard background pdf. The topics addressed in these templates are project budget, planned, project cost. All the content presented in this PPT design is completely editable. Download it and make adjustments in color, background, font etc. as per your unique business setting.

Customer Service Metrics Dashboard With Customer Retention Rate Icons PDF
This slide showcases KPIs dashboard for customer service that can help organization to track the consumer satisfaction score and improve product or service by improving customer loyalty. Its key components are net promoter score, customer retention and support costs. Showcasing this set of slides titled Customer Service Metrics Dashboard With Customer Retention Rate Icons PDF. The topics addressed in these templates are Customer Retention, Net Promoter Score, Service Level. All the content presented in this PPT design is completely editable. Download it and make adjustments in color, background, font etc. as per your unique business setting.

Dashboard For Tracking Logistics Management Strategy Results Ideas PDF
This slide covers a dashboard for tracking the logistics operations KPIs. It includes metrics such as warehousing operating cost, perfect order rate, total shipments by areas, on time shipments, etc. Pitch your topic with ease and precision using this dashboard for tracking logistics management strategy results ideas pdf. This layout presents information on cost, warehouse, rate. It is also available for immediate download and adjustment. So, changes can be made in the color, design, graphics or any other component to create a unique layout.
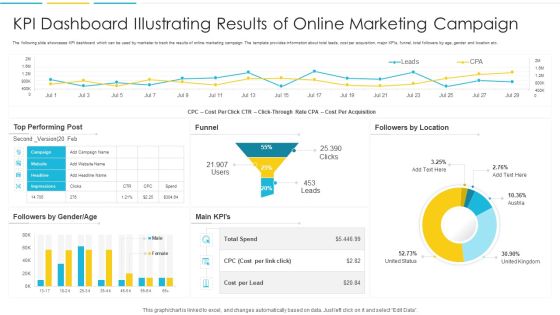
KPI Dashboard Illustrating Results Of Online Marketing Campaign Slides PDF
The following slide showcases KPI dashboard which can be used by marketer to track the results of online marketing campaign. The template provides information about total leads, cost per acquisition, major KPIs, funnel, total followers by age, gender and location etc. Showcasing this set of slides titled KPI Dashboard Illustrating Results Of Online Marketing Campaign Slides PDF. The topics addressed in these templates are Cost, Location, Performing. All the content presented in this PPT design is completely editable. Download it and make adjustments in color, background, font etc. as per your unique business setting

Departmental Operations Training Department Program Status Dashboard Mockup PDF
This slide covers employees training status dashboard for HR manager. It includes KPIs such as training cost, cost per participant, training type, number of participants, training hours, occupancy rates, etc. Showcasing this set of slides titled Departmental Operations Training Department Program Status Dashboard Mockup PDF. The topics addressed in these templates are Number Of Participants, Hours Of Training, Total Completed Training. All the content presented in this PPT design is completely editable. Download it and make adjustments in color, background, font etc. as per your unique business setting.

Competitive Procurement Pricing Benchmarks Analysis Dashboard Graphics PDF
This slide shows the dashboard representing the procurement price benchmarking comparative analysis report. It shows information related to quality KPIs, return cost analysis, supplier quality range and project analysis. Showcasing this set of slides titled Competitive Procurement Pricing Benchmarks Analysis Dashboard Graphics PDF. The topics addressed in these templates are Return Cost Analysis, Project Analysis, Supplier Quality Rating. All the content presented in this PPT design is completely editable. Download it and make adjustments in color, background, font etc. as per your unique business setting.

Cyber Security Key Performance Indicators Metrics Dashboard Mockup PDF
This slide covers cyber security health status dashboard . It also includes audit and compliance, controls health, project status, incident response process, vulnerability patching schedule, investigation process and training compliance. Pitch your topic with ease and precision using this Cyber Security Key Performance Indicators Metrics Dashboard Mockup PDF. This layout presents information on Cyber Security, Vulnerability Patching Schedule, Compliance Investigation Process. It is also available for immediate download and adjustment. So, changes can be made in the color, design, graphics or any other component to create a unique layout.
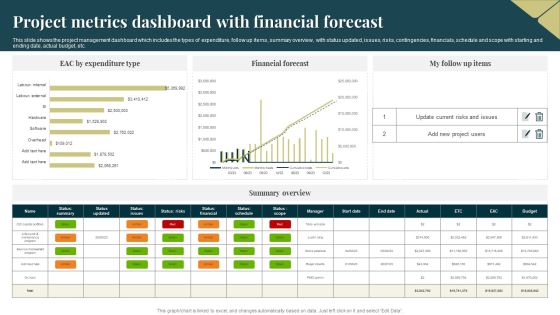
Project Metrics Dashboard With Financial Forecast Professional PDF
This slide shows the project management dashboard which includes the types of expenditure, follow up items, summary overview, with status updated, issues, risks, contingencies, financials, schedule and scope with starting and ending date, actual budget, etc. Showcasing this set of slides titled Project Metrics Dashboard With Financial Forecast Professional PDF. The topics addressed in these templates are Expenditure, Financial Forecast, Risks. All the content presented in this PPT design is completely editable. Download it and make adjustments in color, background, font etc. as per your unique business setting.
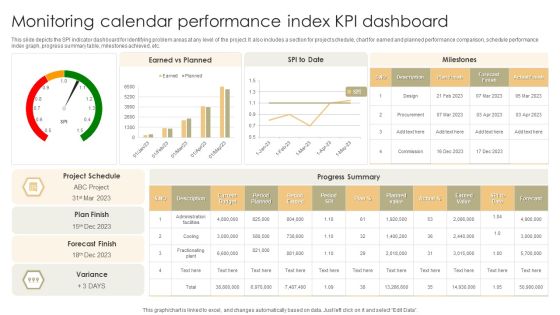
Monitoring Calendar Performance Index KPI Dashboard Slides PDF
This slide depicts the SPI indicator dashboard for identifying problem areas at any level of the project. It also includes a section for project schedule, chart for earned and planned performance comparison, schedule performance index graph, progress summary table, milestones achieved, etc. Pitch your topic with ease and precision using this Monitoring Calendar Performance Index KPI Dashboard Slides PDF. This layout presents information on Current Budget, Planned Value, Earned Value. It is also available for immediate download and adjustment. So, changes can be made in the color, design, graphics or any other component to create a unique layout.
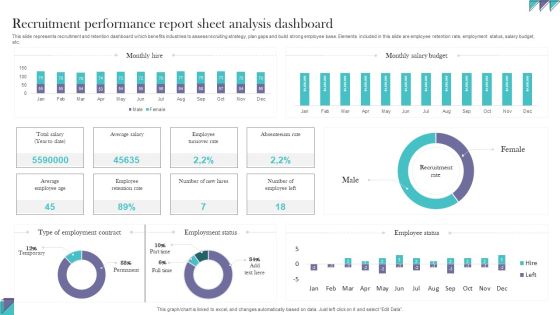
Recruitment Performance Report Sheet Analysis Dashboard Information PDF
This slide represents recruitment and retention dashboard which benefits industries to assess recruiting strategy, plan gaps and build strong employee base. Elements included in this slide are employee retention rate, employment status, salary budget, etc. Pitch your topic with ease and precision using this Recruitment Performance Report Sheet Analysis Dashboard Information PDF. This layout presents information onRecruitment Performance, Report Sheet Analysis. It is also available for immediate download and adjustment. So, changes can be made in the color, design, graphics or any other component to create a unique layout.
