Investment Performance
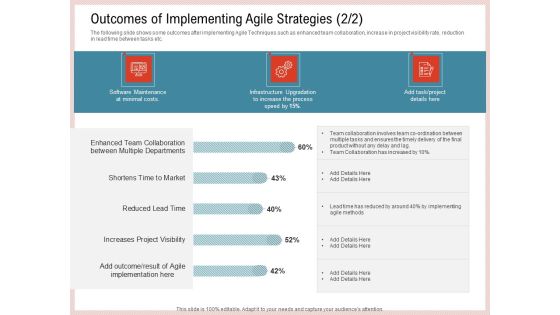
Agile Model Improve Task Team Performance Outcomes Of Implementing Agile Strategies Details Formats PDF
The following slide shows some outcomes after implementing Agile Techniques such as enhanced team collaboration, increase in project visibility rate, reduction in lead time between tasks etc. Deliver and pitch your topic in the best possible manner with this agile model improve task team performance outcomes of implementing agile strategies details formats pdf. Use them to share invaluable insights on team collaboration, implementing, software maintenance and impress your audience. This template can be altered and modified as per your expectations. So, grab it now.

Team Performance Improvement Functional Optimization Through Agile Methodologies Most Commonly Used Agile Methods Worldwide Mockup PDF
This slide shows Agile Methods that are most commonly used around the globe such as Scrum, Custom Hybrid, Kanban, Iterative Development, Lean development etc. Mostly used method is the Scrum. Deliver and pitch your topic in the best possible manner with this team performance improvement functional optimization through agile methodologies most commonly used agile methods worldwide mockup pdf. Use them to share invaluable insights on iterative development, lean development, most commonly used agile methods worldwide and impress your audience. This template can be altered and modified as per your expectations. So, grab it now.

Shareholder Governance Enhance Comprehensive Corporate Performance Shareholder Information Dividend Introduction PDF
This slide shows the shareholder information of the company that provides information on shareholding sizes and geographical concentration. Also, this slide provides information on the dividend criteria of the company. Deliver and pitch your topic in the best possible manner with this shareholder governance enhance comprehensive corporate performance shareholder information dividend introduction pdf. Use them to share invaluable insights on shareholding, concentration, comparison, payment, progressive and impress your audience. This template can be altered and modified as per your expectations. So, grab it now.
Skill Development Training To Strengthen Employee Performance Employee Efficiency Graph For The Five Years Icons PDF
This slide shows the five- year graph of average production per employee in tonne and employee efficiency in percentage along with the key insights. Deliver and pitch your topic in the best possible manner with this skill development training to strengthen employee performance employee efficiency graph for the five years icons pdf. Use them to share invaluable insights on employee efficiency graph for the five years and impress your audience. This template can be altered and modified as per your expectations. So, grab it now.
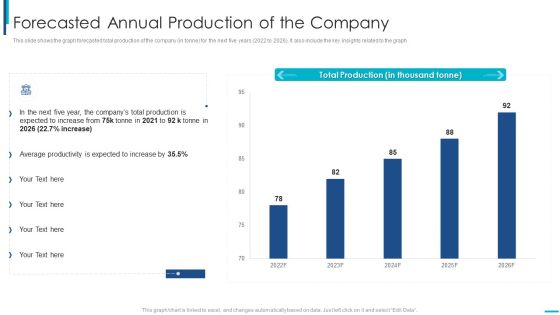
Skill Development Training To Strengthen Employee Performance Forecasted Annual Production Of The Company Brochure PDF
This slide shows the graph forecasted total production of the company in tonne for the next five years 2022 to 2026, It also include the key insights related to the graph. Deliver an awe inspiring pitch with this creative skill development training to strengthen employee performance forecasted annual production of the company brochure pdf bundle. Topics like forecasted annual production of the company can be discussed with this completely editable template. It is available for immediate download depending on the needs and requirements of the user.

Upskill Training For Employee Performance Improvement Employee Efficiency Graph For The Five Years Summary PDF
This slide shows the five- year graph of average production per employee in tonne and employee efficiency in percentage along with the key insights. Deliver and pitch your topic in the best possible manner with this upskill training for employee performance improvement employee efficiency graph for the five years summary pdf. Use them to share invaluable insights on employee efficiency graph for the five years and impress your audience. This template can be altered and modified as per your expectations. So, grab it now.

Upskill Training For Employee Performance Improvement Forecasted Annual Production Of The Company Formats PDF
This slide shows the graph forecasted total production of the company in tonne for the next five years 2022 to 2026, It also include the key insights related to the graph. Deliver an awe inspiring pitch with this creative upskill training for employee performance improvement forecasted annual production of the company formats pdf bundle. Topics like forecasted annual production of the company can be discussed with this completely editable template. It is available for immediate download depending on the needs and requirements of the user.

Upskill Training For Employee Performance Improvement Forecasted Employee Efficiency And Average Productivity Mockup PDF
This slide shows the forecasted data of average production per employee in tonne and employee efficiency in percentage for the next five years 2022 to 2026. Deliver and pitch your topic in the best possible manner with this upskill training for employee performance improvement forecasted employee efficiency and average productivity mockup pdf. Use them to share invaluable insights on forecasted employee efficiency and average productivity and impress your audience. This template can be altered and modified as per your expectations. So, grab it now.

Building Promotional Campaign Real Estate Sales Real Estate Dashboard To Monitor Sales Team Performance Guidelines PDF
This slide portrays property management dashboard with KPIs namely, average days on market, properties for sale, properties for rent, sales vs. target and sales by region. Deliver and pitch your topic in the best possible manner with this building promotional campaign real estate sales real estate dashboard to monitor sales team performance guidelines pdf. Use them to share invaluable insights on property management kpi dashboard and impress your audience. This template can be altered and modified as per your expectations. So, grab it now.
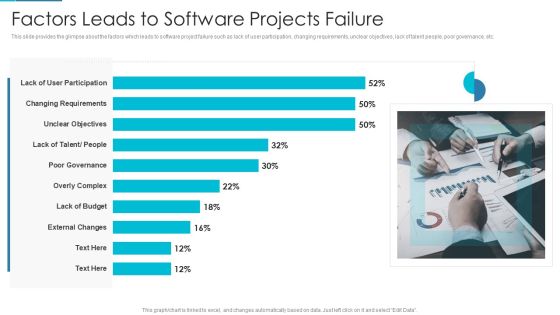
Project Management Outline For Schedule Performance Index Factors Leads To Software Projects Failure Download PDF
This slide provides the glimpse about the factors which leads to software project failure such as lack of user participation, changing requirements, unclear objectives, lack of talent people, poor governance, etc. Deliver and pitch your topic in the best possible manner with this project management outline for schedule performance index factors leads to software projects failure download pdf. Use them to share invaluable insights on lack of user participation, changing requirements, unclear objectives, lack of talent people, poor governance and impress your audience. This template can be altered and modified as per your expectations. So, grab it now.

Performance Analysis Of New Product Development Analyzing The Our Competitors In The Market Download PDF
The following slide displays the competitive analysis of the market as it highlights the various competitors of the market and sales figures, the provided also displays market share of the market of multiple competitors. Deliver an awe inspiring pitch with this creative performance analysis of new product development analyzing the our competitors in the market download pdf bundle. Topics like analyzing the our competitors in the market can be discussed with this completely editable template. It is available for immediate download depending on the needs and requirements of the user.

Performance Analysis Of New Product Development Customer Retention Rate Of The Product Download PDF
Purpose of the following slide is to show the customer retention rate of the product as the provided graph displays the retention rate over the months along with the key takeaways. Deliver and pitch your topic in the best possible manner with this performance analysis of new product development customer retention rate of the product download pdf. Use them to share invaluable insights on customer retention rate of the product and impress your audience. This template can be altered and modified as per your expectations. So, grab it now.

Performance Analysis Of New Product Development Product Sales Vs Product Return Infographics PDF
Purpose of the following slide is to show the product sales vs. product return ratio of the organization, the provided graph displays the sales of the product in each month in comparison to the returns. Deliver an awe inspiring pitch with this creative performance analysis of new product development product sales vs product return infographics pdf bundle. Topics like comparison, sales, returns can be discussed with this completely editable template. It is available for immediate download depending on the needs and requirements of the user.
Performance Analysis Of New Product Development Total Number Of Units Sold By The Product Icons PDF
The following slide displays the total number of units sold by the organization, the provided bar graph displays the various months and total units in million sold in each. Deliver an awe inspiring pitch with this creative performance analysis of new product development total number of units sold by the product icons pdf bundle. Topics like total number of units sold by the product can be discussed with this completely editable template. It is available for immediate download depending on the needs and requirements of the user.
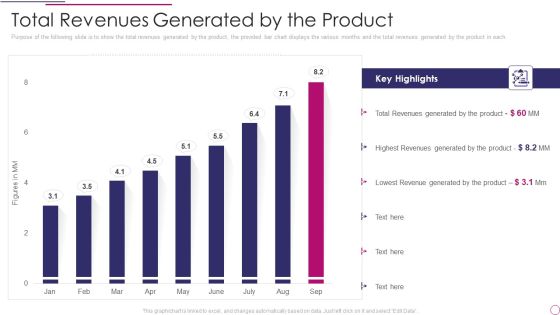
Performance Analysis Of New Product Development Total Revenues Generated By The Product Microsoft PDF
Purpose of the following slide is to show the total revenues generated by the product, the provided bar chart displays the various months and the total revenues generated by the product in each. Deliver and pitch your topic in the best possible manner with this performance analysis of new product development total revenues generated by the product microsoft pdf. Use them to share invaluable insights on total revenues generated by the product and impress your audience. This template can be altered and modified as per your expectations. So, grab it now.
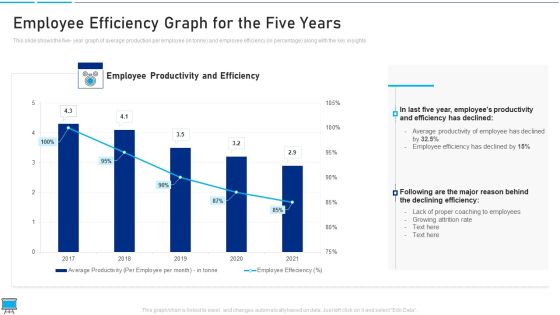
Performance Training Action Plan And Extensive Strategies Employee Efficiency Graph For The Five Years Guidelines PDF
This slide shows the five year graph of average production per employee in tonne and employee efficiency in percentage along with the key insights Deliver and pitch your topic in the best possible manner with this performance training action plan and extensive strategies employee efficiency graph for the five years guidelines pdf Use them to share invaluable insights on declining efficiency, proper coaching to employees, employee efficiency and impress your audience. This template can be altered and modified as per your expectations. So, grab it now.

Performance Training Action Plan And Extensive Strategies Forecasted Annual Production Of The Company Demonstration PDF
This slide shows the graph forecasted total production of the company in tonne for the next five years 2022 to 2026, It also include the key insights related to the graph Deliver and pitch your topic in the best possible manner with this performance training action plan and extensive strategies forecasted annual production of the company demonstration pdf Use them to share invaluable insights on forecasted annual production of the company and impress your audience. This template can be altered and modified as per your expectations. So, grab it now.

Computerized Game Pitch Deck Various Metrics Determining Video Game Platform Performance Information PDF
This slide caters details about various metrics portraying video game platform progress in terms of rise in subscribers, rise in average revenue per user, and overall revenue. Deliver an awe inspiring pitch with this creative computerized game pitch deck various metrics determining video game platform performance information pdf bundle. Topics like rise in subscribers, rise in average revenue per user, rise in overall revenue can be discussed with this completely editable template. It is available for immediate download depending on the needs and requirements of the user.

Online Gaming Fundraising Pitch Deck Various Metrics Determining Video Game Platform Performance Structure PDF
This slide caters details about various metrics portraying video game platform progress in terms of rise in subscribers, rise in average revenue per user, and overall revenue. Deliver an awe inspiring pitch with this creative online gaming fundraising pitch deck various metrics determining video game platform performance structure pdf bundle. Topics like rise in subscribers, rise in average revenue per user, rise in overall revenue can be discussed with this completely editable template. It is available for immediate download depending on the needs and requirements of the user.

Organizational Program To Improve Team Productivity And Efficiency Team Performance Clipart PDF
This slide seeks to accurately identify levels of present situations using various methods such as interviews, focus group, observations etc. Here we have selected observation method for data collection regarding employees for further Assessment.Deliver an awe inspiring pitch with this creative organizational program to improve team productivity and efficiency team performance clipart pdf bundle. Topics like communication gaps, projects status, team conflicts status can be discussed with this completely editable template. It is available for immediate download depending on the needs and requirements of the user.

Process Optimization Through Product Life Process Management Techniques Team Performance Clipart PDF
This slide seeks to accurately identify levels of present situations using various methods such as interviews, focus group, observations etc. Here we have selected observation method for data collection regarding employees for further Assessment.Deliver an awe inspiring pitch with this creative process optimization through product life process management techniques team performance clipart pdf bundle. Topics like leadership skills status, communication gaps, team conflicts status can be discussed with this completely editable template. It is available for immediate download depending on the needs and requirements of the user.
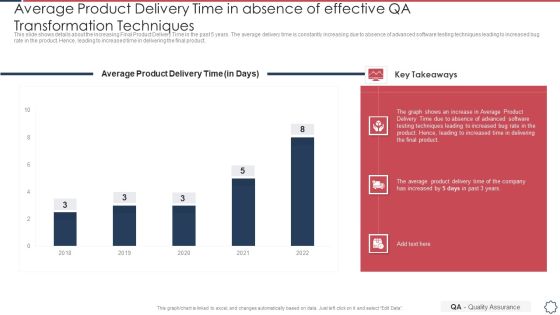
Quality Assurance Transformation Strategies To Improve Business Performance Efficiency Average Product Delivery Background PDF
This slide shows details about the increasing Final Product Delivery Time in the past 5 years. The average delivery time is constantly increasing due to absence of advanced software testing techniques leading to increased bug rate in the product. Hence, leading to increased time in delivering the final product. Deliver and pitch your topic in the best possible manner with this quality assurance transformation strategies to improve business performance efficiency average product delivery background pdf. Use them to share invaluable insights on product delivery time and impress your audience. This template can be altered and modified as per your expectations. So, grab it now.

Quality Assurance Transformation Strategies To Improve Business Performance Efficiency Current Active Defect Rate Clipart PDF
This slide shows details about the increasing Product Defect Rate in the past 5 years. The defect rate is constantly increasing due to absence of effective QA Transformation Techniques in the company. Deliver an awe inspiring pitch with this creative quality assurance transformation strategies to improve business performance efficiency current active defect rate clipart pdf bundle. Topics like current active defect rate in absence of effective qa transformation techniques can be discussed with this completely editable template. It is available for immediate download depending on the needs and requirements of the user.
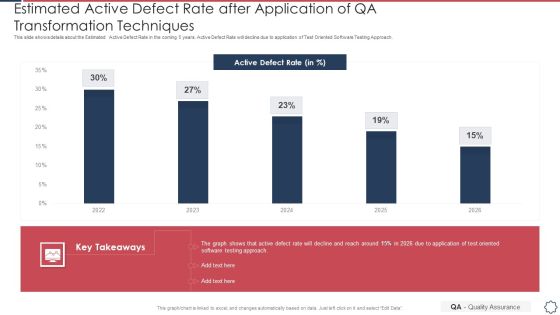
Quality Assurance Transformation Strategies To Improve Business Performance Efficiency Estimated Active Defect Rate Pictures PDF
This slide shows details about the Estimated Active Defect Rate in the coming 5 years. Active Defect Rate will decline due to application of Test Oriented Software Testing Approach. Deliver and pitch your topic in the best possible manner with this quality assurance transformation strategies to improve business performance efficiency estimated active defect rate pictures pdf. Use them to share invaluable insights on estimated active defect rate after application of qa transformation techniques and impress your audience. This template can be altered and modified as per your expectations. So, grab it now.
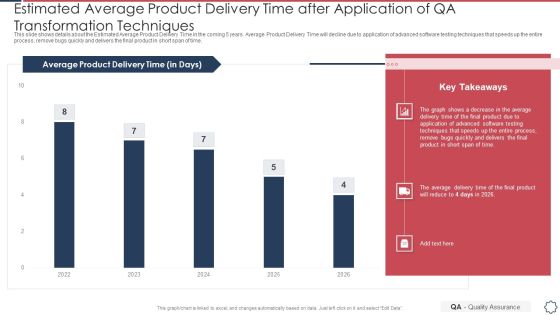
Quality Assurance Transformation Strategies To Improve Business Performance Efficiency Estimated Average Product Delivery Brochure PDF
This slide shows details about the Estimated Average Product Delivery Time in the coming 5 years. Average Product Delivery Time will decline due to application of advanced software testing techniques that speeds up the entire process, remove bugs quickly and delivers the final product in short span of time. Deliver an awe inspiring pitch with this creative quality assurance transformation strategies to improve business performance efficiency estimated average product delivery brochure pdf bundle. Topics like product delivery time can be discussed with this completely editable template. It is available for immediate download depending on the needs and requirements of the user.
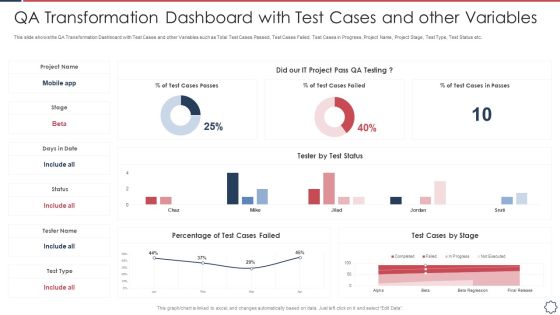
Quality Assurance Transformation Strategies To Improve Business Performance Efficiency QA Transformation Dashboard Inspiration PDF
This slide shows the QA Transformation Dashboard with Test Cases and other Variables such as Total Test Cases Passed, Test Cases Failed, Test Cases in Progress, Project Name, Project Stage, Test Type, Test Status etc. Deliver and pitch your topic in the best possible manner with this quality assurance transformation strategies to improve business performance efficiency qa transformation dashboard inspiration pdf. Use them to share invaluable insights on qa transformation dashboard with test cases and other variables and impress your audience. This template can be altered and modified as per your expectations. So, grab it now.

Multiplayer Gameplay System Venture Capitalist PPT Various Metrics Determining Video Game Platform Performance Infographics PDF
This slide caters details about various metrics portraying video game platform progress in terms of rise in subscribers, rise in average revenue per user, and overall revenue.Deliver an awe inspiring pitch with this creative multiplayer gameplay system venture capitalist ppt various metrics determining video game platform performance infographics pdf bundle. Topics like rise in subscribers, rise in average revenue, rise in overall revenue can be discussed with this completely editable template. It is available for immediate download depending on the needs and requirements of the user.

Debt Retrieval Techniques Our Key Performance Indicators For Balance Sheet Ppt Pictures Gallery PDF
Purpose of the following side is to display the major KPI for the balance sheet as it highlight the key components such as current asset, current liabilities, total assets and total liability of the organization for the financial year 2020 2021 Deliver and pitch your topic in the best possible manner with this debt retrieval techniques our key performance indicators for balance sheet ppt pictures gallery pdf. Use them to share invaluable insights on current assets, current liabilities, total assets, total liabilities and impress your audience. This template can be altered and modified as per your expectations. So, grab it now.

Debt Collection Improvement Plan Our Key Performance Indicators For Balance Sheet Professional PDF
Purpose of the following side is to display the major KPI for the balance sheet as it highlight the key components such as current asset, current liabilities, total assets and total liability of the organization for the financial year 2021 to 2022. Deliver and pitch your topic in the best possible manner with this debt collection improvement plan our key performance indicators for balance sheet professional pdf. Use them to share invaluable insights on current assets, current liabilities, total assets, total liabilities and impress your audience. This template can be altered and modified as per your expectations. So, grab it now.

Average Reduction In Injuries After Health And Safety Performance Measurements Check Template PDF
This slide covers the 7 year chart that is showing the number of injuries reduced during the timeframe by taking some measures or training employees on the usage of equipment they are using. Showcasing this set of slides titled Average Reduction In Injuries After Health And Safety Performance Measurements Check Template PDF The topics addressed in these templates are Employees Safety Measures, Workstation Ergonomics, Workplace Paying Attention All the content presented in this PPT design is completely editable. Download it and make adjustments in color, background, font etc. as per your unique business setting.

Health And Safety Performance Measurements Dashboard For Manufacturing Company Guidelines PDF
This slide covers the information related to the incidents that has happened during a year on a monthly basis due to not following safety measures. It also includes total number of incidents in a company, near incidents reported , etc. Showcasing this set of slides titled Health And Safety Performance Measurements Dashboard For Manufacturing Company Guidelines PDF The topics addressed in these templates are Incident Ackumulated , Incidents After Safety, Incidence Avoidance All the content presented in this PPT design is completely editable. Download it and make adjustments in color, background, font etc. as per your unique business setting.
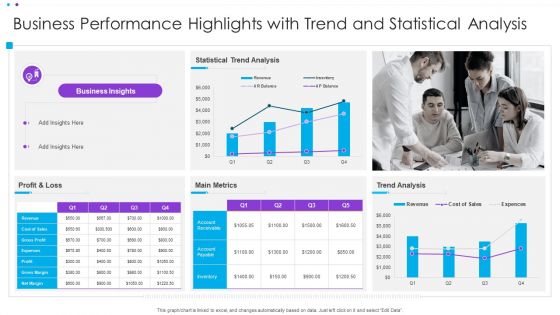
Business Performance Highlights With Trend And Statistical Analysis Ppt Infographic Template Display PDF
This graph or chart is linked to excel, and changes automatically based on data. Just left click on it and select Edit Data. Pitch your topic with ease and precision using this Business Performance Highlights With Trend And Statistical Analysis Ppt Infographic Template Display PDF. This layout presents information on Statistical Trend Analysis, Main Metrics, Profit And Loss. It is also available for immediate download and adjustment. So, changes can be made in the color, design, graphics or any other component to create a unique layout.

Yearly Product Performance Assessment Repor Analyzing The Our Competitors Portrait PDF
The following slide displays the competitive analysis of the market as it highlights the various competitors of the market and sales figures, the provided also displays market share of the market of multiple competitors.Deliver and pitch your topic in the best possible manner with this Yearly Product Performance Assessment Repor Analyzing The Our Competitors Portrait PDF Use them to share invaluable insights on Total Addressable, Serviceable Addressable, Obtainable Market and impress your audience. This template can be altered and modified as per your expectations. So, grab it now.
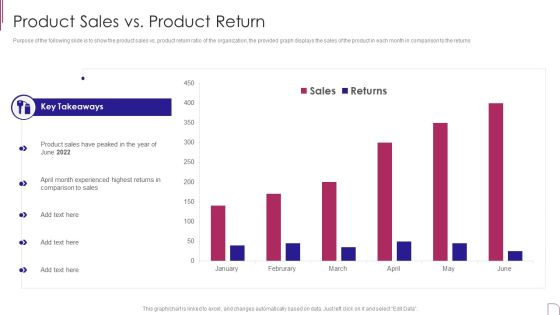
Yearly Product Performance Assessment Repor Product Sales Vs Product Return Information PDF
Purpose of the following slide is to show the product sales vs. product return ratio of the organization, the provided graph displays the sales of the product in each month in comparison to the returns.Deliver an awe inspiring pitch with this creative Yearly Product Performance Assessment Repor Product Sales Vs Product Return Information PDF bundle. Topics like Key Takeaways, Experienced Highest, Comparison Sales can be discussed with this completely editable template. It is available for immediate download depending on the needs and requirements of the user.
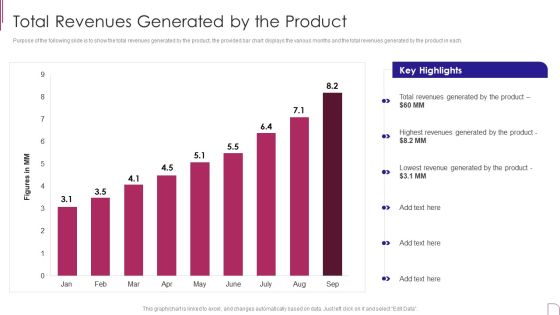
Yearly Product Performance Assessment Repor Total Revenues Generated By The Product Background PDF
Purpose of the following slide is to show the total revenues generated by the product, the provided bar chart displays the various months and the total revenues generated by the product in each. Deliver and pitch your topic in the best possible manner with this Yearly Product Performance Assessment Repor Total Revenues Generated By The Product Background PDF Use them to share invaluable insights on Key Highlights, Revenues Generated, Lowest Revenue and impress your audience. This template can be altered and modified as per your expectations. So, grab it now.

Techniques For Timely Project Project Management Dashboard To Evaluate Performance Summary PDF
This slide covers the project management dashboard which includes status of project phases such as planning, designing, development and testing that also focuses on launch date of project, overdue tasks with date, deadline, etc. and workload on employees. Deliver and pitch your topic in the best possible manner with this Techniques For Timely Project Project Management Dashboard To Evaluate Performance Summary PDF. Use them to share invaluable insights on Project Launch, Planning, Design, Development and impress your audience. This template can be altered and modified as per your expectations. So, grab it now.

Marketing Strategy For Shipping Business Key Performance Indicator Dashboard Graphics PDF
The following slide depicts the key areas in Marketing Strategy for Shipping Business to monitor and optimize supply chain processes. It includes elements such as fleet and shipment status, country wise revenue, location wise delivery, average shipment time etc.Pitch your topic with ease and precision using this Marketing Strategy For Shipping Business Key Performance Indicator Dashboard Graphics PDF. This layout presents information on Shipment Status, Average Shipment, Wise Revenue. It is also available for immediate download and adjustment. So, changes can be made in the color, design, graphics or any other component to create a unique layout.

Business Performance Review Report Showing Results Of Various Corporate Goals Guidelines PDF
The following slide highlights a comprehensive quarterly business review QBR report used to highlight the results of organizations goals. It provides information about goals such as software development, employee training, user interface UI customization, and employee appraisal. Showcasing this set of slides titled Business Performance Review Report Showing Results Of Various Corporate Goals Guidelines PDF. The topics addressed in these templates are Software Development, Employee Training, UI Customization, Employee Appraisal. All the content presented in this PPT design is completely editable. Download it and make adjustments in color, background, font etc. as per your unique business setting.
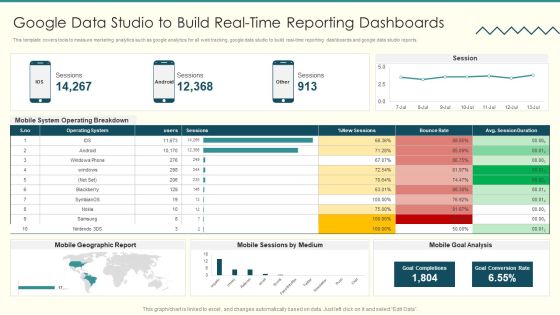
Security And Performance Digital Marketing Google Data Studio To Build Realtime Reporting Dashboards Information PDF
This template covers tools to measure marketing analytics such as google analytics for all web tracking, google data studio to build real time reporting dashboards and google data studio reports.Deliver an awe inspiring pitch with this creative Security And Performance Digital Marketing Google Data Studio To Build Realtime Reporting Dashboards Information PDF bundle. Topics like Operating Breakdown, Session Duration, Goal Completions can be discussed with this completely editable template. It is available for immediate download depending on the needs and requirements of the user.
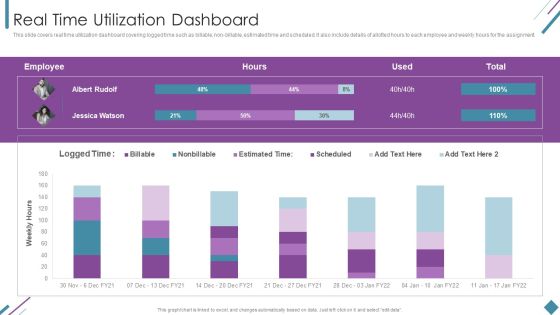
Metrics To Measure Business Performance Real Time Utilization Dashboard Topics PDF
This slide covers real time utilization dashboard covering logged time such as billable, non-billable, estimated time and scheduled. It also include details of allotted hours to each employee and weekly hours for the assignment. Deliver an awe inspiring pitch with this creative Metrics To Measure Business Performance Real Time Utilization Dashboard Topics PDF bundle. Topics like Weekly Hours, Employee, Estimated Time can be discussed with this completely editable template. It is available for immediate download depending on the needs and requirements of the user.
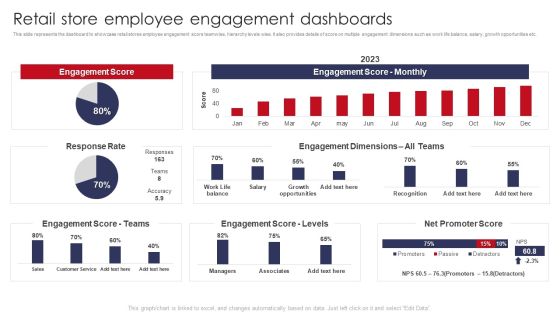
Retail Store Employee Engagement Dashboards Retail Outlet Operations Performance Evaluation Background PDF
This slide represents the dashboard to showcase retail stores employee engagement score teamwise, hierarchy levels wise. It also provides details of score on multiple engagement dimensions such as work life balance, salary, growth opportunities etc.Deliver an awe inspiring pitch with this creative Retail Store Employee Engagement Dashboards Retail Outlet Operations Performance Evaluation Background PDF bundle. Topics like Engagement Score, Engagement Dimensions, Score Teams can be discussed with this completely editable template. It is available for immediate download depending on the needs and requirements of the user.
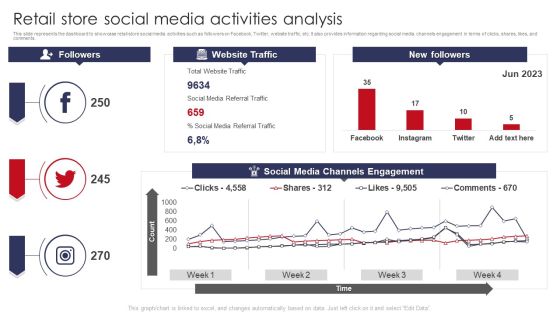
Retail Store Social Media Activities Analysis Retail Outlet Operations Performance Evaluation Slides PDF
This slide represents the dashboard to showcase retail store social media activities such as followers on Facebook, Twitter, website traffic, etc. It also provides information regarding social media channels engagement in terms of clicks, shares, likes, and comments.Deliver and pitch your topic in the best possible manner with this Retail Store Social Media Activities Analysis Retail Outlet Operations Performance Evaluation Slides PDF. Use them to share invaluable insights on Social Media, Referral Traffic, Channels Engagement and impress your audience. This template can be altered and modified as per your expectations. So, grab it now.
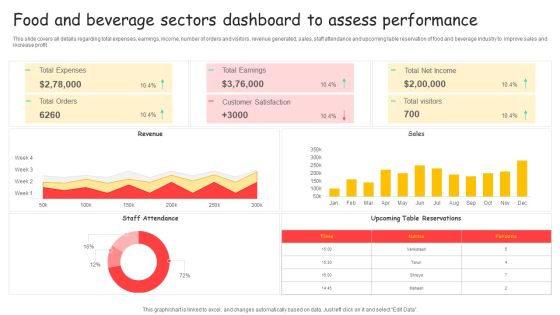
Food And Beverage Sectors Dashboard To Assess Performance Ppt Styles Elements PDF
This slide covers all details regarding total expenses, earnings, income, number of orders and visitors, revenue generated, sales, staff attendance and upcoming table reservation of food and beverage industry to improve sales and increase profit. Showcasing this set of slides titled Food And Beverage Sectors Dashboard To Assess Performance Ppt Styles Elements PDF. The topics addressed in these templates are Total Expenses, Total Earnings, Total Net Income. All the content presented in this PPT design is completely editable. Download it and make adjustments in color, background, font etc. as per your unique business setting.
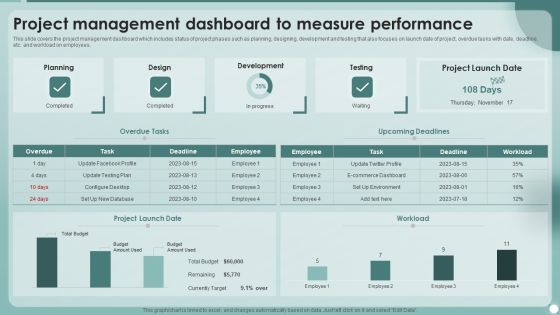
Strategies To Enhance Project Management Process Project Management Dashboard To Measure Performance Ideas PDF
This slide covers the project management dashboard which includes status of project phases such as planning, designing, development and testing that also focuses on launch date of project, overdue tasks with date, deadline, etc. and workload on employees. Deliver and pitch your topic in the best possible manner with this Strategies To Enhance Project Management Process Project Management Dashboard To Measure Performance Ideas PDF. Use them to share invaluable insights on Employee, Project Launch, Development, Design and impress your audience. This template can be altered and modified as per your expectations. So, grab it now.

Company Financial Performance Indicators Dashboard With Liquidity And Turnover Ratios Formats PDF
This graph or chart is linked to excel, and changes automatically based on data. Just left click on it and select Edit Data. Pitch your topic with ease and precision using this Company Financial Performance Indicators Dashboard With Liquidity And Turnover Ratios Formats PDF. This layout presents information on Cash Balance, Days Inventory Outstanding, Days Payable Outstanding. It is also available for immediate download and adjustment. So, changes can be made in the color, design, graphics or any other component to create a unique layout.

Analysis Of Average Wait Time At Retail Store Checkout Counters Retail Outlet Performance Assessment Mockup PDF
The slide visually provides information regarding the average time customer spent at the checkout counter of retail store. It also provides details regarding waiting timings of competitors.Deliver and pitch your topic in the best possible manner with this Analysis Of Average Wait Time At Retail Store Checkout Counters Retail Outlet Performance Assessment Mockup PDF. Use them to share invaluable insights on Average Customer, Counter Reflecting, Checkout Counter and impress your audience. This template can be altered and modified as per your expectations. So, grab it now.

Assessment Of Theft Incidents At Retail Store Retail Outlet Performance Assessment Mockup PDF
This slide provides information regarding the percentage of theft incidents that occurred at the retail store in a given quarter such as shoplifting, employee theft, card fraud, etc. Deliver and pitch your topic in the best possible manner with this Assessment Of Theft Incidents At Retail Store Retail Outlet Performance Assessment Mockup PDF. Use them to share invaluable insights on Assessment Theft, Incidents, Retail Store and impress your audience. This template can be altered and modified as per your expectations. So, grab it now.

Retail Store Employee Engagement Dashboards Retail Outlet Performance Assessment Summary PDF
This slide represents the dashboard to showcase retail stores employee engagement score teamwise, hierarchy levels wise. It also provides details of score on multiple engagement dimensions such as work life balance, salary, growth opportunities etc.Deliver an awe inspiring pitch with this creative Retail Store Employee Engagement Dashboards Retail Outlet Performance Assessment Summary PDF bundle. Topics like Engagement Score, Promoter Score, Engagement Dimensions can be discussed with this completely editable template. It is available for immediate download depending on the needs and requirements of the user.
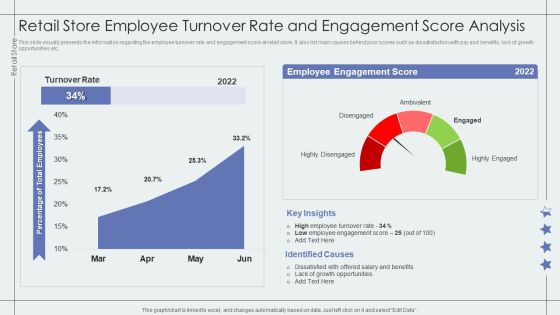
Retail Store Employee Turnover Rate And Engagement Score Analysis Retail Outlet Performance Assessment Professional PDF
This slide visually presents the information regarding the employee turnover rate and engagement score at retail store. It also list main causes behind poor scores such as dissatisfaction with pay and benefits, lack of growth opportunities etc.Deliver an awe inspiring pitch with this creative Retail Store Employee Turnover Rate And Engagement Score Analysis Retail Outlet Performance Assessment Professional PDF bundle. Topics like Employee Engagement, Identified Causes, Growth Opportunities can be discussed with this completely editable template. It is available for immediate download depending on the needs and requirements of the user.

Retail Store Social Media Activities Analysis Retail Outlet Performance Assessment Rules PDF
This slide represents the dashboard to showcase retail store social media activities such as followers on Facebook, Twitter, website traffic, etc. It also provides information regarding social media channels engagement in terms of clicks, shares, likes, and comments.Deliver an awe inspiring pitch with this creative Retail Store Social Media Activities Analysis Retail Outlet Performance Assessment Rules PDF bundle. Topics like Social Media, Channels, Referral Traffic can be discussed with this completely editable template. It is available for immediate download depending on the needs and requirements of the user.

Consumer Journey Mapping Techniques Loyalty Program Performance Tracking Dashboard Portrait PDF
This slide covers the KPI dashboard for analyzing customer loyalty campaign results. It includes metrics such as revenue, liability, NQP accrued, transaction count, members, redemption ratio, etc. Pitch your topic with ease and precision using this Consumer Journey Mapping Techniques Loyalty Program Performance Tracking Dashboard Portrait PDF. This layout presents information on Transaction Count, Revenue, Redemption Ratio. It is also available for immediate download and adjustment. So, changes can be made in the color, design, graphics or any other component to create a unique layout.
Consumer Journey Mapping Techniques Referral Program Performance Tracking Dashboard Formats PDF
This slide covers the KPI dashboard for analyzing referral campaign results. It includes metrics such as total revenue generated, monthly recurring revenue, new customers, clicks, cancelled customers, paying customers, etc. Showcasing this set of slides titled Consumer Journey Mapping Techniques Referral Program Performance Tracking Dashboard Formats PDF. The topics addressed in these templates are Revenue, New Customers, Paying Customers. All the content presented in this PPT design is completely editable. Download it and make adjustments in color, background, font etc. as per your unique business setting.

Quarterly Business Performance Assessment And Evaluation Of A Manufacturing Firm Inspiration PDF
This slide includes Quarterly Business Review of a company. It gives an account of sales of Product A, Product B, Product C and Product D, respectively with trend analysis of revenues generated. Showcasing this set of slides titled Quarterly Business Performance Assessment And Evaluation Of A Manufacturing Firm Inspiration PDF. The topics addressed in these templates are Quarterly Business Analysis, Product, Sales. All the content presented in this PPT design is completely editable. Download it and make adjustments in color, background, font etc. as per your unique business setting.
Stock Performance Dashboard For Metrics Team Management Ppt Outline Icons PDF
This slide represents the dashboard for tracking the management team member, manager, and teams ability to ensure inventory accuracy over time. It includes KPIs such as inventory, average result area scores and result areas. Pitch your topic with ease and precision using this Stock Performance Dashboard For Metrics Team Management Ppt Outline Icons PDF. This layout presents information on Result areas, Metrics Team, Needs Help. It is also available for immediate download and adjustment. So, changes can be made in the color, design, graphics or any other component to create a unique layout.

Stock Performance Metrics Dashboard For FMCG Company Ppt Ideas Design Inspiration PDF
This slide showcases the metrics for analyzing inventory turnover. It includes KPIs such as product sold within freshness date, out of stock rate, on time in full deliveries, etc. Showcasing this set of slides titled Stock Performance Metrics Dashboard For FMCG Company Ppt Ideas Design Inspiration PDF. The topics addressed in these templates are Inventory Turnover, Overview 2015, Inventory Turnover. All the content presented in this PPT design is completely editable. Download it and make adjustments in color, background, font etc. as per your unique business setting.
Performance Tracking Dashboard For SDLC Phases Of Software Development Procedure Demonstration PDF
This slide represents the requirement gathering and analysis phase of the software development life cycle, including the steps taken in this stage, such as collecting needed information about the product to be made.This Performance Tracking Dashboard For SDLC Phases Of Software Development Procedure Demonstration PDF is perfect for any presentation, be it in front of clients or colleagues. It is a versatile and stylish solution for organizing your meetings. The product features a modern design for your presentation meetings. The adjustable and customizable slides provide unlimited possibilities for acing up your presentation. Slidegeeks has done all the homework before launching the product for you. So, do not wait, grab the presentation templates today.
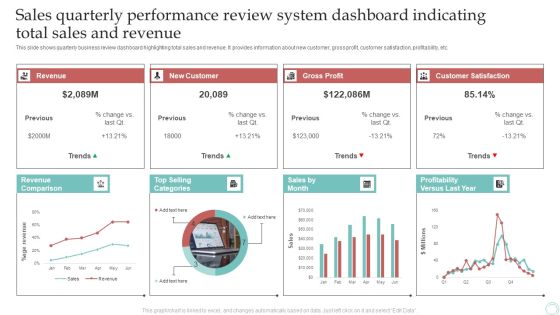
Sales Quarterly Performance Review System Dashboard Indicating Total Sales And Revenue Download PDF
This slide shows quarterly business review dashboard highlighting total sales and revenue. It provides information about new customer, gross profit, customer satisfaction, profitability, etc. Pitch your topic with ease and precision using this Sales Quarterly Performance Review System Dashboard Indicating Total Sales And Revenue Download PDF. This layout presents information on Revenue, New Customer, Gross Profit. It is also available for immediate download and adjustment. So, changes can be made in the color, design, graphics or any other component to create a unique layout.

Product Marketing Management To Enforce Business Performance Dashboard Showing Digital Professional PDF
Do you know about Slidesgeeks Product Marketing Management To Enforce Business Performance Dashboard Showing Digital Professional PDF These are perfect for delivering any kind od presentation. Using it, create PowerPoint presentations that communicate your ideas and engage audiences. Save time and effort by using our pre designed presentation templates that are perfect for a wide range of topic. Our vast selection of designs covers a range of styles, from creative to business, and are all highly customizable and easy to edit. Download as a PowerPoint template or use them as Google Slides themes.

Business Performance Monitoring Kpi Dashboard Guide For Successful Merger And Acquisition Mockup PDF
Coming up with a presentation necessitates that the majority of the effort goes into the content and the message you intend to convey. The visuals of a PowerPoint presentation can only be effective if it supplements and supports the story that is being told. Keeping this in mind our experts created Business Performance Monitoring Kpi Dashboard Guide For Successful Merger And Acquisition Mockup PDF to reduce the time that goes into designing the presentation. This way, you can concentrate on the message while our designers take care of providing you with the right template for the situation.

Dashboard To Track Product Sales Performance Implementing Focus Strategy To Improve Designs PDF
This slide showcases dashboard that can help organization to analyse the sales of product after entering into niche market. Its key elements are sales, sales target, sales growth, sales by channel, inventory days outstanding etc.Take your projects to the next level with our ultimate collection of Dashboard To Track Product Sales Performance Implementing Focus Strategy To Improve Designs PDF. Slidegeeks has designed a range of layouts that are perfect for representing task or activity duration, keeping track of all your deadlines at a glance. Tailor these designs to your exact needs and give them a truly corporate look with your own brand colors they all make your projects stand out from the rest.
 Home
Home