Investment Dashboard

Dashboard For Monitoring Process Performance Of Wastewater Treatment Plant Ppt Infographic Template Demonstration PDF
This slide showcase dashboard for monitoring process performance of wastewater management plant which contains cooling degrees, control, efficiency, protection, etc. Showcasing this set of slides titled Dashboard For Monitoring Process Performance Of Wastewater Treatment Plant Ppt Infographic Template Demonstration PDF. The topics addressed in these templates are Percent Control, Water Use Efficiency, Scale Protection, Protection From Erosion. All the content presented in this PPT design is completely editable. Download it and make adjustments in color, background, font etc. as per your unique business setting.

Sales Performance Monitoring Dashboard With Customer Details Ppt Infographics Themes PDF
This slide illustrates sales performance tracking dashboard with critical information. It provides information about customer details, invoice, earnings, leads, pending delivery, revenue, etc. Pitch your topic with ease and precision using this Sales Performance Monitoring Dashboard With Customer Details Ppt Infographics Themes PDF. This layout presents information on Todays Revenue, Today Delivered, Pending Delivery, Total Leads. It is also available for immediate download and adjustment. So, changes can be made in the color, design, graphics or any other component to create a unique layout.

Dashboard To Monitor Business Process Outsourcing Performance Based On Industry Standards Infographics PDF
This slide depicts the dashboard to monitor performance of business process outsourcing enterprise with reference to industry standards. The key elements covered in the slide are total calls, average answer speed, abandon rate, average calls per minute and agent performanc. Showcasing this set of slides titled Dashboard To Monitor Business Process Outsourcing Performance Based On Industry Standards Infographics PDF. The topics addressed in these templates are Industry Standards, Chart By Agent, Call Abandon Rate, Total Calls. All the content presented in this PPT design is completely editable. Download it and make adjustments in color, background, font etc. as per your unique business setting.
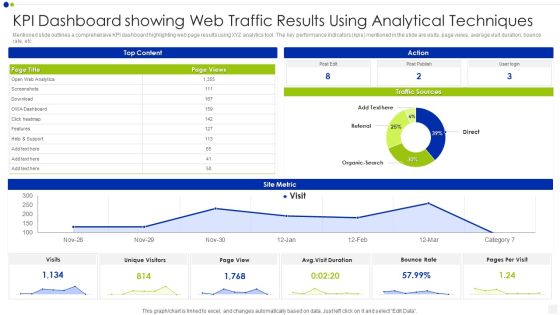
KPI Dashboard Showing Web Traffic Results Using Analytical Techniques Inspiration PDF
Mentioned slide outlines a comprehensive KPI dashboard highlighting web page results using XYZ analytics tool. The key performance indicators kpis mentioned in the slide are visits, page views, average visit duration, bounce rate, etc. Pitch your topic with ease and precision using this kpi dashboard showing web traffic results using analytical techniques inspiration pdf. This layout presents information on bounce rate, traffic sources, analytics. It is also available for immediate download and adjustment. So, changes can be made in the color, design, graphics or any other component to create a unique layout.
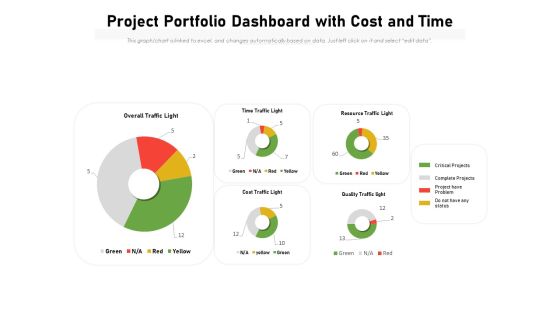
Project Portfolio Dashboard With Cost And Time Ppt PowerPoint Presentation Gallery Portrait PDF
Pitch your topic with ease and precision using this project portfolio dashboard with cost and time ppt powerpoint presentation gallery portrait pdf. This layout presents information on traffic, resource, cost. It is also available for immediate download and adjustment. So, changes can be made in the color, design, graphics or any other component to create a unique layout.
Warehouse Automation Deployment Dashboard For Tracking Impact Of Warehouse House Infographics PDF
This slide covers the dashboard with after automation warehouse overview. It include KPIs such as autonomous robots status, robotic arms status, battery level, performance, time to return, etc. Deliver and pitch your topic in the best possible manner with this Warehouse Automation Deployment Dashboard For Tracking Impact Of Warehouse House Infographics PDF. Use them to share invaluable insights on Autonomous Robot, Systems Engineer, Warehouse Manager and impress your audience. This template can be altered and modified as per your expectations. So, grab it now.
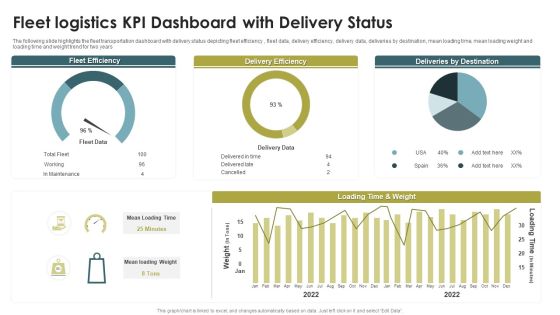
Fleet Logistics KPI Dashboard With Delivery Status Ppt Model Guide PDF
The following slide highlights the fleet transportation dashboard with delivery status depicting fleet efficiency , fleet data, delivery efficiency, delivery data, deliveries by destination, mean loading time, mean loading weight and loading time and weight trend for two years. Pitch your topic with ease and precision using this Fleet Logistics KPI Dashboard With Delivery Status Ppt Model Guide PDF. This layout presents information on Fleet Efficiency, Delivery Efficiency, Deliveries By Destination. It is also available for immediate download and adjustment. So, changes can be made in the color, design, graphics or any other component to create a unique layout.

Financial Services Organization Monthly Sales Forecast Dashboard Ppt Summary Slideshow PDF
This slide shows the dashboard representing data related to monthly sales forecast of the organization offering financial services to its clients. It includes information related to forecasted data, sales forecast, total sales, forecast projection etc. Showcasing this set of slides titled Financial Services Organization Monthly Sales Forecast Dashboard Ppt Summary Slideshow PDF. The topics addressed in these templates are Forecasts Sales, Time Series View, Forecast Projection. All the content presented in this PPT design is completely editable. Download it and make adjustments in color, background, font etc. as per your unique business setting.

Real Estate Business Monthly Sales Forecast Dashboard Ppt Layouts Grid PDF
This slide represents the dashboard showing the data related to sales forecasting for the real estate business. It shows details related to the set target, sales targets won, open and forecasted and also shows the graph representing the sales pipeline for the year. Showcasing this set of slides titled Real Estate Business Monthly Sales Forecast Dashboard Ppt Layouts Grid PDF. The topics addressed in these templates are Next Billing Data, Pipeline, Current Fiscal Year. All the content presented in this PPT design is completely editable. Download it and make adjustments in color, background, font etc. as per your unique business setting.

Inventory Stock Out And Decline Of Sales Analysis Dashboard Inspiration PDF
Following slide presents a key performance indicating dashboard that can be used by businesses to track Inventory stock out and lost sales. Major key performance indicators are percentage stockouts, amount of sales, lost sales accountability, etc. Pitch your topic with ease and precision using this Inventory Stock Out And Decline Of Sales Analysis Dashboard Inspiration PDF. This layout presents information on Lost Sales Summary, Stock Out Details It is also available for immediate download and adjustment. So, changes can be made in the color, design, graphics or any other component to create a unique layout.

Strategy To Improve Team Proficiency Team Performance Observation Dashboard Diagrams PDF
This slide provides an overview of statistics related to current team performance based on observation method selected in previous slide for data collection. It involves team conflict status, Planned vs actual project status, leadership status and communication gap status. Deliver an awe inspiring pitch with this creative proficiency team performance observation dashboard diagrams pdf bundle. Topics like team performance observation dashboard can be discussed with this completely editable template. It is available for immediate download depending on the needs and requirements of the user.
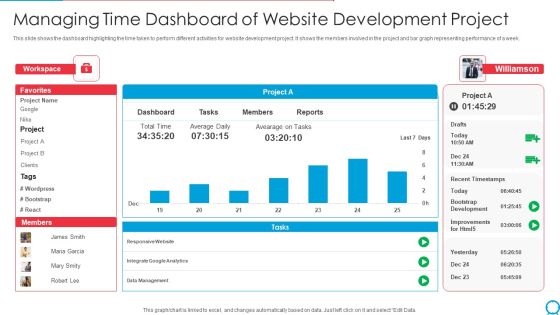
Managing Time Dashboard Of Website Development Project Ppt PowerPoint Presentation Gallery Outline PDF
This slide shows the dashboard highlighting the time taken to perform different activities for website development project. It shows the members involved in the project and bar graph representing performance of a week. Showcasing this set of slides titled managing time dashboard of website development project ppt powerpoint presentation gallery outline pdf. The topics addressed in these templates are workspace, project, data management, recent timestamps. All the content presented in this PPT design is completely editable. Download it and make adjustments in color, background, font etc. as per your unique business setting.
Insider Threat In Cyber Security Tracking Dashboard With User Details Portrait PDF
This slide shows user details tracked by insider threat dashboard. It provides information such as exposure events, file activity, archive, document, image, pdf, ppt, scripts, etc. Pitch your topic with ease and precision using this Insider Threat In Cyber Security Tracking Dashboard With User Details Portrait PDF. This layout presents information on Private Data, Exposure Events, User Activity, File Activity, Over Time. It is also available for immediate download and adjustment. So, changes can be made in the color, design, graphics or any other component to create a unique layout.

Kpi Dashboard To Measure Talent Performance Employee Performance Management Tactics Professional PDF
This slide represents dashboard to measure talent performance in organization. It includes talent applicant status, team training methods, talented candidate status, risk for loss of potential talent pool etc.The Kpi Dashboard To Measure Talent Performance Employee Performance Management Tactics Professional PDF is a compilation of the most recent design trends as a series of slides. It is suitable for any subject or industry presentation, containing attractive visuals and photo spots for businesses to clearly express their messages. This template contains a variety of slides for the user to input data, such as structures to contrast two elements, bullet points, and slides for written information. Slidegeeks is prepared to create an impression.
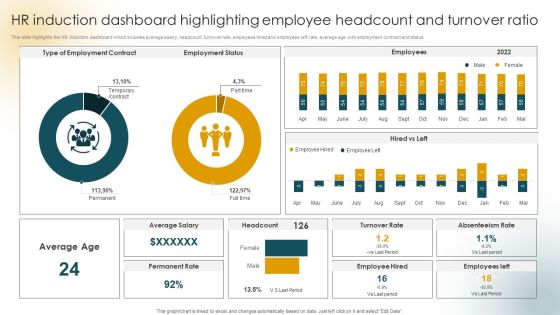
HR Induction Dashboard Highlighting Employee Headcount And Turnover Ratio Slides PDF
This slide highlights the HR induction dashboard which includes average salary, headcount, turnover rate, employees hired and employees left rate, average age with employment contract and status. The HR Induction Dashboard Highlighting Employee Headcount And Turnover Ratio Slides PDF is a compilation of the most recent design trends as a series of slides. It is suitable for any subject or industry presentation, containing attractive visuals and photo spots for businesses to clearly express their messages. This template contains a variety of slides for the user to input data, such as structures to contrast two elements, bullet points, and slides for written information. Slidegeeks is prepared to create an impression.
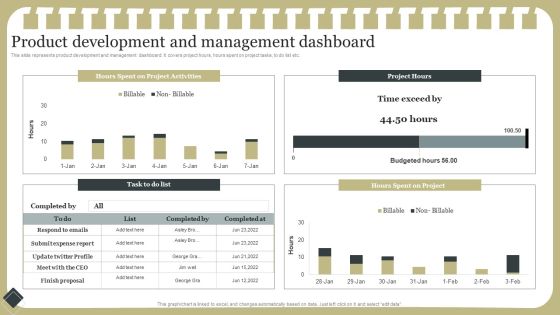
Effective Product Development Strategy Product Development And Management Dashboard Introduction PDF
This slide represents product development and management dashboard. It covers project hours, hours spent on project tasks, to do list etc.The Effective Product Development Strategy Product Development And Management Dashboard Introduction PDF is a compilation of the most recent design trends as a series of slides. It is suitable for any subject or industry presentation, containing attractive visuals and photo spots for businesses to clearly express their messages. This template contains a variety of slides for the user to input data, such as structures to contrast two elements, bullet points, and slides for written information. Slidegeeks is prepared to create an impression.

Dashboard To Analyze City Ecological And Carbon Footprints Consumption Mockup PDF
This slide illustrates the dashboard to analyze ecological and carbon footprint of a city. The purpose of this template is to provide layout to analyze footprint data and define measures to protect environment. It includes metrics related to carbon emissions, usage of air, water and energy. Showcasing this set of slides titled Dashboard To Analyze City Ecological And Carbon Footprints Consumption Mockup PDF. The topics addressed in these templates are Installing Rooftop Photovoltaic, Using Mass Transport, Composting. All the content presented in this PPT design is completely editable. Download it and make adjustments in color, background, font etc. as per your unique business setting.

Executing Diversity Workforce Diversity Dashboard Based On Gender And Ethnicity Distribution Rules PDF
This slide represents the diversity dashboard providing information regarding work force distribution on gender and ethnicity. It also includes details of year wise involuntary and voluntary turnover rates. The Executing Diversity Workforce Diversity Dashboard Based On Gender And Ethnicity Distribution Rules PDF is a compilation of the most recent design trends as a series of slides. It is suitable for any subject or industry presentation, containing attractive visuals and photo spots for businesses to clearly express their messages. This template contains a variety of slides for the user to input data, such as structures to contrast two elements, bullet points, and slides for written information. Slidegeeks is prepared to create an impression.
Types Of Reinforcement Learning In ML Performance Tracking Dashboard Reinforcement Learning Inspiration PDF
This slide represents the performance tracking dashboard for the reinforcement learning model based on different time frames and categories. The Types Of Reinforcement Learning In ML Performance Tracking Dashboard Reinforcement Learning Inspiration PDF is a compilation of the most recent design trends as a series of slides. It is suitable for any subject or industry presentation, containing attractive visuals and photo spots for businesses to clearly express their messages. This template contains a variety of slides for the user to input data, such as structures to contrast two elements, bullet points, and slides for written information. Slidegeeks is prepared to create an impression.

Cognitive Sensor Network Dashboard For Spectrum Consumption In Cognitive Radio Introduction PDF
This slide depicts the dashboard for spectrum consumption in cognitive radio by covering an overview of the types of data that spectrum contains, spectrum results, user reputation, and locations. Find a pre designed and impeccable Cognitive Sensor Network Dashboard For Spectrum Consumption In Cognitive Radio Introduction PDF. The templates can ace your presentation without additional effort. You can download these easy to edit presentation templates to make your presentation stand out from others. So, what are you waiting for Download the template from Slidegeeks today and give a unique touch to your presentation.

Implementing Lean Production Tool And Techniques Production Metric Dashboard For Equipment Performance Mockup PDF
This slide represents lean manufacturing dashboard for performance measurement. It covers equipment status timeline, downtime etc The Implementing Lean Production Tool And Techniques Production Metric Dashboard For Equipment Performance Mockup PDF is a compilation of the most recent design trends as a series of slides. It is suitable for any subject or industry presentation, containing attractive visuals and photo spots for businesses to clearly express their messages. This template contains a variety of slides for the user to input data, such as structures to contrast two elements, bullet points, and slides for written information. Slidegeeks is prepared to create an impression.

Dashboard For Enterprise Recruitment With Time To Hire And Fill Icons PDF
In this slide corporate staffing dashboard highlights important recruitment KPIs to review application trends and candidate response to job vacancy. It further includes details about application, review, assessment, interview, etc. Showcasing this set of slides titled Dashboard For Enterprise Recruitment With Time To Hire And Fill Icons PDF. The topics addressed in these templates are Key Metrics, Experienced Ratio, Applicants. All the content presented in this PPT design is completely editable. Download it and make adjustments in color, background, font etc. as per your unique business setting.

Dashboard For Monitoring Construction Project Status And Risk Management Ideas PDF
This slide represents dashboard which is used to track construction project performance for effective risk management progress . It provides information regarding key risk indicators, project completion percentage, project stages, project workload etc. Pitch your topic with ease and precision using this Dashboard For Monitoring Construction Project Status And Risk Management Ideas PDF. This layout presents information on Project Completion Percentage, Key Risk Indicators, Project By Stage. It is also available for immediate download and adjustment. So, changes can be made in the color, design, graphics or any other component to create a unique layout.

Lean Operational Excellence Strategy Manufacturing Dashboard To Check Production System Efficiency Pictures PDF
This slide showcases manufacturing dashboard to track KPIs defined under lean and kaizen process improvement plans. Key performance metrics included here are TEEP, OEE, loading time, production quality, losses by hours, losses by categories etc. Pitch your topic with ease and precision using this Lean Operational Excellence Strategy Manufacturing Dashboard To Check Production System Efficiency Pictures PDF. This layout presents information on Loading, Availability, Performance. It is also available for immediate download and adjustment. So, changes can be made in the color, design, graphics or any other component to create a unique layout.
Online Risk Management Dashboard For Tracking Threats And Attacks Icons PDF
The purpose of this slide is to represent dashboard to monitor risks and cyber threats for efficient risk management. It includes various types of key performance indicators such as types of risks, severities, sources and risk meter. Showcasing this set of slides titled Online Risk Management Dashboard For Tracking Threats And Attacks Icons PDF. The topics addressed in these templates are Attack, Indication Severities, Sources. All the content presented in this PPT design is completely editable. Download it and make adjustments in color, background, font etc. as per your unique business setting.

KPI Dashboard To Manage Various Risks In Project Administration Sample PDF
This slide signifies the key performance indicator dashboard to manage various threats in company project. It covers information about corporate risk, control performance, open issues and map. Showcasing this set of slides titled KPI Dashboard To Manage Various Risks In Project Administration Sample PDF. The topics addressed in these templates are Control Performance, Open Issues, Corporate Risk. All the content presented in this PPT design is completely editable. Download it and make adjustments in color, background, font etc. as per your unique business setting.

Tactical Brand Extension Launching Kpi Dashboard To Monitor Sales And Orders Formats PDF
Following slide displays sales and orders performance monitoring dashboard. Key performance indicators covered in the slide are return reasons, perfect order rate, total orders, top seller by orders. From laying roadmaps to briefing everything in detail, our templates are perfect for you. You can set the stage with your presentation slides. All you have to do is download these easy-to-edit and customizable templates. Tactical Brand Extension Launching Kpi Dashboard To Monitor Sales And Orders Formats PDF will help you deliver an outstanding performance that everyone would remember and praise you for. Do download this presentation today.
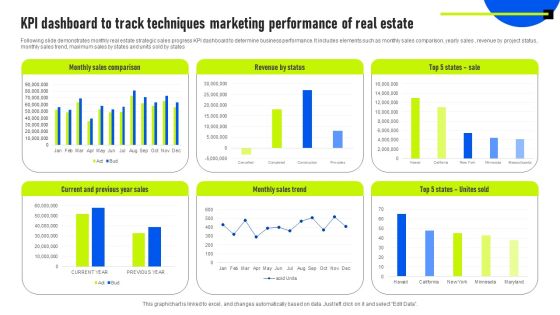
KPI Dashboard To Track Techniques Marketing Performance Of Real Estate Information PDF
Following slide demonstrates monthly real estate strategic sales progress KPI dashboard to determine business performance. It includes elements such as monthly sales comparison, yearly sales , revenue by project status, monthly sales trend, maximum sales by states and units sold by states. Showcasing this set of slides titled KPI Dashboard To Track Techniques Marketing Performance Of Real Estate Information PDF. The topics addressed in these templates are Revenue By Status, Monthly Sales Comparison, Monthly Sales Trend. All the content presented in this PPT design is completely editable. Download it and make adjustments in color, background, font etc. as per your unique business setting.
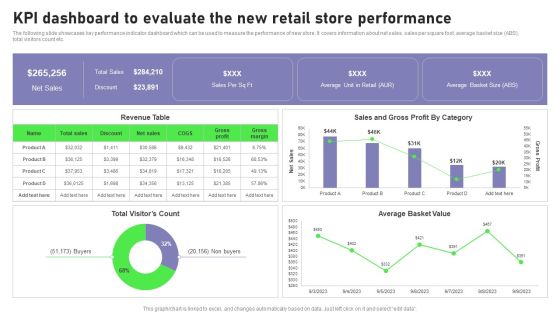
Retail Outlet Opening To Enhance Product Sale Kpi Dashboard To Evaluate The New Retail Guidelines PDF
The following slide showcases key performance indicator dashboard which can be used to measure the performance of new store. It covers information about net sales, sales per square foot, average basket size ABS, total visitors count etc. There are so many reasons you need a Retail Outlet Opening To Enhance Product Sale Kpi Dashboard To Evaluate The New Retail Guidelines PDF. The first reason is you can not spend time making everything from scratch, Thus, Slidegeeks has made presentation templates for you too. You can easily download these templates from our website easily.

People Engagement Performance Dashboard With Variables Growth Ppt Summary Example PDF
This slide shows a People Engagement Performance Dashboard with variables such as engagement score, recognition rate, satisfaction rate, company knowledge rate and other key metrics of employee engagement. Deliver and pitch your topic in the best possible manner with this people engagement performance dashboard with variables growth ppt summary example pdf. Use them to share invaluable insights on 10 key metrics of employee engagement, employee engagement score and impress your audience. This template can be altered and modified as per your expectations. So, grab it now.

Actively Influencing Customers Dashboard For Tracking Marketing Activities At Social Guidelines PDF
This slide covers information regarding the dashboard for tracking essential marketing activities at social media platform in terms of social traffic and conversion, referral traffic by site, key social media metrics. Deliver and pitch your topic in the best possible manner with this Actively Influencing Customers Dashboard For Tracking Marketing Activities At Social Guidelines PDF. Use them to share invaluable insights on Social Events, Social Traffic And Conversion, Referral Traffic By Site, Key Social Metrics and impress your audience. This template can be altered and modified as per your expectations. So, grab it now.

Dashboard Of Property Operations And Maintenance Ppt Infographic Template Objects PDF
This slide focuses on maintenance dashboard for certified reliability engineer which covers team efficiency, cumulative savings, planned maintenance, chiller performance analysis, portfolio comparison, alarm and fault diagnostics, etc. Pitch your topic with ease and precision using this Dashboard Of Property Operations And Maintenance Ppt Infographic Template Objects PDF. This layout presents information on Planned Maintenance Efficiency, Chiller Performance Analysis, Portfolio Comparison Team, Alarm And Fault. It is also available for immediate download and adjustment. So, changes can be made in the color, design, graphics or any other component to create a unique layout.

Kpi Dashboard To Track Video Promotion Techniques Ppt Summary Guide PDF
This slide signifies the key performance indicator dashboard to measure video promotion techniques. It covers information regarding to the page visit, post reach, summary, click action on page. Pitch your topic with ease and precision using this Kpi Dashboard To Track Video Promotion Techniques Ppt Summary Guide PDF. This layout presents information on Page Visit, Page Summary, Post Overview. It is also available for immediate download and adjustment. So, changes can be made in the color, design, graphics or any other component to create a unique layout.

Customer Behavior Analytics Dashboard For Media Companies Ppt Ideas Visuals PDF
The following slide showcases analytics dashboard to assess consumer behavior. key performance indicators covered are streaming hours by device, average views and user sharing credentials. Showcasing this set of slides titled Customer Behavior Analytics Dashboard For Media Companies Ppt Ideas Visuals PDF. The topics addressed in these templates are Streaming Hours Device, Average Streaming Hours, Per User, Users Sharing Credentials. All the content presented in this PPT design is completely editable. Download it and make adjustments in color, background, font etc. as per your unique business setting.
Shipping And Logistics Tracking Dashboard With Shipments And Fleet Status Elements PDF
This slide covers Key performance indicators to track the automation system of the company. This dashboard includes Logistics Efficiency Status, delivery time accuracy etc. Take your projects to the next level with our ultimate collection of Shipping And Logistics Tracking Dashboard With Shipments And Fleet Status Elements PDF. Slidegeeks has designed a range of layouts that are perfect for representing task or activity duration, keeping track of all your deadlines at a glance. Tailor these designs to your exact needs and give them a truly corporate look with your own brand colors they ll make your projects stand out from the rest.
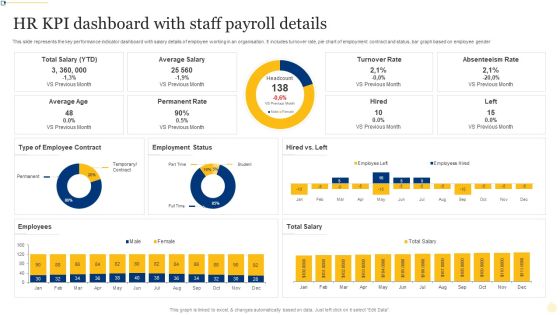
HR KPI Dashboard With Staff Payroll Details Ppt PowerPoint Presentation File Layout Ideas PDF
This slide represents the key performance indicator dashboard with salary details of employee working in an organisation. It includes turnover rate, pie chart of employment contract and status, bar graph based on employee gender. Showcasing this set of slides titled HR KPI Dashboard With Staff Payroll Details Ppt PowerPoint Presentation File Layout Ideas PDF. The topics addressed in these templates are Turnover Rate, Absenteeism Rate, Permanent Rate. All the content presented in this PPT design is completely editable. Download it and make adjustments in color, background, font etc. as per your unique business setting.
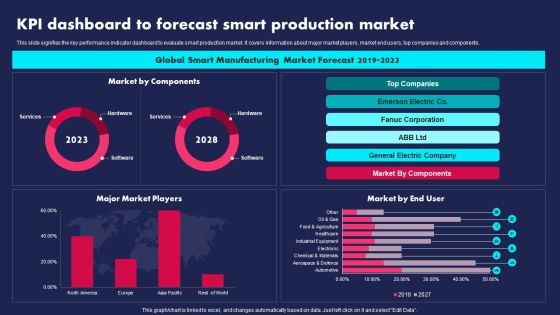
KPI Dashboard To Forecast Smart Production Market Ppt PowerPoint Presentation Gallery Visual Aids PDF
This slide signifies the key performance indicator dashboard to evaluate smart production market. It covers information about major market players, market end users, top companies and components. Pitch your topic with ease and precision using this KPI Dashboard To Forecast Smart Production Market Ppt PowerPoint Presentation Gallery Visual Aids PDF. This layout presents information on Global Smart Manufacturing, Market Forecast, 2019 To 2023. It is also available for immediate download and adjustment. So, changes can be made in the color, design, graphics or any other component to create a unique layout.
Robotic Process Automation Shipping And Logistics Tracking Dashboard With Shipments Clipart PDF
This slide covers Key performance indicators to track the automation system of the company. This dashboard includes Logistics Efficiency Status, delivery time accuracy etc. If your project calls for a presentation, then Slidegeeks is your go-to partner because we have professionally designed, easy-to-edit templates that are perfect for any presentation. After downloading, you can easily edit Robotic Process Automation Shipping And Logistics Tracking Dashboard With Shipments Clipart PDF and make the changes accordingly. You can rearrange slides or fill them with different images. Check out all the handy templates
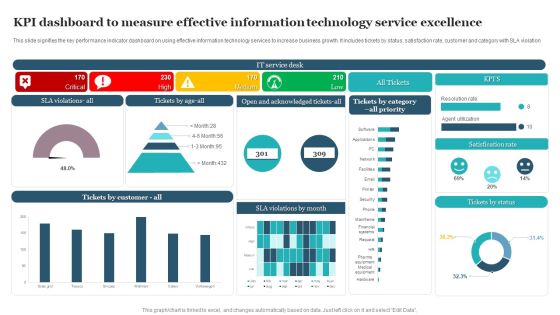
KPI Dashboard To Measure Effective Information Technology Service Excellence Information PDF
This slide signifies the key performance indicator dashboard on using effective information technology services to increase business growth. It includes tickets by status, satisfaction rate, customer and category with SLA violation. Showcasing this set of slides titled KPI Dashboard To Measure Effective Information Technology Service Excellence Information PDF. The topics addressed in these templates are Satisfication Rate, Tickets Status, Service Desk. All the content presented in this PPT design is completely editable. Download it and make adjustments in color, background, font etc. as per your unique business setting.

Dashboard To Track Inventory Status In Sales To Cash Process Themes PDF
This slide depicts a dashboard for business managers to keep the track of inventory in order to cash process for easy understanding and decision making. The major key performing indicators are inventory status, surplus stock, dead inventory, sales by product grades etc. Showcasing this set of slides titled Dashboard To Track Inventory Status In Sales To Cash Process Themes PDF. The topics addressed in these templates are Inventory Status, Surplus Stock, Dead Inventory. All the content presented in this PPT design is completely editable. Download it and make adjustments in color, background, font etc. as per your unique business setting.
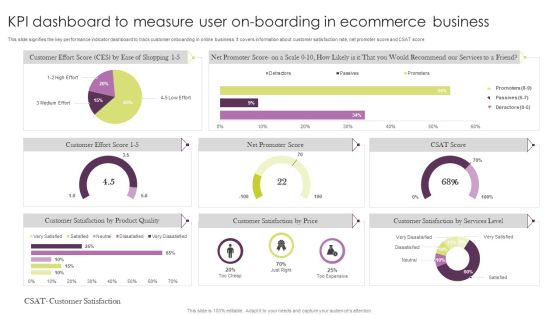
KPI Dashboard To Measure User On Boarding In Ecommerce Business Microsoft PDF
This slide signifies the key performance indicator dashboard to track customer onboarding in online business. It covers information about customer satisfaction rate, net promoter score and CSAT score. Showcasing this set of slides titled KPI Dashboard To Measure User On Boarding In Ecommerce Business Microsoft PDF. The topics addressed in these templates are User Boarding Icon, Develop Ecommerce Business. All the content presented in this PPT design is completely editable. Download it and make adjustments in color, background, font etc. as per your unique business setting.

KPI Dashboard To Monitor Real Time Issues In Logistics Chain Rules PDF
This slide presents a dashboard which can be used by suppliers to monitor any issues taking place in the supply chain and take timely steps for improvement. The key performing indicators are activities due, issue severity, issues unassigned, issues under inspection etc. Pitch your topic with ease and precision using this KPI Dashboard To Monitor Real Time Issues In Logistics Chain Rules PDF. This layout presents information on Activities Due, Issues By Severity, Issues Rejected, Inspection Status. It is also available for immediate download and adjustment. So, changes can be made in the color, design, graphics or any other component to create a unique layout.
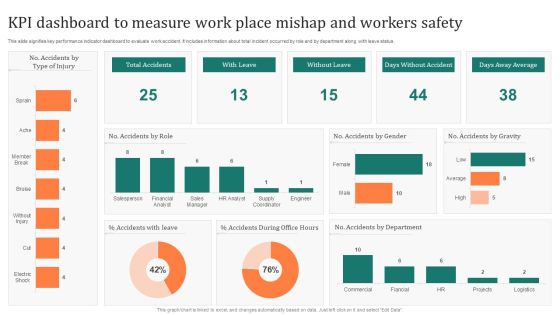
KPI Dashboard To Measure Work Place Mishap And Workers Safety Inspiration PDF
This slide signifies key performance indicator dashboard to evaluate work accident. It includes information about total incident occurred by role and by department along with leave status. Pitch your topic with ease and precision using this KPI Dashboard To Measure Work Place Mishap And Workers Safety Inspiration PDF. This layout presents information on Accidents Role, Accidents Leave, Accidents Department. It is also available for immediate download and adjustment. So, changes can be made in the color, design, graphics or any other component to create a unique layout.

Search Engine Marketing Website Traffic Analysis With KPI Dashboard Brochure PDF
The following slide depicts the website analysis dashboard to get better visibility over search engines. It mainly includes key performance indicators such as sessions, users, page views, sources of traffic, phone call to actions etc. Want to ace your presentation in front of a live audience Our Search Engine Marketing Website Traffic Analysis With KPI Dashboard Brochure PDF can help you do that by engaging all the users towards you.. Slidegeeks experts have put their efforts and expertise into creating these impeccable powerpoint presentations so that you can communicate your ideas clearly. Moreover, all the templates are customizable, and easy-to-edit and downloadable. Use these for both personal and commercial use.

Dashboard To Track Progress Post Implementing Drug Launch Strategy Slides PDF
Following dashboard provides a brief overview of progress post implementing drug launch strategy which can be used by medical representatives to monitor the effectiveness. The key performance indicators are units sold, target, revenue, units unsold etc. Showcasing this set of slides titled Dashboard To Track Progress Post Implementing Drug Launch Strategy Slides PDF. The topics addressed in these templates are Planning, Design, Development, Testing, Launch. All the content presented in this PPT design is completely editable. Download it and make adjustments in color, background, font etc. as per your unique business setting.

Dashboard To Depict Strategic B2B Communication Rollout Plan Success Portrait PDF
This slide consists of a dashboard that can be used to depict the success of a B2B communication rollout. Key performing indicators included in the slide are products sold, total revenue, client satisfaction, net profit, etc. Showcasing this set of slides titled Dashboard To Depict Strategic B2B Communication Rollout Plan Success Portrait PDF. The topics addressed in these templates are Product Sold, Total Revenue, B2b Client Satisfication. All the content presented in this PPT design is completely editable. Download it and make adjustments in color, background, font etc. as per your unique business setting.

Dashboard To Monitor International Footprint Of Supply Chain Operations Brochure PDF
This slide depicts a dashboard that will be used by managers to monitor the global footprint of supply chain operations. Major key performance indicators include total global emissions, time frame, allocation, electricity, etc. Showcasing this set of slides titled Dashboard To Monitor International Footprint Of Supply Chain Operations Brochure PDF. The topics addressed in these templates are Electricity, Footprint Emissions, Allocation. All the content presented in this PPT design is completely editable. Download it and make adjustments in color, background, font etc. as per your unique business setting.
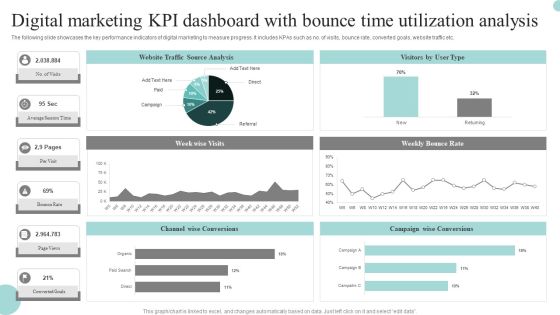
Digital Marketing Kpi Dashboard With Bounce Time Utilization Analysis Graphics PDF
The following slide showcases the key performance indicators of digital marketing to measure progress. It includes KPAs such as no. of visits, bounce rate, converted goals, website traffic etc. Pitch your topic with ease and precision using this Digital Marketing Kpi Dashboard With Bounce Time Utilization Analysis Graphics PDF. This layout presents information on Digital Marketing, KPI Dashboard, Bounce Time Utilization Analysis. It is also available for immediate download and adjustment. So, changes can be made in the color, design, graphics or any other component to create a unique layout.

Corporate Financial KPI Dashboard To Statement Cash Flow Of Company Diagrams PDF
This slide presents a financial dashboard of an enterprise which is being used to report the total spending power of a company. Key performing indicators include cash burn rate, monthly expenses, solvency etc. Showcasing this set of slides titled Corporate Financial KPI Dashboard To Statement Cash Flow Of Company Diagrams PDF. The topics addressed in these templates are Solvency, Debtors, Monthly Expenses. All the content presented in this PPT design is completely editable. Download it and make adjustments in color, background, font etc. as per your unique business setting.

People Engagement Performance Dashboard With Variables Ppt Gallery Example File PDF
This slide shows a People Engagement Performance Dashboard with variables such as engagement score, recognition rate, satisfaction rate, company knowledge rate and other key metrics of employee engagement. Deliver and pitch your topic in the best possible manner with this people engagement performance dashboard with variables ppt gallery example file pdf. Use them to share invaluable insights on personal growth, employee engagement score, employee engagement metrics and impress your audience. This template can be altered and modified as per your expectations. So, grab it now.

Consumer Journey Mapping Techniques Dashboard For Tracking Social Media Platforms Introduction PDF
This slide covers the KPI dashboard for analyzing social media channels. It includes metrics such as social media followers, Facebook daily reach, Facebook engaged users and page impressions, etc. Pitch your topic with ease and precision using this Consumer Journey Mapping Techniques Dashboard For Tracking Social Media Platforms Introduction PDF. This layout presents information on Linkedin Key Metrics, Social Media Followers, Awareness. It is also available for immediate download and adjustment. So, changes can be made in the color, design, graphics or any other component to create a unique layout.

Customer Behavior Analytics Dashboard To Improve Satisfaction Ppt File Infographics PDF
The following slide provides an insight of websites performance that includes date parameters. The dashboard includes sessions, users, pageviews, bounce rate and percentage of new sessions. Pitch your topic with ease and precision using this Customer Behavior Analytics Dashboard To Improve Satisfaction Ppt File Infographics PDF. This layout presents information on Session, Avg Session Duration, Bounce Rate. It is also available for immediate download and adjustment. So, changes can be made in the color, design, graphics or any other component to create a unique layout.
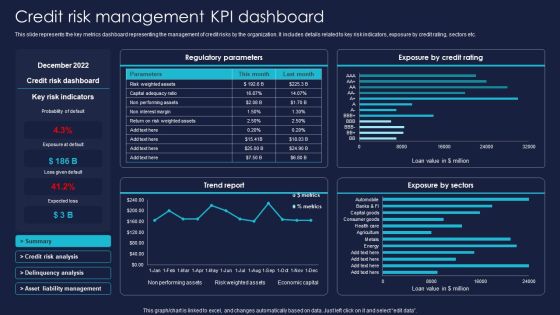
Enterprise Risk Management And Mitigation Program Credit Risk Management KPI Dashboard Introduction PDF
This slide represents the key metrics dashboard representing the management of credit risks by the organization. It includes details related to key risk indicators, exposure by credit rating, sectors etc. Want to ace your presentation in front of a live audience Our Enterprise Risk Management And Mitigation Program Credit Risk Management KPI Dashboard Introduction PDF can help you do that by engaging all the users towards you. Slidegeeks experts have put their efforts and expertise into creating these impeccable powerpoint presentations so that you can communicate your ideas clearly. Moreover, all the templates are customizable, and easy to edit and downloadable. Use these for both personal and commercial use.

Artificial Intelligence Transformation Playbook Kpi Dashboard For Tracking Business Performance Designs PDF
Mentioned slide portrays KPI dashboard that can be used by organizations to measure their business performance post AI introduction. KPIS covered here are progress, Before versus After AI Implementation, risks and issues. Deliver an awe inspiring pitch with this creative artificial intelligence transformation playbook kpi dashboard for tracking business performance designs pdf bundle. Topics like risk and issues, progress, performance kpis, before versus after all implementation can be discussed with this completely editable template. It is available for immediate download depending on the needs and requirements of the user.

AI Playbook For Business KPI Dashboard For Tracking Business Performance Demonstration PDF
Mentioned slide portrays KPI dashboard that can be used by organizations to measure their business performance post AI introduction. KPIS covered here are progress, before versus after AI implementation, risks and issues. Deliver and pitch your topic in the best possible manner with this AI Playbook For Business KPI Dashboard For Tracking Business Performance Demonstration PDF. Use them to share invaluable insights on Performance KPIs, Progress, Risk And Issues and impress your audience. This template can be altered and modified as per your expectations. So, grab it now.

Creating New Product Launch Campaign Strategy Dashboard To Measure Sales Rep Performance Introduction PDF
This slide illustrates sales representative performance measurement dashboard with key metrics such as average first contact resolution rate, occupancy rate, NPS and top agents by solved tickets. Make sure to capture your audiences attention in your business displays with our gratis customizable Creating New Product Launch Campaign Strategy Dashboard To Measure Sales Rep Performance Introduction PDF. These are great for business strategies, office conferences, capital raising or task suggestions. If you desire to acquire more customers for your tech business and ensure they stay satisfied, create your own sales presentation with these plain slides.

Consumer Intelligence Dashboard With Net Promoter Score Ppt PowerPoint Presentation File Templates PDF
Mentioned slide visually represents consumer intelligence dashboard that can be used by organization in order to understand customer journey. Customer satisfaction by product, net promotor score of last 90 and 365 days, agent performance, satisfaction by channel are some of the key metrics which are shown in this slide. Showcasing this set of slides titled Consumer Intelligence Dashboard With Net Promoter Score Ppt PowerPoint Presentation File Templates PDF. The topics addressed in these templates are Agent Performance, Satisfaction Channel, Net Promoter. All the content presented in this PPT design is completely editable. Download it and make adjustments in color, background, font etc. as per your unique business setting.

Customer Behavior Analytics Dashboard With Yearly Users Ppt Portfolio Ideas PDF
The following slide showcases dashboard that provides an insight on customer buying behavior from ecommerce website. Key metrics covered are yearly users, average time on page, bounce rate, unique page views session duration, purchased products, visitors, page performance and top search terms. Showcasing this set of slides titled Customer Behavior Analytics Dashboard With Yearly Users Ppt Portfolio Ideas PDF. The topics addressed in these templates are Yearly Users, Yearly Bounce Rate, Top Search Terms. All the content presented in this PPT design is completely editable. Download it and make adjustments in color, background, font etc. as per your unique business setting.

Integrating Digital Marketing Campaign Strategy Dashboard With Lead Breakdown Slides PDF
This slide depicts an integrating digital marketing campaign dashboard used to track lead generation and user traffic generated. It includes lead breakdown per day, google analytics traffic channels and key conversion metrics. Showcasing this set of slides titled Integrating Digital Marketing Campaign Strategy Dashboard With Lead Breakdown Slides PDF. The topics addressed in these templates are Lead Current Month, Website Users, Top Social Media Channels. All the content presented in this PPT design is completely editable. Download it and make adjustments in color, background, font etc. as per your unique business setting.
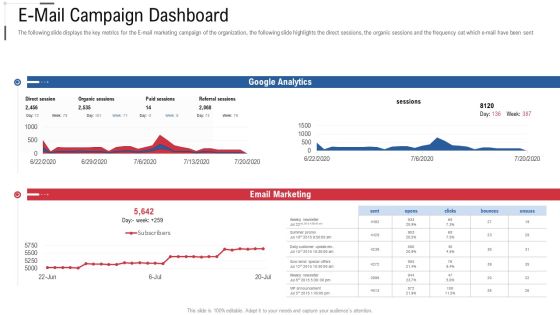
E Mail Campaign Dashboard Online Trade Marketing And Promotion Topics PDF
The following slide displays the key metrics for the E mail marketing campaign of the organization, the following slide highlights the direct sessions, the organic sessions and the frequency oat which e mail have been sent. Deliver an awe inspiring pitch with this creative e mail campaign dashboard online trade marketing and promotion topics pdf bundle. Topics like e mail campaign dashboard can be discussed with this completely editable template. It is available for immediate download depending on the needs and requirements of the user.
 Home
Home