Investment Dashboard
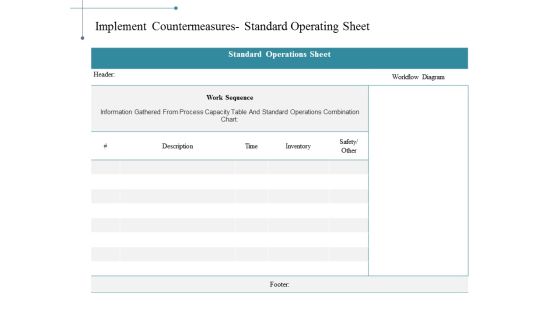
Implement Countermeasures Standard Operating Sheet Ppt PowerPoint Presentation Visual Aids Infographics
This is a implement countermeasures standard operating sheet ppt powerpoint presentation visual aids infographics. This is a five stage process. The stages in this process are tables, marketing, strategy, finance, analysis.

Data Warehousing IT Data Warehouse Vs Data Mart Ppt Infographic Template Background Image PDF
This slide represents a comparison between data warehouse and data mart and how data marts can be designed for sole operational reasons. Deliver an awe inspiring pitch with this creative data warehousing it data warehouse vs data mart ppt infographic template background image pdf bundle. Topics like marketing, finance, sales, formatted and processed data, data mart, data warehouse can be discussed with this completely editable template. It is available for immediate download depending on the needs and requirements of the user.

Data Analytics Plan For Product Pricing Decisions Icon Professional PDF
Presenting Data Analytics Plan For Product Pricing Decisions Icon Professional PDF to dispense important information. This template comprises three stages. It also presents valuable insights into the topics including Data Analytics Plan, Product Pricing, Decisions Icon. This is a completely customizable PowerPoint theme that can be put to use immediately. So, download it and address the topic impactfully.

B2b Marketing Business Sample Diagram Ppt Slides
This is a b2b marketing business sample diagram ppt slides. This is a one stage process. The stages in this process are communication, electronic, retailer, mobile, used, system, collaboration, volume, business, b2b, marketing, commerce, media, service, edi, chain, data, internet, sell, automated, may, using.
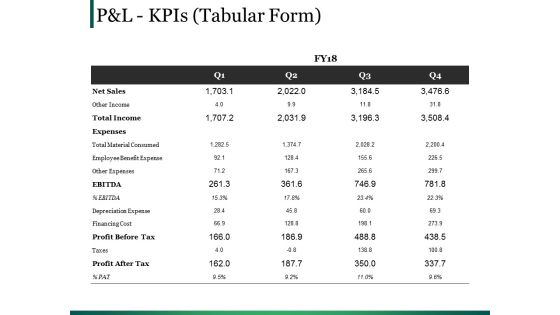
Pandl Kpis Template 1 Ppt PowerPoint Presentation Infographics Tips
This is a pandl kpis template 1 ppt powerpoint presentation infographics tips. This is a four stage process. The stages in this process are ebitda, total income, table, cost, management.
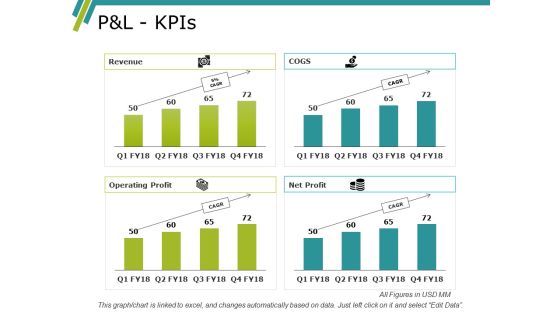
Pandl Kpis Ppt PowerPoint Presentation Slides Designs Download
This is a pandl kpis ppt powerpoint presentation slides designs download. This is a four stage process. The stages in this process are net sales, table, planning, cost, management.

Disaster Recovery Planning In Banking Industry Icons PDF
This slide describes the role of disaster recovery planning in the banking industry and how they are able to perform critical day to day activities through a recovery plan. Deliver and pitch your topic in the best possible manner with this Disaster Recovery Planning In Banking Industry Icons PDF. Use them to share invaluable insights on Data Replication, Business Applications, Systems and impress your audience. This template can be altered and modified as per your expectations. So, grab it now.

Predictive Data Model Regression Model For Predictive Analytics Sample PDF
This slide represents the regression model of predictive analytics that is most commonly used in statistical analysis. This model is used to identify patterns in large amounts of data and works by calculating a formula. There are so many reasons you need a Predictive Data Model Regression Model For Predictive Analytics Sample PDF. The first reason is you can not spend time making everything from scratch, Thus, Slidegeeks has made presentation templates for you too. You can easily download these templates from our website easily.

Constructive Cost Model COCOMO As Cost Estimation Technique Budgeting For Software Project IT Pictures PDF
This slide provides information regarding constructive cost model COCOMO as cost estimating technique for agile project development. Presenting constructive cost model cocomo as cost estimation technique budgeting for software project it pictures pdf to provide visual cues and insights. Share and navigate important information on three stages that need your due attention. This template can be used to pitch topics like development, cost, composition, data processing. In addtion, this PPT design contains high resolution images, graphics, etc, that are easily editable and available for immediate download.

Business Data Analysis Chart For Project PowerPoint Templates
Document Your Views On Our business data analysis chart for project Powerpoint Templates. They Will Create A Strong Impression.
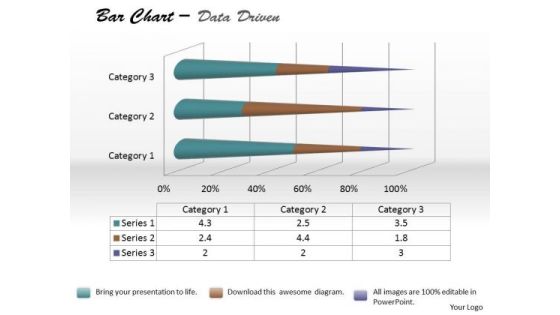
Data Analysis Bar Chart For Foreign Trade PowerPoint Templates
Be The Doer With Our data analysis bar chart for foreign trade Powerpoint Templates. Put Your Thoughts Into Practice.

Data Analysis Excel Business Tool Scatter Chart PowerPoint Templates
Dominate Proceedings With Your Ideas. Our data analysis excel business tool scatter chart Powerpoint Templates Will Empower Your Thoughts.
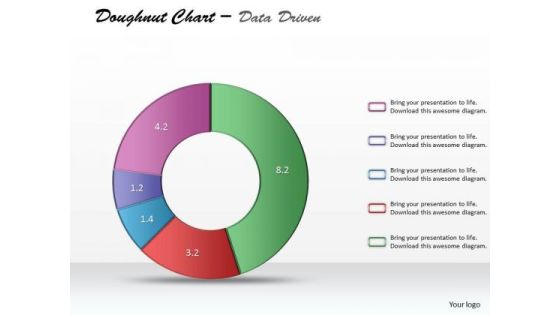
Data Analysis Excel Categorical Statistics Doughnut Chart PowerPoint Templates
Establish Your Dominion With Our data analysis excel categorical statistics doughnut chart Powerpoint Templates. Rule The Stage With Your Thoughts.

Data Analysis Techniques 3d Grouped Bar Chart PowerPoint Templates
Place The Orders With Your Thoughts. Our data analysis techniques 3d grouped bar chart Powerpoint Templates Know The Drill.
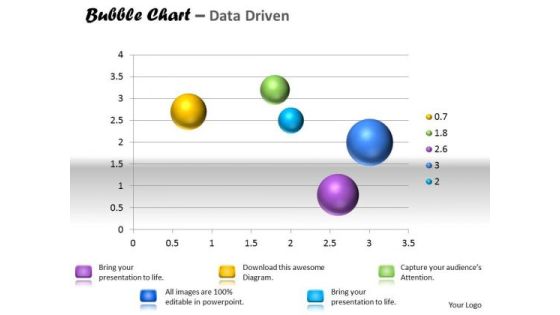
Data Analysis Template Interactive Bubble Chart PowerPoint Templates
Our data analysis template interactive bubble chart Powerpoint Templates Are A Wonder Drug. They Help Cure Almost Any Malaise.
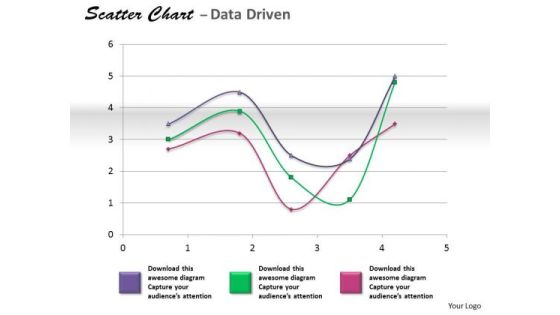
Financial Data Analysis Coordinate With Scatter Chart PowerPoint Templates
Get The Doers Into Action. Activate Them With Our financial data analysis coordinate with scatter chart Powerpoint Templates .
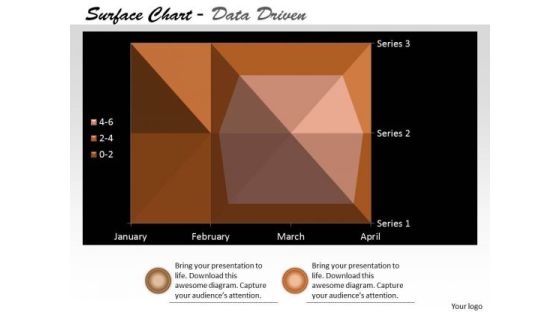
Multivariate Data Analysis Surface Chart Plots Trends PowerPoint Templates
Our multivariate data analysis surface chart plots trends Powerpoint Templates Heighten Concentration. Your Audience Will Be On The Edge.
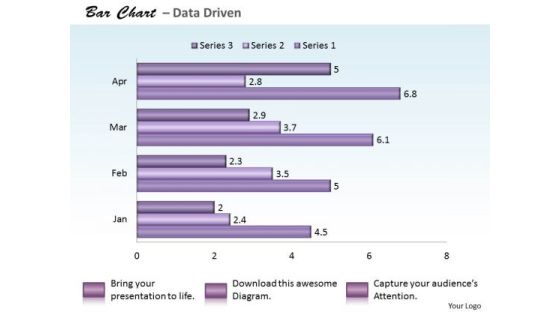
Quantitative Data Analysis Bar Chart For PowerPoint Templates
Reduce The Drag With Our quantitative data analysis bar chart for Powerpoint Templates . Give More Lift To Your Thoughts.

Data Analysis Techniques 3d Effective Display Chart PowerPoint Templates
Dribble Away With Our data analysis techniques 3d effective display chart Powerpoint Templates . Score A Goal With Your Ideas.
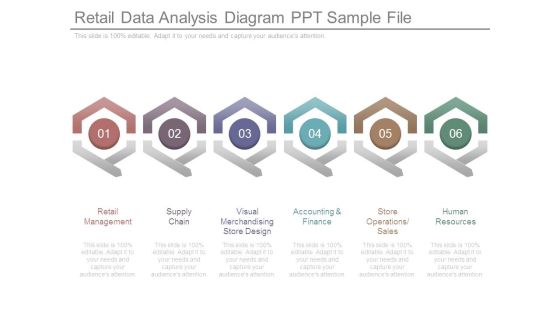
Retail Data Analysis Diagram Ppt Sample File
This is a retail data analysis diagram ppt sample file. This is a six stage process. The stages in this process are retail management, supply chain, visual merchandising store design, accounting and finance, store operations sales, human resources.
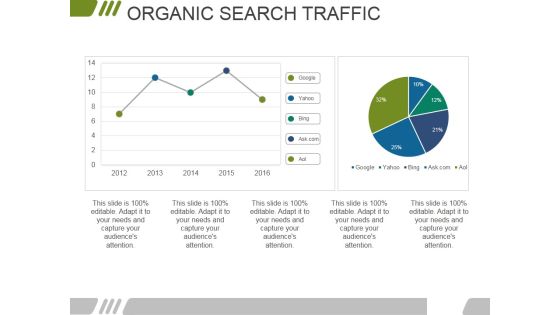
Organic Search Traffic Ppt PowerPoint Presentation Model Slideshow
This is a organic search traffic ppt powerpoint presentation model slideshow. This is a two stage process. The stages in this process are business, marketing, finance, management, organic.

Equity Funding And Debt Financing Pitchbook Key Financials Historical And Forecasted Slides PDF
The slide provides the historical current and previous year and projected for next five years financials of the company. Key Data points include revenue, operating income, net income, cash flow, cash in hand, total assets etc. Are you in need of a template that can accommodate all of your creative concepts This one is crafted professionally and can be altered to fit any style. Use it with Google Slides or PowerPoint. Include striking photographs, symbols, depictions, and other visuals. Fill, move around, or remove text boxes as desired. Test out color palettes and font mixtures. Edit and save your work, or work with colleagues. Download Equity Funding And Debt Financing Pitchbook Key Financials Historical And Forecasted Slides PDF and observe how to make your presentation outstanding. Give an impeccable presentation to your group and make your presentation unforgettable.

Global Business Sustainability Reporting Statistics Themes PDF
This slide highlights statistical data of global business for sustainability reporting to provide transparency on the companys contribution to sustainable development. It includes key components such as global business, top companies, globally followed corporate practices, etc. If you are looking for a format to display your unique thoughts, then the professionally designed Global Business Sustainability Reporting Statistics Themes PDF is the one for you. You can use it as a Google Slides template or a PowerPoint template. Incorporate impressive visuals, symbols, images, and other charts. Modify or reorganize the text boxes as you desire. Experiment with shade schemes and font pairings. Alter, share or cooperate with other people on your work. Download Global Business Sustainability Reporting Statistics Themes PDF and find out how to give a successful presentation. Present a perfect display to your team and make your presentation unforgettable.
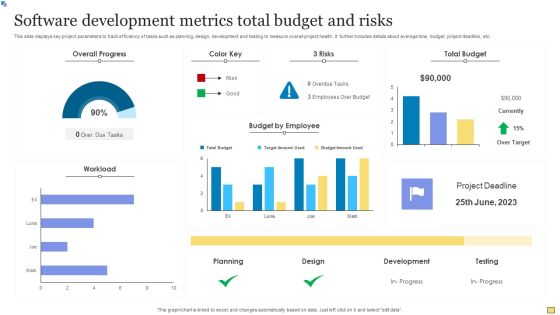
Software Development Metrics Total Budget And Risks Summary PDF
This slide displays key project parameters to track efficiency of tasks such as planning, design, development and testing to measure overall project health. It further includes details about average time, budget, project deadline, etc. Showcasing this set of slides titled Software Development Metrics Total Budget And Risks Summary PDF. The topics addressed in these templates are Overall Progress, Workload Employee, Total Budget. All the content presented in this PPT design is completely editable. Download it and make adjustments in color, background, font etc. as per your unique business setting.

Budget Report Ppt PowerPoint Presentation Backgrounds
This is a budget report ppt powerpoint presentation backgrounds. This is a four stage process. The stages in this process are project, incurred, future scheduled, budget, remaining.

Areas For Data Analytics Application With Icons Ppt PowerPoint Presentation Gallery Inspiration PDF
Persuade your audience using this areas for data analytics application with icons ppt powerpoint presentation gallery inspiration pdf. This PPT design covers six stages, thus making it a great tool to use. It also caters to a variety of topics including manufacturing, e commerce, finance . Download this PPT design now to present a convincing pitch that not only emphasizes the topic but also showcases your presentation skills.

Data Analytics Management Big Data Management In Healthcare Department Infographics PDF
This slide represents the application of big data in the healthcare department and benefits diagnostics, medicine prevention, medical research, and cost reduction.Deliver and pitch your topic in the best possible manner with this Data Analytics Management Big Data Management In Healthcare Department Infographics PDF. Use them to share invaluable insights on Preventing Medicine, Precision Medicine, Medical Research and impress your audience. This template can be altered and modified as per your expectations. So, grab it now.
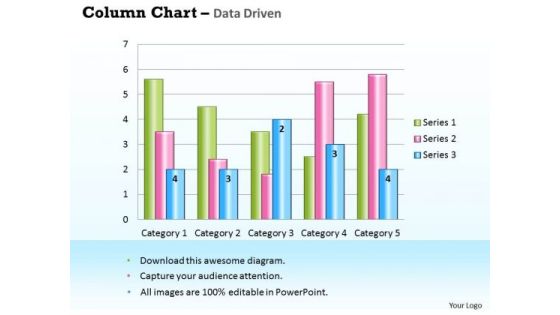
Business Data Analysis Chart For Case Studies PowerPoint Templates
Get Out Of The Dock With Our business data analysis chart for case studies Powerpoint Templates. Your Mind Will Be Set Free.
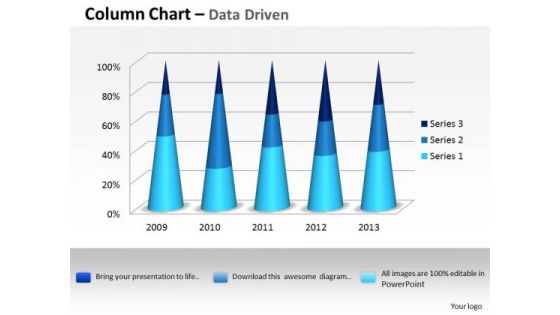
Data Analysis Excel 3d Process Variation Column Chart PowerPoint Templates
Put In A Dollop Of Our data analysis excel 3d process variation column chart Powerpoint Templates. Give Your Thoughts A Distinctive Flavor.
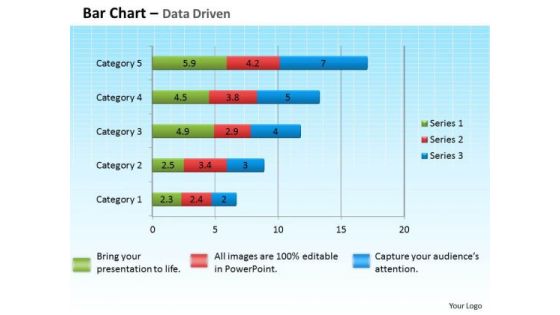
Data Analysis Excel Bar Graph To Compare PowerPoint Templates
Get The Domestics Right With Our data analysis excel bar graph to compare Powerpoint Templates. Create The Base For Thoughts To Grow.

Data Analysis Excel Bubble Chart For Business Tasks PowerPoint Templates
Doll Up Your Thoughts With Our data analysis excel bubble chart for business tasks Powerpoint Templates. They Will Make A Pretty Picture.

Data Analysis In Excel 3d Classification Of Chart PowerPoint Templates
With Our data analysis in excel 3d classification of chart Powerpoint Templates You Will Be Doubly Sure. They Possess That Stamp Of Authority.
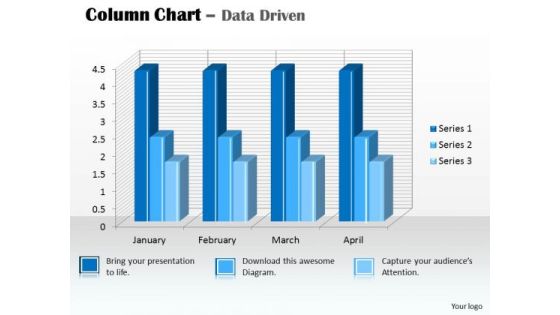
Data Analysis In Excel 3d Column Chart For PowerPoint Templates
Our data analysis in excel 3d column chart for Powerpoint Templates And Your Ideas Make A Great Doubles Pair. Play The Net With Assured Hands.

Data Analysis In Excel Of Stock Chart PowerPoint Templates
Plan Your Storyboard With Our data analysis in excel of stock chart Powerpoint Templates . Give An Outline To The Solutions You Have.

Data Analysis Programs 3d Bar Chart To Dispaly PowerPoint Templates
Lower The Drawbridge With Our data analysis programs 3d bar chart to dispaly Powerpoint Templates . Capture The Minds Of Your Audience.
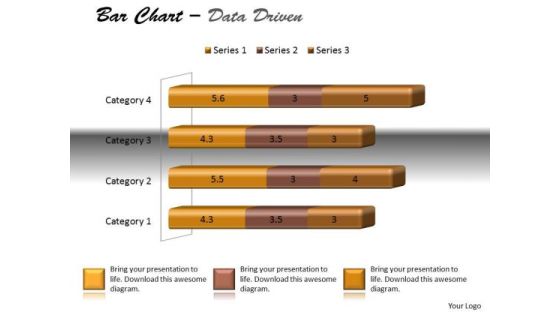
Data Analysis Techniques 3d Bar Chart For Modification PowerPoint Templates
Dreams Generate Thoughts, Thoughts Generate Ideas. Give Them Life With Our data analysis techniques 3d bar chart for modification Powerpoint Templates .
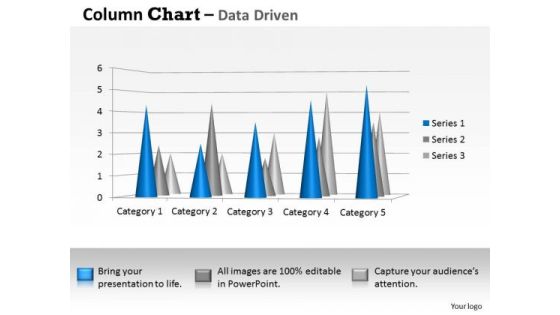
Data Analysis Techniques 3d Distribution Of In Sets PowerPoint Templates
Your Thoughts Will Be The Main Course. Provide The Dressing With Our data analysis techniques 3d distribution of in sets Powerpoint Templates .

Data Analysis Techniques 3d Graphical Presentation Of PowerPoint Templates
Our data analysis techniques 3d graphical presentation of Powerpoint Templates Will Follow The Drill. They Accomplish The Task Assigned To Them.

Data Analysis Techniques 3d In Segments Pie Chart PowerPoint Templates
Drink To The Success Of Your Campaign. Our data analysis techniques 3d in segments pie chart Powerpoint Templates Will Raise A Toast.

Data Analysis Template Driven Visualization Area Chart PowerPoint Slides Templates
Draw On The Energy Of Our data analysis template driven visualization area chart powerpoint slides Templates . Your Thoughts Will Perk Up.

Financial Data Analysis Area Chart For Showing Trends PowerPoint Templates
Document Your Views On Our financial data analysis area chart for showing trends Powerpoint Templates . They Will Create A Strong Impression.
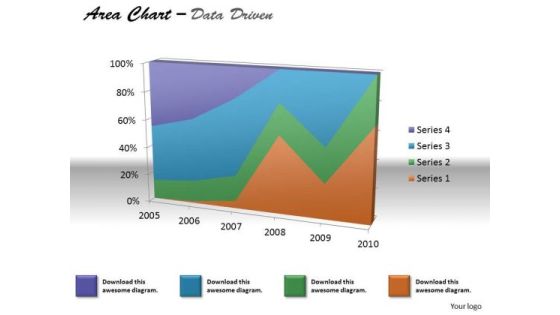
Financial Data Analysis Area Chart For Various Values PowerPoint Templates
Document The Process On Our financial data analysis area chart for various values Powerpoint Templates . Make A Record Of Every Detail.
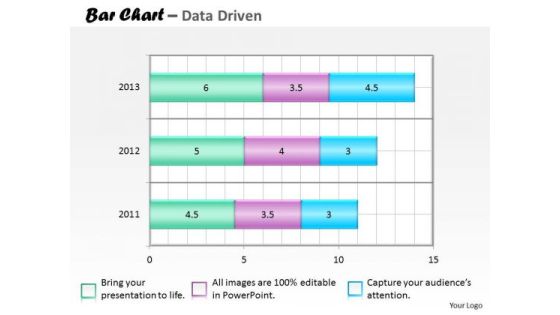
Financial Data Analysis Bar Chart For Collection Of PowerPoint Templates
Our financial data analysis bar chart for collection of Powerpoint Templates Team Are A Dogged Lot. They Keep At It Till They Get It Right.

Financial Data Analysis Currency Trading Bar Chart PowerPoint Templates
Put In A Dollop Of Our financial data analysis currency trading bar chart Powerpoint Templates . Give Your Thoughts A Distinctive Flavor.
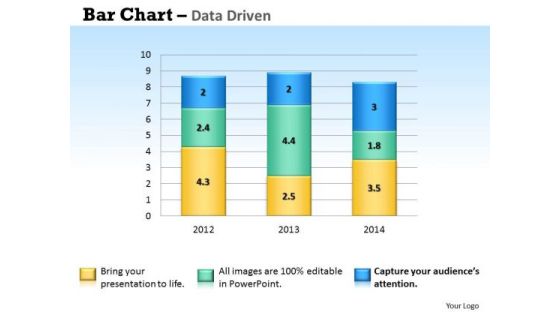
Microsoft Excel Data Analysis Bar Chart To Handle PowerPoint Templates
Our microsoft excel data analysis bar chart to handle Powerpoint Templates And Your Ideas Make A Great Doubles Pair. Play The Net With Assured Hands.

Microsoft Excel Data Analysis Bar Graph PowerPoint Templates
Double The Impact With Our microsoft excel data analysis bar graph Powerpoint Templates . Your Thoughts Will Have An Imposing Effect.
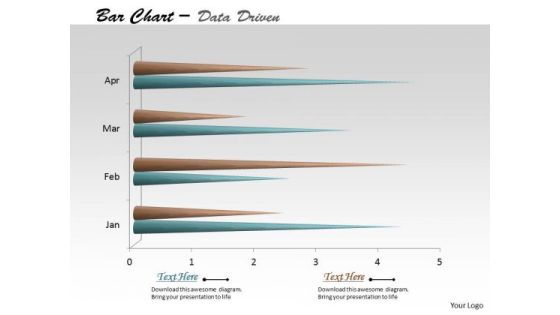
Multivariate Data Analysis Time Based Bar Chart PowerPoint Templates
Edit Your Work With Our multivariate data analysis time based bar chart Powerpoint Templates . They Will Help You Give The Final Form.
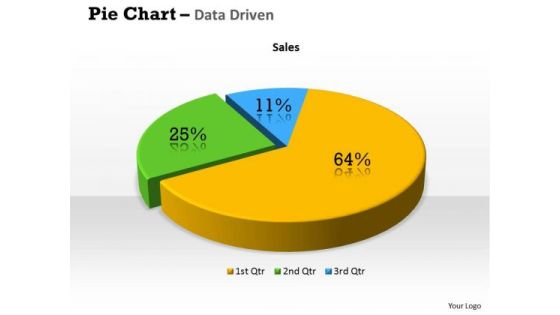
Quantitative Data Analysis 3d Percentage Ratio Pie Chart PowerPoint Templates
Plan Your Storyboard With Our quantitative data analysis 3d percentage ratio pie chart Powerpoint Templates . Give An Outline To The Solutions You Have.

Quantitative Data Analysis Bar Chart For Different Categories PowerPoint Templates
Make Some Dough With Our quantitative data analysis bar chart for different categories Powerpoint Templates . Your Assets Will Rise Significantly.

Business Data Analysis Chart Comparing Multiple Entities PowerPoint Templates
Analyze Ailments On Our business data analysis chart comparing multiple entities Powerpoint Templates. Bring Out The Thinking Doctor In You. Dock Your Thoughts With Our Financial Analysis . They Will Launch Them Into Orbit.
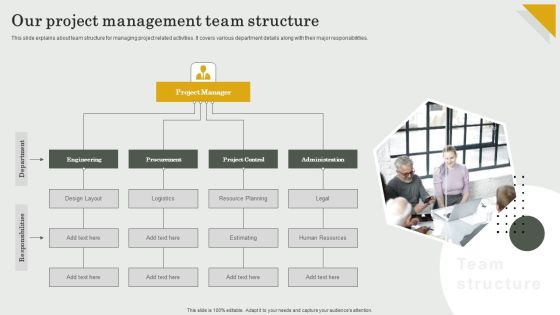
Submission Of Project Viability Report For Bank Loan Our Project Management Team Structure Sample PDF
Whether you have daily or monthly meetings, a brilliant presentation is necessary. Submission Of Project Viability Report For Bank Loan Our Project Management Team Structure Sample PDF can be your best option for delivering a presentation. Represent everything in detail using Submission Of Project Viability Report For Bank Loan Our Project Management Team Structure Sample PDF and make yourself stand out in meetings. The template is versatile and follows a structure that will cater to your requirements. All the templates prepared by Slidegeeks are easy to download and edit. Our research experts have taken care of the corporate themes as well. So, give it a try and see the results.

Data Quality Kpis Metrics Prerequisites With Key Parameters Introduction PDF
This slide covers prerequisites for data quality check to improve business productivity. It includes group of requirements such as range, scale, interpretation, cost, context and aggregation. Persuade your audience using this Data Quality Kpis Metrics Prerequisites With Key Parameters Introduction PDF. This PPT design covers Six stages, thus making it a great tool to use. It also caters to a variety of topics including Range, Scale, Interpretation. Download this PPT design now to present a convincing pitch that not only emphasizes the topic but also showcases your presentation skills.
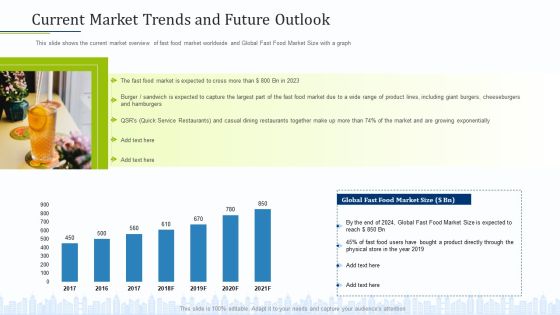
Pitch Deck To Draw External Capital From Commercial Banking Institution Current Market Trends And Future Outlook Background PDF
This slide shows the current market overview of fast food market worldwide and Global Fast Food Market Size with a graph Deliver an awe-inspiring pitch with this creative pitch deck to draw external capital from commercial banking institution current market trends and future outlook background pdf bundle. Topics like global fast food market size, global fast food market size is expected, exponentially can be discussed with this completely editable template. It is available for immediate download depending on the needs and requirements of the user.
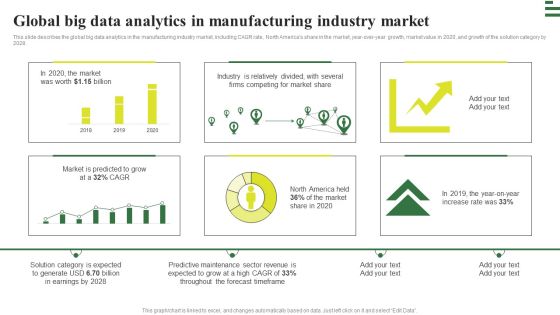
Transforming Manufacturing With Automation Global Big Data Analytics Rules PDF
This slide describes the global big data analytics in the manufacturing industry market, including CAGR rate, North Americas share in the market, year-over-year growth, market value in 2020, and growth of the solution category by 2028. Are you in need of a template that can accommodate all of your creative concepts This one is crafted professionally and can be altered to fit any style. Use it with Google Slides or PowerPoint. Include striking photographs, symbols, depictions, and other visuals. Fill, move around, or remove text boxes as desired. Test out color palettes and font mixtures. Edit and save your work, or work with colleagues. Download Transforming Manufacturing With Automation Global Big Data Analytics Rules PDF and observe how to make your presentation outstanding. Give an impeccable presentation to your group and make your presentation unforgettable.

Business Unit Team Objectives Powerpoint Ideas
This is a business unit team objectives powerpoint ideas. This is a four stage process. The stages in this process are team, team goals, engineering, product, marketing, sales, support, finance admin.
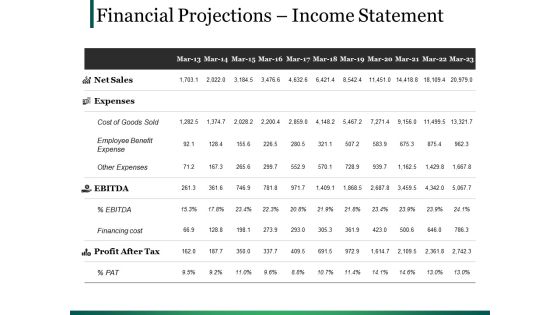
Financial Projections Income Statement Ppt PowerPoint Presentation Model Format
This is a financial projections income statement ppt powerpoint presentation model format. This is a two stage process. The stages in this process are tables, marketing, planning, strategy, finance.

Data Analytics Management Budget Planning For Big Data Strategy Guidelines PDF
This slide depicts the budget planning for big data and spending on IT solutions, existing staff, hiring process, external technical consulting, and spending on a line of business.Deliver an awe inspiring pitch with this creative Data Analytics Management Budget Planning For Big Data Strategy Guidelines PDF bundle. Topics like Increased Budget, Training Of Existing, Increase Creation can be discussed with this completely editable template. It is available for immediate download depending on the needs and requirements of the user.

Human Resource Key Performance Indicators Ppt PowerPoint Presentation Gallery Introduction PDF
Pitch your topic with ease and precision using this human resource key performance indicators ppt powerpoint presentation gallery introduction pdf. This layout presents information on training, cost, occupation. It is also available for immediate download and adjustment. So, changes can be made in the color, design, graphics or any other component to create a unique layout.

Cost Saving Benefits Of Implementing Data Center Data Center Relocation Benefits To The Company Designs PDF
The following slide shows the benefits of data center relocation to the company such as increase in overall data center efficiency, reduction in data center expenses and increase in overall data security. Are you in need of a template that can accommodate all of your creative concepts This one is crafted professionally and can be altered to fit any style. Use it with Google Slides or PowerPoint. Include striking photographs, symbols, depictions, and other visuals. Fill, move around, or remove text boxes as desired. Test out color palettes and font mixtures. Edit and save your work, or work with colleagues. Download Cost Saving Benefits Of Implementing Data Center Data Center Relocation Benefits To The Company Designs PDF and observe how to make your presentation outstanding. Give an impeccable presentation to your group and make your presentation unforgettable.

Functions Of Integrated Debt Management Performed By Banking Middle Office Infographics PDF
This slide represents the integrated debt management office functions performed by front, middle and back office. It includes various functions of middle office such as cash flow forecasting, external reporting, risk monitoring etc. Presenting Functions Of Integrated Debt Management Performed By Banking Middle Office Infographics PDF to dispense important information. This template comprises three stages. It also presents valuable insights into the topics including Front Office, Middle Office, Back Office. This is a completely customizable PowerPoint theme that can be put to use immediately. So, download it and address the topic impactfully.

 Home
Home