Investment Banking

Business Diagram Bar Graph For Growth And Progress Presentation Template
This business slide has been designed with graphics of bar chart. You may download this diagram to display concepts like growth, progress and success in business. Download this diagram slide to make impressive presentations.

Business Diagram Bars For Profit Percentages Presentation Template
Download this exclusive business diagram to present profit in percentage ratio. This slide contains the graphic of bars. This diagram can be useful for business presentations.
Business Diagram Icons Around Pie Chart Presentation Template
Strategy and planning can be displayed with this business diagram. This slide contains the graphic of icons around pie chart Use this editable slide to build quality presentation for your viewers.

Arrow Steps For Management Development PowerPoint Template
This business diagram has been designed with four arrows with icons. It may use to display steps for management development. Prove the viability of your ideas to help your organization to achieve the quality and success required.
Circles With Icons For Communication PowerPoint Template
The above template displays a diagram of circles with icons. This diagram has been professionally designed to emphasize on concept of competitive strategy. Grab centre stage with this slide. Capture the attention of your audience.
Business Diagram Icons And Charts For Business Growth Presentation Template
Our above slide contains graphics of business charts and icons. It helps to display business reports and analysis. Use this diagram to impart more clarity to data and to create more sound impact on viewers.
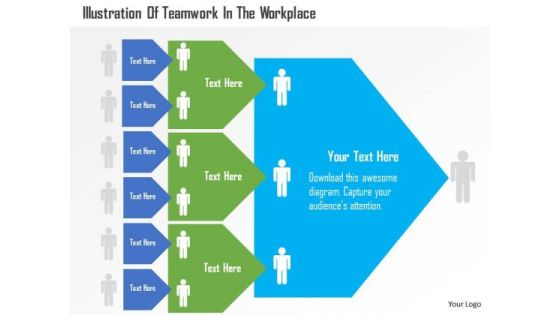
Business Diagram Illustration Of Teamwork In The Workplace Presentation Template
Our above business diagram illustrates teamwork in workplace. This slide is suitable for teamwork related presentations. Use this business diagram to present your work in a more smart and precise manner.

Business Diagram Matrix Chart For Financial Review Presentation Template
Our above business diagram has been designed with graphics of matrix chart. This slide is suitable to present financial review. Use this business diagram to present your work in a more smart and precise manner.

Timeline With Year Based Analysis And Business Apps PowerPoint Template
Create dynamic presentations with our professional template containing graphics of timeline with business icons. This diagram may be used to display planning and analysis. Download this template to leave permanent impression on your audience.
Icons For Cloud Computing PowerPoint Template
Develop competitive advantage with our above template which contains a diagram of cloud network. This diagram may used to depict concepts like cloud computing and technology. This slide provides an effective way of displaying information.

Pie Chart For Financial Ratio Analysis PowerPoint Template
Deliver amazing presentations with our above template showing pie chart. You may download this slide to display financial ratio analysis. Capture the attention of your audience using this diagram.
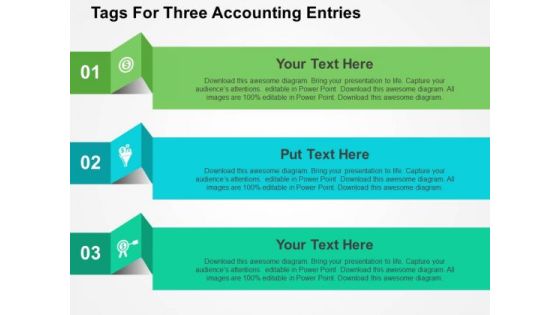
Tags For Three Accounting Entries PowerPoint Template
Visually support your presentation with our above template showing graphics of three tags. This slide has been professionally designed to display accounting entries. This template offers an excellent background to build impressive presentation.
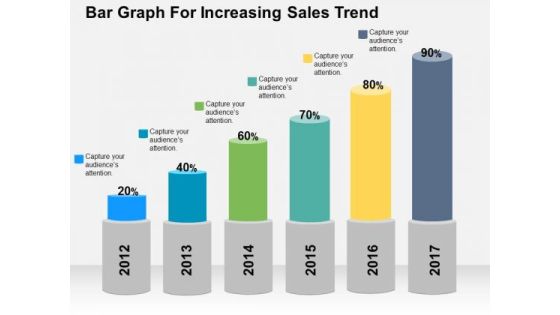
Bar Graph For Increasing Sales Trend PowerPoint Template
Deliver amazing presentations with our above template showing bar graph with percentage values. You may download this slide to depict increase in sales trends. Capture the attention of your audience using this diagram.
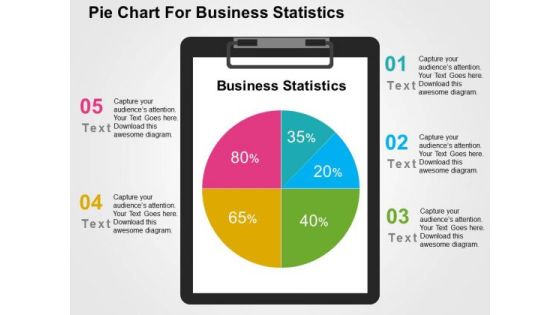
Pie Chart For Business Statistics PowerPoint Template
Visually support your presentation with our above template showing pie chart. This slide has been professionally designed to present business statistics. This template offers an excellent background to build impressive presentation.

Business Man Draws Financial Data For Analysis PowerPoint Templates
This PowerPoint slide has a theme for financial data analysis. This image has been designed to display concept of financial planning and analysis. Deliver amazing presentations to mesmerize your audience using this image
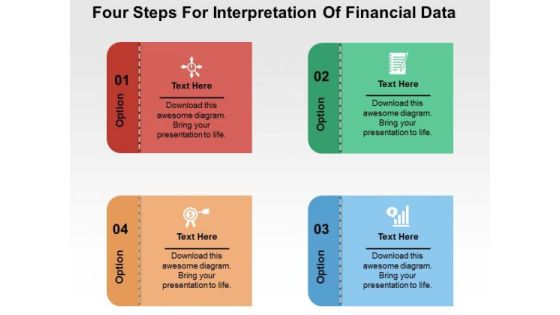
Four Steps For Interpretation Of Financial Data PowerPoint Templates
Our PPT above slide displays graphics of four text boxes with icons. This template may be used to depict interpretation of financial data. You can present your opinions using this impressive slide.

Scorecard For Companys Performance And Financial Condition PowerPoint Templates
Use this PPT slide to display companies performance financial planning. This slide contains graphics of circular scorecard. Trigger the imagination of your audience with this professional diagram.

Bars Displaying Percentage Growth PowerPoint Templates
Our above PPT slide contains bar graph displaying percentage growth. This diagram of bar graph helps to depict statistical information. Use this diagram to impart more clarity to data and to create more sound impact on viewers.
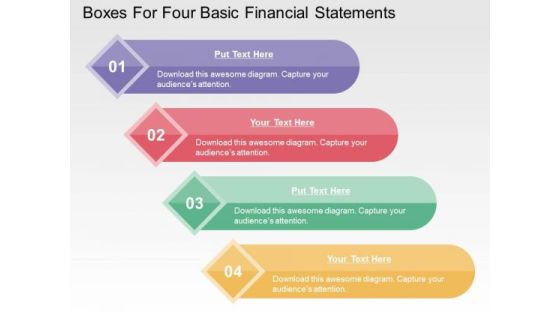
Boxes For Four Basic Financial Statements PowerPoint Templates
This business slide contains graphics of four text boxes. This diagram is suitable to present four basic financial statements. Visual effect of this diagram helps in maintaining the flow of the discussion and provides more clarity to the subject.

Graph Showing Economy Crash PowerPoint Templates
This business slide contains design of graph. This diagram is suitable to present downfall and economy crash. Visual effect of this diagram helps in maintaining the flow of the discussion and provides more clarity to the subject.
Hexagons With Business Icons PowerPoint Templates
This PowerPoint slide contains hexagons with business icons. This diagram is designed to make impressive presentations on various business processes. This professional slide helps in making an instant impact on viewers.

Illustration Of Dollar Growth Graph PowerPoint Template
This business slide contains graphics of dollar symbols on graph. This diagram helps to portray concept of financial planning. Present your views using this innovative slide and be assured of leaving a lasting impression.

Infographic For Mission Vision And Values PowerPoint Template
This slide contains the infographic diagram. Download this exclusive business diagram to present business mission, vision and values. This diagram can be useful for business presentations.
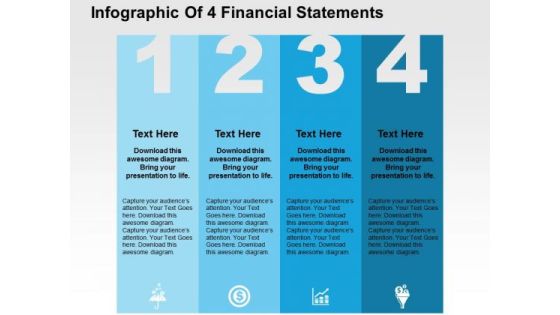
Infographic Of 4 Financial Statements PowerPoint Template
Four financial statements can be displayed in this business diagram. This slide contains the graphic of four text boxes with icons Use this editable slide to build quality presentation for your viewers.
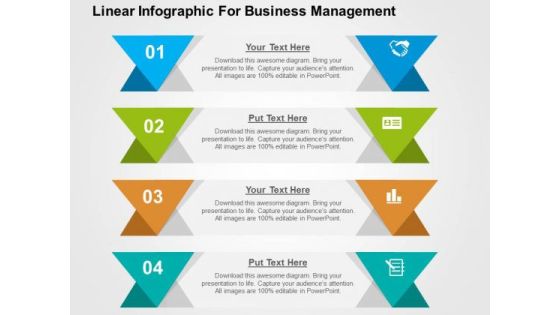
Linear Infographic For Business Management PowerPoint Template
Graphic of tags in linear flow has been used to design this business diagram. This diagram slide may be used to depict business steps in linear flow. Download this diagram for business research and analysis.
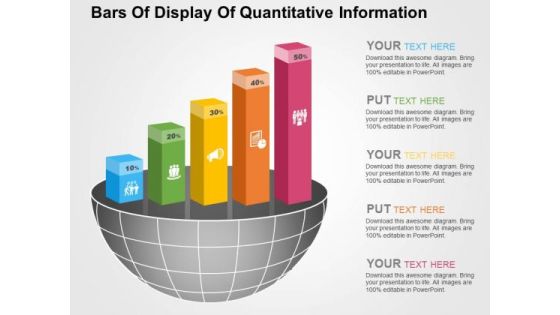
Bars Of Display Of Quantitative Information PowerPoint Templates
Visually support your presentation with our above template illustrating quantitative information. It contains graphics of bars. Etch your views in the brains of your audience with this diagram slide.
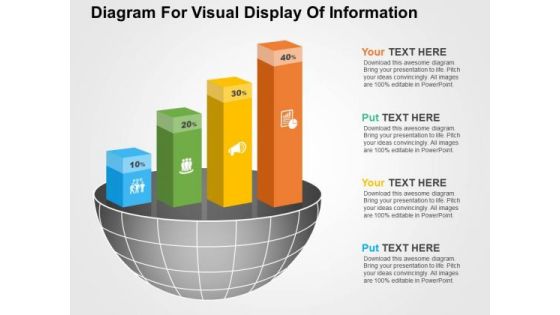
Diagram For Visual Display Of Information PowerPoint Templates
Visually support your presentation with our above template illustrating quantitative information. It contains graphics of bars. Etch your views in the brains of your audience with this diagram slide.

Four Staged Arrows Design PowerPoint Templates
This PowerPoint template has been designed with arrows infographic. You can easily impart your information with help of this PowerPoint template. The slide can be customized as per requirements of business education or any other theme.

Percentage Data Growth Chart Powerpoint Slides
This PowerPoint template has been designed with percentage data growth chart. Download this PPT chart to depict financial ratio analysis. This PowerPoint slide is of great help in the business sector to make realistic presentations and provides effective way of presenting your newer thoughts.
Four Pencils Bar Graph And Icons Powerpoint Template
Develop competitive advantage with our above template which contains a diagram of five pencils bar graph. This diagram provides an effective way of displaying business information. You can edit text, color, shade and style as per you need.

Circular Steps For Market Entry Strategy Powerpoint Slides
This PowerPoint template contains graphics of circular steps. You may download this PPT slide design to display market entry strategy. You can easily customize this template to make it more unique as per your need.

Bar Graph For Statistical Analysis Powerpoint Slides
This PowerPoint template has been designed with bar chart and percentage values. You may download this PPT slide to depict statistical analysis. Add this slide to your presentation and impress your superiors.

Battery Chart With Percentage Values For Comparison PowerPoint Slides
This year?s sales has matched up with your expectations. Now match this slide with your presentation to show the same. Show your company?s performance or business growth with this four staged battery chart PowerPoint template. With this slide, you can easily convince your colleagues how your company gave a tremendous growth over the years or months. Perfect illustration to show that the targets are achieved. This PPT template is easy to edit. You can choose the color of your choice. Your colleagues are already impressed with the sales growth. Now impress others and choose this PPT innovative designed template.

Dashboard With Increasing Values Powerpoint Slides
This innovative, stunningly beautiful dashboard has been designed for data visualization. It contains pie charts with increasing percentage values. This PowerPoint template helps to display your information in a useful, simple and uncluttered way.
Steps For Setting Up Your Business Powerpoint Template
Our compelling template consists with diagram of text boxes. This slide has been professionally designed to display text information. This template offers an excellent background to build impressive presentation.

Circle Chart For Value Analysis Powerpoint Slides
This PowerPoint template has been designed for business presentations and corporate slides. The PowerPoint template has a high quality design. You can download this PowerPoint slide for corporate presentations or annual meeting and business plans.

Target Chart For Strategic Management Process Powerpoint Slides
This PowerPoint template has been designed with four steps target chart. The PowerPoint template may be used to display strategic management process. You can download this PowerPoint slide for corporate presentations or annual meeting and business plans.
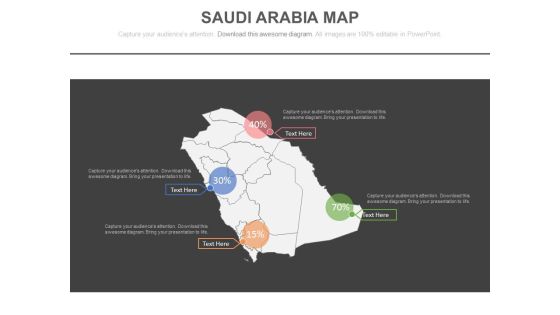
Saudi Arabia Map For Financial Strategy Analysis Powerpoint Slides
This PowerPoint template has been designed with Saudi Arabia Map. You may use this slide to display financial strategy analysis. This diagram provides an effective way of displaying information you can edit text, color, shade and style as per you need.
Saudi Arabia Map With Percentage Values And Icons Powerpoint Slides
This PowerPoint template has been designed with Saudi Arabia Map with percentage values and icons. You may use this slide to display financial strategy analysis. This diagram provides an effective way of displaying information you can edit text, color, shade and style as per you need.

Bar Graph For Year Based Analysis Powerpoint Slides
This PowerPoint template has been designed with year based bar graph. This diagram may be used to display yearly statistical analysis. Use this PPT slide design to make impressive presentations.

Bar Graph With Five Icons Powerpoint Slides
This PowerPoint slide contains diagram bar graph with icons. This PPT slide helps to exhibit concepts of financial deal and planning. Use this business slide to make impressive presentations.

Business Steps Diagram With Icons Powerpoint Slides
Visually support your presentation with our above template containing graphics of stairs diagram. It helps to portray directions of business actions. Etch your views in the brains of your audience with this diagram slide.

Checklist With Financial Planning Icons Powerpoint Slides
This PowerPoint template contains business checklist with icons. Download this diagram slide to display financial planning and analysis. Etch your views in the brains of your audience with this diagram slide.

Circle Chart With Percentage Value Analysis Powerpoint Slides
This PowerPoint template has been designed with circular process diagram. This business diagram helps to exhibit financial process control and analysis. Use this diagram to visually support your content.
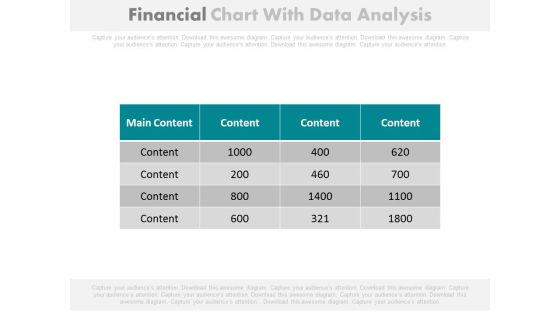
Financial Figures Data Analysis Report Powerpoint Slides
Our above PowerPoint template contains table chart with financial figures. This professional slide may be used to display data analysis report. Enlighten your audience with your breathtaking ideas.
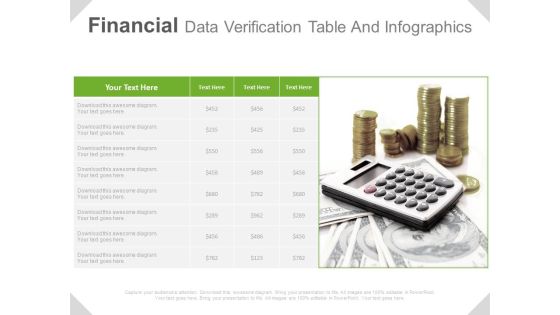
Financial Planning Table Infographic Diagram Powerpoint Slides
This PowerPoint template has been designed with table infographic diagram. This business slide is suitable for financial planning. Use this PPT slide to build an exclusive presentation.
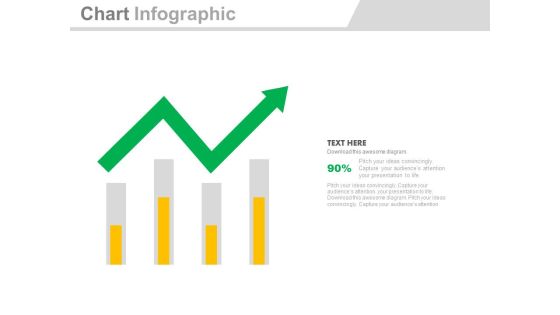
Four Bars With Green Growth Arrow Powerpoint Slides
Four bars with green arrow have been displayed in this business slide. This business diagram helps to exhibit process of business planning. Use this diagram to build an exclusive presentation.

Four Circles With Percentage Data Display Powerpoint Slides
This PowerPoint template has been designed with graphics of four circles. Download this PPT slide to display percentage data display. Use this professional template to build an exclusive presentation.
Four Colored Text Boxes With Icons Powerpoint Slides
This PowerPoint template has been designed with graphics of four text boxes. Download this PPT slide to display percentage data display. Use this professional template to build an exclusive presentation.
Four Linear Steps And Icons Powerpoint Slides
This PPT slide has been designed with four linear text boxes with icons. This PowerPoint template helps to exhibit process of business planning. Use this diagram slide to build an exclusive presentation.
Four Steps Financial Chart With Icons Powerpoint Slides
This business slide illustrates four steps financial chart. This PowerPoint template helps to exhibit process flow steps. Use this PowerPoint slide to build an exclusive presentation.

Four Steps For Organizational Learning Methods Powerpoint Slides
Four text boxes have been displayed in this business slide. This PowerPoint template helps to exhibit organizational learning methods. Use this diagram slide to build an exclusive presentation.

Four Tags For Financial Review And Analysis Powerpoint Slides
This PowerPoint template has been designed with four tags and financial values. This PowerPoint template helps to exhibit financial review and analysis. Use this diagram slide to build an exclusive presentation.
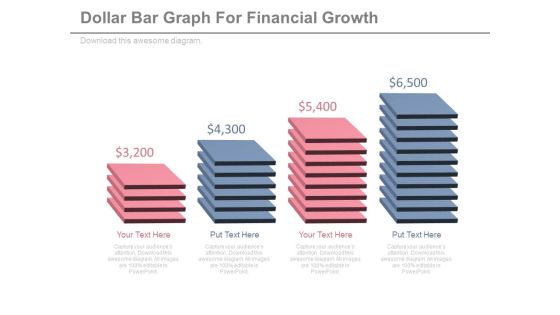
Illustration Of Dollar Value Slabs Powerpoint Slides
Pricing slabs have been displayed in this business slide. This PowerPoint template helps to exhibit financial growth process. Use this diagram slide to build an exclusive presentation.

Infographic Diagram For Business Process Analysis Powerpoint Slides
This PowerPoint slide contains business infographic diagram. This professional slide may be used to display business process analysis. Use this business template to make impressive presentations.
Mountain Chart With Social Media Icons Powerpoint Slides
The above PPT template displays mountain chart with social media icons. This PowerPoint template has been designed to exhibit users of social media. Download this PPT slide to attract the attention of your audience.

Pie Chart For Financial Ratio Analysis Powerpoint Slides
This PPT slide contains graphics of eight stage pie chart. Download this PowerPoint template slide for financial ratio analysis. This diagram is editable you can edit text, color, shade and style as per you need.
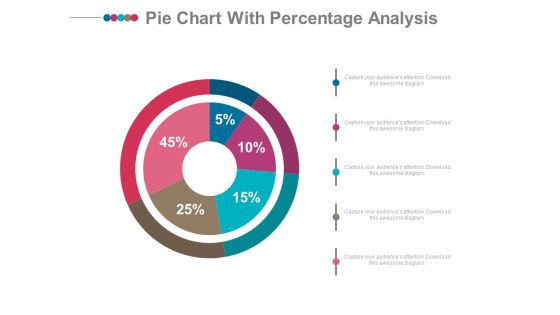
Pie Chart With Financial Data Comparison Powerpoint Slides
Emphatically define your message with our above template which contains graphics of pie chart. This PowerPoint template may be used to display financial data comparison. Grab the attention of your listeners with this slide.
Process Flow Diagram With Business Icons Powerpoint Slides
Emphatically define your message with our above infographic template. This PowerPoint template may be used to display business process flow. Grab the attention of your listeners with this slide.
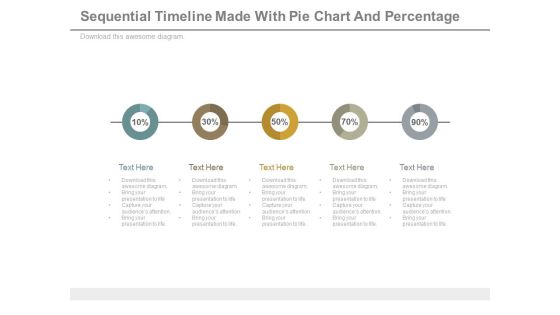
Sequential Timeline Diagram With Percentage Values Powerpoint Slides
This diagram contains graphics of linear circles timeline diagram. Download this diagram slide to display business planning and management. This diagram is editable you can edit text, color, shade and style as per you need.
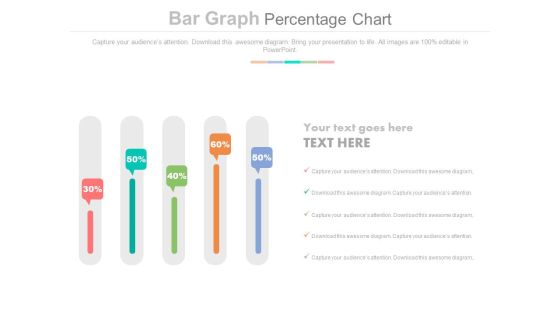
Sliders Percentage Data Chart Powerpoint Slides
This PowerPoint slide has been designed with slider chart and percentage data. This PPT diagram may be used to display business trends. This diagram slide can be used to make impressive presentations.
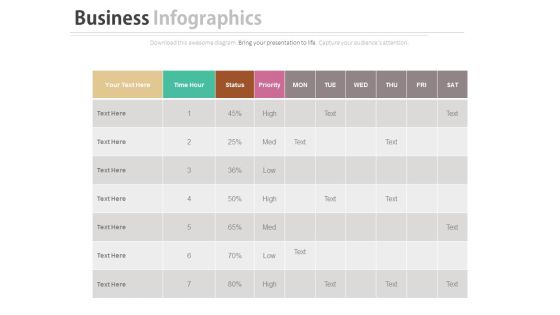
Work Sheet For Daily Activity Plan Schedule Powerpoint Slides
Our above business slide contains graphics of daily worksheet. This PowerPoint slide may be used to exhibit activity plan and schedule. Capture the attention of your audience with this slide.
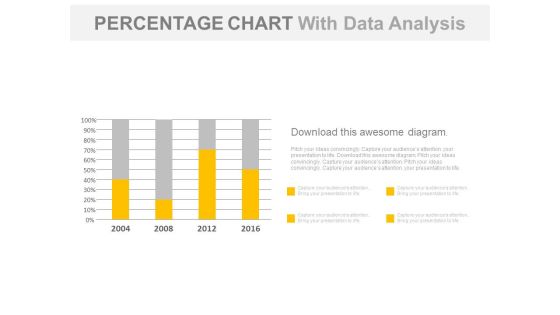
Year Based Chart With Percentage Data Analysis Powerpoint Slides
Our above business slide contains year based statistical chart. This PowerPoint template can be used to display percentage data analysis. Capture the attention of your audience with this slide.

Four Steps For Financial Data Analysis Powerpoint Slides
This PowerPoint contains four circles with percentage values. Download this diagram slide to display financial data analysis. This template is editable, You can edit text, color, shade and style of this diagram as per you need.

Parameters Of Growth And Development Powerpoint Slides
Dashboard design has been displayed in this business slide. This business diagram helps to exhibit parameters of growth and development. Download this PowerPoint template to build an exclusive presentation.
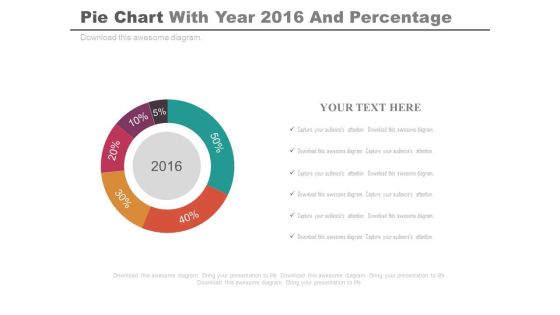
Pie Chart For Projected Profit Of 2016 Powerpoint Slides
Our above PPT slide displays graphics of Pie chart. This PowerPoint template may be used to display projected profit report of 2016. Download this template to leave permanent impression on your audience.
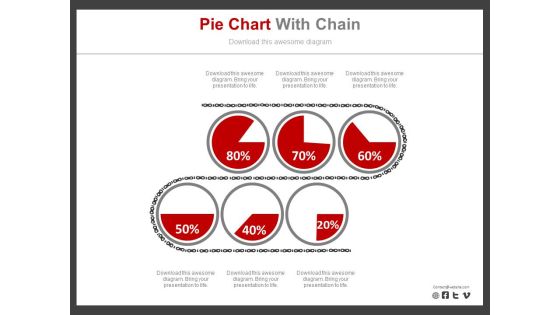
Six Pie Charts For Revenue Analysis Report Powerpoint Slides
Six pie charts have been displayed in this business slide. This business diagram helps to exhibit revenue analysis report. Download this PowerPoint template to build an exclusive presentation.

Circle Chart With Man And Woman Ratio Comparison Powerpoint Slides
This PowerPoint template has been designed with graphics of circle chart. You may download this PPT slide to depict man and woman ratio analysis. Add this slide to your presentation and impress your superiors.

Four Months Sales Statistics Chart Powerpoint Slides
This PowerPoint template has been designed with four shopping bags with percentage values. Download this PPT slide to display four months sales statistics. Add this slide to your presentation and impress your superiors.
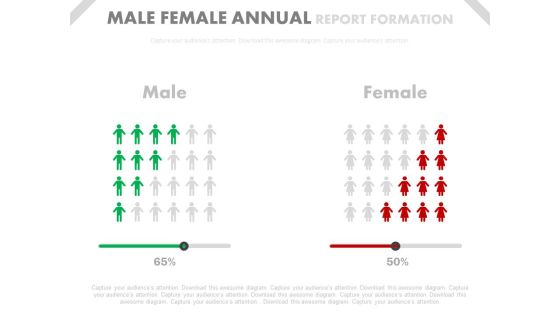
Male Female Ratio Comparison Chart Powerpoint Slides
This PowerPoint template has been designed with graphics of comparison chart. You may download this PPT slide to depict male female ratio comparison chart. Add this slide to your presentation and impress your superiors.

Red Green Teams Comparison Chart Powerpoint Slides
This PPT slide displays graphics of two red and green teams. Use this PPT design to display comparison of teams performances. This PowerPoint template can be customized as per requirements of business education or any other theme.

Test Tubes With Percentage Data For Comparison Powerpoint Slides
This PowerPoint template has been designed with test tubes and percentage data. You may download this PPT slide to display data comparison and analysis. Add this slide to your presentation and impress your superiors.

Bar Graph For Profit Growth Analysis Powerpoint Slides
This PowerPoint template has been designed with bar graph with percentage values. This diagram is useful to exhibit profit growth analysis. This diagram slide can be used to make impressive presentations.

Bar Graph For Yearly Statistical Analysis Powerpoint Slides
This PowerPoint template has been designed with bar graph. This PowerPoint diagram is useful to exhibit yearly statistical analysis. This diagram slide can be used to make impressive presentations.

Circular Diagram For Percentage Analysis Powerpoint Slides
This PowerPoint slide has been designed with circular diagram with social media icons. This diagram slide may be used to display users of social media. Prove the viability of your ideas with this professional slide.

Data Driven Comparison Charts For Analysis Powerpoint Slides
You can download this PowerPoint template to display statistical data and analysis. This PPT slide contains data driven comparison charts. Draw an innovative business idea using this professional diagram.
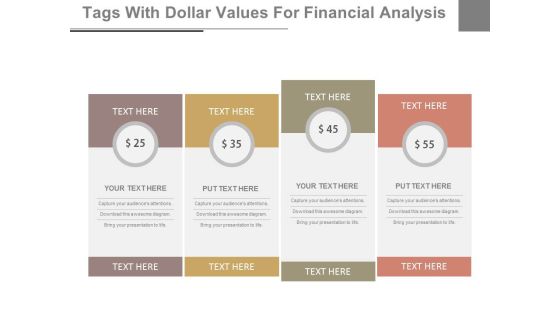
Dollar Value Pricing Table Powerpoint Slides
This PowerPoint template has been designed with dollar value pricing table chart. This PPT slide may be used for sample marketing proposal. Download this slide to build unique presentation.
Five Linear Circles And Icons For Technology Powerpoint Slides
This PowerPoint template has been designed with five linear circles and icons. This professional PPT slide is suitable to present technology growth steps. Capture the attention of your audience using this professional slide.

Five Steps Bar Graph For Financial Management Powerpoint Slides
This PowerPoint template has been designed with five steps bar graph and icons. This diagram is useful to exhibit financial management. This diagram slide can be used to make impressive presentations.
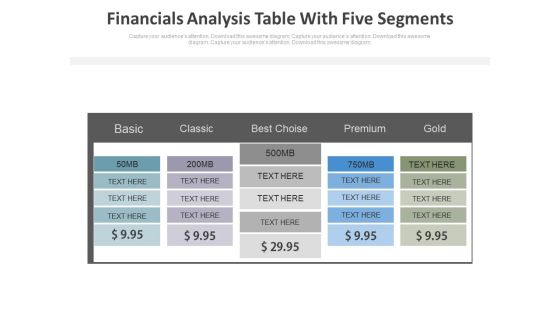
Five Steps Financial Analysis Table Powerpoint Slides
This PowerPoint template has been designed with dollar value pricing table chart. This PPT slide may be used for sample marketing proposal. Download this slide to build unique presentation.
Four Banners With Icons For Financial Planning Powerpoint Slides
The above PowerPoint template displays graphics of four text banners with icons. This diagram has been professionally designed to display steps of financial planning. Capture the attention of your audience.
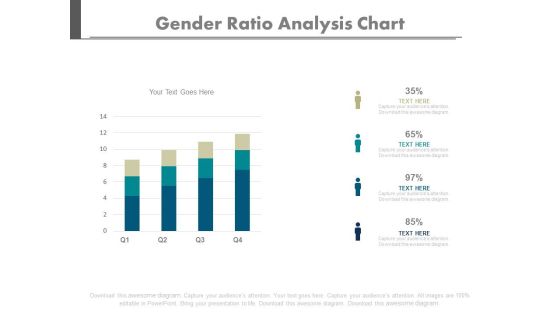
Four Bars Gender Population Ratio Chart Powerpoint Slides
Create dynamic presentations with our creative template of bar graph. This diagram may be used to present gender population. Download this template to leave permanent impression on your audience.

Four Circles Chart Financial Growth Steps Powerpoint Slides
Our professionally designed business diagram is as an effective tool for communicating cyclic processes. It contains circular graphics with icons. Above slide is suitable to display process management steps.
Four Clouds With Arrows And Icons Powerpoint Slides
This business slide displays diagram of four clouds with arrow and icons. Download this PowerPoint diagram to display technology development and management. Enlighten your audience with your breathtaking ideas.
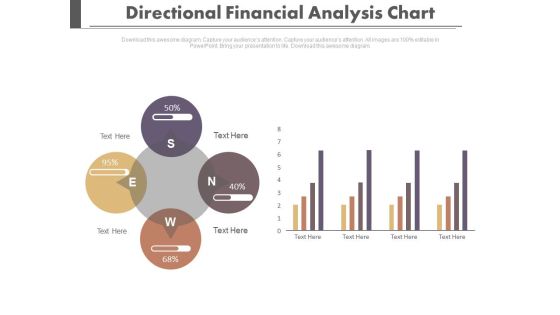
Four Directions Circular Analysis Chart Powerpoint Slides
Our professionally designed business diagram is as an effective tool for communicating business strategy. It contains four directional circular charts. Above slide is also suitable to display financial planning and strategy.

Four Dollar Value Financial Tags For Analysis Powerpoint Slides
This PowerPoint template has been designed with dollar value financial tags. This PPT slide may be used for sample marketing proposal. Download this slide to build unique presentation.

Four Options Circle Chart With Percentage Powerpoint Slides
This PowerPoint template has been designed with graphics of four options circle chart. This PowerPoint template may be used to display four steps of financial analysis. Prove the viability of your ideas using this impressive slide.

Four Pyramids With Growth Steps Powerpoint Slides
This business slide has been designed with four pyramids. This PowerPoint template may use to display sales growth and analysis. Prove the viability of your ideas using this impressive slide.
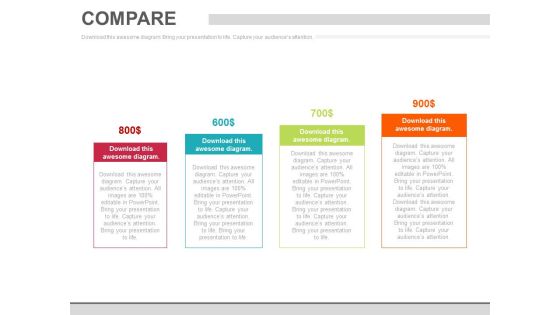
Four Steps Pricing Option Chart Powerpoint Slides
This PowerPoint template has been designed with dollar value pricing table chart. This PPT slide may be used for sample marketing proposal. Download this slide to build unique presentation.
Four Steps Pricing Table With Icons Powerpoint Slides
This PowerPoint template has been designed with dollar value pricing table chart. This PPT slide may be used for sample marketing proposal. Download this slide to build unique presentation.
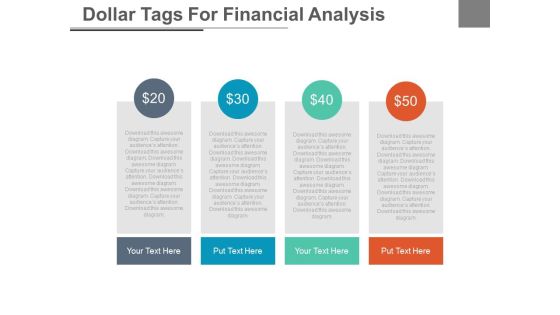
Four Tags With Dollar Values For Financial Analysis Powerpoint Slides
This PowerPoint template has been designed with dollar value pricing table chart. This PPT slide may be used for sample marketing proposal. Download this slide to build unique presentation.
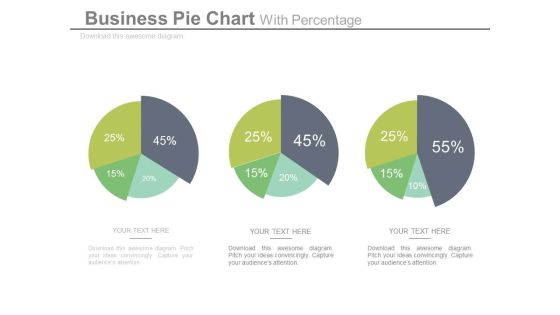
Pie Charts For Relative Comparison Study Powerpoint Slides
This power point template illustrates diagram of three pie charts with percentage values. This business slide can be used for relative comparison study. Present your views and ideas with this impressive slide.

Pricing Comparison Table For Analysis Powerpoint Slides
This PowerPoint template has been designed with pricing comparison table. This PowerPoint template may be used to present pricing strategy. Prove the viability of your ideas using this impressive slide.

Table Chart For Business Plan Powerpoint Slides
Table chart has been used to design this power point template. This diagram may be used to display business plan. Download this template to leave permanent impression on your audience.

Table For Total Sales Analysis Powerpoint Slides
This PowerPoint template has been designed with four steps table chart. Use this PPT slide to display total sales analysis. Download this template to leave permanent impression on your audience.
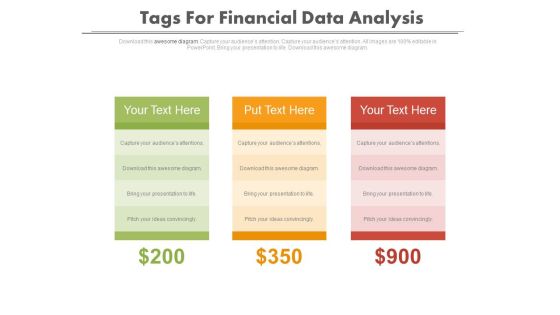
Tags For Financial Data Comparison Powerpoint Slides
Graphic of three text tag with dollar values has been used to design this power point template. This diagram may be used for financial data comparison. Use this diagram to build a professional presentation.

Tap With Water Drops Diagram Powerpoint Slides
This PowerPoint template has been designed with graphics of tap with water drops. Download this business diagram to display save water concept. Present your views and ideas with this impressive design.
Text Tags And Icons With Percentage Values Powerpoint Slides
This PowerPoint template has been designed with graphics of text tags, icons and percentage values. Download this business diagram to outline business plan. Present your views and ideas with this impressive design.
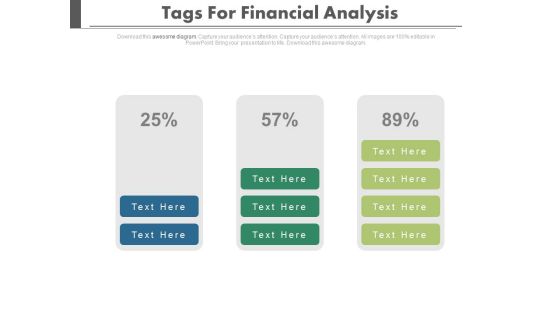
Three Stages Of Financial Growth Powerpoint Slides
Three stages of financial growth have been displayed in this power point template. This diagram helps to portray the concept of financial planning and analysis. Download this template to leave permanent impression on your audience.
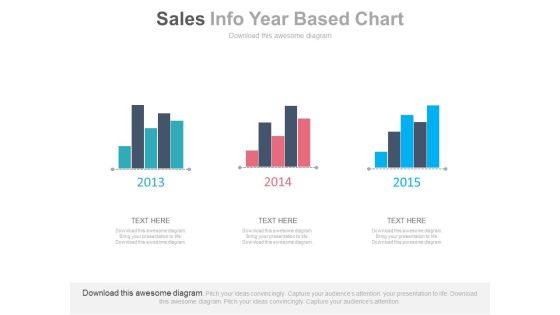
Three Years Sales Data Bar Graph Powerpoint Slides
This PowerPoint template has been designed with bar charts. This business slide may be used to display three years sales data for comparison. Present your views and ideas with this impressive design.

Triangle For Teams Performance Analysis Powerpoint Slides
This PPT slide displays graphics of triangle diagram with teams icons. Download this PowerPoint template for teams performances analysis. Use this PowerPoint template to emphasize your views.

Triangle With Two Segments And Percentage Values Powerpoint Slides
This PowerPoint template contains graphics of triangle with two segments and percentage values. You may use this PPT slide for financial planning. The color coding of this template is specifically designed to highlight you points.
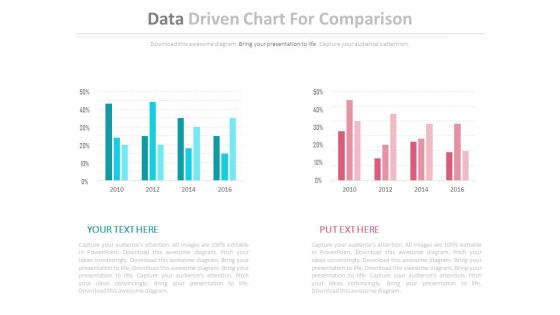
Two Data Driven Comparison Charts Powerpoint Slides
This PowerPoint template contains diagram of two data driven charts. You may use this PPT slide to depict strategic analysis for business. The color coding of this template is specifically designed to highlight you points.

Map Of Africa With Men And Women Gender Ratio Powerpoint Slides
This PowerPoint template displays graphics of Africa map with men women icons. This PPT template can be used to display gender ratio analysis. This slide can also be used by school students for educational projects.

Map Of Usa With Contact Us Text Powerpoint Slides
This PowerPoint template has been designed with USA Map and contact us text. You may use this slide to display contact details and location. This diagram provides an effective way of displaying information you can edit text, color, shade and style as per you need.
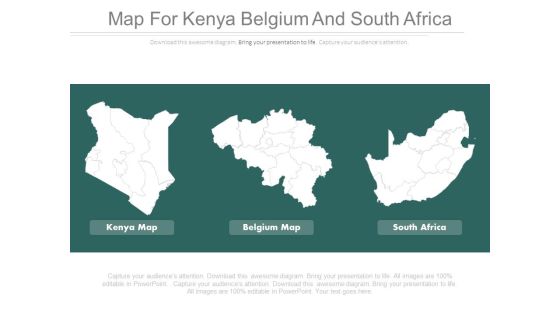
Maps For Kenya Belgium And South Africa Powerpoint Slides
This PowerPoint template has been designed with maps of Kenya, Belgium and South Africa. You may use this PPT slide depict area comparison of these three countries. Above slide provide ideal backdrop to make impressive presentations.

World Map With Four Option Tags Powerpoint Slides
This PowerPoint template has been designed with graphics of world map and four options tags. You can download this diagram to exhibit International business strategy. Above PPT slide is suitable for business presentation.

Bar Chart For Strategic Planning Powerpoint Slides
This PowerPoint template has been designed with bar graph with two teams. This diagram is useful to exhibit strategic planning. This diagram slide can be used to make impressive presentations.

Bar Graph For Data Distribution And Analysis Powerpoint Slides
This PowerPoint template has been designed with bar graph. This PowerPoint diagram is useful for data distribution and analysis This diagram slide can be used to make impressive presentations.

Bar Graph With Increasing Percentage Flow Powerpoint Slides
This PowerPoint slide has been designed with bar graph and increasing percentage values. This diagram slide may be used to display profit growth. Prove the viability of your ideas with this professional slide.

Board With Bar Graph For Financial Analysis Powerpoint Slides
You can download this PowerPoint template to display statistical data and analysis. This PPT slide contains display board with bar graph. Draw an innovative business idea using this professional diagram.

Chart For Financial Percentage Analysis Powerpoint Slides
This PowerPoint template has been designed with financial chart with dollar icon. This PPT slide may be used to display dollar value analysis chart. Download this slide to build unique presentation.

Digital Media And Teamwork For Business Powerpoint Slides
This PowerPoint template has been designed with media devices and team pictures. This professional PPT slide is suitable to present digital media and teamwork. Capture the attention of your audience using this professional slide.

Five Steps Linear Chart For Financial Growth Powerpoint Slides
This PowerPoint template has been designed with five steps linear chart. This PPT slide may be used to display financial planning and growth. Download this slide to build unique presentation.
Four Points Diagram With Business Icons Powerpoint Slides
The above PowerPoint template displays graphics of four points diagram with business icons. This diagram has been professionally designed to display steps of financial planning. Capture the attention of your audience.
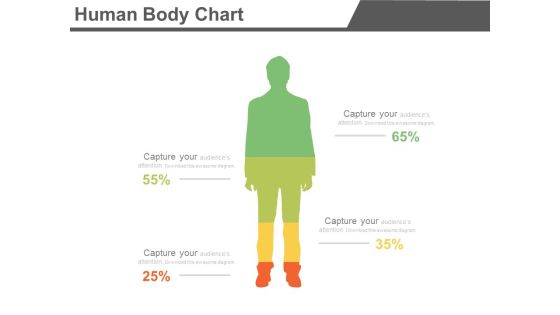
Four Segments Human Body Chart Powerpoint Slides
Create dynamic presentations with our creative template of human body chart with four segments. This diagram may be used to present information in visual manner. Download this template to leave permanent impression on your audience.

Four Steps Chart For Business Planning Powerpoint Slides
Our professionally designed business diagram is as an effective tool for communicating business planning. It contains four steps charts with icons. Above slide is suitable to display process management steps.
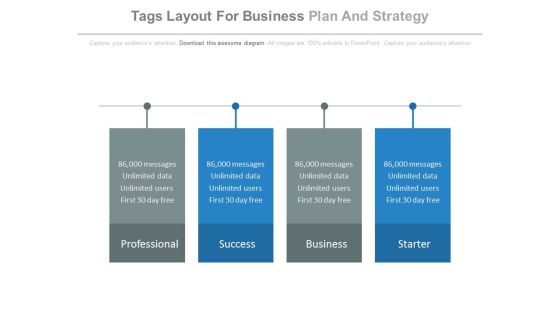
Four Tags Layout For Business Plan And Strategy Powerpoint Slides
This business slide displays diagram of four text tags. Download this PowerPoint diagram to display business plan and strategy. Enlighten your audience with your breathtaking ideas.
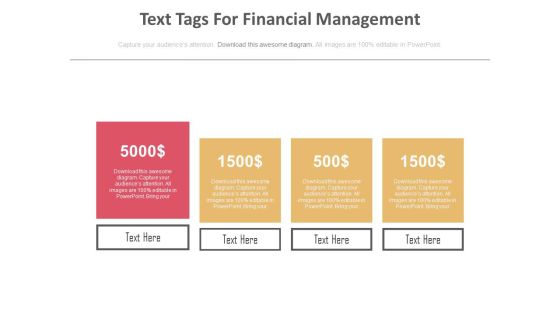
Four Text Tags For Financial Management Powerpoint Slides
Our professionally designed business diagram is as an effective tool for communicating concept of financial management. It contains graphics of four text tags. Above slide is also suitable to display financial planning and strategy.
Market Trends Chart With Percentage And Icons Powerpoint Slides
This PowerPoint template has been designed with graphics of chart with percentage values and icons. This PowerPoint template may be used to market trends and financial analysis. Prove the viability of your ideas using this impressive slide.
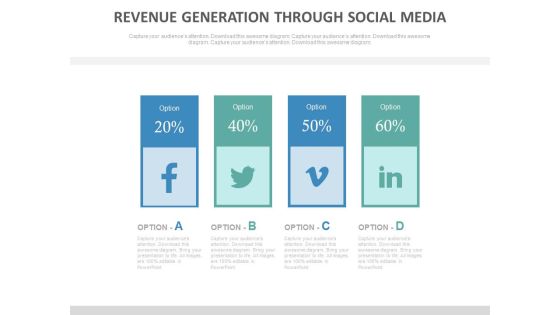
Revenue Generation Through Social Media Powerpoint Slides
This business slide has been designed with four text tags and social media icons. This PowerPoint template may use to display revenue generation through social media. Prove the viability of your ideas using this impressive slide.

Semicircle Infographic Diagram For Business Process Powerpoint Slides
This PowerPoint template has been designed with semicircle infographic diagram. This PPT slide may be used to display business process flow. Download this slide to build unique presentation.
Six Steps Circular Chart With Icons Powerpoint Slides
This PowerPoint template has been designed with six steps circular chart with icons. This PPT slide may be used to display business and management functions. Download this slide to build unique presentation.
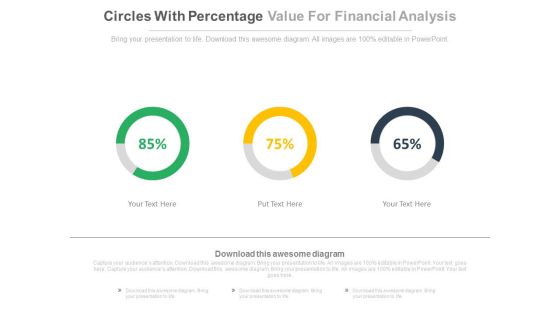
Three Circles With Percentage Values For Financial Analysis Powerpoint Slides
This PowerPoint template has been designed with three circles and percentage values. This PPT slide may be used to display financial analysis for business. Download this slide to build unique presentation.
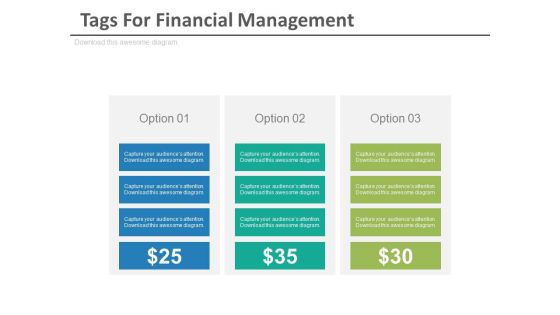
Three Options Tags For Financial Management Powerpoint Slides
Create dynamic presentations with our professional template containing three options tags. Use this diagram to exhibit financial management. Download this template to leave permanent impression on your audience.
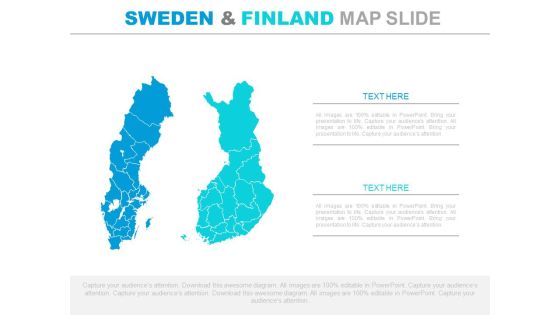
Sweden And Finland Map For Business Analysis Powerpoint Slides
This PowerPoint template has been designed with Sweden and Finland map. Each and every property of any region - color, size, shading etc can be modified to help you build an effective PowerPoint presentation. Use these maps to show sales territories, business and new office locations, travel planning etc in your presentations.
World Map With Icons For Global Business Powerpoint Slides
This PowerPoint map template has been designed with graphics of world map. Each and every property of any region - color, size, shading etc can be modified to help you build an effective PowerPoint presentation. You may use this PPT slide to display global business related topics.

Dashboards For Profit Growth Analysis Powerpoint Slides
This PowerPoint template has been designed with graphics of dashboard. You may use this dashboard slide design to exhibit profit growth analysis. This PPT slide is powerful tool to describe your ideas.
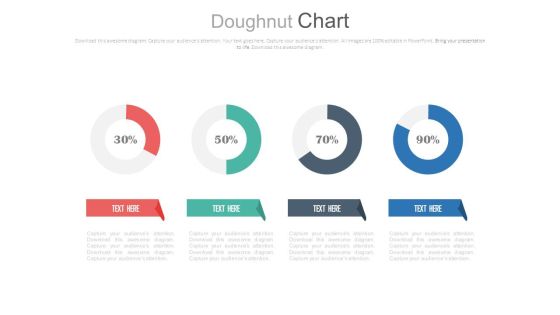
Four Circle Chart With Percentage Ratios Powerpoint Slides
This PowerPoint template has been designed with graphics of four circles and percentage ratios. You may use this dashboard slide design for topics like profit growth and financial planning. This PPT slide is powerful tool to describe your ideas.

Linear Circles Percentage Analysis Charts Powerpoint Slides
This PowerPoint template has been designed with graphics of three circles and percentage ratios. You may use this dashboard slide design for topics like profit growth and financial planning. This PPT slide is powerful tool to describe your ideas.
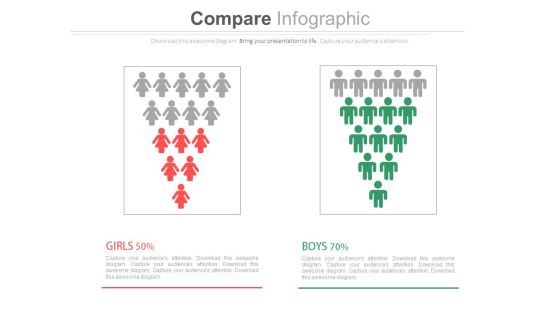
Male Female Gender Ratio Analysis Comparison Chart Powerpoint Slides
This PowerPoint template has been designed with graphics of male and female icons. Download this PPT slide to depict gender ratio analysis. Grab the attention of your team with this eye catching template.
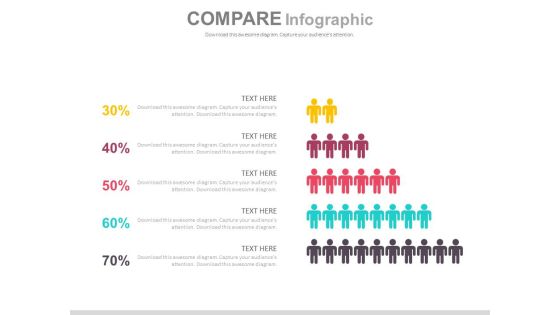
Pyramid Design For Employees Performance Powerpoint Slides
This PPT slide contains graphics of pyramid diagram. Download this PowerPoint template to depict employee?s performance and analysis. Deliver amazing presentations to mesmerize your audience by using this slide design.

Three Teams Skill Analysis Comparison Chart Powerpoint Slides
Create visually stunning and define your PPT presentations in a unique and inspiring manner using our above template. It contains graphics of comparison chart. This business slide helps to display teams skill analysis. Deliver amazing presentations to mesmerize your audience by using this PPT slide design.

Two Teams Performance Analysis Chart Powerpoint Slides
This PowerPoint template has been designed with icons of two teams with percentage values. Download this PPT slide to depict team?s performance analysis. Deliver amazing presentations to mesmerize your audience by using this PPT slide design.

Bar Graph With Financial Ratio And Icons Powerpoint Template
Visually support your presentation with our above template containing bar graph with icons. This diagram slide helps to exhibit financial ratio analysis. Etch your views in the brains of your audience with this diagram slide.

Net Promoter Score Measurement Ppt Powerpoint Idea
This is a net promoter score measurement ppt powerpoint idea. This is a three stage process. The stages in this process are promoters, passives, detractors, promoters, net promoter score.
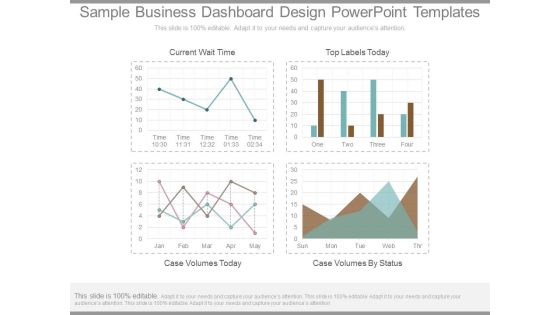
Sample Business Dashboard Design Powerpoint Templates
This is a sample business dashboard design powerpoint templates. This is a four stage process. The stages in this process are current wait time, top labels today, case volumes today, case volumes by status.
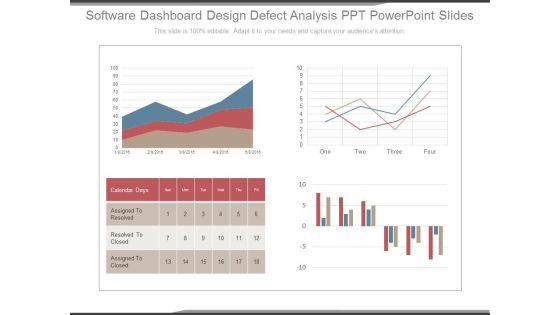
Software Dashboard Design Defect Analysis Ppt Powerpoint Slides
This is a software dashboard design defect analysis ppt powerpoint slides. This is a four stage process. The stages in this process are calendar days, assigned to resolved, resolved to closed, assigned to closed.
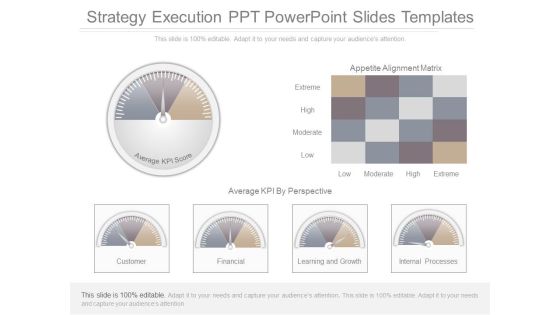
Strategy Execution Ppt Powerpoint Slides Templates
This is a strategy execution ppt powerpoint slides templates. This is a six stage process. The stages in this process are appetite alignment matrix, extreme, high, moderate, low, average kpi by prospective, customer, financial, learning and growth, internal processes, average kpi score.
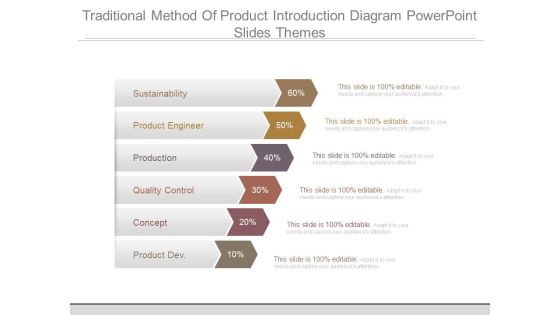
Traditional Method Of Product Introduction Diagram Powerpoint Slides Themes
This is a traditional method of product introduction diagram powerpoint slides themes. This is a six stage process. The stages in this process are sustainability, product engineer, production, quality control, concept, product dev.

Business Procedure Administration Example Sample Ppt Files
This is a business procedure administration example sample ppt files. This is a five stage process. The stages in this process are scope and assess, evaluate and analyze, engagement, process transition, operations.

Business Procurement Template Presentation Design
This is a business procurement template presentation design. This is a three stage process. The stages in this process are locating, implement, measure.

Cellular Media Networking Diagram Ppt Infographics
This is a cellular media networking diagram ppt infographics. This is a four stage process. The stages in this process are communities, mashups, respect privacy, entertain.

Interactive Business Intelligence Powerpoint Sample
This is a interactive business intelligence powerpoint sample. This is a three stage process. The stages in this process are sales by category, shipping volume, marketing activity.
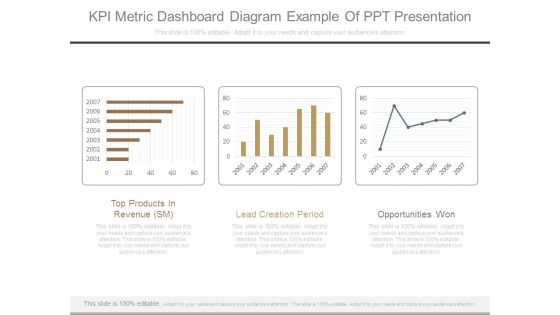
Kpi Metric Dashboard Diagram Example Of Ppt Presentation
This is a kpi metric dashboard diagram example of ppt presentation. This is a three stage process. The stages in this process are top products in revenue sm, lead creation period, opportunities won.

Business Progress Timeline Powerpoint Slide Show
This is a business progress timeline powerpoint slide show. This is a five stage process. The stages in this process are business, time planning, icons, success, management.
Human Performance Improvement Technologies Ppt Icon
This is a human performance improvement technologies ppt icon. This is a four stage process. The stages in this process are score, overall territory performance, weight.

Win Loss Insights Ppt Background Images
This is a win loss insights ppt background image. This is a two stage process. The stages in this process are why you lose, why you win.

Effective Lead Conversion Diagram Ppt Example
This is a effective lead conversion diagram ppt example. This is a four stage process. The stages in this process are business, success, funnel, process, strategy.
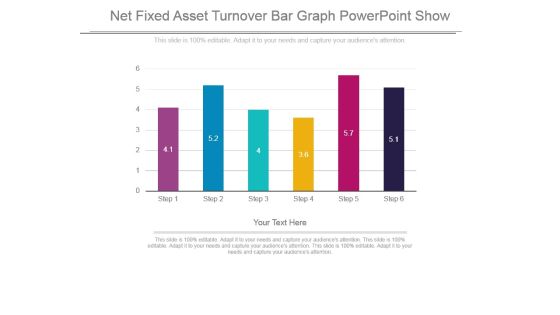
Net Fixed Asset Turnover Bar Graph Powerpoint Show
This is a net fixed asset turnover bar graph powerpoint show. This is a six stage process. The stages in this process are bar graph, presentation, strategy, business, management.
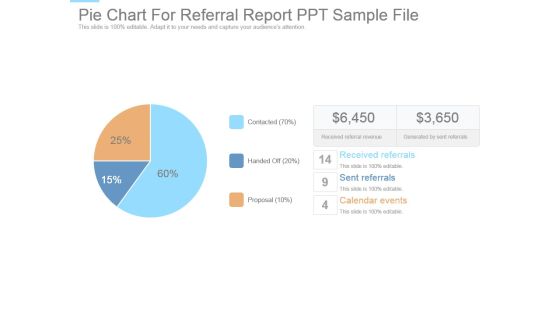
Pie Chart For Referral Report Ppt Sample File
This is a pie chart for referral report ppt sample file. This is a three stage process. The stages in this process are received referrals, sent referrals, calendar events, proposal, handed off, contacted, received referral revenue, generated by sent referrals.
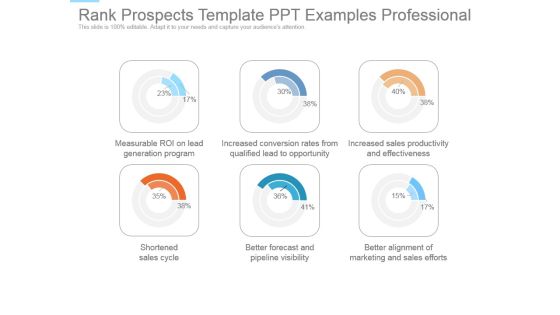
Rank Prospects Template Ppt Examples Professional
This is a rank prospects template ppt examples professional. This is a six stage process. The stages in this process are measurable roi on lead generation program, increased conversion rates from qualified lead to opportunity, increased sales productivity and effectiveness, shortened sales cycle, better forecast and pipeline visibility, better alignment of marketing and sales efforts.

Sales Breakdown Pie Chart Dashboard Powerpoint Slide Influencers
This is a sales breakdown pie chart dashboard powerpoint slide influencers. This is a four stage process. The stages in this process are railway stations and other, downtown hotel and resorts, cruise liners and seaports, airports, north america, south america, central america and caribbean, eurasia and asia, africa, europe.

Bar Graph For Market Analysis Ppt Samples Download
This is a bar graph for market analysis ppt samples download. This is a four stage process. The stages in this process are category.

Annual Report Project Plan Ppt Slide
This is a annual report project plan ppt slide. This is a one stage process. The stages in this process are financial statement, 10 k report, directors report, green annual report, auditors report, grey literature.
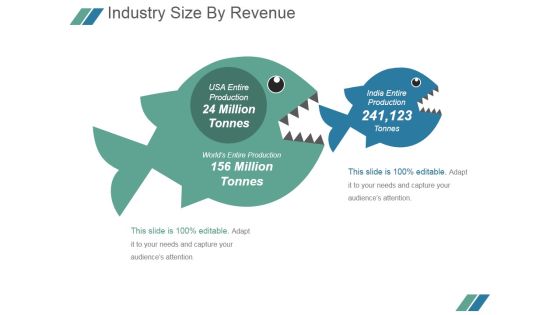
Industry Size By Revenue Ppt PowerPoint Presentation Guide
This is a industry size by revenue ppt powerpoint presentation guide. This is a two stage process. The stages in this process are million tonnes, india entire production, worlds entire production.

Vision And Mission PowerPoint Presentation Complete Deck With Slides
This is a vision and mission powerpoint presentation complete deck with slides. This is a one stage process. The stages in this process are vision, mission, target, strategy, competition.

Business Plan Executive Summary Ppt PowerPoint Presentation Complete Deck With Slides
This is a business plan executive summary ppt powerpoint presentation complete deck with slides. This is a one stage process. The stages in this process are business, marketing, graph, management, communication.
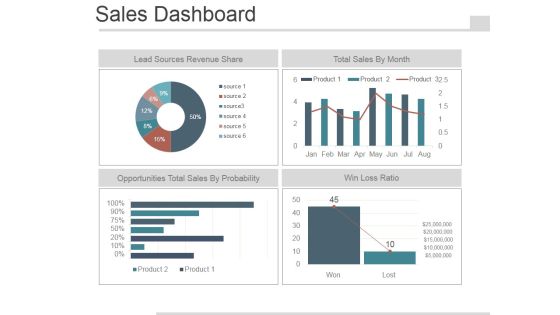
Sales Dashboard Slide Template 2 Ppt PowerPoint Presentation Images
This is a sales dashboard slide template 2 ppt powerpoint presentation images. This is a four stage process. The stages in this process are lead sources revenue share, total sales by month, opportunities total sales by probability, win loss ratio.

Marketing And Sales Strategy Business Plan Ppt PowerPoint Presentation Complete Deck With Slides
This is a marketing and sales strategy business plan ppt powerpoint presentation complete deck with slides. This is a one stage process. The stages in this process are sales, business, plan, marketing, strategy.

Project Management Methodologies Ppt PowerPoint Presentation Complete Deck With Slides
This is a project management methodologies ppt powerpoint presentation complete deck with slides. This is a one stage process. The stages in this process are business, strategy, management, work management, team work.

Company Marketing Analysis Report Ppt PowerPoint Presentation Complete Deck With Slides
This is a company marketing analysis report ppt powerpoint presentation complete deck with slides. This is a one stage process. The stages in this process are marketing, business, hand, report, financial.

Understand The Customer Needs Template 2 Ppt PowerPoint Presentation Show Graphics Pictures
This is a understand the customer needs template 2 ppt powerpoint presentation show graphics pictures. This is a five stage process. The stages in this process are understand your customer, what they do, when they buy, how they buy, what they expect of you.

Annual Report Production Timeline Ppt PowerPoint Presentation Complete Deck With Slides
This is a annual report production timeline ppt powerpoint presentation complete deck with slides. This is a one stage process. The stages in this process are annual report, production timeline, management, strategy, business.

Agenda Ppt PowerPoint Presentation Layouts Vector
This is a agenda ppt powerpoint presentation layouts vector. This is a six stage process. The stages in this process are agenda, management, business, marketing.

Column Chart Ppt PowerPoint Presentation Ideas Inspiration
This is a column chart ppt powerpoint presentation ideas inspiration. This is a five stage process. The stages in this process are graph, year, business, marketing, product.

Comparison Ppt PowerPoint Presentation Portfolio Slides
This is a comparison ppt powerpoint presentation portfolio slides. This is a two stage process. The stages in this process are male, female, comparison, percentage, business.
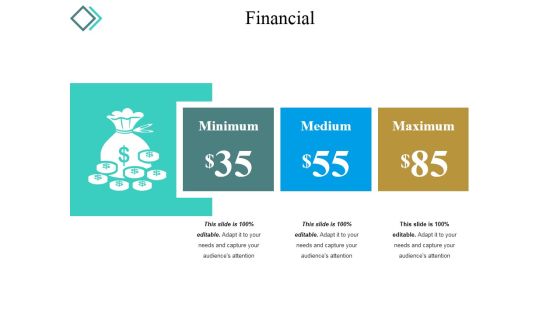
Financial Ppt PowerPoint Presentation Gallery Aids
This is a financial ppt powerpoint presentation gallery aids. This is a three stage process. The stages in this process are minimum, medium, maximum.
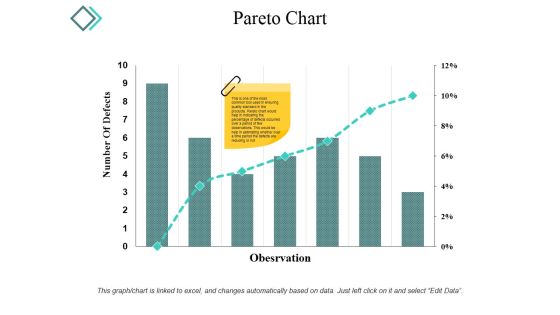
Pareto Chart Ppt PowerPoint Presentation Infographic Template Microsoft
This is a pareto chart ppt powerpoint presentation infographic template microsoft. This is a seven stage process. The stages in this process are number of defects, observation, graph, percentage, business.

Stock Chart Ppt PowerPoint Presentation Gallery Graphic Images
This is a stock chart ppt powerpoint presentation gallery graphic images. This is a five stage process. The stages in this process are close, high, volume, low, open.
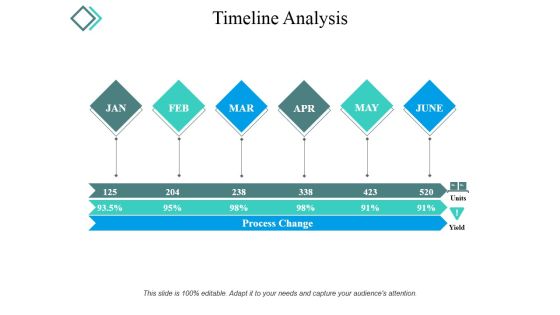
Timeline Analysis Ppt PowerPoint Presentation Outline Clipart
This is a timeline analysis ppt powerpoint presentation outline clipart. This is a six stage process. The stages in this process are process change, units, yield, months, percentage.

Bar Graph Ppt PowerPoint Presentation Ideas Show
This is a bar graph ppt powerpoint presentation ideas show. This is a three stage process. The stages in this process are product, percentage, business, year, graph.

High Low Close Chart Template 1 Ppt PowerPoint Presentation Infographics Graphics Design
This is a high low close chart template 1 ppt powerpoint presentation infographics graphics design. This is a five stage process. The stages in this process are close, high, volume, low, open, product.
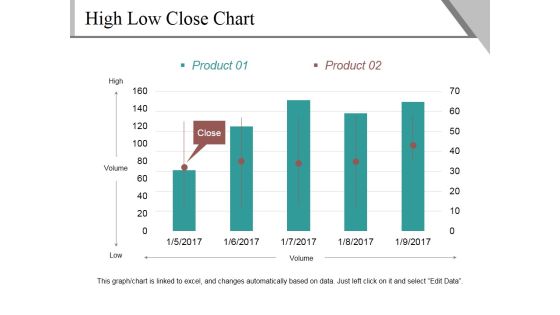
High Low Close Chart Template 2 Ppt PowerPoint Presentation Outline Show
This is a high low close chart template 2 ppt powerpoint presentation outline show. This is a five stage process. The stages in this process are high, volume, low, close, product.
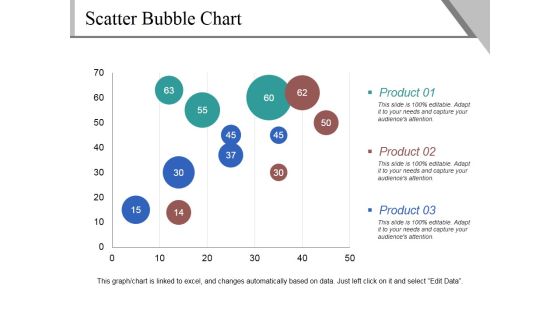
Scatter Bubble Chart Ppt PowerPoint Presentation Pictures Demonstration
This is a scatter bubble chart ppt powerpoint presentation pictures demonstration. This is a three stage process. The stages in this process are product, business, marketing, scatter chart.
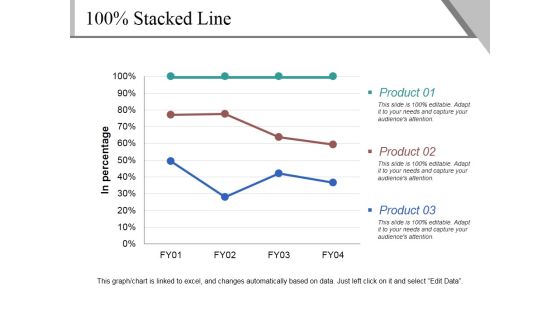
Stacked Line Ppt PowerPoint Presentation Professional Tips
This is a stacked line ppt powerpoint presentation professional tips. This is a three stage process. The stages in this process are product, in percentage, business, marketing.

Bar Chart Ppt PowerPoint Presentation Icon Demonstration
This is a bar chart ppt powerpoint presentation icon demonstration. This is a seven stage process. The stages in this process are product, sales in percentage, financial year, graph.

Financial Ppt PowerPoint Presentation Gallery Background Images
This is a financial ppt powerpoint presentation gallery background images. This is a three stage process. The stages in this process are minimum, medium, maximum, dollar, symbol.

Comparison Ppt PowerPoint Presentation Slides Slideshow
This is a comparison ppt powerpoint presentation slides slideshow. This is a two stage process. The stages in this process are female, male, percentage, compare.

Executive Summary Ppt PowerPoint Presentation Summary Good
This is a executive summary ppt powerpoint presentation summary good. This is a seven stage process. The stages in this process are companys vision, companys mission, background, capabilities, accreditation.


 Continue with Email
 Sign up for an account
 Home
Home