Investment Banking

Big Data In Health Industry Dashboard In Industry Summary PDF
The slide depicts patient KPI dashboard for healthcare which can be used to improve service levels as well as treatment across departments. It include metrics such as bed occupancy rate, patient turnover, satisfaction rate, missed and cancelled appointment rate. Showcasing this set of slides titled Big Data In Health Industry Dashboard In Industry Summary PDF. The topics addressed in these templates are Geriatrics, Gynecology, Internal Medicine. All the content presented in this PPT design is completely editable. Download it and make adjustments in color, background, font etc. as per your unique business setting.

Automobile OEM Export Trade Statistics Download PDF
This slide showcases statistical data on automobile original equipment manufacturer export sales. It shows exports by different manufacturers in fiscal years and their percentage growth. Showcasing this set of slides titled Automobile OEM Export Trade Statistics Download PDF. The topics addressed in these templates are The Swing, Hyundai India, Ford India. All the content presented in this PPT design is completely editable. Download it and make adjustments in color, background, font etc. as per your unique business setting.
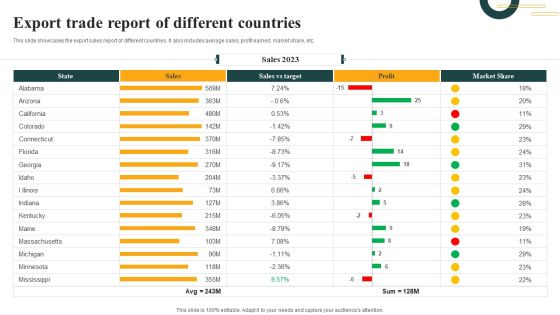
Export Trade Report Of Different Countries Infographics PDF
This slide showcases the export sales report of different countries. It also includes average sales, profit earned, market share, etc. Showcasing this set of slides titled Export Trade Report Of Different Countries Infographics PDF. The topics addressed in these templates are Sales Vs Target, Sales, Market Share. All the content presented in this PPT design is completely editable. Download it and make adjustments in color, background, font etc. as per your unique business setting.

Data On Performance Based Incentive Remuneration Template PDF
This slide showcases statistical data on performance based incentive compensation. It also includes bonuses such as hiring , referral , individual incentive bonuses , retention bonuses , company wide bonuses , etc. Showcasing this set of slides titled Data On Performance Based Incentive Remuneration Template PDF. The topics addressed in these templates are Percent, Compensation Models, Implement Individual. All the content presented in this PPT design is completely editable. Download it and make adjustments in color, background, font etc. as per your unique business setting.
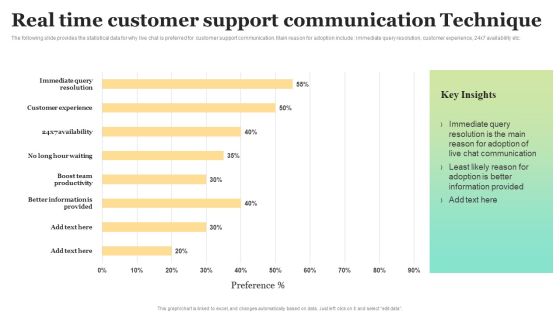
Real Time Customer Support Communication Technique Background PDF
The following slide provides the statistical data for why live chat is preferred for customer support communication. Main reason for adoption include immediate query resolution, customer experience, 24x7 availability etc. Showcasing this set of slides titled Real Time Customer Support Communication Technique Background PDF. The topics addressed in these templates are Immediate Query Resolution, Customer Experience, Boost Team Productivity. All the content presented in this PPT design is completely editable. Download it and make adjustments in color, background, font etc. as per your unique business setting.

Annual Chronic Patients Change Linear Chart Demonstration PDF
The following slide highlights the percentage change of chronically ill patients. It shows the annual percentage change for the for a decade Showcasing this set of slides titled Annual Chronic Patients Change Linear Chart Demonstration PDF. The topics addressed in these templates are Key Observations, Annual Percentage, Linear Chart. All the content presented in this PPT design is completely editable. Download it and make adjustments in color, background, font etc. as per your unique business setting.
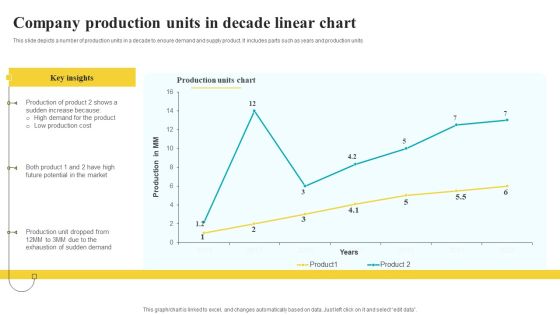
Company Production Units In Decade Linear Chart Designs PDF
This slide depicts a number of production units in a decade to ensure demand and supply product. It includes parts such as years and production units Pitch your topic with ease and precision using this Company Production Units In Decade Linear Chart Designs PDF. This layout presents information on Key Insights, Production Units Chart, Linear Chart. It is also available for immediate download and adjustment. So, changes can be made in the color, design, graphics or any other component to create a unique layout.

Comparative Medical Services Trend Linear Chart Mockup PDF
This slide depicts the comparison of medical services across the globe based on the revenue generated. It includes Asia, North America, South America, Europe and Middle east Showcasing this set of slides titled Comparative Medical Services Trend Linear Chart Mockup PDF. The topics addressed in these templates are Observations, Comparative Medical Services, Linear Chart. All the content presented in this PPT design is completely editable. Download it and make adjustments in color, background, font etc. as per your unique business setting.

Daily Guests And Subscribers Linear Chart Clipart PDF
This slide illustrates comparison chart of subscribers and guests on daily basis to measure website success. It includes days and number of subscribers Pitch your topic with ease and precision using this Daily Guests And Subscribers Linear Chart Clipart PDF. This layout presents information on Key Insight, Website, Subscribers Chart. It is also available for immediate download and adjustment. So, changes can be made in the color, design, graphics or any other component to create a unique layout.
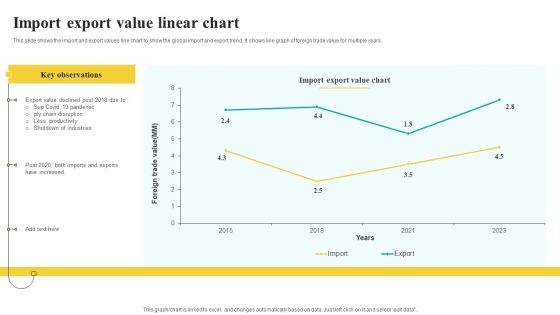
Import Export Value Linear Chart Summary PDF
This slide shows the import and export values line chart to show the global import and export trend. It shows line graph of foreign trade value for multiple years Showcasing this set of slides titled Import Export Value Linear Chart Summary PDF. The topics addressed in these templates are Key Observations, Value Chart, Industries. All the content presented in this PPT design is completely editable. Download it and make adjustments in color, background, font etc. as per your unique business setting.
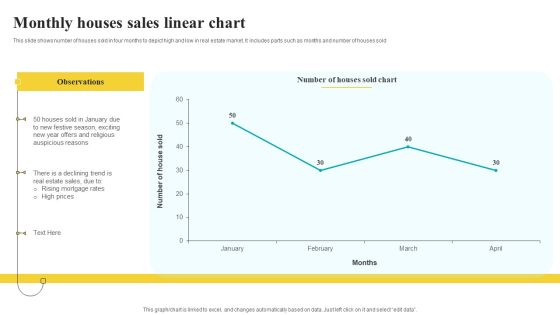
Monthly Houses Sales Linear Chart Pictures PDF
This slide shows number of houses sold in four months to depict high and low in real estate market. It includes parts such as months and number of houses sold Pitch your topic with ease and precision using this Monthly Houses Sales Linear Chart Pictures PDF. This layout presents information on Observations, Auspicious Reasons, Sales Linear Chart. It is also available for immediate download and adjustment. So, changes can be made in the color, design, graphics or any other component to create a unique layout.

Quarterly Revenue Growth Linear Chart Elements PDF
This slide depicts the quarterly revenue generated to check the financial health of the business. It includes parts such as quarters and growth percent Showcasing this set of slides titled Quarterly Revenue Growth Linear Chart Elements PDF. The topics addressed in these templates are Observations, Growth Chart, Production. All the content presented in this PPT design is completely editable. Download it and make adjustments in color, background, font etc. as per your unique business setting.
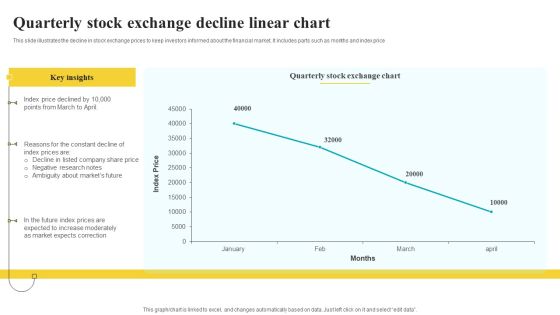
Quarterly Stock Exchange Decline Linear Chart Inspiration PDF
This slide illustrates the decline in stock exchange prices to keep investors informed about the financial market. It includes parts such as months and index price Pitch your topic with ease and precision using this Quarterly Stock Exchange Decline Linear Chart Inspiration PDF. This layout presents information on Key Insights, Exchange Chart, Correction. It is also available for immediate download and adjustment. So, changes can be made in the color, design, graphics or any other component to create a unique layout.
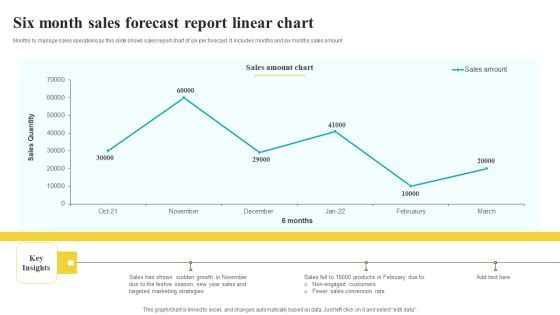
Six Month Sales Forecast Report Linear Chart Themes PDF
Months to manage sales operations as this slide shows sales report chart of six per forecast. It includes months and six months sales amount Showcasing this set of slides titled Six Month Sales Forecast Report Linear Chart Themes PDF. The topics addressed in these templates are Sales Amount Chart, Key Insights, Conversion Rate. All the content presented in this PPT design is completely editable. Download it and make adjustments in color, background, font etc. as per your unique business setting.

Usa And India Population Comparison Stacked Linear Chart Guidelines PDF
This slide depicts the population comparison chart of USA and India to forecast future population of the respective countries. It includes years and population in MM Pitch your topic with ease and precision using this Usa And India Population Comparison Stacked Linear Chart Guidelines PDF. This layout presents information on Key Insights, Population Growth, Comparison Chart. It is also available for immediate download and adjustment. So, changes can be made in the color, design, graphics or any other component to create a unique layout.
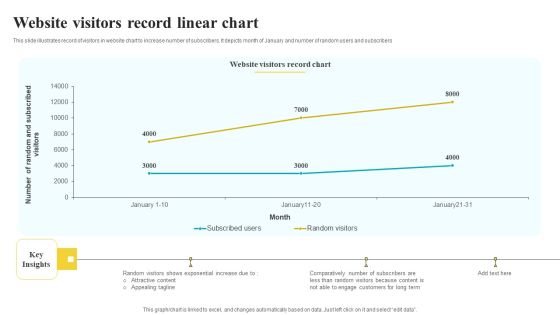
Website Visitors Record Linear Chart Summary PDF
This slide illustrates record of visitors in website chart to increase number of subscribers. It depicts month of January and number of random users and subscribers Showcasing this set of slides titled Website Visitors Record Linear Chart Summary PDF. The topics addressed in these templates are Key Insights, Record Chart, Long Term. All the content presented in this PPT design is completely editable. Download it and make adjustments in color, background, font etc. as per your unique business setting.
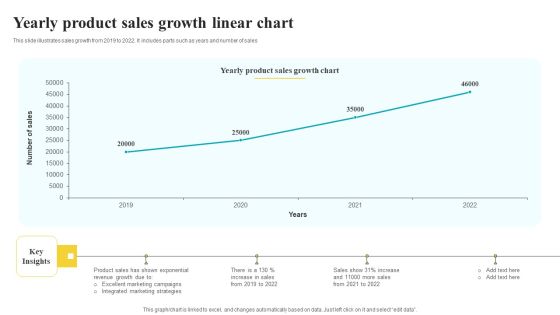
Yearly Product Sales Growth Linear Chart Pictures PDF
This slide illustrates sales growth from 2019 to 2022. It includes parts such as years and number of sales Pitch your topic with ease and precision using this Yearly Product Sales Growth Linear Chart Pictures PDF. This layout presents information on Sales Growth Chart, Key Insights, Strategies. It is also available for immediate download and adjustment. So, changes can be made in the color, design, graphics or any other component to create a unique layout.

Business Continuous Process Improvement KPI Dashboard In Healthcare Industry Guidelines PDF
Following slides shows the complete outline of healthcare business process improvement KPI dashboard which will assist in providing better services to patients . The major metrics mentioned in a slide are such as average patients discharge by hour or on weekly basis Showcasing this set of slides titled Business Continuous Process Improvement KPI Dashboard In Healthcare Industry Guidelines PDF. The topics addressed in these templates are Patients, Discharge List, Healthcare Industry. All the content presented in this PPT design is completely editable. Download it and make adjustments in color, background, font etc. as per your unique business setting.
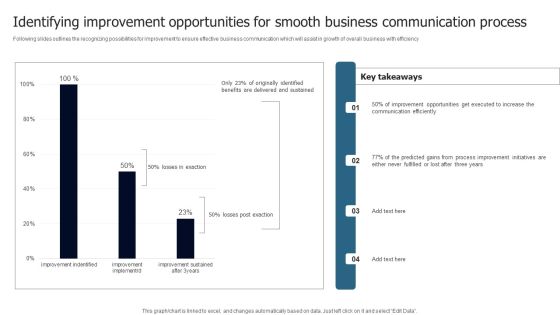
Identifying Improvement Opportunities For Smooth Business Communication Process Introduction PDF
Following slides outlines the recognizing possibilities for improvement to ensure effective business communication which will assist in growth of overall business with efficiency Pitch your topic with ease and precision using this Identifying Improvement Opportunities For Smooth Business Communication Process Introduction PDF. This layout presents information on Key Takeaways, Three Years, Efficiently. It is also available for immediate download and adjustment. So, changes can be made in the color, design, graphics or any other component to create a unique layout.

Catering Business Advertisement Plan KPI Dashboard With Revenue Comparison Icons PDF
This slide shows the KPI dashboard of the catering industry to evaluate the actual and potential targets. It includes KPIs such as expenditure, sales revenue, beverage, etc. Showcasing this set of slides titled Catering Business Advertisement Plan KPI Dashboard With Revenue Comparison Icons PDF. The topics addressed in these templates are Expenditure, Revenue Comparison, Department. All the content presented in this PPT design is completely editable. Download it and make adjustments in color, background, font etc. as per your unique business setting.

Dashboard Showcasing University Advertising Program Performance Professional PDF
This slide provides dashboard which enables marketers track university marketing plan performance. It provides information regarding KPIs such as applications accepted, admission rate, total enrollments and retention rate. Showcasing this set of slides titled Dashboard Showcasing University Advertising Program Performance Professional PDF. The topics addressed in these templates are Applications, Admission Rate, Total Enrollment. All the content presented in this PPT design is completely editable. Download it and make adjustments in color, background, font etc. as per your unique business setting.
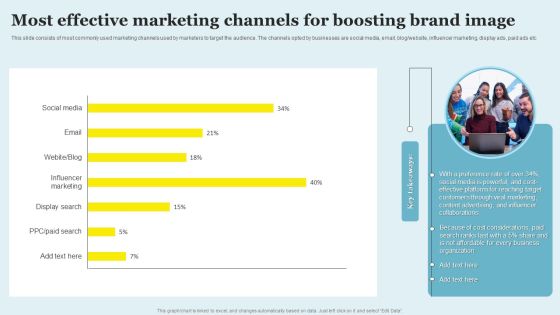
Most Effective Marketing Channels For Boosting Brand Image Topics PDF
This slide consists of most commonly used marketing channels used by marketers to target the audience. The channels opted by businesses are social media, email, blog website, influencer marketing, display ads, paid ads etc. Showcasing this set of slides titled Most Effective Marketing Channels For Boosting Brand Image Topics PDF. The topics addressed in these templates are Preference, Content Advertising, Collaborations. All the content presented in this PPT design is completely editable. Download it and make adjustments in color, background, font etc. as per your unique business setting.

Performance KPI Dashboard Highlighting Boosting Brand Image Sample PDF
The following slide depicts a performance based dashboard to be used by brand managers to track the efficiency of marketing activities across platforms which has led to an increase in overall brand awareness. The key performing indicators are total website visits, user session, website mention, shares etc. Showcasing this set of slides titled Performance KPI Dashboard Highlighting Boosting Brand Image Sample PDF. The topics addressed in these templates are Social Media, Backlinks, Mentions Tags. All the content presented in this PPT design is completely editable. Download it and make adjustments in color, background, font etc. as per your unique business setting.
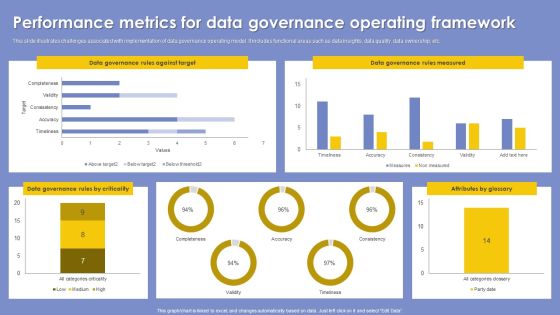
Performance Metrics For Data Governance Operating Framework Summary PDF
This slide illustrates challenges associated with implementation of data governance operating model. It includes functional areas such as data insights, data quality, data ownership, etc. Showcasing this set of slides titled Performance Metrics For Data Governance Operating Framework Summary PDF. The topics addressed in these templates are Attributes By Glossary, Rules Measured, Rules Against Target. All the content presented in this PPT design is completely editable. Download it and make adjustments in color, background, font etc. as per your unique business setting.

Reasons Customer Store Digital For Product Buying Microsoft PDF
This slide showcase reasons why customer prefers to purchase product and service online rather than offline. It includes elements such as free home delivery, discount coupons, positive reviews, easy product return policy, easy checkout options etc. Showcasing this set of slides titled Reasons Customer Store Digital For Product Buying Microsoft PDF. The topics addressed in these templates are Maximum Customer, Online Sales, Buy One Get. All the content presented in this PPT design is completely editable. Download it and make adjustments in color, background, font etc. as per your unique business setting.
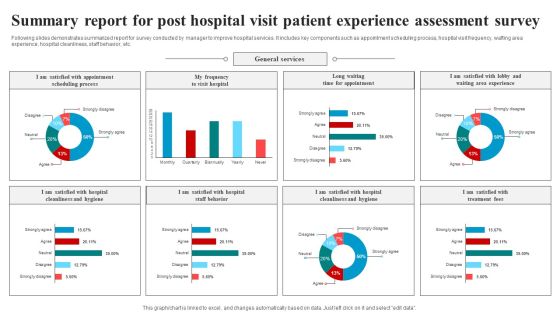
Summary Report For Post Hospital Visit Patient Experience Assessment Survey Survey SS
Following slides demonstrates summarized report for survey conducted by manager to improve hospital services. It includes key components such as appointment scheduling process, hospital visit frequency, wafting area experience, hospital cleanliness, staff behavior, etc. Pitch your topic with ease and precision using this Summary Report For Post Hospital Visit Patient Experience Assessment Survey Survey SS. This layout presents information on General Services, Appointment, Behavior. It is also available for immediate download and adjustment. So, changes can be made in the color, design, graphics or any other component to create a unique layout.
Project Dashboard Management Infographic For Performance Evaluation Icon Background PDF
Pitch your topic with ease and precision using this Project Dashboard Management Infographic For Performance Evaluation Icon Background PDF. This layout presents information on Project Dashboard, Management Infographic, Performance Evaluation. It is also available for immediate download and adjustment. So, changes can be made in the color, design, graphics or any other component to create a unique layout.

B2B Event Advertising Channels Impact On Customer Engagement Summary PDF
Following slide demonstrates experimental marketing platforms which can be used to improve business customer engagement rate. It includes experimental marketing channels such as virtual, hybrid and in person. Showcasing this set of slides titled B2B Event Advertising Channels Impact On Customer Engagement Summary PDF. The topics addressed in these templates are Event Marketing, Channel Growth, Virtual Event Marketing. All the content presented in this PPT design is completely editable. Download it and make adjustments in color, background, font etc. as per your unique business setting.
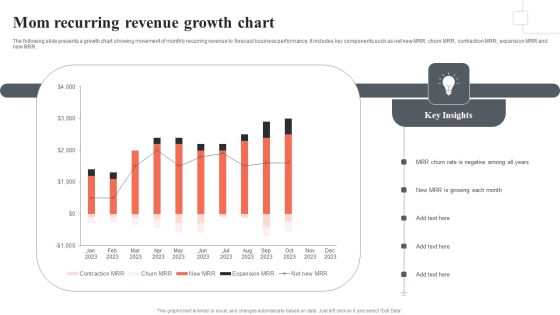
Mom Recurring Revenue Growth Chart Themes PDF
The following slide presents a growth chart showing movement of monthly recurring revenue to forecast business performance. It includes key components such as net new MRR, churn MRR, contraction MRR, expansion MRR and new MRR. Showcasing this set of slides titled Mom Recurring Revenue Growth Chart Themes PDF. The topics addressed in these templates are MRR Churn Rate, Negative, MRR Growing Each Month. All the content presented in this PPT design is completely editable. Download it and make adjustments in color, background, font etc. as per your unique business setting.
Key Metrics To Increase Consumer Traffic Icon Themes PDF
Showcasing this set of slides titled Key Metrics To Increase Consumer Traffic Icon Themes PDF. The topics addressed in these templates are Key Metrics, Increase Consumer, Traffic . All the content presented in this PPT design is completely editable. Download it and make adjustments in color, background, font etc. as per your unique business setting.
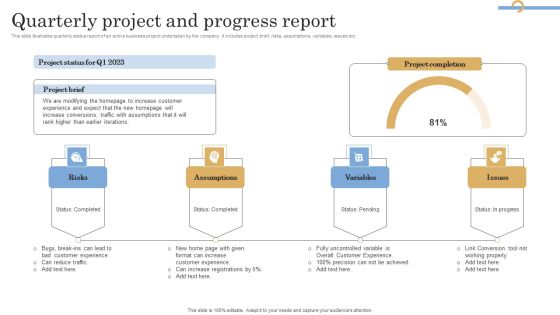
Quarterly Project And Progress Report Infographics PDF
This slide illustrates quarterly status report of an active business project undertaken by the company. it includes project brief, risks, assumptions, variables, issues etc. Showcasing this set of slides titled Quarterly Project And Progress Report Infographics PDF. The topics addressed in these templates are Risks, Assumptions, Variables. All the content presented in this PPT design is completely editable. Download it and make adjustments in color, background, font etc. as per your unique business setting.
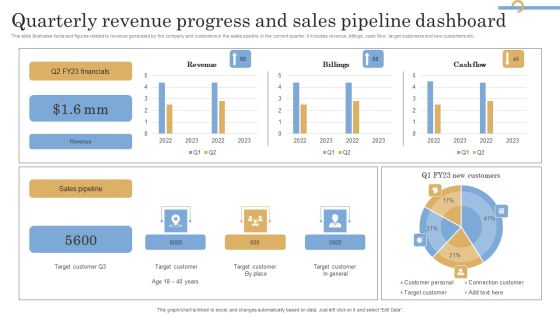
Quarterly Revenue Progress And Sales Pipeline Dashboard Information PDF
This slide illustrates facts and figures related to revenue generated by the company and customers in the sales pipeline in the current quarter. It includes revenue, billings, cash flow, target customers and new customers etc. Showcasing this set of slides titled Quarterly Revenue Progress And Sales Pipeline Dashboard Information PDF. The topics addressed in these templates are Financials, Revenue, Sales Pipeline. All the content presented in this PPT design is completely editable. Download it and make adjustments in color, background, font etc. as per your unique business setting.

Global Healthcare Device Sale Trends Microsoft PDF
This slide shows international market sale trends that can be used to frame future marketing strategies to boost overall revenue of organization. It include projected sales over next five years, current growth data and top global players etc.Showcasing this set of slides titled Global Healthcare Device Sale Trends Microsoft PDF. The topics addressed in these templates are Market Growth, Incremental Growth, Growth Current. All the content presented in this PPT design is completely editable. Download it and make adjustments in color, background, font etc. as per your unique business setting.

Global Sales Of Top Healthcare Equipment Companies Clipart PDF
This slide shows sales graph of top 10 global players in field of medical sales with their revenue for the year of 2023. It include determinants of sales, sales revenue of global players for 2023 etc. Showcasing this set of slides titled Global Sales Of Top Healthcare Equipment Companies Clipart PDF. The topics addressed in these templates are Total Market, Medical Device, Registered Players. All the content presented in this PPT design is completely editable. Download it and make adjustments in color, background, font etc. as per your unique business setting.
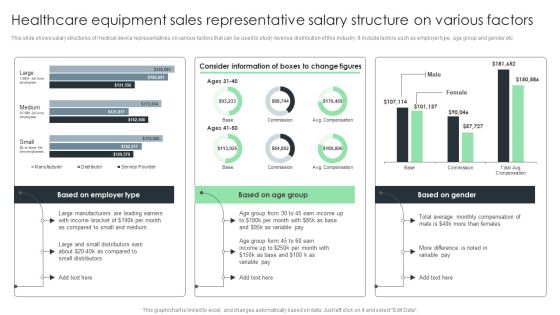
Healthcare Equipment Sales Representative Salary Structure On Various Factors Demonstration PDF
This slide shows salary structures of medical device representatives on various factors that can be used to study revenue distribution of this industry. It include factors such as employer type, age group and gender etc. Showcasing this set of slides titled Healthcare Equipment Sales Representative Salary Structure On Various Factors Demonstration PDF. The topics addressed in these templates are Consider Information, Large Manufacturers, Commission. All the content presented in this PPT design is completely editable. Download it and make adjustments in color, background, font etc. as per your unique business setting.
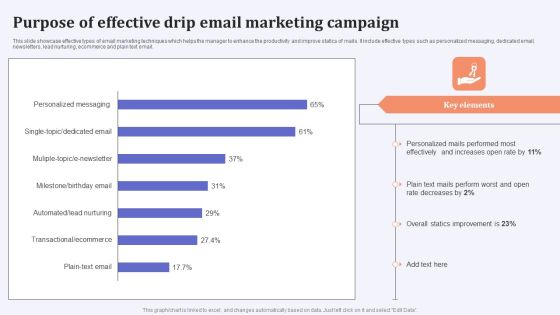
Purpose Of Effective Drip Email Marketing Campaign Brochure PDF
This slide showcase effective types of email marketing techniques which helps the manager to enhance the productivity and improve statics of mails. It include effective types such as personalized messaging, dedicated email, newsletters, lead nurturing, ecommerce and plain text email. Showcasing this set of slides titled Purpose Of Effective Drip Email Marketing Campaign Brochure PDF. The topics addressed in these templates are Personalized Mails, Rate Decreases, Overall Statics Improvement. All the content presented in this PPT design is completely editable. Download it and make adjustments in color, background, font etc. as per your unique business setting.
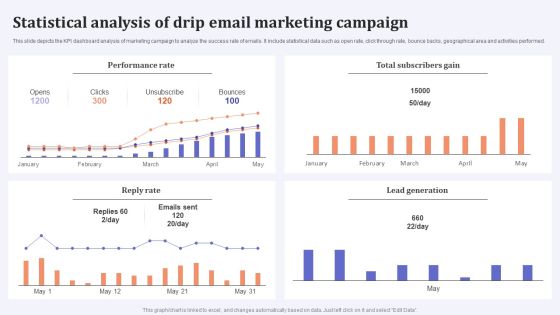
Statistical Analysis Of Drip Email Marketing Campaign Microsoft PDF
This slide depicts the KPI dashboard analysis of marketing campaign to analyze the success rate of emails. It include statistical data such as open rate, click through rate, bounce backs, geographical area and activities performed. Showcasing this set of slides titled Statistical Analysis Of Drip Email Marketing Campaign Microsoft PDF. The topics addressed in these templates are Performance Rate, Total Subscribers Gain, Reply Rate. All the content presented in this PPT design is completely editable. Download it and make adjustments in color, background, font etc. as per your unique business setting.

Carbon Footprint Generated By International Hotel Industry Ideas PDF
This slide highlights the carbon footprint generated by the global hotel industry that will assist managers to overcome challenges. Major statistics relate to air conditioning, general equipment, lighting, etc. Showcasing this set of slides titled Carbon Footprint Generated By International Hotel Industry Ideas PDF. The topics addressed in these templates are Hot Water Laundry, Pool Pumps, Kitchen Refrigeration. All the content presented in this PPT design is completely editable. Download it and make adjustments in color, background, font etc. as per your unique business setting.

Carbon Footprint Management Dashboard For International Events Brochure PDF
The following slide depicts a Carbon footprint management dashboard that will be used by managers monitoring emissions in global events and taking appropriate actions. Major key performance indicators include the total number of guests, total carbon footprint, waste carbon footprint, etc. Showcasing this set of slides titled Carbon Footprint Management Dashboard For International Events Brochure PDF. The topics addressed in these templates are Carbon Footprint, Carbon Emission By Category, Waste Carbon Footprint. All the content presented in this PPT design is completely editable. Download it and make adjustments in color, background, font etc. as per your unique business setting.

Dashboard To Monitor International Footprint Of Supply Chain Operations Brochure PDF
This slide depicts a dashboard that will be used by managers to monitor the global footprint of supply chain operations. Major key performance indicators include total global emissions, time frame, allocation, electricity, etc. Showcasing this set of slides titled Dashboard To Monitor International Footprint Of Supply Chain Operations Brochure PDF. The topics addressed in these templates are Electricity, Footprint Emissions, Allocation. All the content presented in this PPT design is completely editable. Download it and make adjustments in color, background, font etc. as per your unique business setting.

Buyer Marketing Campaign Performance Dashboard Download PDF
Following dashboard depicts shopper marketing dashboard which can be used by managers to assess the performance of their campaigns. The key performance indicators are total customers, countries, website views, total campaigns, email sent, website traffic source etc. Pitch your topic with ease and precision using this Buyer Marketing Campaign Performance Dashboard Download PDF. This layout presents information on Total Customers, Countries, Website Views. It is also available for immediate download and adjustment. So, changes can be made in the color, design, graphics or any other component to create a unique layout.

Dashboard To Track Performance Of Buyer Marketing Campaign Infographics PDF
This slide depicts a Dashboard which can be used to track performance of shopper marketing campaign on digital platforms. The key performance indicators include Website leads, Current service users, Lead conversion rate, Lead satisfaction rate etc. Pitch your topic with ease and precision using this Dashboard To Track Performance Of Buyer Marketing Campaign Infographics PDF. This layout presents information on Social Media Campaign, Social Media Engagement, Current Service Users. It is also available for immediate download and adjustment. So, changes can be made in the color, design, graphics or any other component to create a unique layout.
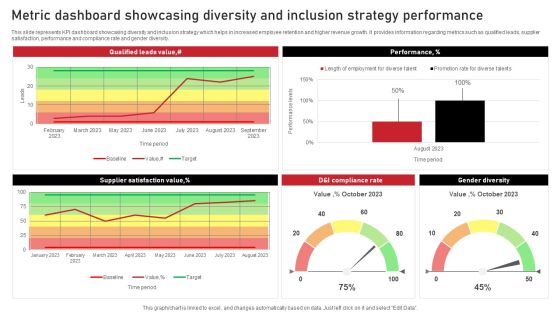
Metric Dashboard Showcasing Diversity And Inclusion Strategy Performance Background PDF
This slide represents KPI dashboard showcasing diversity and inclusion strategy which helps in increased employee retention and higher revenue growth. It provides information regarding metrics such as qualified leads, supplier satisfaction, performance and compliance rate and gender diversity. Showcasing this set of slides titled Metric Dashboard Showcasing Diversity And Inclusion Strategy Performance Background PDF. The topics addressed in these templates are Performance, Gender Diversity, Performance. All the content presented in this PPT design is completely editable. Download it and make adjustments in color, background, font etc. as per your unique business setting.

Metric Dashboard Showcasing Measurement Of Gender Diversity Pay Gap Sample PDF
This slide represents KPI dashboard showcasing metrics to measure gender pay gap. It provides information regarding salary pay gap, bonus pay gap, women promoted, recruited, and total women in each department. Pitch your topic with ease and precision using this Metric Dashboard Showcasing Measurement Of Gender Diversity Pay Gap Sample PDF. This layout presents information on Marketing, Screened, Delivery. It is also available for immediate download and adjustment. So, changes can be made in the color, design, graphics or any other component to create a unique layout.

Metric Dashboard Showcasing Workplace Gender Diversity Microsoft PDF
This slide represents KPI dashboard showcasing workplace gender diversity which helps uncover potential inequalities in workplace . It provides information regarding marital status, ethnicity, average tenure by gender and age. Showcasing this set of slides titled Metric Dashboard Showcasing Workplace Gender Diversity Microsoft PDF. The topics addressed in these templates are Marital Status, Ethnicity, Average. All the content presented in this PPT design is completely editable. Download it and make adjustments in color, background, font etc. as per your unique business setting.

Lean Operational Excellence Strategy Manufacturing Dashboard To Check Production System Efficiency Pictures PDF
This slide showcases manufacturing dashboard to track KPIs defined under lean and kaizen process improvement plans. Key performance metrics included here are TEEP, OEE, loading time, production quality, losses by hours, losses by categories etc. Pitch your topic with ease and precision using this Lean Operational Excellence Strategy Manufacturing Dashboard To Check Production System Efficiency Pictures PDF. This layout presents information on Loading, Availability, Performance. It is also available for immediate download and adjustment. So, changes can be made in the color, design, graphics or any other component to create a unique layout.

Customer Demographics Dashboard After Market Research Steps Structure PDF
The slide highlights the market research process results on customer satisfaction. It reflects the already-existing customers and their perception of their relationship with the brand. It includes the customer satisfaction score and net promoter score for September. Showcasing this set of slides titled Customer Demographics Dashboard After Market Research Steps Structure PDF. The topics addressed in these templates are Total, Consent, Education. All the content presented in this PPT design is completely editable. Download it and make adjustments in color, background, font etc. as per your unique business setting.
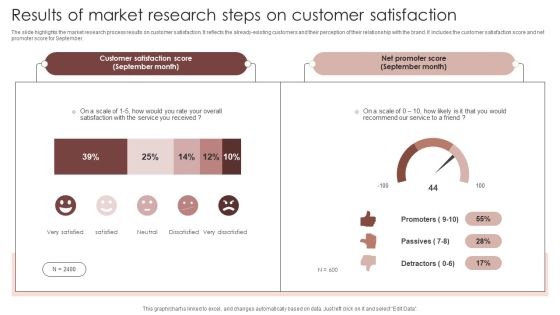
Results Of Market Research Steps On Customer Satisfaction Sample PDF
The slide highlights the market research process results on customer satisfaction. It reflects the already-existing customers and their perception of their relationship with the brand. It includes the customer satisfaction score and net promoter score for September. Showcasing this set of slides titled Results Of Market Research Steps On Customer Satisfaction Sample PDF. The topics addressed in these templates are Promoters, Passives, Detractors. All the content presented in this PPT design is completely editable. Download it and make adjustments in color, background, font etc. as per your unique business setting.

Data Analysis In Market Research Steps Icon Diagrams PDF
Showcasing this set of slides titled Data Analysis In Market Research Steps Icon Diagrams PDF. The topics addressed in these templates are Data Analysis, Market, Research Steps. All the content presented in this PPT design is completely editable. Download it and make adjustments in color, background, font etc. as per your unique business setting.
Market Research Steps Dashboard Icon Brochure PDF
Pitch your topic with ease and precision using this Market Research Steps Dashboard Icon Brochure PDF. This layout presents information on Market Research, Steps, Dashboard. It is also available for immediate download and adjustment. So, changes can be made in the color, design, graphics or any other component to create a unique layout.

Statistical Relationship Between Organic Growth Procedure And Profitability Rules PDF
This slide showcases graph depicting relationship between organic growth process and profit . It includes annual growth , annual profits , frequent , occasional and no researches etc. Pitch your topic with ease and precision using this Statistical Relationship Between Organic Growth Procedure And Profitability Rules PDF. This layout presents information on Key Insights, Frequency, Profitability. It is also available for immediate download and adjustment. So, changes can be made in the color, design, graphics or any other component to create a unique layout.

Competitive Analysis Of Major Players Existing Across Marketplace Diagrams PDF
This slide provides information regarding comparative analysis of potential players existing across marketplace. The points of differentiation include financial parameters, critical success factors such as product variety, customer services, email marketing, etc. Find highly impressive Competitive Analysis Of Major Players Existing Across Marketplace Diagrams PDF on Slidegeeks to deliver a meaningful presentation. You can save an ample amount of time using these presentation templates. No need to worry to prepare everything from scratch because Slidegeeks experts have already done a huge research and work for you. You need to download Competitive Analysis Of Major Players Existing Across Marketplace Diagrams PDF for your upcoming presentation. All the presentation templates are 100 percent editable and you can change the color and personalize the content accordingly. Download now
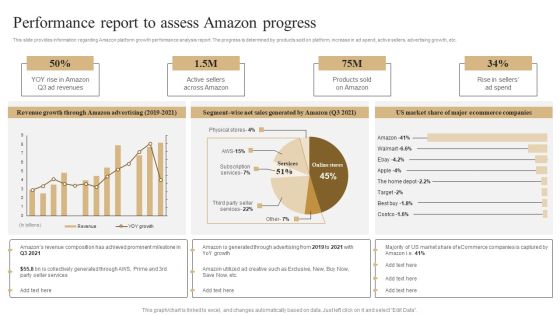
Performance Report To Assess Amazon Progress Template PDF
This slide provides information regarding Amazon platform growth performance analysis report. The progress is determined by products sold on platform, increase in ad spend, active sellers, advertising growth, etc. Coming up with a presentation necessitates that the majority of the effort goes into the content and the message you intend to convey. The visuals of a PowerPoint presentation can only be effective if it supplements and supports the story that is being told. Keeping this in mind our experts created Performance Report To Assess Amazon Progress Template PDF to reduce the time that goes into designing the presentation. This way, you can concentrate on the message while our designers take care of providing you with the right template for the situation.

Cultural Branding Marketing Strategy To Increase Lead Generation Revenue And Net Profit Trend For Brand Inspiration PDF
This slide represents revenue and net profit for five years for the company. It showcase increase in revenue due to product recognition in market and gaining competitive edge in market. Make sure to capture your audiences attention in your business displays with our gratis customizable Cultural Branding Marketing Strategy To Increase Lead Generation Revenue And Net Profit Trend For Brand Inspiration PDF. These are great for business strategies, office conferences, capital raising or task suggestions. If you desire to acquire more customers for your tech business and ensure they stay satisfied, create your own sales presentation with these plain slides.

Business Strategy And Promotional Approach For Multiplayer Oriented Mobile Game Casual Gaming User Demographics Icons PDF
The following slide helps in understanding the user demographics of mobile casual gamers, it displays essential data points such as average daily spend by gender, gender breakdown by causal game, age breakdown and average daily time spent by age. Presenting this PowerPoint presentation, titled Business Strategy And Promotional Approach For Multiplayer Oriented Mobile Game Casual Gaming User Demographics Icons PDF, with topics curated by our researchers after extensive research. This editable presentation is available for immediate download and provides attractive features when used. Download now and captivate your audience. Presenting this Business Strategy And Promotional Approach For Multiplayer Oriented Mobile Game Casual Gaming User Demographics Icons PDF. Our researchers have carefully researched and created these slides with all aspects taken into consideration. This is a completely customizable Business Strategy And Promotional Approach For Multiplayer Oriented Mobile Game Casual Gaming User Demographics Icons PDF that is available for immediate downloading. Download now and make an impact on your audience. Highlight the attractive features available with our PPTs.

Business Strategy And Promotional Approach For Multiplayer Oriented Mobile Game Dashboard For Measuring P2E Web 3 Game Pictures PDF
The following slide displays a detailed dashboard to measure website performance of P2E web3 based NFT game. It highlights essential elements such as lead per opportunity, new opportunities, income by in-game purchase Here you can discover an assortment of the finest PowerPoint and Google Slides templates. With these templates, you can create presentations for a variety of purposes while simultaneously providing your audience with an eye catching visual experience. Download Business Strategy And Promotional Approach For Multiplayer Oriented Mobile Game Dashboard For Measuring P2E Web 3 Game Pictures PDF to deliver an impeccable presentation. These templates will make your job of preparing presentations much quicker, yet still, maintain a high level of quality. Slidegeeks has experienced researchers who prepare these templates and write high quality content for you. Later on, you can personalize the content by editing the Business Strategy And Promotional Approach For Multiplayer Oriented Mobile Game Dashboard For Measuring P2E Web 3 Game Pictures PDF.

Business Strategy And Promotional Approach For Multiplayer Oriented Mobile Game Dashboard For Measuring Unique Visitors Topics PDF
The following slide displays a detailed dashboard to measure website performance of P2E web3 based NFT game. It highlights essential elements such as session frequency, visit frequency, content origin etc. This Business Strategy And Promotional Approach For Multiplayer Oriented Mobile Game Dashboard For Measuring Unique Visitors Topics PDF from Slidegeeks makes it easy to present information on your topic with precision. It provides customization options, so you can make changes to the colors, design, graphics, or any other component to create a unique layout. It is also available for immediate download, so you can begin using it right away. Slidegeeks has done good research to ensure that you have everything you need to make your presentation stand out. Make a name out there for a brilliant performance.

Business Strategy And Promotional Approach For Multiplayer Oriented Mobile Game Mobile Casual Gaming Market Introduction Ideas PDF
Purpose of the following slide is to show industry overview of casual mobile gaming. It highlights the revenue forecast of the game along with average revenue per mobile game download, global returns on ad spend, and download forecast of the same. Create an editable Business Strategy And Promotional Approach For Multiplayer Oriented Mobile Game Mobile Casual Gaming Market Introduction Ideas PDF that communicates your idea and engages your audience. Whether youre presenting a business or an educational presentation, pre designed presentation templates help save time. Business Strategy And Promotional Approach For Multiplayer Oriented Mobile Game Mobile Casual Gaming Market Introduction Ideas PDF is highly customizable and very easy to edit, covering many different styles from creative to business presentations. Slidegeeks has creative team members who have crafted amazing templates. So, go and get them without any delay.

Business Strategy And Promotional Approach For Multiplayer Oriented Mobile Game Play To Earn Gaming Market By Numbers Designs PDF
Purpose of the following slide is to display the key statistics of P2E or play to earn market. It highlights essential data points such as total games, game by device, by status, by blockchain offered etc. Want to ace your presentation in front of a live audience Our Business Strategy And Promotional Approach For Multiplayer Oriented Mobile Game Play To Earn Gaming Market By Numbers Designs PDF can help you do that by engaging all the users towards you. Slidegeeks experts have put their efforts and expertise into creating these impeccable powerpoint presentations so that you can communicate your ideas clearly. Moreover, all the templates are customizable, and easy to edit and downloadable. Use these for both personal and commercial use.

Business Strategy And Promotional Approach For Multiplayer Oriented Mobile Game Web 3 0 Play To Earn Games User Demographics Structure PDF
The following slide helps in understanding the user demographics of Web3 P2E game, it displays essential data points such as gender Demographics of user, educational background, age and country of origin etc. There are so many reasons you need a Business Strategy And Promotional Approach For Multiplayer Oriented Mobile Game Web 3 0 Play To Earn Games User Demographics Structure PDF. The first reason is you cannot spend time making everything from scratch, Thus, Slidegeeks has made presentation templates for you too. You can easily download these templates from our website easily.


 Continue with Email

 Home
Home


