Investment Banking

Expense Incurred On Digital And Offline Marketing Promotion Ppt Slides Infographics PDF
This slide showcases analysis of amount spent on online and offline marketing over the years. The following bar graph shows expense spent on advertising through online channels increased as it has proved more to be more effective. Showcasing this set of slides titled Expense Incurred On Digital And Offline Marketing Promotion Ppt Slides Infographics PDF. The topics addressed in these templates are Growth, Online Product Promotion, 2018 To 2023. All the content presented in this PPT design is completely editable. Download it and make adjustments in color, background, font etc. as per your unique business setting.

Business Drivers For Better Organizational Result Ppt Summary Templates PDF
The slide highlights key drivers to influence a businesss financial and operational outcomes. It included business drivers such as increase in business stores, rise in volume of products sold, etc to achieve outcomes such as business growth, rise in no. of orders, etc. Showcasing this set of slides titled Business Drivers For Better Organizational Result Ppt Summary Templates PDF. The topics addressed in these templates are Website Traffic, Page Views, Conversion Rate, New Customers. All the content presented in this PPT design is completely editable. Download it and make adjustments in color, background, font etc. as per your unique business setting.

Global Healthcare Business Process Outsourcing Industry Outlook Guidelines PDF
This slide brings forth the market projection of business process outsourcing companies with major reference to healthcare industry. The key elements are market size, key drivers, market size projection, incremental growth, largest market, by geography, service provider and life science service Showcasing this set of slides titled Global Healthcare Business Process Outsourcing Industry Outlook Guidelines PDF. The topics addressed in these templates are Market Size, Market Size Projection, Largest Market. All the content presented in this PPT design is completely editable. Download it and make adjustments in color, background, font etc. as per your unique business setting.

Dashboard To Monitor Business Process Outsourcing Performance Based On Industry Standards Infographics PDF
This slide depicts the dashboard to monitor performance of business process outsourcing enterprise with reference to industry standards. The key elements covered in the slide are total calls, average answer speed, abandon rate, average calls per minute and agent performanc. Showcasing this set of slides titled Dashboard To Monitor Business Process Outsourcing Performance Based On Industry Standards Infographics PDF. The topics addressed in these templates are Industry Standards, Chart By Agent, Call Abandon Rate, Total Calls. All the content presented in this PPT design is completely editable. Download it and make adjustments in color, background, font etc. as per your unique business setting.
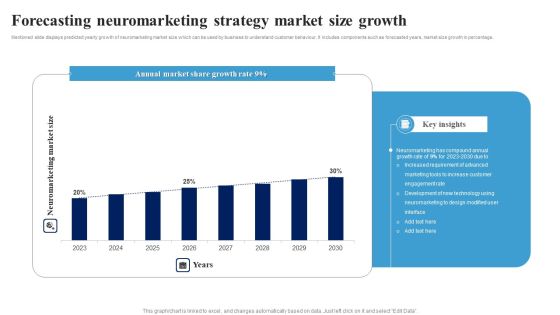
Forecasting Neuromarketing Strategy Market Size Growth Ppt Ideas Slideshow PDF
Mentioned slide displays predicted yearly growth of neuromarketing market size which can be used by business to understand customer behaviour. It includes components such as forecasted years, market size growth in percentage. Showcasing this set of slides titled Forecasting Neuromarketing Strategy Market Size Growth Ppt Ideas Slideshow PDF. The topics addressed in these templates are Annual Market Share, Growth Rate, Neuromarketing Compound, Annual Growth Rate. All the content presented in this PPT design is completely editable. Download it and make adjustments in color, background, font etc. as per your unique business setting.
Neuromarketing Strategy Technology Market Share By Different Regions Ppt Icon Deck PDF
This slide showcases forecasted neuromarketing technology growth by different regions to identify future business opportunities. It includes regions such as North America, Europe, Asia Pacific and Rest of the World. Showcasing this set of slides titled Neuromarketing Strategy Technology Market Share By Different Regions Ppt Icon Deck PDF. The topics addressed in these templates are Marketing Campaigns, Improved Brand Awareness, Develop Packaging Strategy. All the content presented in this PPT design is completely editable. Download it and make adjustments in color, background, font etc. as per your unique business setting.
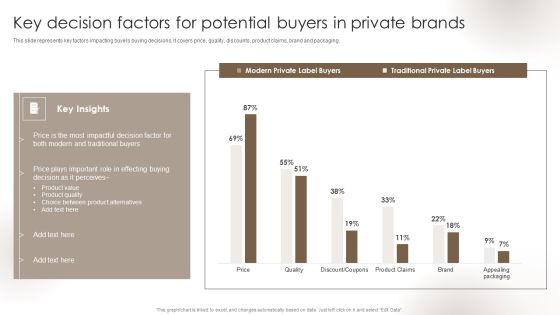
Private Label Branding To Optimize Key Decision Factors For Potential Buyers In Private Sample PDF
This slide represents key factors impacting buyers buying decisions. It covers price, quality, discounts, product claims, brand and packaging. The Private Label Branding To Optimize Key Decision Factors For Potential Buyers In Private Sample PDF is a compilation of the most recent design trends as a series of slides. It is suitable for any subject or industry presentation, containing attractive visuals and photo spots for businesses to clearly express their messages. This template contains a variety of slides for the user to input data, such as structures to contrast two elements, bullet points, and slides for written information. Slidegeeks is prepared to create an impression.

Private Label Branding To Optimize Market Share And Profit Trend For Private Label Brand Guidelines PDF
This slide represents market share by product category and revenue and profit trends for private brands. It enables brands to analyze the products that are high performing in the market. Retrieve professionally designed Private Label Branding To Optimize Market Share And Profit Trend For Private Label Brand Guidelines PDF to effectively convey your message and captivate your listeners. Save time by selecting pre-made slideshows that are appropriate for various topics, from business to educational purposes. These themes come in many different styles, from creative to corporate, and all of them are easily adjustable and can be edited quickly. Access them as PowerPoint templates or as Google Slides themes. You dont have to go on a hunt for the perfect presentation because Slidegeeks got you covered from everywhere.

Strategies For Marketing Advertisement Reach Across Social Media Platforms Of Total Structure PDF
This slide showcases reach of advertisement on different social media platforms. It can help organization to determine ideal social media platform for running paid advertisement. Create an editable Strategies For Marketing Advertisement Reach Across Social Media Platforms Of Total Structure PDF that communicates your idea and engages your audience. Whether youre presenting a business or an educational presentation, pre-designed presentation templates help save time. Strategies For Marketing Advertisement Reach Across Social Media Platforms Of Total Structure PDF is highly customizable and very easy to edit, covering many different styles from creative to business presentations. Slidegeeks has creative team members who have crafted amazing templates. So, go and get them without any delay.

Strategies For Marketing Dashboard To Track Website Traffic After Brand Awareness Graphics PDF
This slide showcases dashboard that can help organization to track the website traffic after running online brand awareness marketing campaigns. Its key components are new visitors, traffic by source, traffic by lead source, customers wins by lead source and bounce rate. Present like a pro with Strategies For Marketing Dashboard To Track Website Traffic After Brand Awareness Graphics PDF Create beautiful presentations together with your team, using our easy-to-use presentation slides. Share your ideas in real-time and make changes on the fly by downloading our templates. So whether youre in the office, on the go, or in a remote location, you can stay in sync with your team and present your ideas with confidence. With Slidegeeks presentation got a whole lot easier. Grab these presentations today.
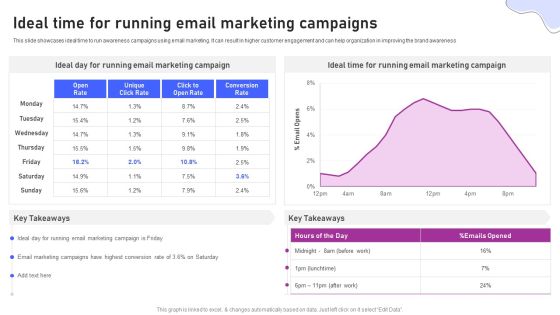
Strategies For Marketing Ideal Time For Running Email Marketing Campaigns Information PDF
This slide showcases ideal time to run awareness campaigns using email marketing. It can result in higher customer engagement and can help organization in improving the brand awareness. If your project calls for a presentation, then Slidegeeks is your go-to partner because we have professionally designed, easy-to-edit templates that are perfect for any presentation. After downloading, you can easily edit Strategies For Marketing Ideal Time For Running Email Marketing Campaigns Information PDF and make the changes accordingly. You can rearrange slides or fill them with different images. Check out all the handy templates

Targeted Market Entry Strategy Dashboard To Manage Marketing Campaigns Of Multiple Introduction PDF
This slide showcases dashboard that can help organization to manage the marketing campaigns in multi brand strategy. Its key elements are lead breakdown, total leads, key conversion metrics etc. Get a simple yet stunning designed Targeted Market Entry Strategy Dashboard To Manage Marketing Campaigns Of Multiple Introduction PDF. It is the best one to establish the tone in your meetings. It is an excellent way to make your presentations highly effective. So, download this PPT today from Slidegeeks and see the positive impacts. Our easy-to-edit Targeted Market Entry Strategy Dashboard To Manage Marketing Campaigns Of Multiple Introduction PDF can be your go-to option for all upcoming conferences and meetings. So, what are you waiting for Grab this template today.

Content Delivery And Promotion Evaluating Content Format For Influencer Marketing Background PDF
This slide showcases different content format preferred by marketers for influencer marketing campaign. Its key elements are Instagram post, blog post, Facebook post, YouTube live etc. This modern and well-arranged Content Delivery And Promotion Evaluating Content Format For Influencer Marketing Background PDF provides lots of creative possibilities. It is very simple to customize and edit with the Powerpoint Software. Just drag and drop your pictures into the shapes. All facets of this template can be edited with Powerpoint, no extra software is necessary. Add your own material, put your images in the places assigned for them, adjust the colors, and then you can show your slides to the world, with an animated slide included.

Content Delivery And Promotion Identifying Ideal Display Ad Size For Content Promotion Ideas PDF
This slide showcases ideal time to post and promote content through email marketing. It define ideal time on the bases of metrics like - open rate, unique click rate, click to open rate and conversion rate. Explore a selection of the finest Content Delivery And Promotion Identifying Ideal Display Ad Size For Content Promotion Ideas PDF here. With a plethora of professionally designed and pre-made slide templates, you can quickly and easily find the right one for your upcoming presentation. You can use our Content Delivery And Promotion Identifying Ideal Display Ad Size For Content Promotion Ideas PDF to effectively convey your message to a wider audience. Slidegeeks has done a lot of research before preparing these presentation templates. The content can be personalized and the slides are highly editable. Grab templates today from Slidegeeks.

Search Engine Marketing Determine And Understand Target Audience For Campaign Template PDF
The following slide showcases the target audience for SEM campaign to focus on marketing efforts and generate quality leads. It constitutes elements such as age group, gender, location, average spending, pain points, shopping habits etc. Here you can discover an assortment of the finest PowerPoint and Google Slides templates. With these templates, you can create presentations for a variety of purposes while simultaneously providing your audience with an eye-catching visual experience. Download Search Engine Marketing Determine And Understand Target Audience For Campaign Template PDF to deliver an impeccable presentation. These templates will make your job of preparing presentations much quicker, yet still, maintain a high level of quality. Slidegeeks has experienced researchers who prepare these templates and write high-quality content for you. Later on, you can personalize the content by editing the Search Engine Marketing Determine And Understand Target Audience For Campaign Template PDF.
Search Engine Marketing Develop Campaign Performance Tracking Framework Graphics PDF
The following slide depicts campaign performance management dashboard to measure the results. It includes elements such as conversions funnel, conversion rates, opportunity value, landing pages, sources google, twitter, Facebook etc. This Search Engine Marketing Develop Campaign Performance Tracking Framework Graphics PDF from Slidegeeks makes it easy to present information on your topic with precision. It provides customization options, so you can make changes to the colors, design, graphics, or any other component to create a unique layout. It is also available for immediate download, so you can begin using it right away. Slidegeeks has done good research to ensure that you have everything you need to make your presentation stand out. Make a name out there for a brilliant performance.

Search Engine Marketing Website Traffic Analysis With KPI Dashboard Brochure PDF
The following slide depicts the website analysis dashboard to get better visibility over search engines. It mainly includes key performance indicators such as sessions, users, page views, sources of traffic, phone call to actions etc. Want to ace your presentation in front of a live audience Our Search Engine Marketing Website Traffic Analysis With KPI Dashboard Brochure PDF can help you do that by engaging all the users towards you.. Slidegeeks experts have put their efforts and expertise into creating these impeccable powerpoint presentations so that you can communicate your ideas clearly. Moreover, all the templates are customizable, and easy-to-edit and downloadable. Use these for both personal and commercial use.
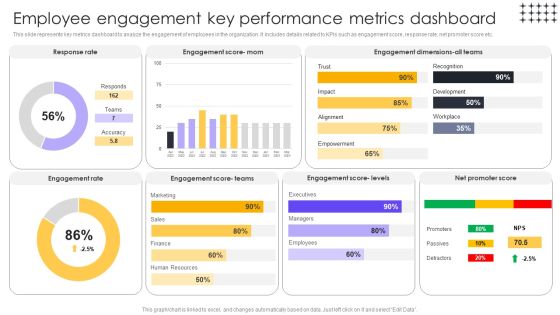
Tools For HR Business Analytics Employee Engagement Key Performance Metrics Brochure PDF
This slide represents key metrics dashboard to analyze the engagement of employees in the organization. It includes details related to KPIs such as engagement score, response rate, net promoter score etc. Make sure to capture your audiences attention in your business displays with our gratis customizable Tools For HR Business Analytics Employee Engagement Key Performance Metrics Brochure PDF. These are great for business strategies, office conferences, capital raising or task suggestions. If you desire to acquire more customers for your tech business and ensure they stay satisfied, create your own sales presentation with these plain slides.

Tools For HR Business Analytics HR Talent Management Key Metrics Structure PDF
This slide represents the KPI dashboard to track and monitor management of talent by the HR department. It includes details related to talent satisfaction, talent turnover rate, fired talents etc. This modern and well-arranged Tools For HR Business Analytics HR Talent Management Key Metrics Structure PDF provides lots of creative possibilities. It is very simple to customize and edit with the Powerpoint Software. Just drag and drop your pictures into the shapes. All facets of this template can be edited with Powerpoint, no extra software is necessary. Add your own material, put your images in the places assigned for them, adjust the colors, and then you can show your slides to the world, with an animated slide included.

Tools For HR Business Analytics Workforce Performance Analysis KPI Dashboard Pictures PDF
This slide represents the dashboard representing key metrics to analyze the performance of overall workforce. It includes details related to absence rate, benefits satisfaction, engagement index etc. Here you can discover an assortment of the finest PowerPoint and Google Slides templates. With these templates, you can create presentations for a variety of purposes while simultaneously providing your audience with an eye-catching visual experience. Download Tools For HR Business Analytics Workforce Performance Analysis KPI Dashboard Pictures PDF to deliver an impeccable presentation. These templates will make your job of preparing presentations much quicker, yet still, maintain a high level of quality. Slidegeeks has experienced researchers who prepare these templates and write high-quality content for you. Later on, you can personalize the content by editing the Tools For HR Business Analytics Workforce Performance Analysis KPI Dashboard Pictures PDF.
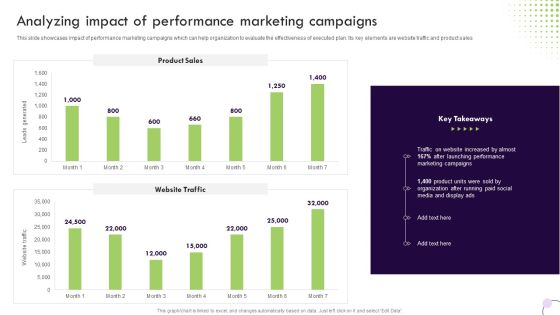
Performance Based Marketing Analyzing Impact Of Performance Marketing Campaigns Template PDF
This slide showcases impact of performance marketing campaigns which can help organization to evaluate the effectiveness of executed plan. Its key elements are website traffic and product sales. Do you have to make sure that everyone on your team knows about any specific topic I yes, then you should give Performance Based Marketing Analyzing Impact Of Performance Marketing Campaigns Template PDF a try. Our experts have put a lot of knowledge and effort into creating this impeccable Performance Based Marketing Analyzing Impact Of Performance Marketing Campaigns Template PDF. You can use this template for your upcoming presentations, as the slides are perfect to represent even the tiniest detail. You can download these templates from the Slidegeeks website and these are easy to edit. So grab these today.
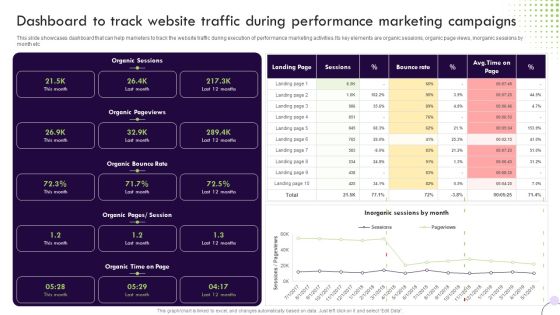
Performance Based Marketing Dashboard To Track Website Traffic During Performance Information PDF
This slide showcases dashboard that can help marketers to track the website traffic during execution of performance marketing activities.Its key elements are organic sessions, organic page views, inorganic sessions by month etc. Find highly impressive Performance Based Marketing Dashboard To Track Website Traffic During Performance Information PDF on Slidegeeks to deliver a meaningful presentation. You can save an ample amount of time using these presentation templates. No need to worry to prepare everything from scratch because Slidegeeks experts have already done a huge research and work for you. You need to download Performance Based Marketing Dashboard To Track Website Traffic During Performance Information PDF for your upcoming presentation. All the presentation templates are 100 percent editable and you can change the color and personalize the content accordingly. Download now.

Techniques To Implement Lead Generation By Source In Traditional Marketing Information PDF
This slide showcases current and estimated lead generation from traditional marketing. Major sources covered are print, outdoor, broadcasting, one-on-one and referral marketing. Present like a pro with Techniques To Implement Lead Generation By Source In Traditional Marketing Information PDF Create beautiful presentations together with your team, using our easy-to-use presentation slides. Share your ideas in real-time and make changes on the fly by downloading our templates. So whether youre in the office, on the go, or in a remote location, you can stay in sync with your team and present your ideas with confidence. With Slidegeeks presentation got a whole lot easier. Grab these presentations today.

5G Network Applications And Features Performance Tracking Dashboard For 5G Architecture Mockup PDF
This slide describes the performance tracking dashboard for 5G architecture by covering the details of subscribers, quality of experience, consumption, customer support, coverage, devices, and dimensions. Present like a pro with 5G Network Applications And Features Performance Tracking Dashboard For 5G Architecture Mockup PDF Create beautiful presentations together with your team, using our easy-to-use presentation slides. Share your ideas in real-time and make changes on the fly by downloading our templates. So whether youre in the office, on the go, or in a remote location, you can stay in sync with your team and present your ideas with confidence. With Slidegeeks presentation got a whole lot easier. Grab these presentations today.
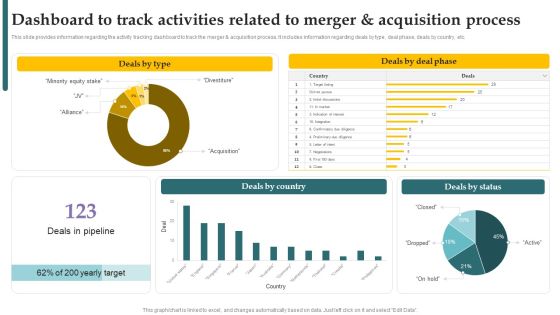
Inorganic Growth With Potential Dashboard To Track Activities Related To Merger Slides PDF
This slide provides information regarding the activity tracking dashboard to track the merger and acquisition process. It includes information regarding deals by type, deal phase, deals by country, etc. This Inorganic Growth With Potential Dashboard To Track Activities Related To Merger Slides PDF is perfect for any presentation, be it in front of clients or colleagues. It is a versatile and stylish solution for organizing your meetings. The Inorganic Growth With Potential Dashboard To Track Activities Related To Merger Slides PDF features a modern design for your presentation meetings. The adjustable and customizable slides provide unlimited possibilities for acing up your presentation. Slidegeeks has done all the homework before launching the product for you. So, dont wait, grab the presentation templates today.
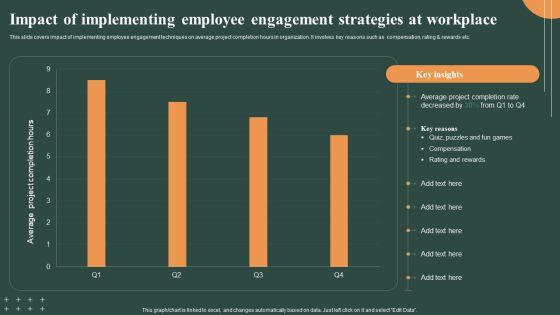
Techniques To Optimize Impact Of Implementing Employee Engagement Strategies Slides PDF
This slide covers impact of implementing employee engagement techniques on average project completion hours in organization. It involves key reasons such as compensation, rating and rewards etc. There are so many reasons you need a Techniques To Optimize Impact Of Implementing Employee Engagement Strategies Slides PDF. The first reason is you cant spend time making everything from scratch, Thus, Slidegeeks has made presentation templates for you too. You can easily download these templates from our website easily.

Techniques To Optimize Workforce Performance Management Kpi Dashboard Professional PDF
This slide covers staff performance management KPI dashboard to analyze current situation in organization. It involves details such as number of employees, average employee turnover, absenteeism rate etc. Whether you have daily or monthly meetings, a brilliant presentation is necessary. Techniques To Optimize Workforce Performance Management Kpi Dashboard Professional PDF can be your best option for delivering a presentation. Represent everything in detail using Techniques To Optimize Workforce Performance Management Kpi Dashboard Professional PDF and make yourself stand out in meetings. The template is versatile and follows a structure that will cater to your requirements. All the templates prepared by Slidegeeks are easy to download and edit. Our research experts have taken care of the corporate themes as well. So, give it a try and see the results.

Industry Report Of Packaged Food Products Part 2 General Mills New Product Inspiration PDF
Explore a selection of the finest Industry Report Of Packaged Food Products Part 2 General Mills New Product Inspiration PDF here. With a plethora of professionally designed and pre made slide templates, you can quickly and easily find the right one for your upcoming presentation. You can use our Industry Report Of Packaged Food Products Part 2 General Mills New Product Inspiration PDF to effectively convey your message to a wider audience. Slidegeeks has done a lot of research before preparing these presentation templates. The content can be personalized and the slides are highly editable. Grab templates today from Slidegeeks.

Industry Report Of Packaged Food Products Part 2 Conagra Financial Highlights Themes PDF
Find a pre designed and impeccable Industry Report Of Packaged Food Products Part 2 Conagra Financial Highlights Themes PDF. The templates can ace your presentation without additional effort. You can download these easy to edit presentation templates to make your presentation stand out from others. So, what are you waiting for Download the template from Slidegeeks today and give a unique touch to your presentation.

Industry Report Of Packaged Food Products Part 2 General Mills Cogs And Hmm Savings Rules PDF
Create an editable Industry Report Of Packaged Food Products Part 2 General Mills Cogs And Hmm Savings Rules PDF that communicates your idea and engages your audience. Whether you are presenting a business or an educational presentation, pre designed presentation templates help save time. Industry Report Of Packaged Food Products Part 2 General Mills Cogs And Hmm Savings Rules PDF is highly customizable and very easy to edit, covering many different styles from creative to business presentations. Slidegeeks has creative team members who have crafted amazing templates. So, go and get them without any delay.

Industry Report Of Packaged Food Products Part 2 General Mills Europe And Australian Segments Download PDF
There are so many reasons you need a Industry Report Of Packaged Food Products Part 2 General Mills Europe And Australian Segments Download PDF. The first reason is you can not spend time making everything from scratch, Thus, Slidegeeks has made presentation templates for you too. You can easily download these templates from our website easily.

Industry Report Of Packaged Food Products Part 2 General Mills Financial Highlights Fy23 Diagrams PDF
Do you have to make sure that everyone on your team knows about any specific topic I yes, then you should give Industry Report Of Packaged Food Products Part 2 General Mills Financial Highlights Fy23 Diagrams PDF a try. Our experts have put a lot of knowledge and effort into creating this impeccable Industry Report Of Packaged Food Products Part 2 General Mills Financial Highlights Fy23 Diagrams PDF. You can use this template for your upcoming presentations, as the slides are perfect to represent even the tiniest detail. You can download these templates from the Slidegeeks website and these are easy to edit. So grab these today.
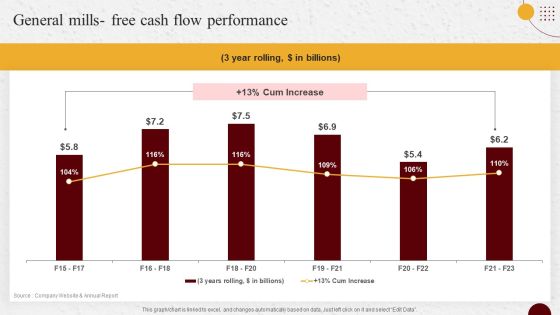
Industry Report Of Packaged Food Products Part 2 General Mills Free Cash Flow Performance Sample PDF
Get a simple yet stunning designed Industry Report Of Packaged Food Products Part 2 General Mills Free Cash Flow Performance Sample PDF. It is the best one to establish the tone in your meetings. It is an excellent way to make your presentations highly effective. So, download this PPT today from Slidegeeks and see the positive impacts. Our easy to edit Industry Report Of Packaged Food Products Part 2 General Mills Free Cash Flow Performance Sample PDF can be your go to option for all upcoming conferences and meetings. So, what are you waiting for Grab this template today.

Industry Report Of Packaged Food Products Part 2 General Mills Global Group Infographics PDF
From laying roadmaps to briefing everything in detail, our templates are perfect for you. You can set the stage with your presentation slides. All you have to do is download these easy to edit and customizable templates. Industry Report Of Packaged Food Products Part 2 General Mills Global Group Infographics PDF will help you deliver an outstanding performance that everyone would remember and praise you for. Do download this presentation today.
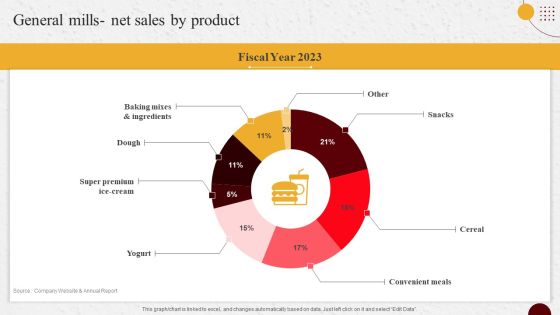
Industry Report Of Packaged Food Products Part 2 General Mills Net Sales By Product Ideas PDF
Present like a pro with Industry Report Of Packaged Food Products Part 2 General Mills Net Sales By Product Ideas PDF Create beautiful presentations together with your team, using our easy to use presentation slides. Share your ideas in real time and make changes on the fly by downloading our templates. So whether you are in the office, on the go, or in a remote location, you can stay in sync with your team and present your ideas with confidence. With Slidegeeks presentation got a whole lot easier. Grab these presentations today.
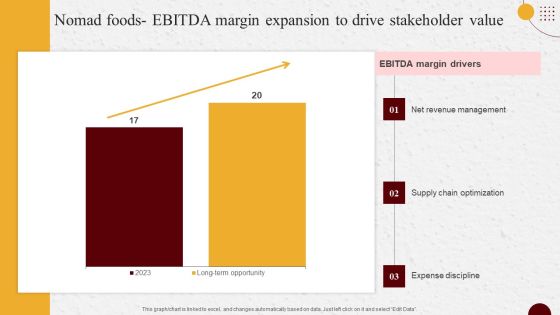
Industry Report Of Packaged Food Products Part 2 Nomad Foods EBITDA Margin Guidelines PDF
Slidegeeks is here to make your presentations a breeze with Industry Report Of Packaged Food Products Part 2 Nomad Foods EBITDA Margin Guidelines PDF With our easy to use and customizable templates, you can focus on delivering your ideas rather than worrying about formatting. With a variety of designs to choose from, you are sure to find one that suits your needs. And with animations and unique photos, illustrations, and fonts, you can make your presentation pop. So whether you are giving a sales pitch or presenting to the board, make sure to check out Slidegeeks first.
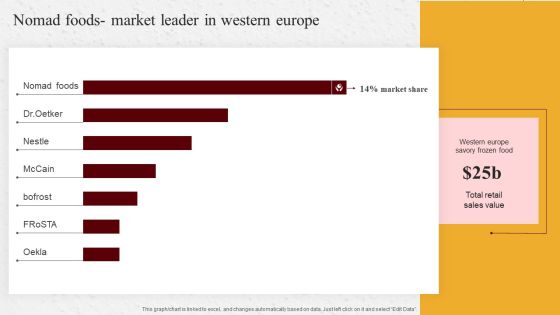
Industry Report Of Packaged Food Products Part 2 Nomad Foods Market Pictures PDF
Whether you have daily or monthly meetings, a brilliant presentation is necessary. Industry Report Of Packaged Food Products Part 2 Nomad Foods Market Pictures PDF can be your best option for delivering a presentation. Represent everything in detail using Industry Report Of Packaged Food Products Part 2 Nomad Foods Market Pictures PDF and make yourself stand out in meetings. The template is versatile and follows a structure that will cater to your requirements. All the templates prepared by Slidegeeks are easy to download and edit. Our research experts have taken care of the corporate themes as well. So, give it a try and see the results.
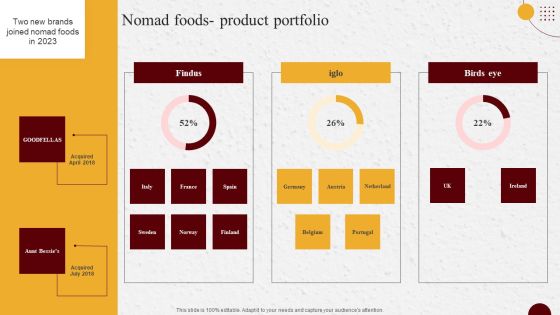
Industry Report Of Packaged Food Products Part 2 Nomad Foods Product Portfolio Ideas PDF
Find highly impressive Industry Report Of Packaged Food Products Part 2 Nomad Foods Product Portfolio Ideas PDF on Slidegeeks to deliver a meaningful presentation. You can save an ample amount of time using these presentation templates. No need to worry to prepare everything from scratch because Slidegeeks experts have already done a huge research and work for you. You need to download Industry Report Of Packaged Food Products Part 2 Nomad Foods Product Portfolio Ideas PDF for your upcoming presentation. All the presentation templates are 100 percent editable and you can change the color and personalize the content accordingly. Download now.

Historical Performance Analysis Of Bitcoin Blockchain Technology Inspiration PDF
The Slide shows the yearly price average price of bitcoin blockchain from 2009 to 2021. The slides coves the price of 1000 bitcoins in 2009 and afterwards the price of 1 Bitcoin per year from 2010 to 2021. Showcasing this set of slides titled Historical Performance Analysis Of Bitcoin Blockchain Technology Inspiration PDF. The topics addressed in these templates are Historical Performance Analysis, Bitcoin Blockchain Technology. All the content presented in this PPT design is completely editable. Download it and make adjustments in color, background, font etc. as per your unique business setting.

Advertising Channels Use Percentage Exploded Circle Chart Sample PDF
This slide illustrates the percentage usage chart of advertising mediums. It includes percentages of outdoor billboards, internet, magazine and newspaper, and metro advertising. Showcasing this set of slides titled Advertising Channels Use Percentage Exploded Circle Chart Sample PDF. The topics addressed in these templates are Metro Advertising, Magazine And Newspaper, Internet, Outdoor, Billboard. All the content presented in this PPT design is completely editable. Download it and make adjustments in color, background, font etc. as per your unique business setting.

Business Components Share Exploded Donut Circle Chart Elements PDF
This slide depicts the share of business components for a successful company and earn profits. It shows the percentage distribution of different components of business. Pitch your topic with ease and precision using this Business Components Share Exploded Donut Circle Chart Elements PDF. This layout presents information on Administration, Marketing, Customer Support. It is also available for immediate download and adjustment. So, changes can be made in the color, design, graphics or any other component to create a unique layout.

Car Company Market Share Circle Chart Slides PDF
This slide depicts the market share percentage chart of car companies in the USA to determine the market leader. It shows percentage share of General motors, Toyota, Stellanis, and Hyundai. Showcasing this set of slides titled Car Company Market Share Circle Chart Slides PDF. The topics addressed in these templates are Car Company Market, Share Circle Chart. All the content presented in this PPT design is completely editable. Download it and make adjustments in color, background, font etc. as per your unique business setting.

Countries Information Technology Export Share Circle Chart Inspiration PDF
This slide depicts IT export share chart of countries to determine global market share. It includes export market share percentage of different countries. Pitch your topic with ease and precision using this Countries Information Technology Export Share Circle Chart Inspiration PDF. This layout presents information on Countries Information Technology, Export Share Circle Chart. It is also available for immediate download and adjustment. So, changes can be made in the color, design, graphics or any other component to create a unique layout.

Employee Monthly Expenses Distribution Circle Chart Elements PDF
This slide depicts the monthly expenses distribution chart of an employee. It includes monthly expenses of which are house rent, grocery, transport, and savings. Showcasing this set of slides titled Employee Monthly Expenses Distribution Circle Chart Elements PDF. The topics addressed in these templates are Savings, Kids School Fee, Transport, Grocery, Rent. All the content presented in this PPT design is completely editable. Download it and make adjustments in color, background, font etc. as per your unique business setting.

Employees Sales Performance Comparison Circle Chart Topics PDF
This slide shows the sales share percentage chart by salespersons to gain an understanding of the performance of employees. It includes teams and their sales percentage. Pitch your topic with ease and precision using this Employees Sales Performance Comparison Circle Chart Topics PDF. This layout presents information on Employees Sales Performance, Comparison Circle Chart. It is also available for immediate download and adjustment. So, changes can be made in the color, design, graphics or any other component to create a unique layout.
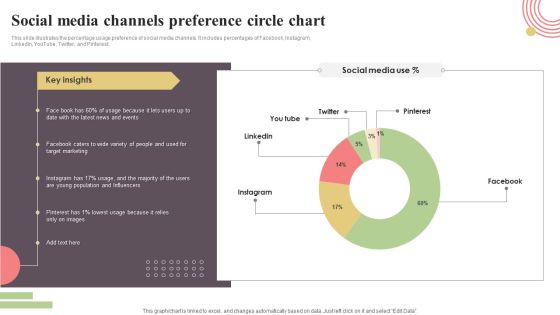
Social Media Channels Preference Circle Chart Clipart PDF
This slide illustrates the percentage usage preference of social media channels. It includes percentages of Facebook, Instagram, LinkedIn, YouTube, Twitter, and Pinterest. Showcasing this set of slides titled Social Media Channels Preference Circle Chart Clipart PDF. The topics addressed in these templates are Facebook, Instagram, Pinterest, Twitter, You Tube. All the content presented in this PPT design is completely editable. Download it and make adjustments in color, background, font etc. as per your unique business setting.

Software Sales Distribution Circle Chart Demonstration PDF
This slide shows sales distribution of software chart to determine market leader in IT industry. It shows quarterly software sales distribution in percentage. Pitch your topic with ease and precision using this Software Sales Distribution Circle Chart Demonstration PDF. This layout presents information on Software Sales Distribution, Circle Chart. It is also available for immediate download and adjustment. So, changes can be made in the color, design, graphics or any other component to create a unique layout.
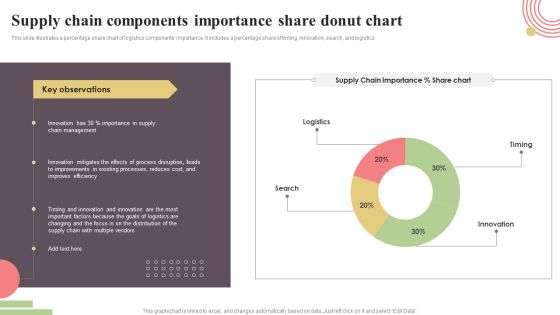
Supply Chain Components Importance Share Donut Chart Rules PDF
This slide illustrates a percentage share chart of logistics components importance. It includes a percentage share of timing, innovation, search, and logistics. Showcasing this set of slides titled Supply Chain Components Importance Share Donut Chart Rules PDF. The topics addressed in these templates are Timing, Innovation, Search, Logistics. All the content presented in this PPT design is completely editable. Download it and make adjustments in color, background, font etc. as per your unique business setting.

USA Phone Market Share Circle Chart Sample PDF
This slide depicts phone market share chart of USA to determine market leader in United States of America. It includes market share of phone companies in USA. Pitch your topic with ease and precision using this USA Phone Market Share Circle Chart Sample PDF. This layout presents information on USA Phone Market, Share Circle Chart. It is also available for immediate download and adjustment. So, changes can be made in the color, design, graphics or any other component to create a unique layout.

Digital Marketing Statistics For Client Acquisition Strategy Background PDF
This slide signifies the bar graph of digital marketing strategies implemented to optimize customer conversion rate. It includes search engine optimisation, paid search, social media, display advertisement. Showcasing this set of slides titled Digital Marketing Statistics For Client Acquisition Strategy Background PDF. The topics addressed in these templates are Optimization, Social Media, Marketing. All the content presented in this PPT design is completely editable. Download it and make adjustments in color, background, font etc. as per your unique business setting.

KPI Dashboard To Measure Sales Divisional Strategy Growth Formats PDF
This slide signifies the key performance indicator to measure sales department strategy growth. It covers information regarding to the units sold, top 10 project, target per agent. Showcasing this set of slides titled KPI Dashboard To Measure Sales Divisional Strategy Growth Formats PDF. The topics addressed in these templates are Sales, Target. All the content presented in this PPT design is completely editable. Download it and make adjustments in color, background, font etc. as per your unique business setting.

KPI Dashboard To Measure Sales Divisional Strategy Performance Microsoft PDF
This slide signifies the key performance indicator dashboard to evaluate sales department strategy. It covers information regarding to the leads generated, conversion rate, top product in revenue. Pitch your topic with ease and precision using this KPI Dashboard To Measure Sales Divisional Strategy Performance Microsoft PDF. This layout presents information on Sales Rations, Lead Generation, Customer Conversion. It is also available for immediate download and adjustment. So, changes can be made in the color, design, graphics or any other component to create a unique layout.
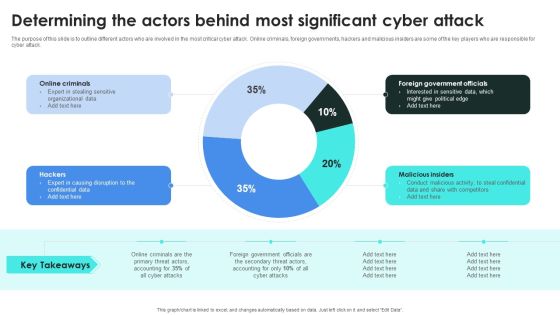
Implementing Cybersecurity Awareness Program To Prevent Attacks Determining The Actors Behind Designs PDF
The purpose of this slide is to outline different actors who are involved in the most critical cyber attack. Online criminals, foreign governments, hackers and malicious insiders are some of the key players who are responsible for cyber attack. Present like a pro with Implementing Cybersecurity Awareness Program To Prevent Attacks Determining The Actors Behind Designs PDF Create beautiful presentations together with your team, using our easy to use presentation slides. Share your ideas in real time and make changes on the fly by downloading our templates. So whether you are in the office, on the go, or in a remote location, you can stay in sync with your team and present your ideas with confidence. With Slidegeeks presentation got a whole lot easier. Grab these presentations today.
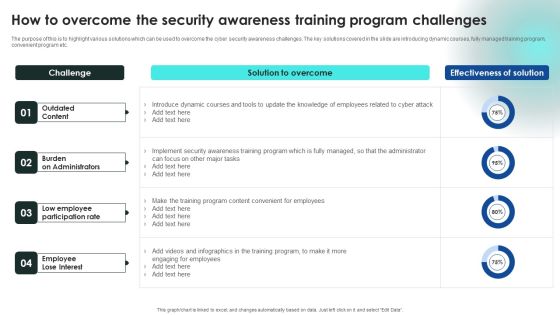
Implementing Cybersecurity Awareness Program To Prevent Attacks How To Overcome The Security Awareness Summary PDF
The purpose of this is to highlight various solutions which can be used to overcome the cyber security awareness challenges. The key solutions covered in the slide are introducing dynamic courses, fully managed training program, convenient program etc. If you are looking for a format to display your unique thoughts, then the professionally designed Implementing Cybersecurity Awareness Program To Prevent Attacks How To Overcome The Security Awareness Summary PDF is the one for you. You can use it as a Google Slides template or a PowerPoint template. Incorporate impressive visuals, symbols, images, and other charts. Modify or reorganize the text boxes as you desire. Experiment with shade schemes and font pairings. Alter, share or cooperate with other people on your work. Download Implementing Cybersecurity Awareness Program To Prevent Attacks How To Overcome The Security Awareness Summary PDF and find out how to give a successful presentation. Present a perfect display to your team and make your presentation unforgettable.
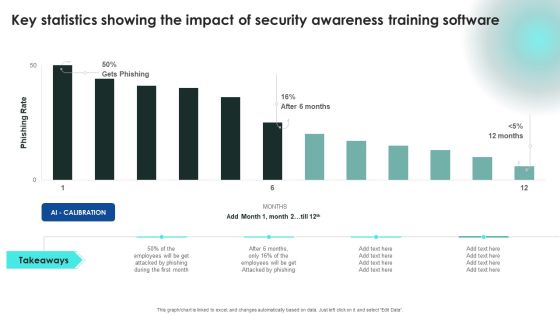
Implementing Cybersecurity Awareness Program To Prevent Attacks Key Statistics Showing The Impact Of Security Clipart PDF
This modern and well arranged Implementing Cybersecurity Awareness Program To Prevent Attacks Key Statistics Showing The Impact Of Security Clipart PDF provides lots of creative possibilities. It is very simple to customize and edit with the Powerpoint Software. Just drag and drop your pictures into the shapes. All facets of this template can be edited with Powerpoint no extra software is necessary. Add your own material, put your images in the places assigned for them, adjust the colors, and then you can show your slides to the world, with an animated slide included.
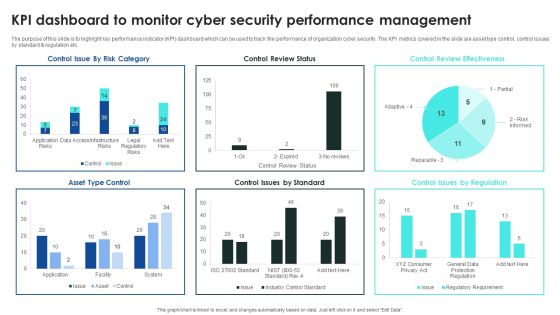
Implementing Cybersecurity Awareness Program To Prevent Attacks KPI Dashboard To Monitor Cyber Security Introduction PDF
The purpose of this slide is to highlight key performance indicator KPI dashboard which can be used to track the performance of organization cyber security. The KPI metrics covered in the slide are asset type control, control issues by standard and regulation etc. This Implementing Cybersecurity Awareness Program To Prevent Attacks KPI Dashboard To Monitor Cyber Security Introduction PDF is perfect for any presentation, be it in front of clients or colleagues. It is a versatile and stylish solution for organizing your meetings. The Implementing Cybersecurity Awareness Program To Prevent Attacks KPI Dashboard To Monitor Cyber Security Introduction PDF features a modern design for your presentation meetings. The adjustable and customizable slides provide unlimited possibilities for acing up your presentation. Slidegeeks has done all the homework before launching the product for you. So, do not wait, grab the presentation templates today
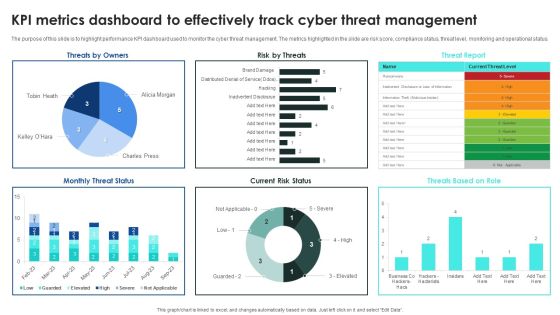
Implementing Cybersecurity Awareness Program To Prevent Attacks KPI Metrics Dashboard To Effectively Track Inspiration PDF
The purpose of this slide is to highlight performance KPI dashboard used to monitor the cyber threat management. The metrics highlighted in the slide are risk score, compliance status, threat level, monitoring and operational status. Welcome to our selection of the Implementing Cybersecurity Awareness Program To Prevent Attacks KPI Metrics Dashboard To Effectively Track Inspiration PDF. These are designed to help you showcase your creativity and bring your sphere to life. Planning and Innovation are essential for any business that is just starting out. This collection contains the designs that you need for your everyday presentations. All of our PowerPoints are 100 percent editable, so you can customize them to suit your needs. This multi purpose template can be used in various situations. Grab these presentation templates today.
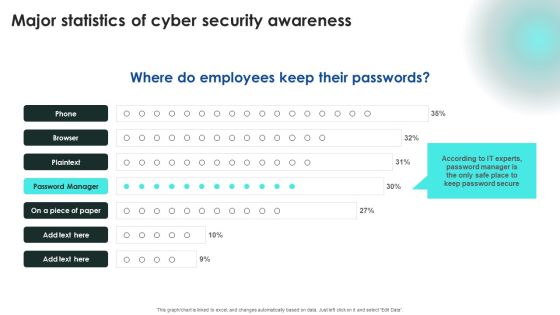
Implementing Cybersecurity Awareness Program To Prevent Attacks Major Statistics Of Cyber Security Awareness Structure PDF
Explore a selection of the finest Implementing Cybersecurity Awareness Program To Prevent Attacks Major Statistics Of Cyber Security Awareness Structure PDF here. With a plethora of professionally designed and pre made slide templates, you can quickly and easily find the right one for your upcoming presentation. You can use our Implementing Cybersecurity Awareness Program To Prevent Attacks Major Statistics Of Cyber Security Awareness Structure PDF to effectively convey your message to a wider audience. Slidegeeks has done a lot of research before preparing these presentation templates. The content can be personalized and the slides are highly editable. Grab templates today from Slidegeeks.
Implementing Cybersecurity Awareness Program To Prevent Attacks Measuring The Impact Of Security Awareness Icons PDF
The purpose of this slide is to highlight the positive impact of security awareness training. Information covered in this slide is related to malware attack, social engineering attack and business email compromise. The Implementing Cybersecurity Awareness Program To Prevent Attacks Measuring The Impact Of Security Awareness Icons PDF is a compilation of the most recent design trends as a series of slides. It is suitable for any subject or industry presentation, containing attractive visuals and photo spots for businesses to clearly express their messages. This template contains a variety of slides for the user to input data, such as structures to contrast two elements, bullet points, and slides for written information. Slidegeeks is prepared to create an impression.

Implementing Cybersecurity Awareness Program To Prevent Attacks Operational Outlook Of Security Awareness Elements PDF
The purpose of this slide is to showcase the general outlook of cyber security awareness training software. The slide covers information about opened simulations, links clicked, reported, attachments opened, data entered etc. Slidegeeks has constructed Implementing Cybersecurity Awareness Program To Prevent Attacks Operational Outlook Of Security Awareness Elements PDF after conducting extensive research and examination. These presentation templates are constantly being generated and modified based on user preferences and critiques from editors. Here, you will find the most attractive templates for a range of purposes while taking into account ratings and remarks from users regarding the content. This is an excellent jumping off point to explore our content and will give new users an insight into our top notch PowerPoint Templates.
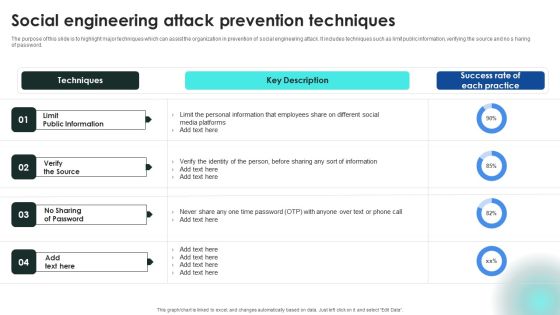
Implementing Cybersecurity Awareness Program To Prevent Attacks Social Engineering Attack Prevention Techniques Topics PDF
The purpose of this slide is to highlight major techniques which can assist the organization in prevention of social engineering attack. It includes techniques such as limit public information, verifying the source and no s haring of password. There are so many reasons you need a Implementing Cybersecurity Awareness Program To Prevent Attacks Social Engineering Attack Prevention Techniques Topics PDF. The first reason is you cannot spend time making everything from scratch, Thus, Slidegeeks has made presentation templates for you too. You can easily download these templates from our website easily.

Annual Customer Online Browsing Trends Ideas PDF
The following slide shows bar graph depicting the online browsing trends for the past year. It is categorized on the basis of different consumer generations such as gen. Z, millennial, gen. X ,boomer etc. Showcasing this set of slides titled Annual Customer Online Browsing Trends Ideas PDF. The topics addressed in these templates are Online Browsing, Millennial Spent, Possible Reasons. All the content presented in this PPT design is completely editable. Download it and make adjustments in color, background, font etc. as per your unique business setting.
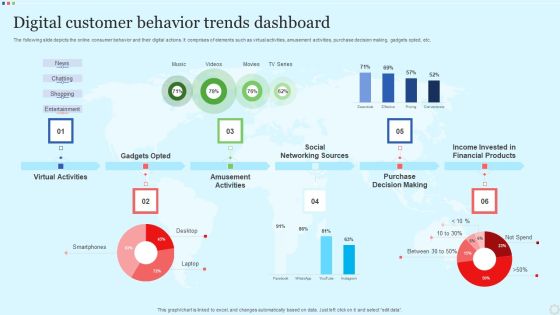
Digital Customer Behavior Trends Dashboard Slides PDF
The following slide depicts the online consumer behavior and their digital actions. It comprises of elements such as virtual activities, amusement activities, purchase decision making, gadgets opted, etc. Showcasing this set of slides titled Digital Customer Behavior Trends Dashboard Slides PDF. The topics addressed in these templates are Virtual Activities, Gadgets Opted, Amusement Activities. All the content presented in this PPT design is completely editable. Download it and make adjustments in color, background, font etc. as per your unique business setting.

Generation Z Customer Shopping Trends For Apparel Designs PDF
The following slide depicts the apparel shopping trends among generation z. It constitutes of various shopping options available to the consumers along the percentage of their preference. Pitch your topic with ease and precision using this Generation Z Customer Shopping Trends For Apparel Designs PDF. This layout presents information on Physical Stores, Through Social Media, Through Calling. It is also available for immediate download and adjustment. So, changes can be made in the color, design, graphics or any other component to create a unique layout.
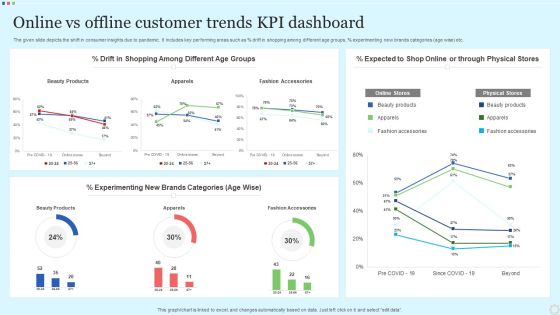
Online Vs Offline Customer Trends Kpi Dashboard Rules PDF
The given slide depicts the shift in consumer insights due to pandemic. It includes key performing areas such as percent drift in shopping among different age groups, percent experimenting new brands categories age wise etc. Showcasing this set of slides titled Online Vs Offline Customer Trends Kpi Dashboard Rules PDF. The topics addressed in these templates are Beauty Products, Apparels, Fashion Accessories. All the content presented in this PPT design is completely editable. Download it and make adjustments in color, background, font etc. as per your unique business setting.

Virtual Customer Healthcare Trends Among Different Generations Professional PDF
The below slide depicts the consumer trends in healthcare industry. The graph includes the data for the past two years comparing the percentage of change in the virtual visits among different generations. Pitch your topic with ease and precision using this Virtual Customer Healthcare Trends Among Different Generations Professional PDF. This layout presents information on Millennial, Baby Boomers, Seniors. It is also available for immediate download and adjustment. So, changes can be made in the color, design, graphics or any other component to create a unique layout.
Digital Marketing Dashboard For Tracking Lead Generation Guidelines PDF
This slide showcases dashboard for digital marketing that can help organization track the monthly leads generated and performance of online marketing campaigns. Its key components are lead breakdown, total lead by program, web traffic targets, key conversion metrics, trial leads by region, total social media channels and key conversion metrics. Showcasing this set of slides titled Digital Marketing Dashboard For Tracking Lead Generation Guidelines PDF. The topics addressed in these templates are Lead By Program, Lead Breakdown, Key Conversion Metrics. All the content presented in this PPT design is completely editable. Download it and make adjustments in color, background, font etc. as per your unique business setting.
Lead Tracking Dashboard With Metric Comparison Brochure PDF
This slide showcases dashboard of lead pipeline that can help to identify total number of leads generated and expenses incurred to acquire the audience. It also showcases other key performance metrics like lead breakdown by status and number of leads per month. Pitch your topic with ease and precision using this Lead Tracking Dashboard With Metric Comparison Brochure PDF. This layout presents information on Metric Comparison, Lead Pipeline, Lead Breakdown Status. It is also available for immediate download and adjustment. So, changes can be made in the color, design, graphics or any other component to create a unique layout.
Lead Tracking Metrics Dashboard With User Responses Diagrams PDF
This slide showcases dashboard for lead conversion metrics that can help organization to filter out total leads interested from the leads who have responded to the phone calls by organization. It also showcases key metrics such as leads busiest hours, leads busiest days, phone number types and lead types. Showcasing this set of slides titled Lead Tracking Metrics Dashboard With User Responses Diagrams PDF. The topics addressed in these templates are Busiest Hours Leads, Conversion Metrics, Lead Types. All the content presented in this PPT design is completely editable. Download it and make adjustments in color, background, font etc. as per your unique business setting.
Monthly Comparison Dashboard For Lead Tracking Sample PDF
This slide showcases dashboard that can help organization to compare the leads converted in different months and make changes in sales and marketing campaigns . Its key components lead generated by country, by industry type and lead sources by month. Showcasing this set of slides titled Monthly Comparison Dashboard For Lead Tracking Sample PDF. The topics addressed in these templates are Leads Received, Industry Type, Lead Generated. All the content presented in this PPT design is completely editable. Download it and make adjustments in color, background, font etc. as per your unique business setting.

Sales Monitoring Dashboard With Monthly Qualified Leads Guidelines PDF
This slide showcases dashboard that can help organization to monitor the sales pipeline velocity and predict future sales more accurately plus increase the leads converted. Its key components are monthly qualified leads, win rate based on deal size, monthly sales cycle and number of leads at each stage of pipeline. Pitch your topic with ease and precision using this Sales Monitoring Dashboard With Monthly Qualified Leads Guidelines PDF. This layout presents information on Monthly Qualified, Monthly Sales Cycle, Deal Size. It is also available for immediate download and adjustment. So, changes can be made in the color, design, graphics or any other component to create a unique layout.
Sales Performance Dashboard With Average Lead Tracking Time Background PDF
This slide showcases dashboard for sales performance that can help organization to analyze the effectiveness of sales campaigns and average response time of lead. Its key components are average contract value, average sales cycle length, follow up contract rate and sales activity. Showcasing this set of slides titled Sales Performance Dashboard With Average Lead Tracking Time Background PDF. The topics addressed in these templates are Avg Contract Value, Sales Activity, Contract Rate. All the content presented in this PPT design is completely editable. Download it and make adjustments in color, background, font etc. as per your unique business setting.
Website Leads Tracking Dashboard With Traffic Sources Infographics PDF
This slide showcases dashboard for lead generation that can help organziation to identify the traffic sources plus visitors and make changes in SEO of website. It also showcases key metrics that are bounce rate by week, visitors by user type, top channels by conversion, top campaign by conversion and top pages by conversion. Pitch your topic with ease and precision using this Website Leads Tracking Dashboard With Traffic Sources Infographics PDF. This layout presents information on Visitors User Type, Traffic Sources, Bounce Rate Week. It is also available for immediate download and adjustment. So, changes can be made in the color, design, graphics or any other component to create a unique layout.
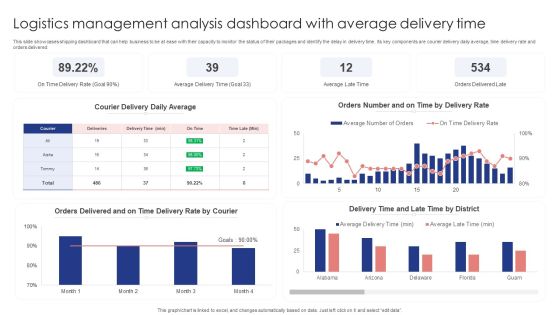
Logistics Management Analysis Dashboard With Average Delivery Time Themes PDF
This slide showcases shipping dashboard that can help business to be at ease with their capacity to monitor the status of their packages and identify the delay in delivery time. Its key components are courier delivery daily average, time delivery rate and orders delivered. Showcasing this set of slides titled Logistics Management Analysis Dashboard With Average Delivery Time Themes PDF. The topics addressed in these templates are Courier Delivery Daily Average, Delivery Rate, Orders Delivered. All the content presented in this PPT design is completely editable. Download it and make adjustments in color, background, font etc. as per your unique business setting.
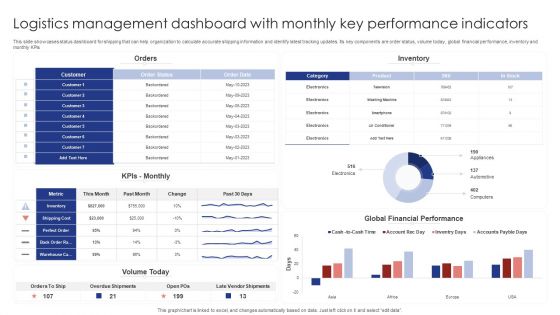
Logistics Management Dashboard With Monthly Key Performance Indicators Rules PDF
This slide showcases status dashboard for shipping that can help organization to calculate accurate shipping information and identify latest tracking updates. Its key components are order status, volume today, global financial performance, inventory and monthly KPIs. Pitch your topic with ease and precision using this Logistics Management Dashboard With Monthly Key Performance Indicators Rules PDF. This layout presents information on Orders, Inventory, Kpis Monthly. It is also available for immediate download and adjustment. So, changes can be made in the color, design, graphics or any other component to create a unique layout.
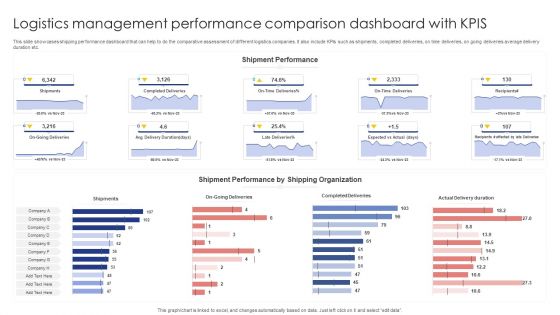
Logistics Management Performance Comparison Dashboard With Kpis Sample PDF
This slide showcases shipping performance dashboard that can help to do the comparative assessment of different logistics companies. It also include KPIs such as shipments, completed deliveries, on time deliveries, on going deliveries average delivery duration etc. Pitch your topic with ease and precision using this Logistics Management Performance Comparison Dashboard With Kpis Sample PDF. This layout presents information on Shipments, Completed Deliveries, Actual Delivery Duration. It is also available for immediate download and adjustment. So, changes can be made in the color, design, graphics or any other component to create a unique layout.

Logistics Management Revenue Analysis Dashboard With Orders Revenue Brochure PDF
This slide showcases shipping dashboard that can help company to calculate the revenue generated from delivered products and track the monthly order status. Its key components are highest revenue days, subscription revenue, order status, order revenue and transaction paid status. Showcasing this set of slides titled Logistics Management Revenue Analysis Dashboard With Orders Revenue Brochure PDF. The topics addressed in these templates are Order Revenue, Transaction Paid, Subscription Revenue. All the content presented in this PPT design is completely editable. Download it and make adjustments in color, background, font etc. as per your unique business setting.

New Orders Logistics Management Dashboard With Delivery Status Designs PDF
This slide showcases shipping management dashboard that can help company to daily track the status of their new orders shipped. Its key components are recent orders, items ordered, items shipped and total shipped orders. Pitch your topic with ease and precision using this New Orders Logistics Management Dashboard With Delivery Status Designs PDF. This layout presents information on Recent Orders, Current Shipping Status, New Orders. It is also available for immediate download and adjustment. So, changes can be made in the color, design, graphics or any other component to create a unique layout.

Order Logistics Management Dashboard With Revenue Generated Slides PDF
This slide showcases shipment tracking dashboard that can help company to track the status of order in real time and revenue earned in last quarter. It also includes no of orders and email feedback received. Showcasing this set of slides titled Order Logistics Management Dashboard With Revenue Generated Slides PDF. The topics addressed in these templates are Total Revenue, Emails Feedback, Orders Graph. All the content presented in this PPT design is completely editable. Download it and make adjustments in color, background, font etc. as per your unique business setting.

Dashboard For Tracking Global Share Market Indices Formats PDF
Following slide represent a comprehensive dashboard to track stock market indices of different countries. The indices mentioned in the slide are DOW jones, NASDAQ, S and P along with the highest and lowest price of indices on a particular day. Showcasing this set of slides titled Dashboard For Tracking Global Share Market Indices Formats PDF. The topics addressed in these templates are Global Share, Market Indices, Abbreviations. All the content presented in this PPT design is completely editable. Download it and make adjustments in color, background, font etc. as per your unique business setting.
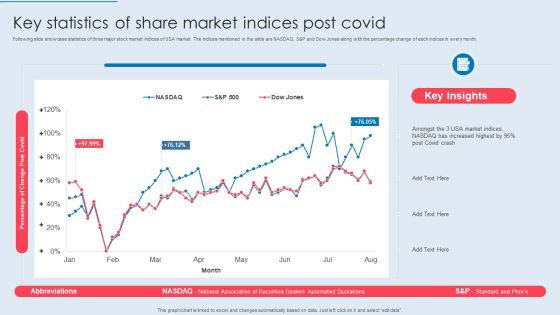
Key Statistics Of Share Market Indices Post Covid Sample PDF
Following slide showcase statistics of three major stock market indices of USA market. The indices mentioned in the slide are NASDAQ, S and P and Dow Jones along with the percentage change of each indices in every month. Showcasing this set of slides titled Key Statistics Of Share Market Indices Post Covid Sample PDF. The topics addressed in these templates are Percentage Change Post Covid, Increased Highest, Indices Post Covid. All the content presented in this PPT design is completely editable. Download it and make adjustments in color, background, font etc. as per your unique business setting.
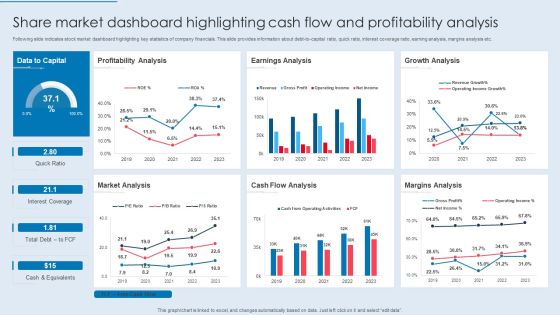
Share Market Dashboard Highlighting Cash Flow And Profitability Analysis Information PDF
Following slide indicates stock market dashboard highlighting key statistics of company financials. This slide provides information about debt-to-capital ratio, quick ratio, interest coverage ratio, earning analysis, margins analysis etc. Showcasing this set of slides titled Share Market Dashboard Highlighting Cash Flow And Profitability Analysis Information PDF. The topics addressed in these templates are Profitability Analysis, Earnings Analysis, Growth Analysis. All the content presented in this PPT design is completely editable. Download it and make adjustments in color, background, font etc. as per your unique business setting.

Share Market Dashboard Highlighting Price Moving Average Trend Themes PDF
Following slide outlines stock market dashboard of an industry. The various metrics highlighted in the slide are stock codes, previous day price of stock, percent of price change, maximum and lowest price of stock, moving average trend etc. Pitch your topic with ease and precision using this Share Market Dashboard Highlighting Price Moving Average Trend Themes PDF. This layout presents information on Moving Average, Stock Price, Performing Stocks. It is also available for immediate download and adjustment. So, changes can be made in the color, design, graphics or any other component to create a unique layout.
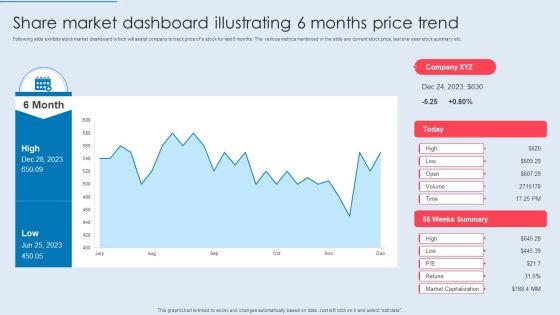
Share Market Dashboard Illustrating 6 Months Price Trend Ideas PDF
Following slide exhibits stock market dashboard which will assist company to track price of a stock for last 6 months. The various metrics mentioned in the slide are current stock price, last one year stock summary etc. Showcasing this set of slides titled Share Market Dashboard Illustrating 6 Months Price Trend Ideas PDF. The topics addressed in these templates are Share Market, Dashboard Illustrating, Months Price Trend. All the content presented in this PPT design is completely editable. Download it and make adjustments in color, background, font etc. as per your unique business setting.

Share Market Dashboard Indicating Candlestick Time Series Formats PDF
Following slide showcase stock market KPI dashboard which will assist company to understand stock performance. It provides information about open, close, highest and lowest price of stock on particular day, candlestick time series etc. Pitch your topic with ease and precision using this Share Market Dashboard Indicating Candlestick Time Series Formats PDF. This layout presents information on Candlestick Time Series, Stock Change, US Sector. It is also available for immediate download and adjustment. So, changes can be made in the color, design, graphics or any other component to create a unique layout.

Stock Market Analysis Dashboard With Market Capitalization And Net Profit Elements PDF
Following slide showcase comprehensive stock market dashboard which will assist companies for the comparison purpose. The metrics covered in the slide are top stocks by market capitalization, EPS, net profit and PE ratio. Pitch your topic with ease and precision using this Stock Market Analysis Dashboard With Market Capitalization And Net Profit Elements PDF. This layout presents information on Company, Net Profit, Market Capitalization. It is also available for immediate download and adjustment. So, changes can be made in the color, design, graphics or any other component to create a unique layout.
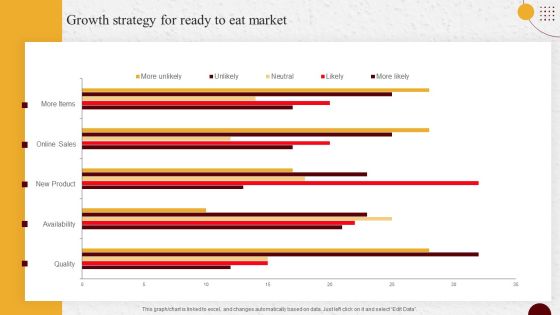
Industry Report Of Packaged Food Products Part 1 Growth Strategy For Ready To Eat Market Mockup PDF
Whether you have daily or monthly meetings, a brilliant presentation is necessary. Industry Report Of Packaged Food Products Part 1 Growth Strategy For Ready To Eat Market Mockup PDF can be your best option for delivering a presentation. Represent everything in detail using Industry Report Of Packaged Food Products Part 1 Growth Strategy For Ready To Eat Market Mockup PDF and make yourself stand out in meetings. The template is versatile and follows a structure that will cater to your requirements. All the templates prepared by Slidegeeks are easy to download and edit. Our research experts have taken care of the corporate themes as well. So, give it a try and see the results.
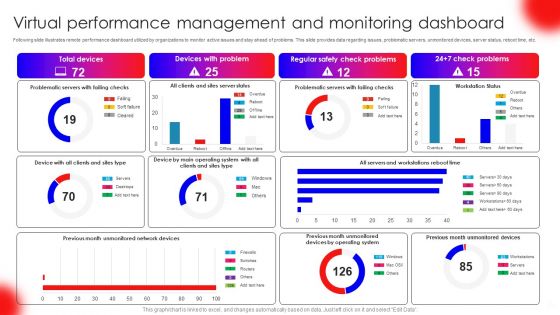
Virtual Performance Management And Monitoring Dashboard Pictures PDF
Following slide illustrates remote performance dashboard utilized by organizations to monitor active issues and stay ahead of problems. This slide provides data regarding issues, problematic servers, unmonitored devices, server status, reboot time, etc. Pitch your topic with ease and precision using this Virtual Performance Management And Monitoring Dashboard Pictures PDF. This layout presents information on Total Devices, Devices With Problem, Regular Safety Check Problems. It is also available for immediate download and adjustment. So, changes can be made in the color, design, graphics or any other component to create a unique layout.
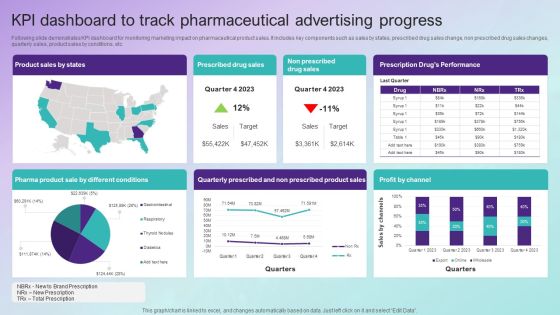
KPI Dashboard To Track Pharmaceutical Advertising Progress Topics PDF
Following slide demonstrates KPI dashboard for monitoring marketing impact on pharmaceutical product sales. It includes key components such as sales by states, prescribed drug sales change, non prescribed drug sales changes, quarterly sales, product sales by conditions, etc. Showcasing this set of slides titled KPI Dashboard To Track Pharmaceutical Advertising Progress Topics PDF. The topics addressed in these templates are Product Sales By States, Prescribed Drug Sales, Non Prescribed Drug Sales, Profit By Channel. All the content presented in this PPT design is completely editable. Download it and make adjustments in color, background, font etc. as per your unique business setting.
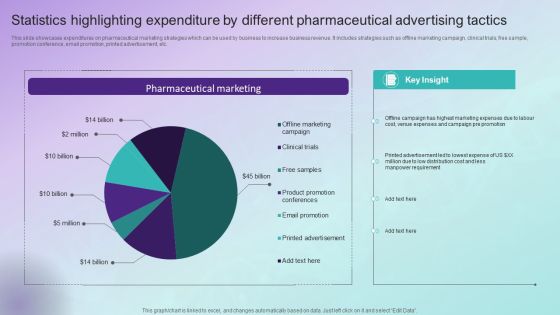
Statistics Highlighting Expenditure By Different Pharmaceutical Advertising Tactics Mockup PDF
This slide showcases expenditures on pharmaceutical marketing strategies which can be used by business to increase business revenue. It includes strategies such as offline marketing campaign, clinical trials, free sample, promotion conference, email promotion, printed advertisement, etc. Pitch your topic with ease and precision using this Statistics Highlighting Expenditure By Different Pharmaceutical Advertising Tactics Mockup PDF. This layout presents information on Offline Marketing Campaign, Clinical Trials, Free Sample, Promotion Conference, Email Promotion, Printed Advertisement. It is also available for immediate download and adjustment. So, changes can be made in the color, design, graphics or any other component to create a unique layout.
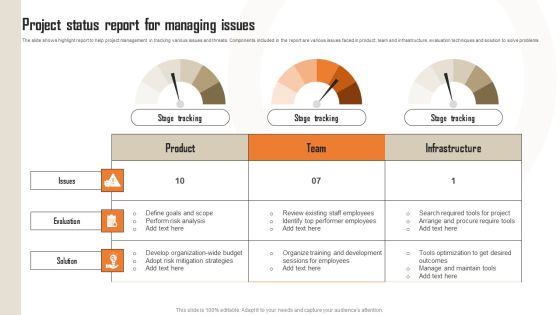
Project Status Report For Managing Issues Mockup PDF
The slide shows highlight report to help project management in tracking various issues and threats. Components included in the report are various issues faced in product, team and infrastructure, evaluation techniques and solution to solve problems. Showcasing this set of slides titled Project Status Report For Managing Issues Mockup PDF. The topics addressed in these templates are Issues, Evaluation, Solution. All the content presented in this PPT design is completely editable. Download it and make adjustments in color, background, font etc. as per your unique business setting.

Direct Response Marketing Guide Ultimate Success Analytics Dashboard To Track Mockup PDF
This slide provides an overview of the analytics dashboard that helps to measure the performance of the website. The dashboard includes visits, average session duration, bounce rate, page views and goal conversion. Find highly impressive Direct Response Marketing Guide Ultimate Success Analytics Dashboard To Track Mockup PDF on Slidegeeks to deliver a meaningful presentation. You can save an ample amount of time using these presentation templates. No need to worry to prepare everything from scratch because Slidegeeks experts have already done a huge research and work for you. You need to download Direct Response Marketing Guide Ultimate Success Analytics Dashboard To Track Mockup PDF for your upcoming presentation. All the presentation templates are 100 percent editable and you can change the color and personalize the content accordingly. Download now
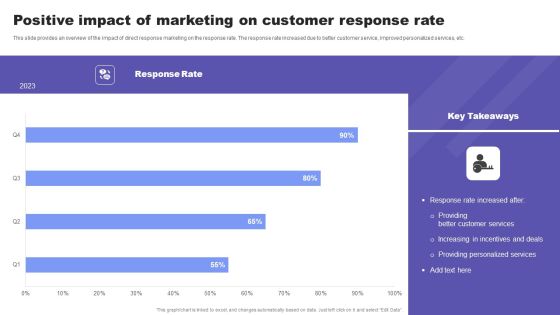
Direct Response Marketing Guide Ultimate Success Positive Impact Of Marketing On Customer Introduction PDF
This slide provides an overview of the impact of direct response marketing on the response rate. The response rate increased due to better customer service, improved personalized services, etc. Crafting an eye-catching presentation has never been more straightforward. Let your presentation shine with this tasteful yet straightforward Direct Response Marketing Guide Ultimate Success Positive Impact Of Marketing On Customer Introduction PDF template. It offers a minimalistic and classy look that is great for making a statement. The colors have been employed intelligently to add a bit of playfulness while still remaining professional. Construct the ideal Direct Response Marketing Guide Ultimate Success Positive Impact Of Marketing On Customer Introduction PDF that effortlessly grabs the attention of your audience Begin now and be certain to wow your customers
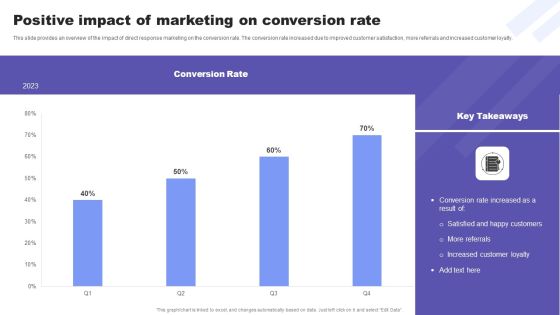
Direct Response Marketing Guide Ultimate Success Positive Impact Of Marketing On Diagrams PDF
This slide provides an overview of the impact of direct response marketing on the conversion rate. The conversion rate increased due to improved customer satisfaction, more referrals and increased customer loyalty. Make sure to capture your audiences attention in your business displays with our gratis customizable Direct Response Marketing Guide Ultimate Success Positive Impact Of Marketing On Diagrams PDF. These are great for business strategies, office conferences, capital raising or task suggestions. If you desire to acquire more customers for your tech business and ensure they stay satisfied, create your own sales presentation with these plain slides.

Discovering Apples Billion Dollar Branding Secret Analysing Apple Brand Valuation As A Global Leader Brochure PDF
This slide provides information regarding brand valuation of apple as a global leader. It showcases comparative assessment of apple in terms of market share, brand equity, etc. Create an editable Discovering Apples Billion Dollar Branding Secret Analysing Apple Brand Valuation As A Global Leader Ideas PDF that communicates your idea and engages your audience. Whether youre presenting a business or an educational presentation, pre designed presentation templates help save time. Discovering Apples Billion Dollar Branding Secret Analysing Apple Brand Valuation As A Global Leader Ideas PDF is highly customizable and very easy to edit, covering many different styles from creative to business presentations. Slidegeeks has creative team members who have crafted amazing templates. So, go and get them without any delay.
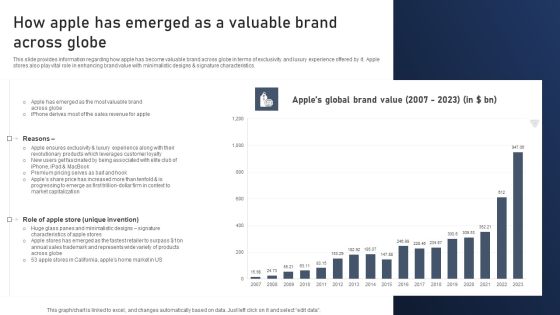
Discovering Apples Billion Dollar Branding Secret How Apple Has Emerged As A Valuable Brand Across Globe Graphics PDF
This slide provides information regarding how apple has become valuable brand across globe in terms of exclusivity and luxury experience offered by it. Apple stores also play vital role in enhancing brand value with minimalistic designs and signature characteristics. This modern and well arranged Discovering Apples Billion Dollar Branding Secret How Apple Has Emerged As A Valuable Brand Across Globe Graphics PDF provides lots of creative possibilities. It is very simple to customize and edit with the Powerpoint Software. Just drag and drop your pictures into the shapes. All facets of this template can be edited with Powerpoint no extra software is necessary. Add your own material, put your images in the places assigned for them, adjust the colors, and then you can show your slides to the world, with an animated slide included.
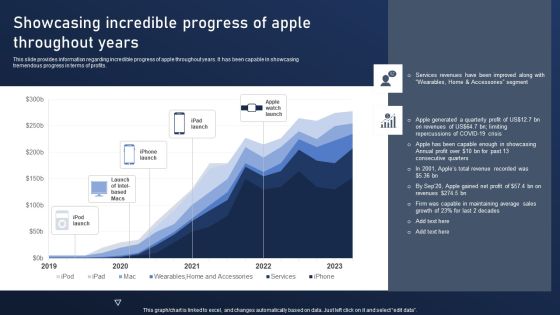
Discovering Apples Billion Dollar Branding Secret Showcasing Incredible Progress Of Apple Throughout Years Brochure PDF
This slide provides information regarding incredible progress of apple throughout years. It has been capable in showcasing tremendous progress in terms of profits. Take your projects to the next level with our ultimate collection of Discovering Apples Billion Dollar Branding Secret Showcasing Incredible Progress Of Apple Throughout Years Brochure PDF. Slidegeeks has designed a range of layouts that are perfect for representing task or activity duration, keeping track of all your deadlines at a glance. Tailor these designs to your exact needs and give them a truly corporate look with your own brand colors they will make your projects stand out from the rest.

Client Onboarding Journey Impact On Business Impact 2 Decreased Customer Response Template PDF
This slide showcases the negative impact of customer onboarding challenges on the business. The challenges covered are decreased product adoption and customer response rate. Create an editable Client Onboarding Journey Impact On Business Impact 2 Decreased Customer Response Template PDF that communicates your idea and engages your audience. Whether you are presenting a business or an educational presentation, pre-designed presentation templates help save time. Client Onboarding Journey Impact On Business Impact 2 Decreased Customer Response Template PDF is highly customizable and very easy to edit, covering many different styles from creative to business presentations. Slidegeeks has creative team members who have crafted amazing templates. So, go and get them without any delay.
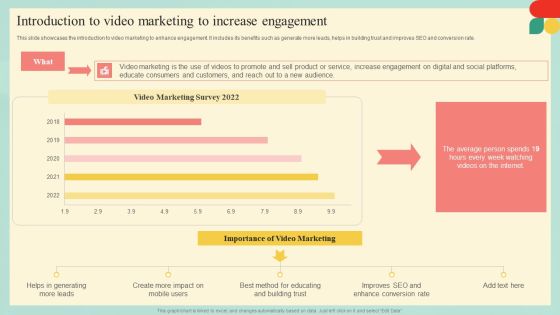
Guide Developing Strategies Improve Travel Tourism Marketing Introduction To Pictures PDF
This slide showcases the introduction to video marketing to enhance engagement. It includes its benefits such as generate more leads, helps in building trust and improves SEO and conversion rate. Crafting an eye-catching presentation has never been more straightforward. Let your presentation shine with this tasteful yet straightforward Guide Developing Strategies Improve Travel Tourism Marketing Introduction To Pictures PDF template. It offers a minimalistic and classy look that is great for making a statement. The colors have been employed intelligently to add a bit of playfulness while still remaining professional. Construct the ideal Guide Developing Strategies Improve Travel Tourism Marketing Introduction To Pictures PDF that effortlessly grabs the attention of your audience Begin now and be certain to wow your customers
Intelligence Amplification IA IT Augmented Intelligence Information Tracking Dashboard Topics PDF
This slide depicts the information tracking dashboard by augmented intelligence model covering the data analysis. Data analysis includes image analysis, storage size, new users on the cloud platform, etc. Want to ace your presentation in front of a live audience Our Intelligence Amplification IA IT Augmented Intelligence Information Tracking Dashboard Topics PDF can help you do that by engaging all the users towards you.. Slidegeeks experts have put their efforts and expertise into creating these impeccable powerpoint presentations so that you can communicate your ideas clearly. Moreover, all the templates are customizable, and easy-to-edit and downloadable. Use these for both personal and commercial use.

Intelligence Amplification IA IT Global Augmented Intelligence Market Size 2022 2026 Information PDF
This slide represents the global market size of augmented intelligence from 2022 to 2026. The growing volume of complex commercial data is driving the augmented intelligence market and is projected to grow with a CAGR of 27.49 percent. Get a simple yet stunning designed Intelligence Amplification IA IT Global Augmented Intelligence Market Size 2022 2026 Information PDF. It is the best one to establish the tone in your meetings. It is an excellent way to make your presentations highly effective. So, download this PPT today from Slidegeeks and see the positive impacts. Our easy-to-edit Intelligence Amplification IA IT Global Augmented Intelligence Market Size 2022 2026 Information PDF can be your go-to option for all upcoming conferences and meetings. So, what are you waiting for Grab this template today.
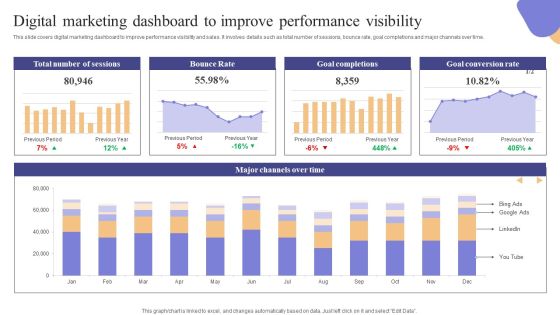
Digital Marketing Dashboard To Improve Performance Visibility Brochure PDF
This slide covers digital marketing dashboard to improve performance visibility and sales. It involves details such as total number of sessions, bounce rate, goal completions and major channels over time. If you are looking for a format to display your unique thoughts, then the professionally designed Digital Marketing Dashboard To Improve Performance Visibility Brochure PDF is the one for you. You can use it as a Google Slides template or a PowerPoint template. Incorporate impressive visuals, symbols, images, and other charts. Modify or reorganize the text boxes as you desire. Experiment with shade schemes and font pairings. Alter, share or cooperate with other people on your work. Download Digital Marketing Dashboard To Improve Performance Visibility Brochure PDF and find out how to give a successful presentation. Present a perfect display to your team and make your presentation unforgettable.
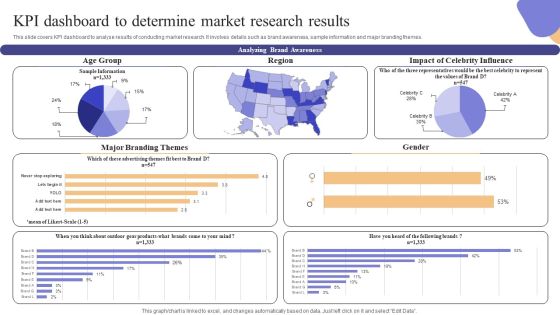
KPI Dashboard To Determine Market Research Results Information PDF
This slide covers KPI dashboard to analyse results of conducting market research. It involves details such as brand awareness, sample information and major branding themes. Crafting an eye-catching presentation has never been more straightforward. Let your presentation shine with this tasteful yet straightforward KPI Dashboard To Determine Market Research Results Information PDF template. It offers a minimalistic and classy look that is great for making a statement. The colors have been employed intelligently to add a bit of playfulness while still remaining professional. Construct the ideal KPI Dashboard To Determine Market Research Results Information PDF that effortlessly grabs the attention of your audience Begin now and be certain to wow your customers
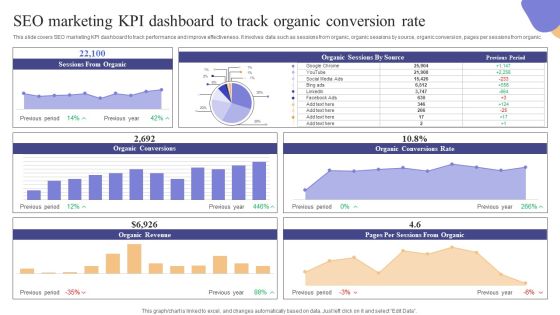
SEO Marketing KPI Dashboard To Track Organic Conversion Rate Microsoft PDF
This slide covers SEO marketing KPI dashboard to track performance and improve effectiveness. It involves data such as sessions from organic, organic sessions by source, organic conversion, pages per sessions from organic. Formulating a presentation can take up a lot of effort and time, so the content and message should always be the primary focus. The visuals of the PowerPoint can enhance the presenters message, so our SEO Marketing KPI Dashboard To Track Organic Conversion Rate Microsoft PDF was created to help save time. Instead of worrying about the design, the presenter can concentrate on the message while our designers work on creating the ideal templates for whatever situation is needed. Slidegeeks has experts for everything from amazing designs to valuable content, we have put everything into SEO Marketing KPI Dashboard To Track Organic Conversion Rate Microsoft PDF

Comprehensive Customer Data Platform Guide Optimizing Promotional Initiatives Customer Behaviour Analysis KPI Brochure PDF
The following slide showcases customer behavior assessment to gain competitive advantages and analyze their purchase pattern. It includes elements such as visitors, by device, page views, top pages, domains etc. Coming up with a presentation necessitates that the majority of the effort goes into the content and the message you intend to convey. The visuals of a PowerPoint presentation can only be effective if it supplements and supports the story that is being told. Keeping this in mind our experts created Comprehensive Customer Data Platform Guide Optimizing Promotional Initiatives Customer Behaviour Analysis KPI Brochure PDF to reduce the time that goes into designing the presentation. This way, you can concentrate on the message while our designers take care of providing you with the right template for the situation.

Comprehensive Customer Data Platform Guide Optimizing Promotional Initiatives Customer Loyalty And Lifetime Value Brochure PDF
The following slide showcases key performance indicators of customer lifetime value analysis to enhance product quality and user experience. It includes elements such as direct, paid searches, organic, checkouts, campaign performance, monthly traffic etc. Explore a selection of the finest Comprehensive Customer Data Platform Guide Optimizing Promotional Initiatives Customer Loyalty And Lifetime Value Brochure PDF here. With a plethora of professionally designed and pre made slide templates, you can quickly and easily find the right one for your upcoming presentation. You can use our Comprehensive Customer Data Platform Guide Optimizing Promotional Initiatives Customer Loyalty And Lifetime Value Brochure PDF to effectively convey your message to a wider audience. Slidegeeks has done a lot of research before preparing these presentation templates. The content can be personalized and the slides are highly editable. Grab templates today from Slidegeeks.

Comprehensive Customer Data Platform Guide Optimizing Promotional Initiatives Email Campaign Performance Evaluation Information PDF
The following slide depicts email campaign performance dashboard to connect with audience and gather real time insights. It includes elements such as highest open rate, active customers, average engagement per customer, daily performance analysis etc. Take your projects to the next level with our ultimate collection of Comprehensive Customer Data Platform Guide Optimizing Promotional Initiatives Email Campaign Performance Evaluation Information PDF. Slidegeeks has designed a range of layouts that are perfect for representing task or activity duration, keeping track of all your deadlines at a glance. Tailor these designs to your exact needs and give them a truly corporate look with your own brand colors they will make your projects stand out from the rest.

Public Relations Guide To Enhance Brand Credibility Best PR Marketing Agency Overview Elements PDF
This slide shows the overview of best public relations agency. It includes details regarding type, headquarters, owner, websites, etc. Do you have to make sure that everyone on your team knows about any specific topic I yes, then you should give Public Relations Guide To Enhance Brand Credibility Best PR Marketing Agency Overview Elements PDF a try. Our experts have put a lot of knowledge and effort into creating this impeccable Public Relations Guide To Enhance Brand Credibility Best PR Marketing Agency Overview Elements PDF. You can use this template for your upcoming presentations, as the slides are perfect to represent even the tiniest detail. You can download these templates from the Slidegeeks website and these are easy to edit. So grab these today.
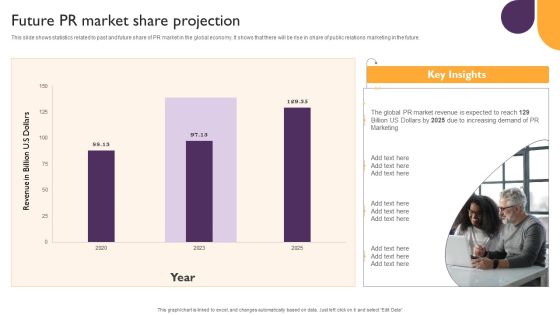
Public Relations Guide To Enhance Brand Credibility Future PR Market Share Projection Summary PDF
This slide shows statistics related to past and future share of PR market in the global economy. It shows that there will be rise in share of public relations marketing in the future. Find highly impressive Public Relations Guide To Enhance Brand Credibility Future PR Market Share Projection Summary PDF on Slidegeeks to deliver a meaningful presentation. You can save an ample amount of time using these presentation templates. No need to worry to prepare everything from scratch because Slidegeeks experts have already done a huge research and work for you. You need to download Public Relations Guide To Enhance Brand Credibility Future PR Market Share Projection Summary PDF for your upcoming presentation. All the presentation templates are 100 percent editable and you can change the color and personalize the content accordingly. Download now.

Public Relations Guide To Enhance Brand Credibility Key Statistics Related To Public Relations Portrait PDF
This slide shows statistics which can be used considered by organizations while developing a PR marketing campaign or plan. It includes stats related to PR firms, PR market revenue, PR agencies annual spend etc. Crafting an eye catching presentation has never been more straightforward. Let your presentation shine with this tasteful yet straightforward Public Relations Guide To Enhance Brand Credibility Key Statistics Related To Public Relations Portrait PDF template. It offers a minimalistic and classy look that is great for making a statement. The colors have been employed intelligently to add a bit of playfulness while still remaining professional. Construct the ideal Public Relations Guide To Enhance Brand Credibility Key Statistics Related To Public Relations Portrait PDF that effortlessly grabs the attention of your audience. Begin now and be certain to wow your customers.
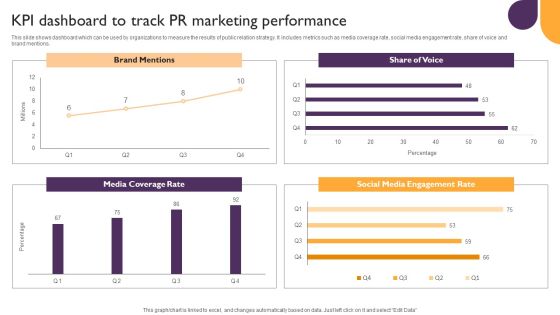
Public Relations Guide To Enhance Brand Credibility KPI Dashboard To Track PR Marketing Performance Diagrams PDF
This slide shows dashboard which can be used by organizations to measure the results of public relation strategy. It includes metrics such as media coverage rate, social media engagement rate, share of voice and brand mentions. Make sure to capture your audiences attention in your business displays with our gratis customizable Public Relations Guide To Enhance Brand Credibility KPI Dashboard To Track PR Marketing Performance Diagrams PDF. These are great for business strategies, office conferences, capital raising or task suggestions. If you desire to acquire more customers for your tech business and ensure they stay satisfied, create your own sales presentation with these plain slides.
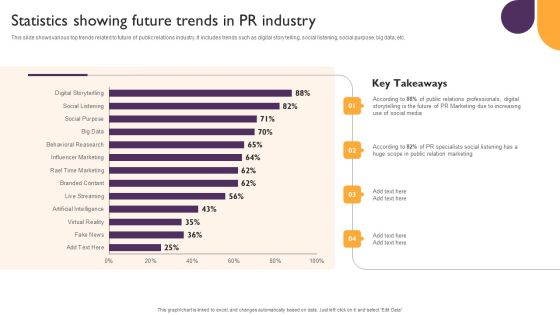
Public Relations Guide To Enhance Brand Credibility Statistics Showing Future Trends In PR Industry Ideas PDF
This slide shows various top trends related to future of public relations industry, It includes trends such as digital story telling, social listening, social purpose, big data, etc. This Public Relations Guide To Enhance Brand Credibility Statistics Showing Future Trends In PR Industry Ideas PDF from Slidegeeks makes it easy to present information on your topic with precision. It provides customization options, so you can make changes to the colors, design, graphics, or any other component to create a unique layout. It is also available for immediate download, so you can begin using it right away. Slidegeeks has done good research to ensure that you have everything you need to make your presentation stand out. Make a name out there for a brilliant performance.

Analyzing Pay Per Click Marketing Campaign Performance Graphics PDF
This slide provides glimpse about analysis of PPC advertising campaign and how it can help our business organization for promoting current product lines in the market. It includes weekly PPC response, metrics, current month, previous month, etc. Find a pre designed and impeccable Analyzing Pay Per Click Marketing Campaign Performance Graphics PDF. The templates can ace your presentation without additional effort. You can download these easy to edit presentation templates to make your presentation stand out from others. So, what are you waiting for Download the template from Slidegeeks today and give a unique touch to your presentation.

Complete Guide Of Paid Media Marketing Techniques Line Chart Background PDF
Want to ace your presentation in front of a live audience Our Complete Guide Of Paid Media Marketing Techniques Line Chart Background PDF can help you do that by engaging all the users towards you. Slidegeeks experts have put their efforts and expertise into creating these impeccable powerpoint presentations so that you can communicate your ideas clearly. Moreover, all the templates are customizable, and easy to edit and downloadable. Use these for both personal and commercial use.
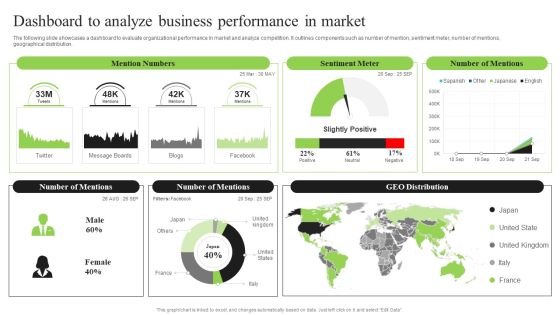
Guidebook For Executing Business Market Intelligence Dashboard To Analyze Business Brochure PDF
The following slide showcases a dashboard to evaluate organizational performance in market and analyze competition. It outlines components such as number of mention, sentiment meter, number of mentions, geographical distribution. Find a pre designed and impeccable Guidebook For Executing Business Market Intelligence Dashboard To Analyze Business Brochure PDF. The templates can ace your presentation without additional effort. You can download these easy to edit presentation templates to make your presentation stand out from others. So, what are you waiting for Download the template from Slidegeeks today and give a unique touch to your presentation.
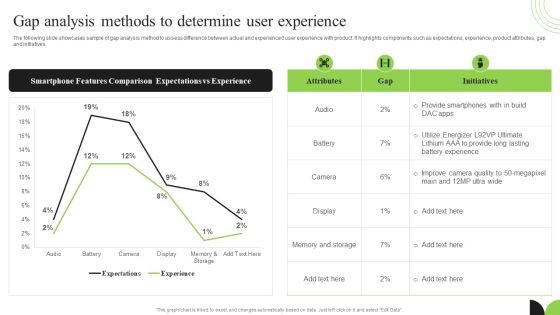
Guidebook For Executing Business Market Intelligence Gap Analysis Methods To Determine Infographics PDF
The following slide showcases sample of gap analysis method to assess difference between actual and experienced user experience with product. It highlights components such as expectations, experience, product attributes, gap and initiatives. Create an editable Guidebook For Executing Business Market Intelligence Gap Analysis Methods To Determine Infographics PDF that communicates your idea and engages your audience. Whether you are presenting a business or an educational presentation, pre designed presentation templates help save time. Guidebook For Executing Business Market Intelligence Gap Analysis Methods To Determine Infographics PDF is highly customizable and very easy to edit, covering many different styles from creative to business presentations. Slidegeeks has creative team members who have crafted amazing templates. So, go and get them without any delay.
Guidebook For Executing Business Market Intelligence Online Tracking To Optimize Website Information PDF
The following slide provides overview of performance indicators for online tracking to manage and optimize user behavior on website. It highlights metrics such as web conversions, users, top landing pages, bounce rate, conversion rate, page, sessions and goals value. Want to ace your presentation in front of a live audience Our Guidebook For Executing Business Market Intelligence Online Tracking To Optimize Website Information PDF can help you do that by engaging all the users towards you. Slidegeeks experts have put their efforts and expertise into creating these impeccable powerpoint presentations so that you can communicate your ideas clearly. Moreover, all the templates are customizable, and easy to edit and downloadable. Use these for both personal and commercial use.
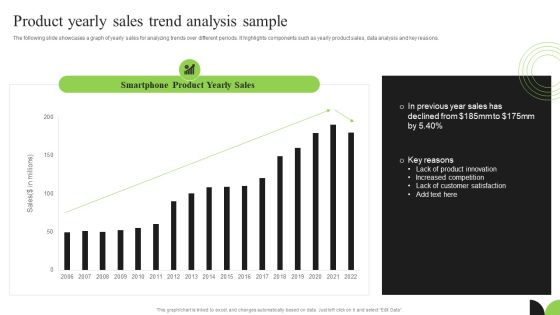
Guidebook For Executing Business Market Intelligence Product Yearly Sales Trend Analysis Sample Pictures PDF
The following slide showcases a graph of yearly sales for analyzing trends over different periods. It highlights components such as yearly product sales, data analysis and key reasons. There are so many reasons you need a Guidebook For Executing Business Market Intelligence Product Yearly Sales Trend Analysis Sample Pictures PDF. The first reason is you can not spend time making everything from scratch, Thus, Slidegeeks has made presentation templates for you too. You can easily download these templates from our website easily.

Guidebook For Executing Business Market Intelligence Statistics Report Showing Market Graphics PDF
This slide presents an statistics reports providing valuable insights of global market based on data collection and analysis. It covers key elements such as forecasted market CAGR, incremental growth, estimated YoY rate, revenue generating market region and key drivers. Do you have to make sure that everyone on your team knows about any specific topic I yes, then you should give Guidebook For Executing Business Market Intelligence Statistics Report Showing Market Graphics PDF a try. Our experts have put a lot of knowledge and effort into creating this impeccable Guidebook For Executing Business Market Intelligence Statistics Report Showing Market Graphics PDF. You can use this template for your upcoming presentations, as the slides are perfect to represent even the tiniest detail. You can download these templates from the Slidegeeks website and these are easy to edit. So grab these today.
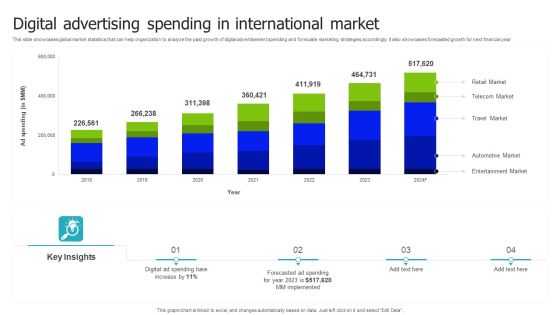
Digital Advertising Spending In International Market Demonstration PDF
This slide showcases global market statistics that can help organization to analyze the past growth of digital advertisement spending and formulate marketing strategies accordingly. It also showcases forecasted growth for next financial year. Showcasing this set of slides titled Digital Advertising Spending In International Market Demonstration PDF. The topics addressed in these templates are Retail Market, Telecom Market, Travel Market . All the content presented in this PPT design is completely editable. Download it and make adjustments in color, background, font etc. as per your unique business setting.
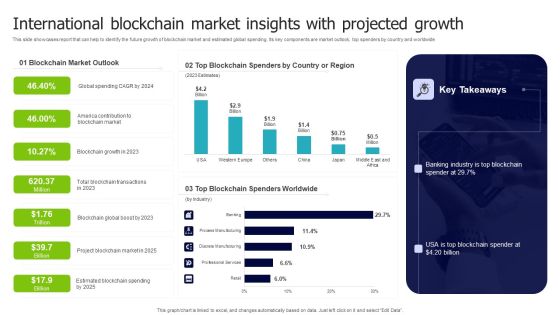
International Blockchain Market Insights With Projected Growth Microsoft PDF
This slide showcases report that can help to identify the future growth of blockchain market and estimated global spending. Its key components are market outlook, top spenders by country and worldwide. Showcasing this set of slides titled International Blockchain Market Insights With Projected Growth Microsoft PDF. The topics addressed in these templates are Blockchain Market Outlook, Blockchain Spenders, Country Region. All the content presented in this PPT design is completely editable. Download it and make adjustments in color, background, font etc. as per your unique business setting.
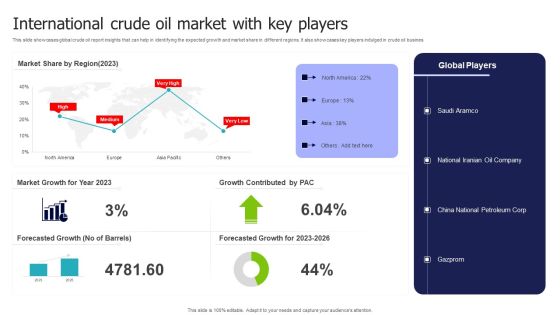
International Crude Oil Market With Key Players Demonstration PDF
This slide showcases global crude oil report insights that can help in identifying the expected growth and market share in different regions. It also showcases key players indulged in crude oil busines. Pitch your topic with ease and precision using this International Crude Oil Market With Key Players Demonstration PDF. This layout presents information on Market Share, Market Growth, Growth Contributed . It is also available for immediate download and adjustment. So, changes can be made in the color, design, graphics or any other component to create a unique layout.
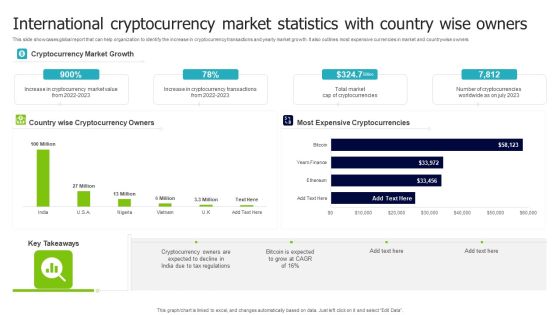
International Cryptocurrency Market Statistics With Country Wise Owners Formats PDF
This slide showcases global report that can help organization to identify the increase in cryptocurrency transactions and yearly market growth. It also outlines most expensive currencies in market and countrywise owners. Showcasing this set of slides titled International Cryptocurrency Market Statistics With Country Wise Owners Formats PDF. The topics addressed in these templates are Cryptocurrency Market Growth, Most Expensive Cryptocurrencies, Cryptocurrency Owners. All the content presented in this PPT design is completely editable. Download it and make adjustments in color, background, font etc. as per your unique business setting.
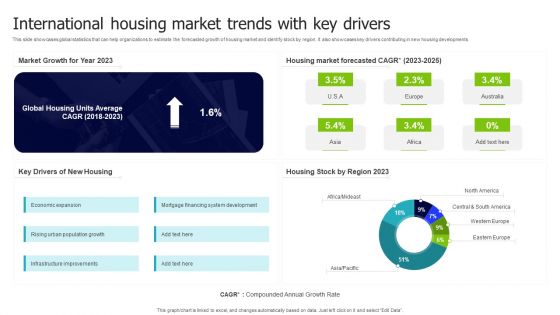
International Housing Market Trends With Key Drivers Inspiration PDF
This slide showcases global statistics that can help organizations to estimate the forecasted growth of housing market and identify stock by region. It also showcases key drivers contributing in new housing developments. Pitch your topic with ease and precision using this International Housing Market Trends With Key Drivers Inspiration PDF. This layout presents information on Key Drivers, Housing Market, Forecasted. It is also available for immediate download and adjustment. So, changes can be made in the color, design, graphics or any other component to create a unique layout.

International SAAS Market Trends With Organizational Challenges Graphics PDF
This slide showcases global report that can help to identify percentage of organizations using cloud computing models and running on SAAS. It also showcases challenges faced by organization running on software as a service model. Showcasing this set of slides titled International SAAS Market Trends With Organizational Challenges Graphics PDF. The topics addressed in these templates are Challenges Organization, Businesses Using Cloud, Companies Running. All the content presented in this PPT design is completely editable. Download it and make adjustments in color, background, font etc. as per your unique business setting.

International Sales Performance Dashboard With Regional Market Report Inspiration PDF
This slide showcases global report that can help organization to estimate forecast of the sales and identify yearly revenue generated. Its key elements are yearly sales, market share, regional outlook, competitor analysis and geographical sales. Pitch your topic with ease and precision using this International Sales Performance Dashboard With Regional Market Report Inspiration PDF. This layout presents information on Regional Outlook, Sales And Forecast, Market Share Overview. It is also available for immediate download and adjustment. So, changes can be made in the color, design, graphics or any other component to create a unique layout.

International Smartphone Shipping Report With Market Share Designs PDF
This slide showcases global report that can help to identify the shipment and market share growth of different smartphone models. It also outlines growth forecast for next financial year. Showcasing this set of slides titled International Smartphone Shipping Report With Market Share Designs PDF. The topics addressed in these templates are Shipment, Share, Global Smartphone Brands. All the content presented in this PPT design is completely editable. Download it and make adjustments in color, background, font etc. as per your unique business setting.

Comparative Analysis For Manual And Automation Testing Lifecycle Icons PDF
This slide showcases graphical report to compare test expenses from manual and automated testing cycles over the years. It further includes details about benefits that can be derived from test automation cycle. Pitch your topic with ease and precision using this Comparative Analysis For Manual And Automation Testing Lifecycle Icons PDF. This layout presents information on Comparative Analysis For Manual, Automation Testing Lifecycle. It is also available for immediate download and adjustment. So, changes can be made in the color, design, graphics or any other component to create a unique layout.
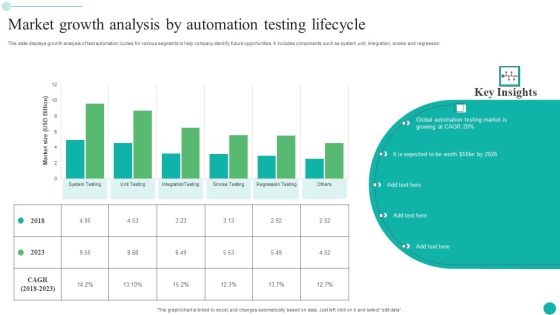
Market Growth Analysis By Automation Testing Lifecycle Themes PDF
This slide displays growth analysis of test automation cycles for various segments to help company identify future opportunities. It includes components such as system, unit, integration, smoke and regression. Pitch your topic with ease and precision using this Market Growth Analysis By Automation Testing Lifecycle Themes PDF. This layout presents information on Market Growth Analysis, Automation Testing Lifecycle. It is also available for immediate download and adjustment. So, changes can be made in the color, design, graphics or any other component to create a unique layout.

IT Security Management Technology User Market Guidelines PDF
The following slide provides the statistical data for user market of IT risk assessment and mitigation software to make business process efficient. The technology used are authentication, firewalls, encryption, data masking and data backup. Showcasing this set of slides titled IT Security Management Technology User Market Guidelines PDF. The topics addressed in these templates are Authentication, Firewalls, Encryption, Data Masking, Data Backup. All the content presented in this PPT design is completely editable. Download it and make adjustments in color, background, font etc. as per your unique business setting.
IT Security Risk Management And Incident Management Dashboard Icons PDF
This slide displays dashboard to help company in designing initiatives to mitigate cybersecurity risks. It includes kpis such as incident management, patches, compliance, vulnerabilities, etc. Showcasing this set of slides titled IT Security Risk Management And Incident Management Dashboard Icons PDF. The topics addressed in these templates are Compliance, Patches, Incident Management, Vulnerabilities Management, Cybersecurity Initiatives. All the content presented in this PPT design is completely editable. Download it and make adjustments in color, background, font etc. as per your unique business setting.

IT Security Risk Management Dashboard With Risk Rating And Breakdown Pictures PDF
This slide displays dashboard for real- time tracking and management of cybersecurity risk to help company formulate appropriate mitigation strategies. It includes kpis such as response plan progress, heat map, action plan, top 5 vulnerabilities, etc. Pitch your topic with ease and precision using this IT Security Risk Management Dashboard With Risk Rating And Breakdown Pictures PDF. This layout presents information on Risk Rating Breakdown, Action Plan Breakdown, Risk Probability Score, Risk Analysis Progress. It is also available for immediate download and adjustment. So, changes can be made in the color, design, graphics or any other component to create a unique layout.
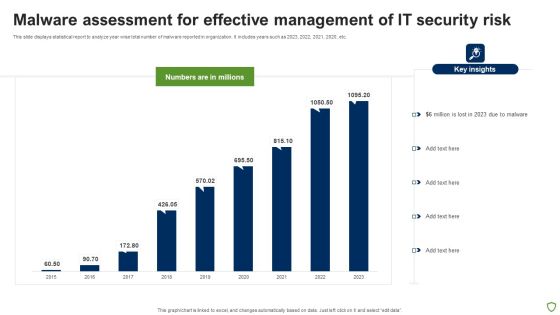
Malware Assessment For Effective Management Of IT Security Risk Portrait PDF
This slide displays statistical report to analyze year wise total number of malware reported in organization. It includes years such as 2023, 2022, 2021, 2020, etc. Showcasing this set of slides titled Malware Assessment For Effective Management Of IT Security Risk Portrait PDF. The topics addressed in these templates are Malware Assessment For Effective, Management IT Security Risk. All the content presented in this PPT design is completely editable. Download it and make adjustments in color, background, font etc. as per your unique business setting.

Analysing Impact Of Real Time Marketing Campaigns Ppt Show Graphic Images PDF
The following slide depicts consequences of real time marketing campaign to assess campaign results and determine areas of improvement. It includes elements such as website traffic, average engagement rate, number of followers along with key insights etc. Formulating a presentation can take up a lot of effort and time, so the content and message should always be the primary focus. The visuals of the PowerPoint can enhance the presenters message, so our Analysing Impact Of Real Time Marketing Campaigns Ppt Show Graphic Images PDF was created to help save time. Instead of worrying about the design, the presenter can concentrate on the message while our designers work on creating the ideal templates for whatever situation is needed. Slidegeeks has experts for everything from amazing designs to valuable content, we have put everything into Analysing Impact Of Real Time Marketing Campaigns Ppt Show Graphic Images PDF

Real Time Content Marketing Result Dashboard Ppt Infographic Template Example PDF
The following slide depicts real time content marketing KPI dashboard to monitor traffic flow and manage promotional efforts. It includes elements such as visitors by channel, conversion rate, search, direct, sessions, average time engaged etc. The Real Time Content Marketing Result Dashboard Ppt Infographic Template Example PDF is a compilation of the most recent design trends as a series of slides. It is suitable for any subject or industry presentation, containing attractive visuals and photo spots for businesses to clearly express their messages. This template contains a variety of slides for the user to input data, such as structures to contrast two elements, bullet points, and slides for written information. Slidegeeks is prepared to create an impression.

Real Time Website Traffic Analysis Dashboard Ppt Inspiration Graphics Download PDF
The following slide depicts real time website traffic analytical dashboard to monitor current events and plan actions accordingly. It includes elements such as traffic sources by location, device type, views per minute, visitor activity status etc. Are you searching for a Real Time Website Traffic Analysis Dashboard Ppt Inspiration Graphics Download PDF that is uncluttered, straightforward, and original Its easy to edit, and you can change the colors to suit your personal or business branding. For a presentation that expresses how much effort you have put in, this template is ideal With all of its features, including tables, diagrams, statistics, and lists, its perfect for a business plan presentation. Make your ideas more appealing with these professional slides. Download Real Time Website Traffic Analysis Dashboard Ppt Inspiration Graphics Download PDF from Slidegeeks today.
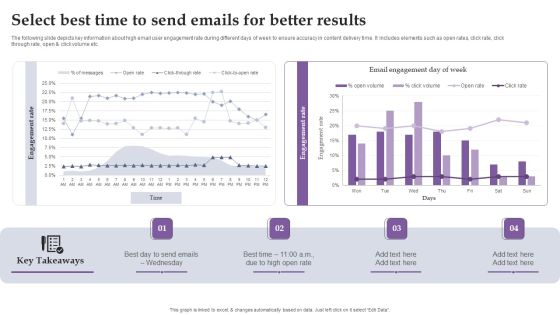
Select Best Time To Send Emails For Better Results Ppt Infographic Template Tips PDF
The following slide depicts key information about high email user engagement rate during different days of week to ensure accuracy in content delivery time. It includes elements such as open rates, click rate, click through rate, open and click volume etc. Retrieve professionally designed Select Best Time To Send Emails For Better Results Ppt Infographic Template Tips PDF to effectively convey your message and captivate your listeners. Save time by selecting pre-made slideshows that are appropriate for various topics, from business to educational purposes. These themes come in many different styles, from creative to corporate, and all of them are easily adjustable and can be edited quickly. Access them as PowerPoint templates or as Google Slides themes. You do not have to go on a hunt for the perfect presentation because Slidegeeks got you covered from everywhere.

Track Campaign Performance To Determine Effective Ctas Ppt Infographic Template Vector PDF
The following slide showcases content marketing campaign performance to evaluate success and monitor effectiveness of marketing efforts. It includes elements such as new visitors, page views, sessions, visitors, event name, blog open count etc. Slidegeeks has constructed Track Campaign Performance To Determine Effective Ctas Ppt Infographic Template Vector PDF after conducting extensive research and examination. These presentation templates are constantly being generated and modified based on user preferences and critiques from editors. Here, you will find the most attractive templates for a range of purposes while taking into account ratings and remarks from users regarding the content. This is an excellent jumping-off point to explore our content and will give new users an insight into our top-notch PowerPoint Templates.

Consumer Account Dashboard For Ecommerce Business Themes PDF
This slide displays analytics for consumers online activity on companys website which includes orders, wish list, credits, return requests, transactions, latest orders, etc which helps sales department to pitch appropriate service plan to customers. Showcasing this set of slides titled Consumer Account Dashboard For Ecommerce Business Themes PDF. The topics addressed in these templates are Dashboard, Return Request, Delivered, Transactions. All the content presented in this PPT design is completely editable. Download it and make adjustments in color, background, font etc. as per your unique business setting.

Data Quality Elements Management Dashboard Download PDF
This slide showcases dashboard for real- time monitoring of data quality dimensions for organization. It further includes KPIs such as accuracy, completeness, consistency, integrity, timeliness, etc. Showcasing this set of slides titled Data Quality Elements Management Dashboard Download PDF. The topics addressed in these templates are Quality Dimensions, Accuracy, Completeness, Consistency, Integrity, Timeliness. All the content presented in this PPT design is completely editable. Download it and make adjustments in color, background, font etc. as per your unique business setting.

Elements Scorecard To Analyze Data Quality Structure PDF
This slide showcases quality assessment on the basis of various dimensions to help company derive consistent real- time data. It includes parameters such as accuracy, completeness, currency, timeliness and accessibility. Showcasing this set of slides titled Elements Scorecard To Analyze Data Quality Structure PDF. The topics addressed in these templates are Elements Scorecard, Analyze Data Quality. All the content presented in this PPT design is completely editable. Download it and make adjustments in color, background, font etc. as per your unique business setting.
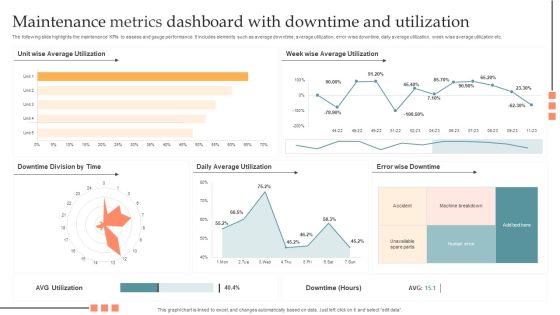
Maintenance Metrics Dashboard With Downtime And Utilization Pictures PDF
The following slide highlights the maintenance KPIs to assess and gauge performance. It includes elements such as average downtime, average utilization, error wise downtime, daily average utilization, week wise average utilization etc. Showcasing this set of slides titled Maintenance Metrics Dashboard With Downtime And Utilization Pictures PDF. The topics addressed in these templates are Maintenance Metrics Dashboard, Downtime And Utilization. All the content presented in this PPT design is completely editable. Download it and make adjustments in color, background, font etc. as per your unique business setting.

Maintenance Metrics To Optimize Production Information PDF
The following slide highlights some maintenance KPIs for manufacturing industry to trace and reduce production downtime. It also includes top downtime reasons along with the present downtime with machine name, reason and duration. Showcasing this set of slides titled Maintenance Metrics To Optimize Production Information PDF. The topics addressed in these templates are Human Error, Misplaced Parts, Machine Breakdown. All the content presented in this PPT design is completely editable. Download it and make adjustments in color, background, font etc. as per your unique business setting.

KPI Dashboard To Monitor Workforce Diversity Portrait PDF
This slide illustrates the KPI dashboard for workforce diversity providing details regarding headcount by seniority, gender and gender. It also provides information regarding monthly median age by gender and women at senior level forecast. Welcome to our selection of the KPI Dashboard To Monitor Workforce Diversity Portrait PDF. These are designed to help you showcase your creativity and bring your sphere to life. Planning and Innovation are essential for any business that is just starting out. This collection contains the designs that you need for your everyday presentations. All of our PowerPoints are 100 percent editable, so you can customize them to suit your needs. This multi purpose template can be used in various situations. Grab these presentation templates today.
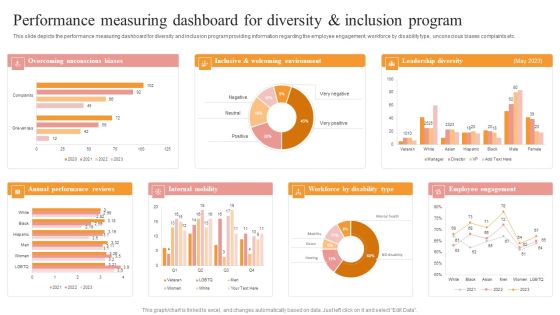
Performance Measuring Dashboard For Diversity And Inclusion Program Summary PDF
This slide depicts the performance measuring dashboard for diversity and inclusion program providing information regarding the employee engagement, workforce by disability type, unconscious biases complaints etc. Explore a selection of the finest Performance Measuring Dashboard For Diversity And Inclusion Program Summary PDF here. With a plethora of professionally designed and pre made slide templates, you can quickly and easily find the right one for your upcoming presentation. You can use our Performance Measuring Dashboard For Diversity And Inclusion Program Summary PDF to effectively convey your message to a wider audience. Slidegeeks has done a lot of research before preparing these presentation templates. The content can be personalized and the slides are highly editable. Grab templates today from Slidegeeks.
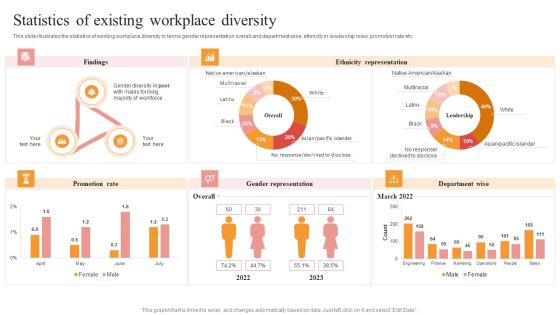
Statistics Of Existing Workplace Diversity Ideas PDF
This slide illustrates the statistics of existing workplace diversity in terms gender representation overall and department wise, ethnicity in leadership roles, promotion rate etc. The Statistics Of Existing Workplace Diversity Ideas PDF is a compilation of the most recent design trends as a series of slides. It is suitable for any subject or industry presentation, containing attractive visuals and photo spots for businesses to clearly express their messages. This template contains a variety of slides for the user to input data, such as structures to contrast two elements, bullet points, and slides for written information. Slidegeeks is prepared to create an impression.

Workforce Diversity Dashboard Based On Gender And Ethnicity Distribution Inspiration PDF
This slide represents the diversity dashboard providing information regarding work force distribution on gender and ethnicity. It also includes details of year wise involuntary and voluntary turnover rates. Retrieve professionally designed Workforce Diversity Dashboard Based On Gender And Ethnicity Distribution Inspiration PDF to effectively convey your message and captivate your listeners. Save time by selecting pre made slideshows that are appropriate for various topics, from business to educational purposes. These themes come in many different styles, from creative to corporate, and all of them are easily adjustable and can be edited quickly. Access them as PowerPoint templates or as Google Slides themes. You do not have to go on a hunt for the perfect presentation because Slidegeeks got you covered from everywhere.
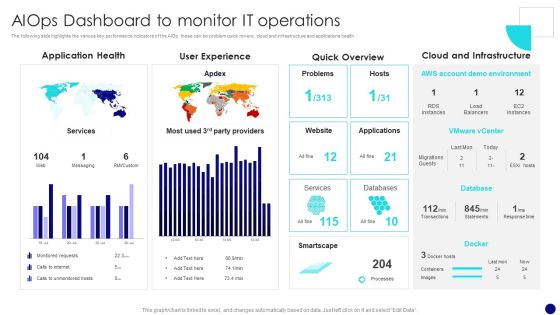
Information Technology Operations Administration With ML Aiops Dashboard To Monitor Diagrams PDF
The following slide highlights the various key performance indicators of the AIOp, these can be problem quick review, cloud and infrastructure and applications health. If you are looking for a format to display your unique thoughts, then the professionally designed Information Technology Operations Administration With ML Aiops Dashboard To Monitor Diagrams PDF is the one for you. You can use it as a Google Slides template or a PowerPoint template. Incorporate impressive visuals, symbols, images, and other charts. Modify or reorganize the text boxes as you desire. Experiment with shade schemes and font pairings. Alter, share or cooperate with other people on your work. Download Information Technology Operations Administration With ML Aiops Dashboard To Monitor Diagrams PDF and find out how to give a successful presentation. Present a perfect display to your team and make your presentation unforgettable.

Information Technology Operations Administration With ML Artificial Intelligence In It Operations Introduction PDF
The purpose of the following slide is to show the industry segmentation by application , these may be Real time analytics, infrastructure management, application performance Managements and cloud monitoring. Are you in need of a template that can accommodate all of your creative concepts This one is crafted professionally and can be altered to fit any style. Use it with Google Slides or PowerPoint. Include striking photographs, symbols, depictions, and other visuals. Fill, move around, or remove text boxes as desired. Test out color palettes and font mixtures. Edit and save your work, or work with colleagues. Download Information Technology Operations Administration With ML Artificial Intelligence In It Operations Introduction PDF and observe how to make your presentation outstanding. Give an impeccable presentation to your group and make your presentation unforgettable.

Information Technology Operations Administration With ML Competitive Landscaping Graphics PDF
The purpose of the following slide is to show the industry segmentation by application , these may be Real time analytics, infrastructure management, application performance Managements and cloud monitoring. Formulating a presentation can take up a lot of effort and time, so the content and message should always be the primary focus. The visuals of the PowerPoint can enhance the presenters message, so our Information Technology Operations Administration With ML Competitive Landscaping Graphics PDF was created to help save time. Instead of worrying about the design, the presenter can concentrate on the message while our designers work on creating the ideal templates for whatever situation is needed. Slidegeeks has experts for everything from amazing designs to valuable content, we have put everything into Information Technology Operations Administration With ML Competitive Landscaping Graphics PDF.

Information Technology Operations Administration With ML Customer Service Formats PDF
The following slide highlights the customer service dashboard that shows the use of AI in customer satisfaction. This modern and well arranged Information Technology Operations Administration With ML Customer Service Formats PDF provides lots of creative possibilities. It is very simple to customize and edit with the Powerpoint Software. Just drag and drop your pictures into the shapes. All facets of this template can be edited with Powerpoint no extra software is necessary. Add your own material, put your images in the places assigned for them, adjust the colors, and then you can show your slides to the world, with an animated slide included.
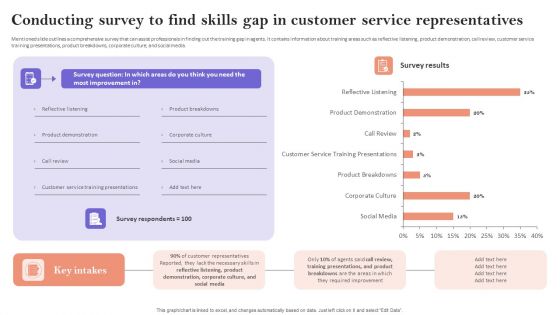
Conducting Survey To Find Skills Gap In Customer Service Representatives Structure PDF
Mentioned slide outlines a comprehensive survey that can assist professionals in finding out the training gap in agents. It contains information about training areas such as reflective listening, product demonstration, call review, customer service training presentations, product breakdowns, corporate culture, and social media. Present like a pro with Conducting Survey To Find Skills Gap In Customer Service Representatives Structure PDF Create beautiful presentations together with your team, using our easy to use presentation slides. Share your ideas in real time and make changes on the fly by downloading our templates. So whether you are in the office, on the go, or in a remote location, you can stay in sync with your team and present your ideas with confidence. With Slidegeeks presentation got a whole lot easier. Grab these presentations today.

KPI Metrics Dashboard To Measure Success Of Customer Churn Prevention Strategies Diagrams PDF
Mentioned slide outlines a key performance indicator KPI dashboard which will assist managers to showcase the result of customer attrition prevention strategies. The KPIs are risky customers, retention rate, monthly recurring revenue MRR, churn risk by location and income, etc. This KPI Metrics Dashboard To Measure Success Of Customer Churn Prevention Strategies Diagrams PDF is perfect for any presentation, be it in front of clients or colleagues. It is a versatile and stylish solution for organizing your meetings. The KPI Metrics Dashboard To Measure Success Of Customer Churn Prevention Strategies Diagrams PDF features a modern design for your presentation meetings. The adjustable and customizable slides provide unlimited possibilities for acing up your presentation. Slidegeeks has done all the homework before launching the product for you. So, do not wait, grab the presentation templates today

Measuring Net Retention And Revenue Churn With Kpi Dashboard Ideas PDF
Mentioned slide outlines a comprehensive dashboard outlining the results of customer churn prevention strategies. The key performance indicators KPIs covered in the slide are net promoter score NPS, loyal customer rate, customer lifetime value CLV, revenue churn, net retention rate, etc. The Measuring Net Retention And Revenue Churn With Kpi Dashboard Ideas PDF is a compilation of the most recent design trends as a series of slides. It is suitable for any subject or industry presentation, containing attractive visuals and photo spots for businesses to clearly express their messages. This template contains a variety of slides for the user to input data, such as structures to contrast two elements, bullet points, and slides for written information. Slidegeeks is prepared to create an impression.
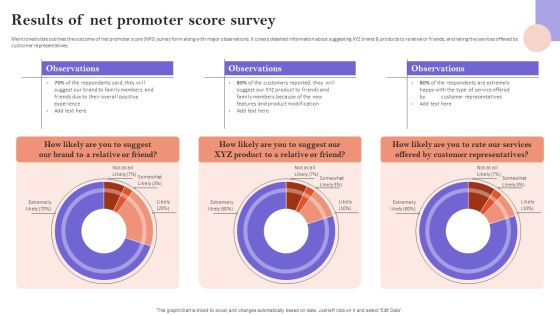
Results Of Net Promoter Score Survey Themes PDF
Mentioned slide outlines the outcome of net promoter score NPS survey form along with major observations. It covers detailed information about suggesting XYZ brand and products to relative or friends, and rating the services offered by customer representatives. Find a pre designed and impeccable Results Of Net Promoter Score Survey Themes PDF. The templates can ace your presentation without additional effort. You can download these easy to edit presentation templates to make your presentation stand out from others. So, what are you waiting for Download the template from Slidegeeks today and give a unique touch to your presentation.

Understanding The Customer Attrition Rate On Monthly Basis Mockup PDF
Mentioned slide outlines the customer churn rate in four different months. The parameters used to calculate the attrition rate are customers at beginning of the month, total customers lost, churn rate, and customers at end of the month. The highest attrition rate is observed in last month. Create an editable Understanding The Customer Attrition Rate On Monthly Basis Mockup PDF that communicates your idea and engages your audience. Whether youre presenting a business or an educational presentation, pre designed presentation templates help save time. Understanding The Customer Attrition Rate On Monthly Basis Mockup PDF is highly customizable and very easy to edit, covering many different styles from creative to business presentations. Slidegeeks has creative team members who have crafted amazing templates. So, go and get them without any delay.

Workplace Safety Best Practices Occupation Of Fatal And Injured Employees Themes PDF
This slide highlights the occupation of fatal and injured employees on the organization which showcase machine operator, care worker, maintenance worker, plant operatives and emergency service worker. This Workplace Safety Best Practices Occupation Of Fatal And Injured Employees Themes PDF is perfect for any presentation, be it in front of clients or colleagues. It is a versatile and stylish solution for organizing your meetings. The Workplace Safety Best Practices Occupation Of Fatal And Injured Employees Themes PDF features a modern design for your presentation meetings. The adjustable and customizable slides provide unlimited possibilities for acing up your presentation. Slidegeeks has done all the homework before launching the product for you. So, do not wait, grab the presentation templates today

Workplace Safety Dashboard To Monitor Incidents Clipart PDF
This slide highlights the workplace safety dashboard which showcase incidents per employee, worksite incident total, incidents by total and top injuries by body part. There are so many reasons you need a Workplace Safety Dashboard To Monitor Incidents Clipart PDF. The first reason is you cannot spend time making everything from scratch, Thus, Slidegeeks has made presentation templates for you too. You can easily download these templates from our website easily.

Market Evaluation Customer Survey Dashboard Topics PDF
The slide showcases the dashboard showing an overview of response from market survey analysis. It includes demographic factors such as gender, age group, top languages, top interests and occupations. Showcasing this set of slides titled Market Evaluation Customer Survey Dashboard Topics PDF. The topics addressed in these templates are Gender, Age Group, Top Languages, Top Interests And Occupations. All the content presented in this PPT design is completely editable. Download it and make adjustments in color, background, font etc. as per your unique business setting.
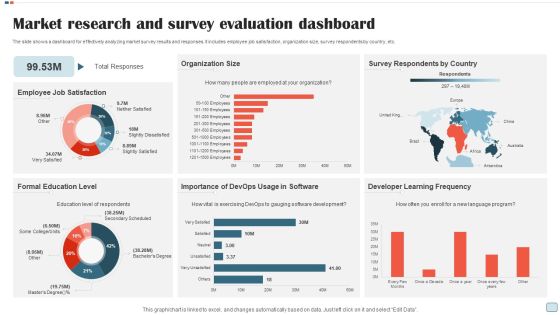
Market Research And Survey Evaluation Dashboard Rules PDF
The slide shows a dashboard for effectively analyzing market survey results and responses. It includes employee job satisfaction, organization size, survey respondents by country, etc. Pitch your topic with ease and precision using this Market Research And Survey Evaluation Dashboard Rules PDF. This layout presents information on Employee Job Satisfaction, Organization Size, Survey Respondents By Country. It is also available for immediate download and adjustment. So, changes can be made in the color, design, graphics or any other component to create a unique layout.
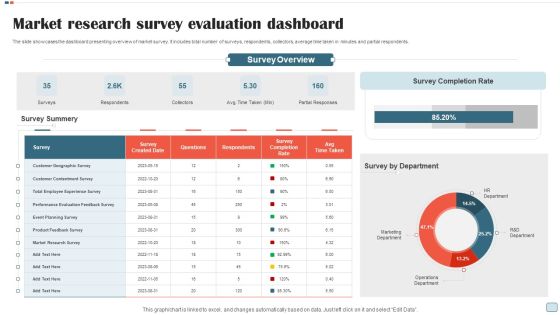
Market Research Survey Evaluation Dashboard Graphics PDF
The slide showcases the dashboard presenting overview of market survey. It includes total number of surveys, respondents, collectors, average time taken in minutes and partial respondents. Showcasing this set of slides titled Market Research Survey Evaluation Dashboard Graphics PDF. The topics addressed in these templates are Surveys, Respondents, Collectors, Partial Responses. All the content presented in this PPT design is completely editable. Download it and make adjustments in color, background, font etc. as per your unique business setting.

Market Survey Evaluation Of Different Brands Slides PDF
The slide shows the rating of different brands based on the features of the product. The features includes physical appearance, service, durability, and premium features of the product. Showcasing this set of slides titled Market Survey Evaluation Of Different Brands Slides PDF. The topics addressed in these templates are Physical Appearance, Service, Durability, Premium Features Product. All the content presented in this PPT design is completely editable. Download it and make adjustments in color, background, font etc. as per your unique business setting.

Marketing Survey Evaluation Performance Report Guidelines PDF
This slide presents a brief report showing analysis of market survey to determine performance of website and efficiency of content marketing. It includes performance of blogs, forums, video content, social media and growth metrics. Showcasing this set of slides titled Marketing Survey Evaluation Performance Report Guidelines PDF. The topics addressed in these templates are Digital Content, Engagement Rate, Social Network, Business Success, Growth. All the content presented in this PPT design is completely editable. Download it and make adjustments in color, background, font etc. as per your unique business setting.
Key Online Marketing Trends And Analysis Icons PDF
Following slide depicts the latest trends in digital marketing to analyze the consumer behavior and meet their expectations. It also includes the top reasons to install ad blockers by consumers, AI usability, b2b marketing strategies etc. Showcasing this set of slides titled Key Online Marketing Trends And Analysis Icons PDF. The topics addressed in these templates are Ai Usability, Blockers By Consumers, Latest B2b Marketing Strategies. All the content presented in this PPT design is completely editable. Download it and make adjustments in color, background, font etc. as per your unique business setting.

Customer Related Quality Kpis Dashboard For Project Management Brochure PDF
This slide displays a dashboard for measurement of parameters related to customer satisfaction. It includes details such as net promoter score, customer retention rate, customer efforts, etc. Showcasing this set of slides titled Customer Related Quality Kpis Dashboard For Project Management Brochure PDF. The topics addressed in these templates are Customer Retention Rate, Net Promoter Score, Customer Effort Score. All the content presented in this PPT design is completely editable. Download it and make adjustments in color, background, font etc. as per your unique business setting.
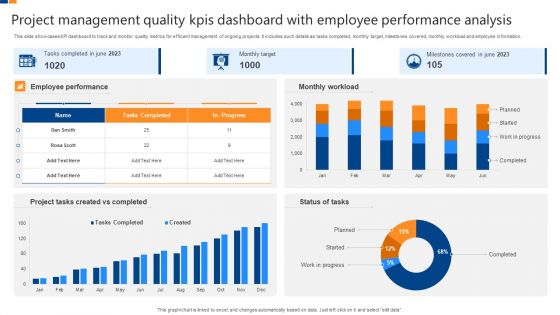
Project Management Quality Kpis Dashboard With Employee Performance Analysis Professional PDF
This slide showcases KPI dashboard to track and monitor quality metrics for efficient management of ongoing projects. It includes such details as tasks completed, monthly target, milestones covered, monthly workload and employee information. Showcasing this set of slides titled Project Management Quality Kpis Dashboard With Employee Performance Analysis Professional PDF. The topics addressed in these templates are Employee Performance, Monthly Workload, Milestones Covered, Monthly Target, Project Tasks Created Completed. All the content presented in this PPT design is completely editable. Download it and make adjustments in color, background, font etc. as per your unique business setting.
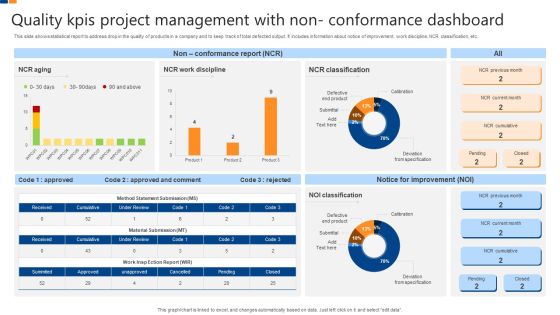
Quality Kpis Project Management With Non Conformance Dashboard Structure PDF
This slide shows statistical report to address drop in the quality of products in a company and to keep track of total defected output. It includes information about notice of improvement, work discipline, NCR classification, etc. Showcasing this set of slides titled Quality Kpis Project Management With Non Conformance Dashboard Structure PDF. The topics addressed in these templates are Quality Kpis Project Management, Non Conformance Dashboard. All the content presented in this PPT design is completely editable. Download it and make adjustments in color, background, font etc. as per your unique business setting.
Tracker For Time Based Quality Kpis In Project Management Ideas PDF
This slide displays project wise comparative analysis on the basis of planned and actual time it takes for completion. It includes details such as number of tasks and work completed, average number of hours, start and end dates, etc. Pitch your topic with ease and precision using this Tracker For Time Based Quality Kpis In Project Management Ideas PDF. This layout presents information on Time, Work Completed, Avg Number, Hours Per Task. It is also available for immediate download and adjustment. So, changes can be made in the color, design, graphics or any other component to create a unique layout.

Geographical Analysis Of Quarterly Sales Performance Of Business Portrait PDF
This slide displays sales record for different countries to implement marketing strategies. It also includes key insights for the statistics. Pitch your topic with ease and precision using this Geographical Analysis Of Quarterly Sales Performance Of Business Portrait PDF. This layout presents information on Geographical Analysis, Quarterly Sales, Performance Of Business. It is also available for immediate download and adjustment. So, changes can be made in the color, design, graphics or any other component to create a unique layout.
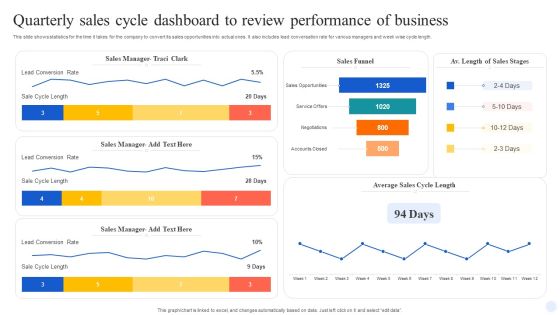
Quarterly Sales Cycle Dashboard To Review Performance Of Business Demonstration PDF
This slide shows statistics for the time it takes for the company to convert its sales opportunities into actual ones. It also includes lead conversation rate for various managers and week wise cycle length. Showcasing this set of slides titled Quarterly Sales Cycle Dashboard To Review Performance Of Business Demonstration PDF. The topics addressed in these templates are Sales Manager, Sales Funnel, Lead Conversion Rate. All the content presented in this PPT design is completely editable. Download it and make adjustments in color, background, font etc. as per your unique business setting.
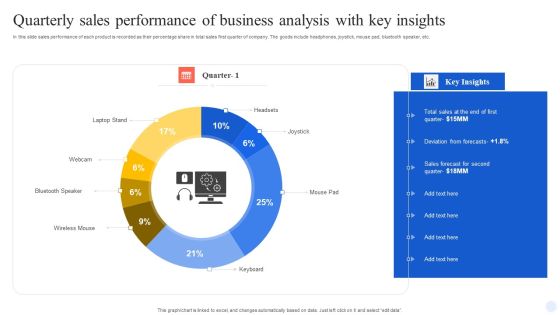
Quarterly Sales Performance Of Business Analysis With Key Insights Information PDF
In this slide sales performance of each product is recorded as their percentage share in total sales first quarter of company. The goods include headphones, joystick, mouse pad, bluetooth speaker, etc. Pitch your topic with ease and precision using this Quarterly Sales Performance Of Business Analysis With Key Insights Information PDF. This layout presents information on Wireless Mouse, Keyboard, Mouse Pad, Joystick, Headsets. It is also available for immediate download and adjustment. So, changes can be made in the color, design, graphics or any other component to create a unique layout.
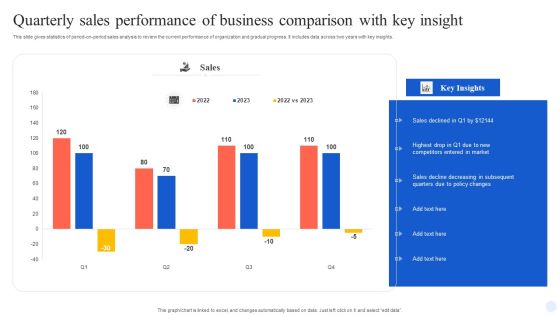
Quarterly Sales Performance Of Business Comparison With Key Insight Guidelines PDF
This slide gives statistics of period-on-period sales analysis to review the current performance of organization and gradual progress. It includes data across two years with key insights. Showcasing this set of slides titled Quarterly Sales Performance Of Business Comparison With Key Insight Guidelines PDF. The topics addressed in these templates are Quarterly Sales Performance, Business Comparison, Key Insight. All the content presented in this PPT design is completely editable. Download it and make adjustments in color, background, font etc. as per your unique business setting.

Quarterly Sales Performance Of Business Dashboard With Region And Product Wise Comparison Guidelines PDF
This slide displays sales analysis for different products and regions in each quarter. t also includes inter year comparisons. Pitch your topic with ease and precision using this Quarterly Sales Performance Of Business Dashboard With Region And Product Wise Comparison Guidelines PDF. This layout presents information on Product Wise Quarterly Sales, Comparison. It is also available for immediate download and adjustment. So, changes can be made in the color, design, graphics or any other component to create a unique layout.

KPI Dashboard To Measure Performance Of Saas Company Introduction PDF
This slide provides an overview of the SaaS metrics dashboard. The company can track the overall progress of their business model by tracking metrics such as quality leads, ARPA, signups past 4 weeks, net MRR churn rate, new business MRR, etc. Pitch your topic with ease and precision using this KPI Dashboard To Measure Performance Of Saas Company Introduction PDF. This layout presents information on Industry, Position, Customers, Quality Leads. It is also available for immediate download and adjustment. So, changes can be made in the color, design, graphics or any other component to create a unique layout.

KPI Dashboard To Measure Sales Performance Of Saas Company Summary PDF
The purpose of this slide is to showcase metrics dashboard which can be used to effectively monitor the sales of SaaS company. The metrics covered in the slide are total sales, average impressions, average CTR, impressions breakdown, etc. Showcasing this set of slides titled KPI Dashboard To Measure Sales Performance Of Saas Company Summary PDF. The topics addressed in these templates are Total Sales, Average Sale, Count Of Sales, Average Impressions, Average Ctr. All the content presented in this PPT design is completely editable. Download it and make adjustments in color, background, font etc. as per your unique business setting.

Measuring Ab Testing Solution With Saas Company KPI Dashboard Guidelines PDF
The purpose of this slide is to showcase SaaS metrics dashboard which can assist the corporations to make changes in product to improve user experience. It covers information about weighted satisfaction score, positive satisfaction rating, etc. Pitch your topic with ease and precision using this Measuring Ab Testing Solution With Saas Company KPI Dashboard Guidelines PDF. This layout presents information on Lifetime Value Customer, Positive Satisfaction Rating, Save Widget, Weighted Satisfaction Score. It is also available for immediate download and adjustment. So, changes can be made in the color, design, graphics or any other component to create a unique layout.
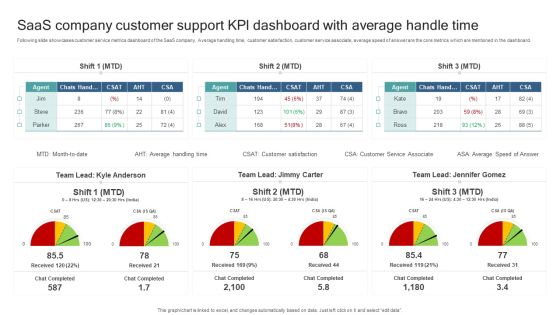
Saas Company Customer Support Kpl Dashboard With Average Handle Time Microsoft PDF
Following slide showcases customer service metrics dashboard of the SaaS company. Average handling time, customer satisfaction, customer service associate, average speed of answer are the core metrics which are mentioned in the dashboard. Showcasing this set of slides titled Saas Company Customer Support Kpl Dashboard With Average Handle Time Microsoft PDF. The topics addressed in these templates are Saas Company Customer Support, Kpl Dashboard, Average Handle Time. All the content presented in this PPT design is completely editable. Download it and make adjustments in color, background, font etc. as per your unique business setting.
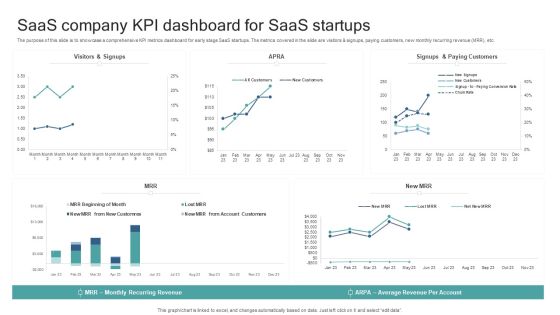
Saas Company KPI Dashboard For Saas Startups Background PDF
The purpose of this slide is to showcase a comprehensive KPI metrics dashboard for early stage SaaS startups. The metrics covered in the slide are visitors and signups, paying customers, new monthly recurring revenue MRR, etc. Showcasing this set of slides titled Saas Company KPI Dashboard For Saas Startups Background PDF. The topics addressed in these templates are Average Revenue Per Account, Monthly Recurring Revenue. All the content presented in this PPT design is completely editable. Download it and make adjustments in color, background, font etc. as per your unique business setting.
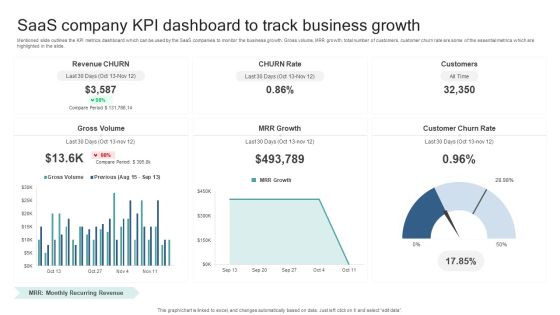
Saas Company KPI Dashboard To Track Business Growth Guidelines PDF
Mentioned slide outlines the KPI metrics dashboard which can be used by the SaaS companies to monitor the business growth. Gross volume, MRR growth, total number of customers, customer churn rate are some of the essential metrics which are highlighted in the slide. Showcasing this set of slides titled Saas Company KPI Dashboard To Track Business Growth Guidelines PDF. The topics addressed in these templates are Gross Volume, Mrr Growth, Customer Churn Rate. All the content presented in this PPT design is completely editable. Download it and make adjustments in color, background, font etc. as per your unique business setting.
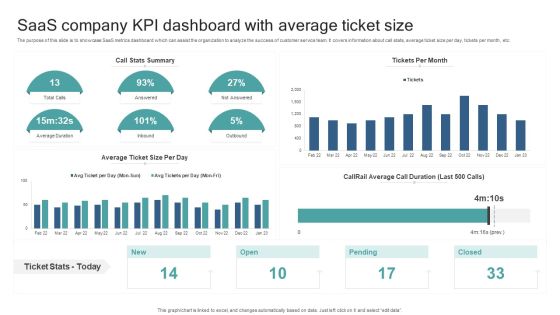
Saas Company KPI Dashboard With Average Ticket Size Sample PDF
The purpose of this slide is to showcase SaaS metrics dashboard which can assist the organization to analyze the success of customer service team. It covers information about call stats, average ticket size per day, tickets per month, etc. Showcasing this set of slides titled Saas Company KPI Dashboard With Average Ticket Size Sample PDF. The topics addressed in these templates are Saas Company Kpi, Dashboard, Average Ticket Size. All the content presented in this PPT design is completely editable. Download it and make adjustments in color, background, font etc. as per your unique business setting.


 Continue with Email
 Sign up for an account
 Home
Home


