Investment Banking
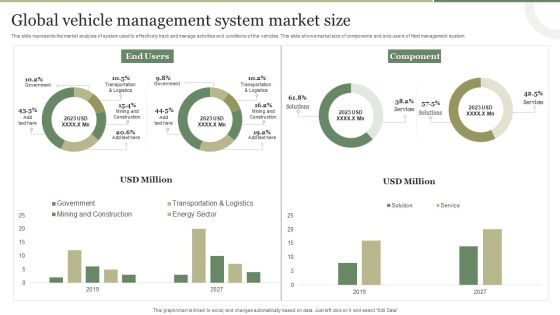
Global Vehicle Management System Market Size Guidelines PDF
This slide represents the market analysis of system used to effectively track and manage activities and conditions of the vehicles. This slide shows market size of components and end-users of fleet management system. Pitch your topic with ease and precision using this Global Vehicle Management System Market Size Guidelines PDF. This layout presents information on Global Vehicle, Management System, Market Size. It is also available for immediate download and adjustment. So, changes can be made in the color, design, graphics or any other component to create a unique layout.
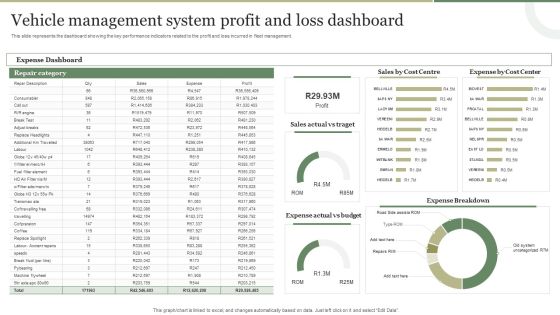
Vehicle Management System Profit And Loss Dashboard Brochure PDF
This slide represents the dashboard showing the key performance indicators related to the profit and loss incurred in fleet management. Showcasing this set of slides titled Vehicle Management System Profit And Loss Dashboard Brochure PDF. The topics addressed in these templates are Vehicle Management System, Profit And Loss Dashboard. All the content presented in this PPT design is completely editable. Download it and make adjustments in color, background, font etc. as per your unique business setting.

Estimating Business Overall Forecasting The Revenue And Growth Of Organization Topics PDF
The following slide outlines a comprehensive chart highlighting the estimated company revenue. The forecasted revenue is shown from 2023 to 2025 with key highlights. Whether you have daily or monthly meetings, a brilliant presentation is necessary. Estimating Business Overall Forecasting The Revenue And Growth Of Organization Topics PDFcan be your best option for delivering a presentation. Represent everything in detail using Estimating Business Overall Forecasting The Revenue And Growth Of Organization Topics PDF and make yourself stand out in meetings. The template is versatile and follows a structure that will cater to your requirements. All the templates prepared by Slidegeeks are easy to download and edit. Our research experts have taken care of the corporate themes as well. So, give it a try and see the results.
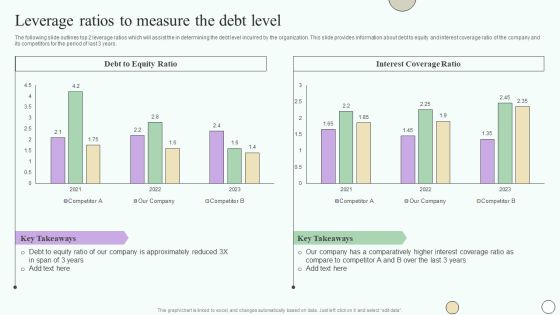
Estimating Business Overall Leverage Ratios To Measure The Debt Level Professional PDF
The following slide outlines top 2 leverage ratios which will assist the in determining the debt level incurred by the organization. This slide provides information about debt to equity and interest coverage ratio of the company and its competitors for the period of last 3 years. If your project calls for a presentation, then Slidegeeks is your go-to partner because we have professionally designed, easy-to-edit templates that are perfect for any presentation. After downloading, you can easily edit Estimating Business Overall Leverage Ratios To Measure The Debt Level Professional PDF and make the changes accordingly. You can rearrange slides or fill them with different images. Check out all the handy templates.

Estimating Business Overall Activity Ratios To Determine Organization Efficiency In Utilizing Topics PDF
The following slide outlines efficiency ratios which can be used to indicate the company efficiency in utilizing the assets. Information covered in this slide is related to inventory and total assets turnover ratio. Are you in need of a template that can accommodate all of your creative concepts This one is crafted professionally and can be altered to fit any style. Use it with Google Slides or PowerPoint. Include striking photographs, symbols, depictions, and other visuals. Fill, move around, or remove text boxes as desired. Test out color palettes and font mixtures. Edit and save your work, or work with colleagues. Download Estimating Business Overall Activity Ratios To Determine Organization Efficiency In Utilizing Topics PDF and observe how to make your presentation outstanding. Give an impeccable presentation to your group and make your presentation unforgettable.

Estimating Business Overall Kpi Metrics Dashboard Highlighting Organization Revenue Clipart PDF
The following slide outlines key performance indicator KPI dashboard showcasing various financial metrics of the organization. The key metrics are gross revenue, product revenue, service revenue, gross profit, net profit etc. Formulating a presentation can take up a lot of effort and time, so the content and message should always be the primary focus. The visuals of the PowerPoint can enhance the presenters message, so our Estimating Business Overall Kpi Metrics Dashboard Highlighting Organization Revenue Clipart PDF was created to help save time. Instead of worrying about the design, the presenter can concentrate on the message while our designers work on creating the ideal templates for whatever situation is needed. Slidegeeks has experts for everything from amazing designs to valuable content, we have put everything into Estimating Business Overall Kpi Metrics Dashboard Highlighting Organization Revenue Clipart PDF.
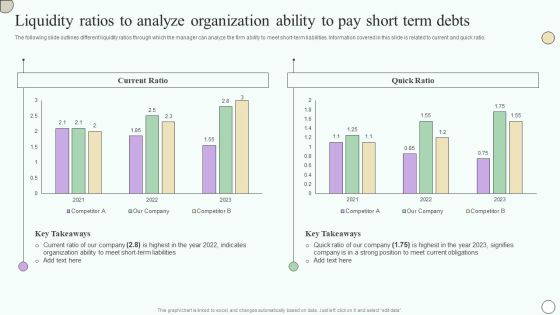
Estimating Business Overall Liquidity Ratios To Analyze Organization Ability To Pay Short Introduction PDF
The following slide outlines different liquidity ratios through which the manager can analyze the firm ability to meet short-term liabilities. Information covered in this slide is related to current and quick ratio. Coming up with a presentation necessitates that the majority of the effort goes into the content and the message you intend to convey. The visuals of a PowerPoint presentation can only be effective if it supplements and supports the story that is being told. Keeping this in mind our experts created Estimating Business Overall Liquidity Ratios To Analyze Organization Ability To Pay Short Introduction PDF to reduce the time that goes into designing the presentation. This way, you can concentrate on the message while our designers take care of providing you with the right template for the situation.
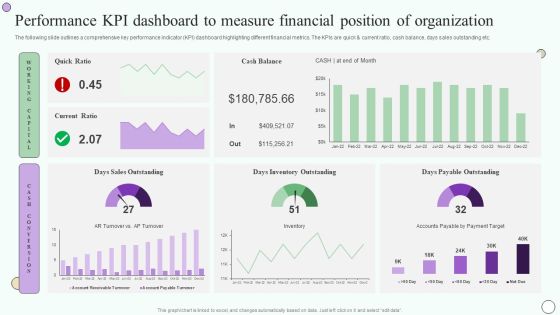
Estimating Business Overall Performance Kpi Dashboard To Measure Financial Position Inspiration PDF
The following slide outlines a comprehensive key performance indicator KPI dashboard highlighting different financial metrics. The KPIs are quick and current ratio, cash balance, days sales outstanding etc. Welcome to our selection of the Estimating Business Overall Performance Kpi Dashboard To Measure Financial Position Inspiration PDF. These are designed to help you showcase your creativity and bring your sphere to life. Planning and Innovation are essential for any business that is just starting out. This collection contains the designs that you need for your everyday presentations. All of our PowerPoints are 100 percent editable, so you can customize them to suit your needs. This multi-purpose template can be used in various situations. Grab these presentation templates today.

Estimating Business Overall Profitability Ratios To Measure The Organization Earnings Themes PDF
The following slide outlines different profitability ratios which can be used by the investors to measure the financial position of the company. It covers information about gross profit and net profit margin. The Estimating Business Overall Profitability Ratios To Measure The Organization Earnings Themes PDF is a compilation of the most recent design trends as a series of slides. It is suitable for any subject or industry presentation, containing attractive visuals and photo spots for businesses to clearly express their messages. This template contains a variety of slides for the user to input data, such as structures to contrast two elements, bullet points, and slides for written information. Slidegeeks is prepared to create an impression.

Customer Healthcare Service Management Dashboard Themes PDF
The slide shows a dashboard for health care consultant to effectively manage of booked appointments. It includes key elements such as review score, patients, appointment sin current month, recently attended appointments, monthly revenue, previous months attended meetings, etc. Showcasing this set of slides titled Customer Healthcare Service Management Dashboard Themes PDF. The topics addressed in these templates are Customer Healthcare Service, Management Dashboard. All the content presented in this PPT design is completely editable. Download it and make adjustments in color, background, font etc. as per your unique business setting.
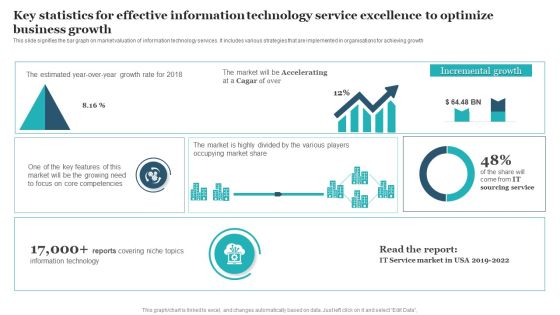
Key Statistics For Effective Information Technology Service Excellence To Optimize Business Growth Guidelines PDF
This slide signifies the bar graph on market valuation of information technology services. It includes various strategies that are implemented in organisations for achieving growth. Showcasing this set of slides titled Key Statistics For Effective Information Technology Service Excellence To Optimize Business Growth Guidelines PDF. The topics addressed in these templates are Key Statistics Effective, Information Technology Service, Excellence Optimize Business Growth. All the content presented in this PPT design is completely editable. Download it and make adjustments in color, background, font etc. as per your unique business setting.
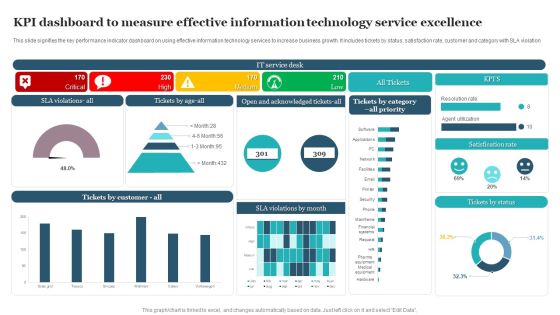
KPI Dashboard To Measure Effective Information Technology Service Excellence Information PDF
This slide signifies the key performance indicator dashboard on using effective information technology services to increase business growth. It includes tickets by status, satisfaction rate, customer and category with SLA violation. Showcasing this set of slides titled KPI Dashboard To Measure Effective Information Technology Service Excellence Information PDF. The topics addressed in these templates are Satisfication Rate, Tickets Status, Service Desk. All the content presented in this PPT design is completely editable. Download it and make adjustments in color, background, font etc. as per your unique business setting.
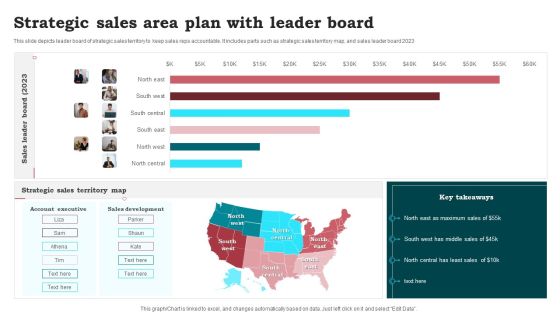
Strategic Sales Area Plan With Leader Board Inspiration PDF
This slide depicts leader board of strategic sales territory to keep sales reps accountable. It includes parts such as strategic sales territory map, and sales leader board 2023. Showcasing this set of slides titled Strategic Sales Area Plan With Leader Board Inspiration PDF. The topics addressed in these templates are Strategic Sales Area, Plan Leader Board. All the content presented in this PPT design is completely editable. Download it and make adjustments in color, background, font etc. as per your unique business setting.

Overview Of Organizational Forecasting The Revenue And Growth Of Organization Template PDF
The following slide outlines a comprehensive chart highlighting the estimated company revenue. The forecasted revenue is shown from 2023 to 2025 with key highlights. Whether you have daily or monthly meetings, a brilliant presentation is necessary. Overview Of Organizational Forecasting The Revenue And Growth Of Organization Template PDF can be your best option for delivering a presentation. Represent everything in detail using Overview Of Organizational Forecasting The Revenue And Growth Of Organization Template PDF and make yourself stand out in meetings. The template is versatile and follows a structure that will cater to your requirements. All the templates prepared by Slidegeeks are easy to download and edit. Our research experts have taken care of the corporate themes as well. So, give it a try and see the results.
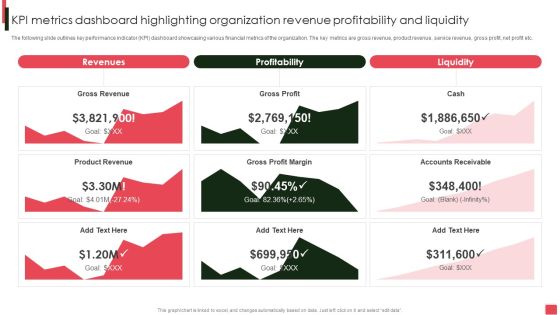
Overview Of Organizational Kpi Metrics Dashboard Highlighting Organization Revenue Brochure PDF
The following slide outlines key performance indicator KPI dashboard showcasing various financial metrics of the organization. The key metrics are gross revenue, product revenue, service revenue, gross profit, net profit etc. If your project calls for a presentation, then Slidegeeks is your go-to partner because we have professionally designed, easy-to-edit templates that are perfect for any presentation. After downloading, you can easily edit Overview Of Organizational Kpi Metrics Dashboard Highlighting Organization Revenue Brochure PDF and make the changes accordingly. You can rearrange slides or fill them with different images. Check out all the handy templates.

Overview Of Organizational Leverage Ratios To Measure The Debt Level Formats PDF
The following slide outlines top 2 leverage ratios which will assist the in determining the debt level incurred by the organization. This slide provides information about debt to equity and interest coverage ratio of the company and its competitors for the period of last 3 years. This modern and well-arranged Overview Of Organizational Leverage Ratios To Measure The Debt Level Formats PDF provides lots of creative possibilities. It is very simple to customize and edit with the Powerpoint Software. Just drag and drop your pictures into the shapes. All facets of this template can be edited with Powerpoint, no extra software is necessary. Add your own material, put your images in the places assigned for them, adjust the colors, and then you can show your slides to the world, with an animated slide included.

Overview Of Organizational Liquidity Ratios To Analyze Organization Ability To Pay Short Summary PDF
The following slide outlines different liquidity ratios through which the manager can analyze the firm ability to meet short-term liabilities. Information covered in this slide is related to current and quick ratio. Coming up with a presentation necessitates that the majority of the effort goes into the content and the message you intend to convey. The visuals of a PowerPoint presentation can only be effective if it supplements and supports the story that is being told. Keeping this in mind our experts created Overview Of Organizational Liquidity Ratios To Analyze Organization Ability To Pay Short Summary PDF to reduce the time that goes into designing the presentation. This way, you can concentrate on the message while our designers take care of providing you with the right template for the situation.

Overview Of Organizational Performance Kpi Dashboard To Measure Financial Position Sample PDF
The following slide outlines a comprehensive key performance indicator KPI dashboard highlighting different financial metrics. The KPIs are quick and current ratio, cash balance, days sales outstanding etc. Welcome to our selection of the Overview Of Organizational Performance Kpi Dashboard To Measure Financial Position Sample PDF. These are designed to help you showcase your creativity and bring your sphere to life. Planning and Innovation are essential for any business that is just starting out. This collection contains the designs that you need for your everyday presentations. All of our PowerPoints are 100 percent editable, so you can customize them to suit your needs. This multi-purpose template can be used in various situations. Grab these presentation templates today.

Overview Of Organizational Profitability Ratios To Measure The Organization Earnings Summary PDF
The following slide outlines different profitability ratios which can be used by the investors to measure the financial position of the company. It covers information about gross profit and net profit margin. The Overview Of Organizational Profitability Ratios To Measure The Organization Earnings Summary PDF is a compilation of the most recent design trends as a series of slides. It is suitable for any subject or industry presentation, containing attractive visuals and photo spots for businesses to clearly express their messages. This template contains a variety of slides for the user to input data, such as structures to contrast two elements, bullet points, and slides for written information. Slidegeeks is prepared to create an impression.
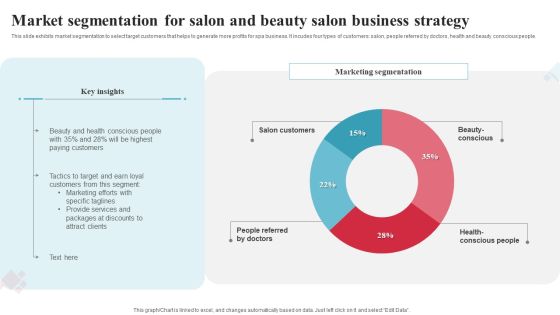
Market Segmentation For Salon And Beauty Salon Business Strategy Ppt Layouts Clipart Images PDF
This slide exhibits market segmentation to select target customers that helps to generate more profits for spa business. It incudes four types of customers salon, people referred by doctors, health and beauty conscious people. Showcasing this set of slides titled Market Segmentation For Salon And Beauty Salon Business Strategy Ppt Layouts Clipart Images PDF. The topics addressed in these templates are Key Insights, Marketing Segmentation, Target And Earn. All the content presented in this PPT design is completely editable. Download it and make adjustments in color, background, font etc. as per your unique business setting.
Tracking Sheet To Planning Multiples Projects With Task Status Information PDF
Mentioned slide outlines a key performance indicator KPI dashboard to plan and measure project progress . Information covered in this slide is related to project names, start and end date, progress details, planned vs actual hours, and issues and risks involved. Showcasing this set of slides titled Tracking Sheet To Planning Multiples Projects With Task Status Information PDF. The topics addressed in these templates are Progress, Issues And Risks, Project. All the content presented in this PPT design is completely editable. Download it and make adjustments in color, background, font etc. as per your unique business setting.

Change Requests Management And Management Dashboard Clipart PDF
This slide illustrates facts and figures related to managing change requests. It includes request statistics, latest change requests, status by assignee, status by priority, etc. Pitch your topic with ease and precision using this Change Requests Management And Management Dashboard Clipart PDF. This layout presents information on Status By Assignee, Status By Priority, Request Statistics. It is also available for immediate download and adjustment. So, changes can be made in the color, design, graphics or any other component to create a unique layout.

Various Reasons For Corporate Cultural Transformation Diagrams PDF
This slide exhibits survey results to understand reasons for changing company culture that helps to sustain dynamic environment. It include reasons such as new technology, management, financial loss, business performance etc. Showcasing this set of slides titled Various Reasons For Corporate Cultural Transformation Diagrams PDF. The topics addressed in these templates are Various Reasons Corporate, Cultural Transformation. All the content presented in this PPT design is completely editable. Download it and make adjustments in color, background, font etc. as per your unique business setting.

Current Challenges And Opportunities Of Digital Payments Strategy Transactions Clipart PDF
This slide provides some of the major challenges and opportunities of digital transactions for business, customers and governments bodies. It incorporates challenges such as technical and financial, loss of transactional revenue, cyberattacks etc. Showcasing this set of slides titled Current Challenges And Opportunities Of Digital Payments Strategy Transactions Clipart PDF. The topics addressed in these templates are Challenges, Opportunities, Technical And Financial. All the content presented in this PPT design is completely editable. Download it and make adjustments in color, background, font etc. as per your unique business setting.
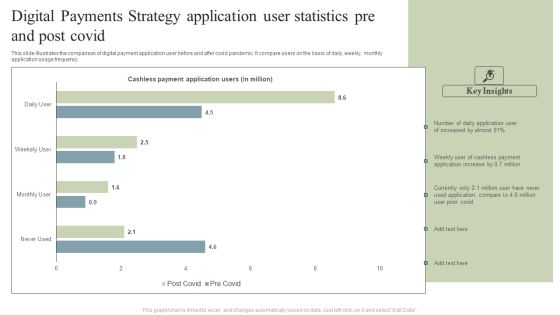
Digital Payments Strategy Application User Statistics Pre And Post Covid Pictures PDF
This slide illustrates the comparison of digital payment application user before and after covid pandemic. It compare users on the basis of daily, weekly, monthly application usage frequency. Pitch your topic with ease and precision using this Digital Payments Strategy Application User Statistics Pre And Post Covid Pictures PDF. This layout presents information on Cashless Payment, Application Users, Cashless Payment, Application Increase. It is also available for immediate download and adjustment. So, changes can be made in the color, design, graphics or any other component to create a unique layout.

Digital Payments Strategy Gateways Used By Small And Medium Businesses Guidelines PDF
This slide showcases the comparison between cashless payment gateways on the basis of usage by small scale and medium scale businesses. It includes payment gateways such as Paypal, Googlepay, ApplePay, Venmo, CashApp, Onetouch etc. Showcasing this set of slides titled Digital Payments Strategy Gateways Used By Small And Medium Businesses Guidelines PDF. The topics addressed in these templates are Business Leaders, Common Gateway, Google Pay. All the content presented in this PPT design is completely editable. Download it and make adjustments in color, background, font etc. as per your unique business setting.

Integrating Company Service Management System Software Analysis Dashboard Microsoft PDF
This slide defines the dashboard for analyzing the enterprise service management performance. It includes information related the ticket, incidents, service request and tasks. Showcasing this set of slides titled Integrating Company Service Management System Software Analysis Dashboard Microsoft PDF. The topics addressed in these templates are Tickets Per Queue, Agreements Breached Per, Tickets Per Status. All the content presented in this PPT design is completely editable. Download it and make adjustments in color, background, font etc. as per your unique business setting.
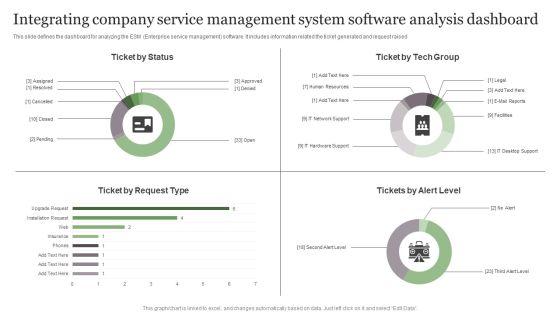
Integrating Company Service Management System Software Analysis Dashboard Graphics PDF
This slide defines the dashboard for analyzing the ESM Enterprise service management software. It includes information related the ticket generated and request raised. Showcasing this set of slides titled Integrating Company Service Management System Software Analysis Dashboard Graphics PDF. The topics addressed in these templates are Ticket By Status, Ticket Request Type, Ticket Tech Group. All the content presented in this PPT design is completely editable. Download it and make adjustments in color, background, font etc. as per your unique business setting.
Employee Performance Analysis Tracking Scorecard Ppt Summary Influencers PDF
This slide covers overall performance score of employee appraised by reporting manager. It includes scores based on metrics such as departmental performance, downtime, efficiency, setup, utilization, quality failures as per goals, actual output etc. Showcasing this set of slides titled Employee Performance Analysis Tracking Scorecard Ppt Summary Influencers PDF. The topics addressed in these templates are Employee Performance Card, Actual Performance, Goal. All the content presented in this PPT design is completely editable. Download it and make adjustments in color, background, font etc. as per your unique business setting.
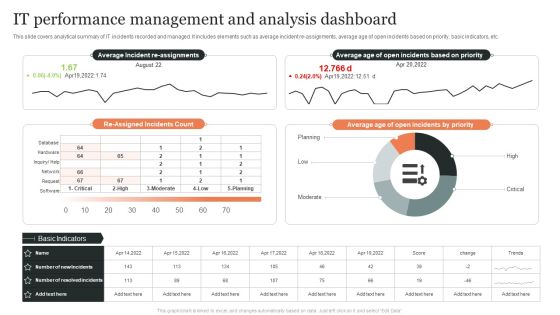
IT Performance Management And Analysis Dashboard Ppt Styles Portrait PDF
This slide covers analytical summary of IT incidents recorded and managed. It includes elements such as average incident re-assignments, average age of open incidents based on priority, basic indicators, etc. Showcasing this set of slides titled IT Performance Management And Analysis Dashboard Ppt Styles Portrait PDF. The topics addressed in these templates are Average Age, Open Incidents Priority, Re Assigned, Incidents Count. All the content presented in this PPT design is completely editable. Download it and make adjustments in color, background, font etc. as per your unique business setting.

Social Media Marketing Performance Analysis Ppt Inspiration Smartart PDF
This slide covers performance analysis of product marketing through a dashboard. It includes elements such as count of social media followers, user engagement analytics, favourite tweets and retweets, Instagram overview, LinkedIn key metrics, etc. Showcasing this set of slides titled Social Media Marketing Performance Analysis Ppt Inspiration Smartart PDF. The topics addressed in these templates are Social Media Followers, Favourite Tweets, Favourite Retweets, Instagram Overview. All the content presented in this PPT design is completely editable. Download it and make adjustments in color, background, font etc. as per your unique business setting.

B2b Selling Tactics Dashboard To Maintain Productivity Introduction PDF
The following slide represents B2B selling tactics dashboard which allows executives and managers to effectively control sales and monitor them in one central place. It consists of total sales, payments, trends etc.Pitch your topic with ease and precision using this B2b Selling Tactics Dashboard To Maintain Productivity Introduction PDF. This layout presents information on Operational Effects, Stores Sales Trend, Conversion Rate. It is also available for immediate download and adjustment. So, changes can be made in the color, design, graphics or any other component to create a unique layout.

Online Data Constraints Information Limitation Analysis For Digital Organizations Information PDF
This slide depicts the challenges faced while storing digital data. The purpose of this template is to analyze the security limitations faced in the technology industries. It also includes elements such as cyberattack, loss of devices, etc.Pitch your topic with ease and precision using this Online Data Constraints Information Limitation Analysis For Digital Organizations Information PDF. This layout presents information on Percentage Impact, Technology Industry, Security Technologies. It is also available for immediate download and adjustment. So, changes can be made in the color, design, graphics or any other component to create a unique layout.

Evaluation Employees Coaching Program Feedback Survey Dashboard Introduction PDF
This slide defines the dashboard for evaluating coaching program feedback survey. It includes information related to the responses, satisfaction level and coaching programs.Showcasing this set of slides titled Evaluation Employees Coaching Program Feedback Survey Dashboard Introduction PDF. The topics addressed in these templates are Adwanced Product, Adwanced Leadership, Satisfactory Coaching. All the content presented in this PPT design is completely editable. Download it and make adjustments in color, background, font etc. as per your unique business setting.

Monthly Profit And Loss Dashboard Reports With Expenses And Revenue Kpis Portrait PDF
This slide shows a dashboard of monthly profit and loss transactions of a company. It depicts last six months expenses, revenues, payment status and customer growth.Showcasing this set of slides titled Monthly Profit And Loss Dashboard Reports With Expenses And Revenue Kpis Portrait PDF. The topics addressed in these templates are Overall Profit Margin, Overall Outstanding Revenue, Customer Growth. All the content presented in this PPT design is completely editable. Download it and make adjustments in color, background, font etc. as per your unique business setting.
Multiple Projects Progress Tracking Report Management Dashboard With Duration Summary PDF
This slide shows the dashboard representing status of various projects which would be helpful in project management. It shows information related to project status, tasks status, milestones completed, upcoming milestones, critical tasks, projects names along with their start and end date, duration etc.Pitch your topic with ease and precision using this Multiple Projects Progress Tracking Report Management Dashboard With Duration Summary PDF. This layout presents information on Start Date, Finish Date, Percent Complete. It is also available for immediate download and adjustment. So, changes can be made in the color, design, graphics or any other component to create a unique layout.
Multiple Projects Progress Tracking Report Tracking Report With Bar Graph Information PDF
This slide shows the status report of various projects in order to help the project manager to track their performance. It includes project names, no.of tasks, start and end date, days taken for completion, progress and remaining percentage of projects.Showcasing this set of slides titled Multiple Projects Progress Tracking Report Tracking Report With Bar Graph Information PDF. The topics addressed in these templates are Multiple Projects, Progress Tracking, Report Tracking Report. All the content presented in this PPT design is completely editable. Download it and make adjustments in color, background, font etc. as per your unique business setting.
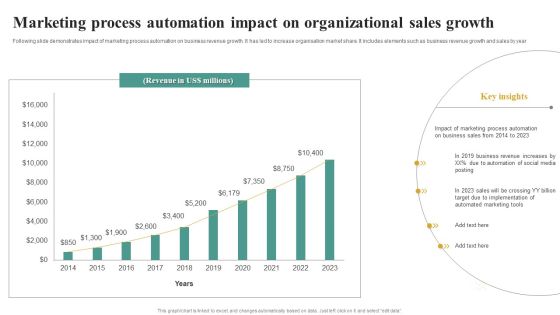
Marketing Process Automation Impact On Organizational Sales Growth Microsoft PDF
Following slide demonstrates impact of marketing process automation on business revenue growth. It has led to increase organisation market share. It includes elements such as business revenue growth and sales by year. Showcasing this set of slides titled Marketing Process Automation Impact On Organizational Sales Growth Microsoft PDF. The topics addressed in these templates are Marketing Process, Automation Impact, Organizational Sales Growth. All the content presented in this PPT design is completely editable. Download it and make adjustments in color, background, font etc. as per your unique business setting.

KPI Dashboard To Manage And Track Personnel Administration Summary PDF
This slide shows the dashboard which can be used to monitor performance of employees in an organization. It includes metrics such as headcount, average employee age, gender diversity ratio, absenteeism, etc. Showcasing this set of slides titled KPI Dashboard To Manage And Track Personnel Administration Summary PDF. The topics addressed in these templates are Employee Count Status, Employee Count Department, Employee Count Salary Range. All the content presented in this PPT design is completely editable. Download it and make adjustments in color, background, font etc. as per your unique business setting.

Restaurant Employees Customer Service Training Template PDF
This slide shows survey of various preferred training topics in restaurant and food industry. It includes training required for seasonal demands, customer service training, new trends, soft skills, technology, promotional training. Showcasing this set of slides titled Restaurant Employees Customer Service Training Template PDF. The topics addressed in these templates are Seasonal Demands, Customer Service Training, New Trends, Soft Skills, Technology, Promotional Training. All the content presented in this PPT design is completely editable. Download it and make adjustments in color, background, font etc. as per your unique business setting.
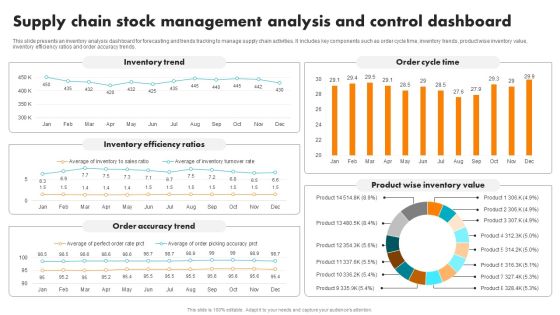
Supply Chain Stock Management Analysis And Control Dashboard Brochure PDF
This slide presents an inventory analysis dashboard for forecasting and trends tracking to manage supply chain activities. It includes key components such as order cycle time, inventory trends, product wise inventory value, inventory efficiency ratios and order accuracy trends. Pitch your topic with ease and precision using this Supply Chain Stock Management Analysis And Control Dashboard Brochure PDF. This layout presents information on Inventory Trend, Inventory Efficiency Ratios, Order Accuracy Trend, Order Cycle Time, Product Wise Inventory Value. It is also available for immediate download and adjustment. So, changes can be made in the color, design, graphics or any other component to create a unique layout.
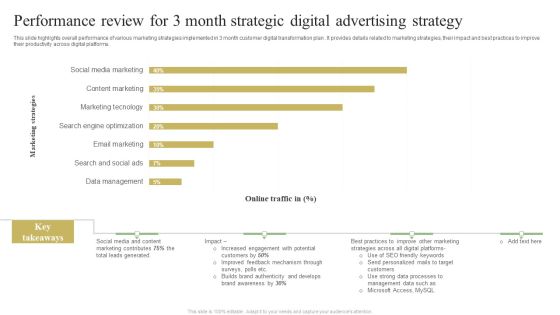
Performance Review For 3 Month Strategic Digital Advertising Strategy Pictures PDF
This slide highlights overall performance of various marketing strategies implemented in 3 month customer digital transformation plan . It provides details related to marketing strategies, their impact and best practices to improve their productivity across digital platforms.Showcasing this set of slides titled Performance Review For 3 Month Strategic Digital Advertising Strategy Pictures PDF. The topics addressed in these templates are Increased Engagement, Brand Authenticity, Personalized Mails. All the content presented in this PPT design is completely editable. Download it and make adjustments in color, background, font etc. as per your unique business setting.

Analysis Of Comparative Analysis Of Cloud And Traditional Computing Data Storage Guidelines PDF
This slide enable the managers to analyse the difference among various categories of cloud and traditional data storage system. It compares categories such as data recovery, privacy, price, expandability, data usage etc. Showcasing this set of slides titled Analysis Of Comparative Analysis Of Cloud And Traditional Computing Data Storage Guidelines PDF. The topics addressed in these templates are Provides Less, Because Vulnerable, Expandability. All the content presented in this PPT design is completely editable. Download it and make adjustments in color, background, font etc. as per your unique business setting.

Construction Project Progress Report And Quality Management Dashboard Sample PDF
This slide defines the construction project status and quality management dashboard. It includes information related to the defects, customer satisfaction, rework tasks and safety meetings.Showcasing this set of slides titled Construction Project Progress Report And Quality Management Dashboard Sample PDF. The topics addressed in these templates are Passed Inspections, Customer Satisfaction, Defects Categories. All the content presented in this PPT design is completely editable. Download it and make adjustments in color, background, font etc. as per your unique business setting.

Customer Analysis And Satisfaction Enhancement Strategy Dashboard Elements PDF
This slide defines the dashboard for analyzing CSAT and strategizing its improvement plan. It includes information related to the customer satisfaction score, control, etc.Showcasing this set of slides titled Customer Analysis And Satisfaction Enhancement Strategy Dashboard Elements PDF. The topics addressed in these templates are Customer Effort, Customer Satisfaction, Promoters. All the content presented in this PPT design is completely editable. Download it and make adjustments in color, background, font etc. as per your unique business setting.

Warehouse Efficiency Management Dashboard Showing Query Execution Rules PDF
This slide shows the dashboard representing data related to the performance of warehouse for its management. It shows query- provisioning and overload time along with its execution. Pitch your topic with ease and precision using this Warehouse Efficiency Management Dashboard Showing Query Execution Rules PDF. This layout presents information on Warehouse Performance, Warehouse Size, Database. It is also available for immediate download and adjustment. So, changes can be made in the color, design, graphics or any other component to create a unique layout.
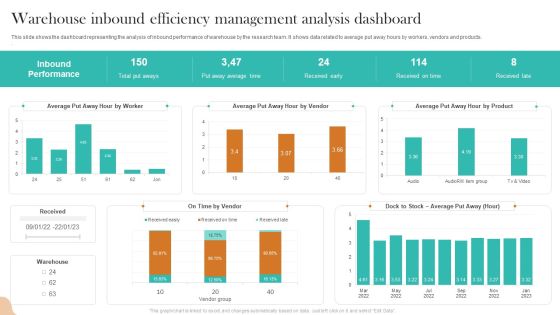
Warehouse Inbound Efficiency Management Analysis Dashboard Topics PDF
This slide shows the dashboard representing the analysis of inbound performance of warehouse by the research team. It shows data related to average put away hours by workers, vendors and products. Showcasing this set of slides titled Warehouse Inbound Efficiency Management Analysis Dashboard Topics PDF. The topics addressed in these templates are Inbound Performance, Total Put Aways, Received Early. All the content presented in this PPT design is completely editable. Download it and make adjustments in color, background, font etc. as per your unique business setting.
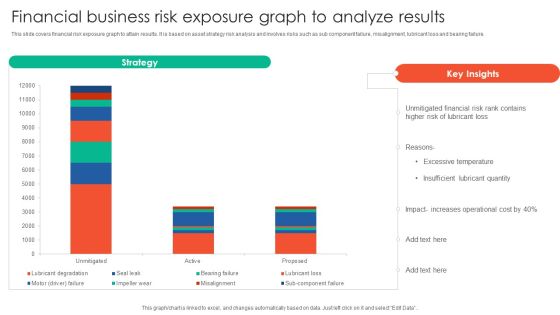
Financial Business Risk Exposure Graph To Analyze Results Elements PDF
This slide covers financial risk exposure graph to attain results. It is based on asset strategy risk analysis and involves risks such as sub component failure, misalignment, lubricant loss and bearing failure. Pitch your topic with ease and precision using this Financial Business Risk Exposure Graph To Analyze Results Elements PDF. This layout presents information on Strategy, Unmitigated Financial, Risk Rank Contains. It is also available for immediate download and adjustment. So, changes can be made in the color, design, graphics or any other component to create a unique layout.
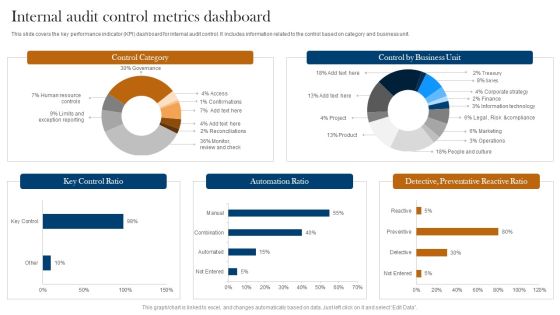
Internal Audit Control Metrics Dashboard Ppt Professional Design Templates PDF
This slide covers the key performance indicator KPI dashboard for internal audit control. It includes information related to the control based on category and business unit. Showcasing this set of slides titled Internal Audit Control Metrics Dashboard Ppt Professional Design Templates PDF. The topics addressed in these templates are Control Category, Key Control Ratio, Automation Ratio. All the content presented in this PPT design is completely editable. Download it and make adjustments in color, background, font etc. as per your unique business setting.
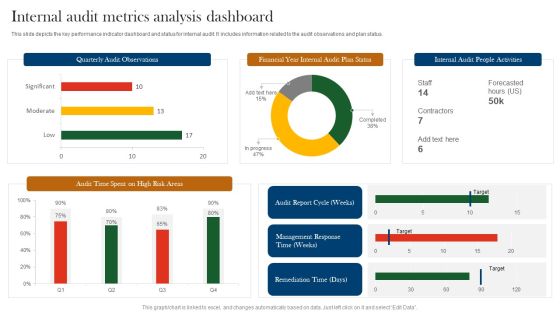
Internal Audit Metrics Analysis Dashboard Ppt Ideas Clipart Images PDF
This slide depicts the key performance indicator dashboard and status for internal audit. It includes information related to the audit observations and plan status. Pitch your topic with ease and precision using this Internal Audit Metrics Analysis Dashboard Ppt Ideas Clipart Images PDF. This layout presents information on Quarterly Audit Observations, Financial Year Internal, Audit Plan Status. It is also available for immediate download and adjustment. So, changes can be made in the color, design, graphics or any other component to create a unique layout.

Internal Audit Metrics Dashboard And Status Ppt Layouts Graphic Images PDF
This slide covers the key performance indicator dashboard and status for internal audit. It includes information related to the audit status and risk rating. Pitch your topic with ease and precision using this Internal Audit Metrics Dashboard And Status Ppt Layouts Graphic Images PDF. This layout presents information on Audit Status, Risk Rating, Auditable Entry. It is also available for immediate download and adjustment. So, changes can be made in the color, design, graphics or any other component to create a unique layout.
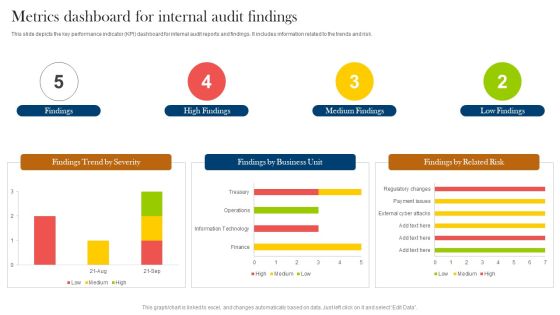
Metrics Dashboard For Internal Audit Findings Ppt Styles Gallery PDF
This slide depicts the key performance indicator KPI dashboard for internal audit reports and findings. It includes information related to the trends and risk. Pitch your topic with ease and precision using this Metrics Dashboard For Internal Audit Findings Ppt Styles Gallery PDF. This layout presents information on Findings, High Findings, Medium Findings, Low Findings. It is also available for immediate download and adjustment. So, changes can be made in the color, design, graphics or any other component to create a unique layout.

Multiplayer Startup Online Business Simulation Dashboard Demonstration PDF
This slide showcases multiplier startup business simulation dashboard. It provides information about individuals, statistics, team processes, adoption, effectiveness, meetings, alignment, communication, etc. Pitch your topic with ease and precision using this Multiplayer Startup Online Business Simulation Dashboard Demonstration PDF. This layout presents information on Individuals, Team Processes, Statistics. It is also available for immediate download and adjustment. So, changes can be made in the color, design, graphics or any other component to create a unique layout.

Online Business Simulation Activity Dashboard With Quarterly Performance Details Guidelines PDF
This slide shows business simulation tasks with performance information. It provides information about financial and production advisor comments, revenue, rivals, profit, strategies, etc. Pitch your topic with ease and precision using this Online Business Simulation Activity Dashboard With Quarterly Performance Details Guidelines PDF. This layout presents information on Financial Adviser, Production Adviser, Revenue. It is also available for immediate download and adjustment. So, changes can be made in the color, design, graphics or any other component to create a unique layout.
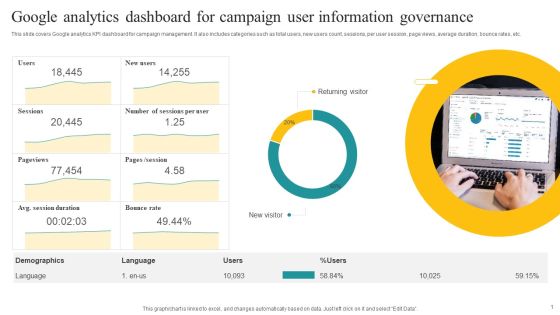
Google Analytics Dashboard For Campaign User Information Governance Demonstration PDF
This slide covers Google analytics KPI dashboard for campaign management. It also includes categories such as total users, new users count, sessions, per user session, page views, average duration, bounce rates, etc. Showcasing this set of slides titled Google Analytics Dashboard For Campaign User Information Governance Demonstration PDF. The topics addressed in these templates are Returning Visitor, New Visitor, Demographics. All the content presented in this PPT design is completely editable. Download it and make adjustments in color, background, font etc. as per your unique business setting.
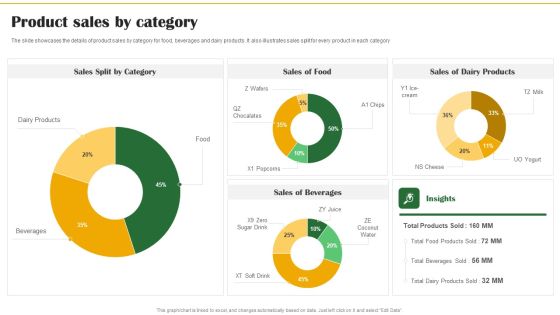
Food Organization Financial Trends Product Sales By Category Ppt Show Slideshow PDF
The slide showcases the details of product sales by category for food, beverages and dairy products. It also illustrates sales split for every product in each category. There are so many reasons you need a Food Organization Financial Trends Product Sales By Category Ppt Show Slideshow PDF. The first reason is you cant spend time making everything from scratch, Thus, Slidegeeks has made presentation templates for you too. You can easily download these templates from our website easily.
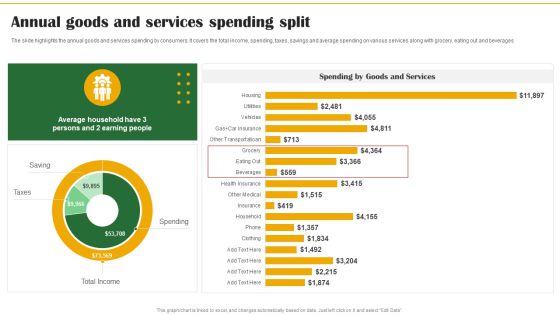
Food Organization Financial Trends Annual Goods And Services Spending Split Slides PDF
The slide highlights the annual goods and services spending by consumers. It covers the total income, spending, taxes, savings and average spending on various services along with grocery, eating out and beverages. Crafting an eye-catching presentation has never been more straightforward. Let your presentation shine with this tasteful yet straightforward Food Organization Financial Trends Annual Goods And Services Spending Split Slides PDF template. It offers a minimalistic and classy look that is great for making a statement. The colors have been employed intelligently to add a bit of playfulness while still remaining professional. Construct the ideal Food Organization Financial Trends Annual Goods And Services Spending Split Slides PDF that effortlessly grabs the attention of your audience Begin now and be certain to wow your customers.
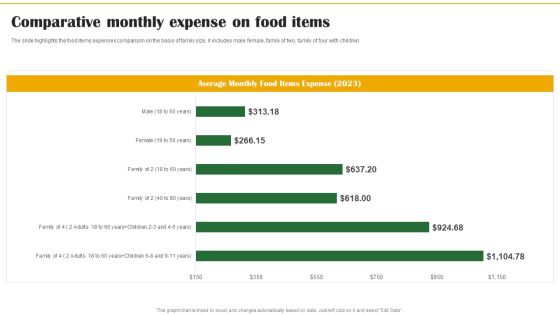
Food Organization Financial Trends Comparative Monthly Expense On Food Items Background PDF
The slide highlights the food items expenses comparison on the basis of family size, it includes male, female, family of two, family of four with children. Formulating a presentation can take up a lot of effort and time, so the content and message should always be the primary focus. The visuals of the PowerPoint can enhance the presenters message, so our Food Organization Financial Trends Comparative Monthly Expense On Food Items Background PDF was created to help save time. Instead of worrying about the design, the presenter can concentrate on the message while our designers work on creating the ideal templates for whatever situation is needed. Slidegeeks has experts for everything from amazing designs to valuable content, we have put everything into Food Organization Financial Trends Comparative Monthly Expense On Food Items Background PDF.

Food Organization Financial Trends Customer Survey Results For Eating At Restaurant Formats PDF
The slide highlights the survey results of customers to illustrate the attitude of people preferring restaurant for eating. The reasons selected by most customers are enjoyable experience, leisure time, and life style. Coming up with a presentation necessitates that the majority of the effort goes into the content and the message you intend to convey. The visuals of a PowerPoint presentation can only be effective if it supplements and supports the story that is being told. Keeping this in mind our experts created Food Organization Financial Trends Customer Survey Results For Eating At Restaurant Formats PDF to reduce the time that goes into designing the presentation. This way, you can concentrate on the message while our designers take care of providing you with the right template for the situation.
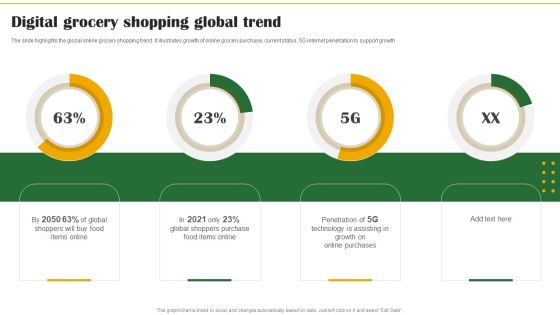
Food Organization Financial Trends Digital Grocery Shopping Global Trend Formats PDF
The slide highlights the global online grocery shopping trend. It illustrates growth of online grocery purchase, current status, 5G internet penetration to support growth. This modern and well-arranged Food Organization Financial Trends Digital Grocery Shopping Global Trend Formats PDF provides lots of creative possibilities. It is very simple to customize and edit with the Powerpoint Software. Just drag and drop your pictures into the shapes. All facets of this template can be edited with Powerpoint, no extra software is necessary. Add your own material, put your images in the places assigned for them, adjust the colors, and then you can show your slides to the world, with an animated slide included.


 Continue with Email

 Home
Home


