AI PPT Maker
Templates
PPT Bundles
Design Services
Business PPTs
Business Plan
Management
Strategy
Introduction PPT
Roadmap
Self Introduction
Timelines
Process
Marketing
Agenda
Technology
Medical
Startup Business Plan
Cyber Security
Dashboards
SWOT
Proposals
Education
Pitch Deck
Digital Marketing
KPIs
Project Management
Product Management
Artificial Intelligence
Target Market
Communication
Supply Chain
Google Slides
Research Services
 One Pagers
All Categories
-
Home
- Customer Favorites
- Investement Funds Performance
Investement Funds Performance

Online Event Campaign Performance Progress Scorecard Themes PDF
This slide covers performance of an event advertisement online with conversion rates. It also includes elements such as total clicks, ad cost, cost per conversion, impressions, CTR, cost per click, ad impressions graph, etc.Pitch your topic with ease and precision using this Online Event Campaign Performance Progress Scorecard Themes PDF. This layout presents information on Cost Per Conversion, Impression Count, Thousand Impression. It is also available for immediate download and adjustment. So, changes can be made in the color, design, graphics or any other component to create a unique layout.

Infrastructure Development Project Performance Administration Training Dashboard Professional PDF
This slide shows the dashboard representing performance management of an infrastructure development project. It includes details related to site inspection success levels, total rework cost, safety meetings, customer complaints etc. Showcasing this set of slides titled Infrastructure Development Project Performance Administration Training Dashboard Professional PDF. The topics addressed in these templates are Customer Satisfaction Ratio, Customer Complaints, Rework Cost. All the content presented in this PPT design is completely editable. Download it and make adjustments in color, background, font etc. as per your unique business setting.
Promotional Campaign Performance Tracking Dashboard For Business Growth Information PDF
This slide represents dashboard showcasing advertising campaign performance progress which helps to manage marketing activities effectively. It provides information regarding total marketing cost, website impressions, content clicks, customer acquisition, cost per campaign etc. Showcasing this set of slides titled Promotional Campaign Performance Tracking Dashboard For Business Growth Information PDF. The topics addressed in these templates are Website Impression, Content Clicks, Customer Acquisition . All the content presented in this PPT design is completely editable. Download it and make adjustments in color, background, font etc. as per your unique business setting.

Client Consultancy Services Business Performance Dashboard Ppt File Layout PDF
This slide shows dashboard to determine overall performance and customer satisfaction of consultancy business. It includes various elements such as total revenue, percentage of support cost, cost per support, average time to solve problem etc. Showcasing this set of slides titled Client Consultancy Services Business Performance Dashboard Ppt File Layout PDF. The topics addressed in these templates are Revenue And Percentage, Support Cost, Cost Per Support. All the content presented in this PPT design is completely editable. Download it and make adjustments in color, background, font etc. as per your unique business setting.

Tips To Use Cost And Schedule Performance Index Diagrams PDF
This slide mentions the tips for analyzing cost and schedule performance index effectively. It includes ensuring data accuracy, knowing analysis isnt always correct and ensuring correct usage. Persuade your audience using this Tips To Use Cost And Schedule Performance Index Diagrams PDF. This PPT design covers three stages, thus making it a great tool to use. It also caters to a variety of topics including Cost Reporting, Inaccurate Data, Management Techniques. Download this PPT design now to present a convincing pitch that not only emphasizes the topic but also showcases your presentation skills.
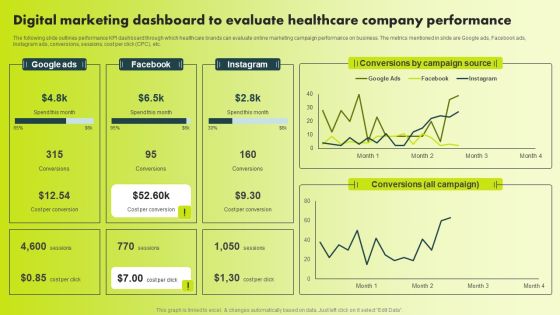
Digital Marketing Dashboard To Evaluate Healthcare Company Performance Template PDF
The following slide outlines performance KPI dashboard through which healthcare brands can evaluate online marketing campaign performance on business. The metrics mentioned in slide are Google ads, Facebook ads, Instagram ads, conversions, sessions, cost per click CPC, etc. Slidegeeks has constructed Digital Marketing Dashboard To Evaluate Healthcare Company Performance Template PDF after conducting extensive research and examination. These presentation templates are constantly being generated and modified based on user preferences and critiques from editors. Here, you will find the most attractive templates for a range of purposes while taking into account ratings and remarks from users regarding the content. This is an excellent jumping-off point to explore our content and will give new users an insight into our top-notch PowerPoint Templates.

Cost And Schedule Performance Estimating Process Brochure PDF
This slide mentions the two types of processes used by organizations to estimate cost and schedule performance of project being handled. It includes forward and backward-looking process. Persuade your audience using this Cost And Schedule Performance Estimating Process Brochure PDF. This PPT design covers two stages, thus making it a great tool to use. It also caters to a variety of topics including Forward Looking, Backward Looking. Download this PPT design now to present a convincing pitch that not only emphasizes the topic but also showcases your presentation skills.

Human Resource Analytics Employee Engagement Key Performance Metrics Inspiration PDF
This slide represents key metrics dashboard to analyze the engagement of employees in the organization. It includes details related to KPIs such as engagement score, response rate, net promoter score etc. Crafting an eye-catching presentation has never been more straightforward. Let your presentation shine with this tasteful yet straightforward Human Resource Analytics Employee Engagement Key Performance Metrics Inspiration PDF template. It offers a minimalistic and classy look that is great for making a statement. The colors have been employed intelligently to add a bit of playfulness while still remaining professional. Construct the ideal Human Resource Analytics Employee Engagement Key Performance Metrics Inspiration PDF that effortlessly grabs the attention of your audience Begin now and be certain to wow your customers.
Evaluating Current Marketing Performance Of Organization Rules PDF
This slide showcases overview of current marketing performance that can help organization to determine issues in current promotional campaigns. Its key elements are website traffic, marketing budget and product sales. This Evaluating Current Marketing Performance Of Organization Rules PDF from Slidegeeks makes it easy to present information on your topic with precision. It provides customization options, so you can make changes to the colors, design, graphics, or any other component to create a unique layout. It is also available for immediate download, so you can begin using it right away. Slidegeeks has done good research to ensure that you have everything you need to make your presentation stand out. Make a name out there for a brilliant performance.
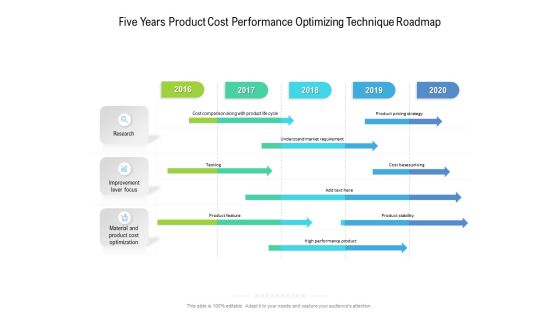
Five Years Product Cost Performance Optimizing Technique Roadmap Demonstration
We present our five years product cost performance optimizing technique roadmap demonstration. This PowerPoint layout is easy to edit so you can change the font size, font type, color, and shape conveniently. In addition to this, the PowerPoint layout is Google Slides compatible, so you can share it with your audience and give them access to edit it. Therefore, download and save this well researched five years product cost performance optimizing technique roadmap demonstration in different formats like PDF, PNG, and JPG to smoothly execute your business plan.

Half Yearly Product Cost Performance Optimizing Technique Roadmap Pictures
We present our half yearly product cost performance optimizing technique roadmap pictures. This PowerPoint layout is easy to edit so you can change the font size, font type, color, and shape conveniently. In addition to this, the PowerPoint layout is Google Slides compatible, so you can share it with your audience and give them access to edit it. Therefore, download and save this well researched half yearly product cost performance optimizing technique roadmap pictures in different formats like PDF, PNG, and JPG to smoothly execute your business plan.

Quarterly Product Cost Performance Optimizing Technique Roadmap Themes
We present our quarterly product cost performance optimizing technique roadmap themes. This PowerPoint layout is easy to edit so you can change the font size, font type, color, and shape conveniently. In addition to this, the PowerPoint layout is Google Slides compatible, so you can share it with your audience and give them access to edit it. Therefore, download and save this well researched quarterly product cost performance optimizing technique roadmap themes in different formats like PDF, PNG, and JPG to smoothly execute your business plan.
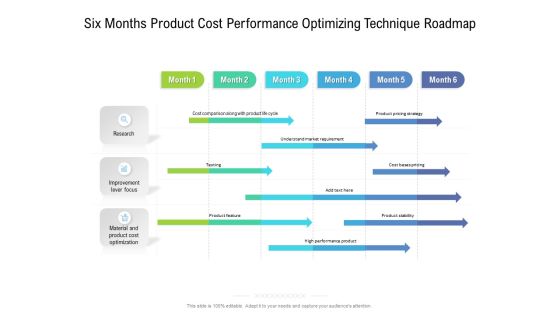
Six Months Product Cost Performance Optimizing Technique Roadmap Guidelines
We present our six months product cost performance optimizing technique roadmap guidelines. This PowerPoint layout is easy to edit so you can change the font size, font type, color, and shape conveniently. In addition to this, the PowerPoint layout is Google Slides compatible, so you can share it with your audience and give them access to edit it. Therefore, download and save this well researched six months product cost performance optimizing technique roadmap guidelines in different formats like PDF, PNG, and JPG to smoothly execute your business plan.
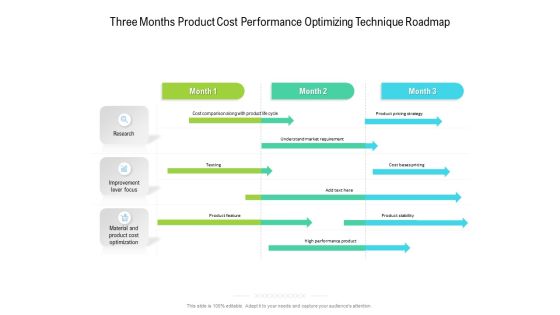
Three Months Product Cost Performance Optimizing Technique Roadmap Template
We present our three months product cost performance optimizing technique roadmap template. This PowerPoint layout is easy to edit so you can change the font size, font type, color, and shape conveniently. In addition to this, the PowerPoint layout is Google Slides compatible, so you can share it with your audience and give them access to edit it. Therefore, download and save this well researched three months product cost performance optimizing technique roadmap template in different formats like PDF, PNG, and JPG to smoothly execute your business plan.

Developing Appealing Persona Ppc Campaign Performance Measuring Brochure PDF
Mentioned slide displays KPI dashboard that can be used to track the performance of PPC campaign. Metrics covered are AD cost, clicks, impressions, CTR and cost per conversion. Here you can discover an assortment of the finest PowerPoint and Google Slides templates. With these templates, you can create presentations for a variety of purposes while simultaneously providing your audience with an eye-catching visual experience. Download Developing Appealing Persona Ppc Campaign Performance Measuring Brochure PDF to deliver an impeccable presentation. These templates will make your job of preparing presentations much quicker, yet still, maintain a high level of quality. Slidegeeks has experienced researchers who prepare these templates and write high-quality content for you. Later on, you can personalize the content by editing the Developing Appealing Persona Ppc Campaign Performance Measuring Brochure PDF.

Dashboard To Measure Display Advertising Campaigns Performance Graphics PDF
This slide provides a dashboard to monitor the display advertising campaign performance in order to reduce overall marketing cost. It incorporates advertising cost, average number of clicks and impressions, clicks per day, revenue by campaign, etc. Formulating a presentation can take up a lot of effort and time, so the content and message should always be the primary focus. The visuals of the PowerPoint can enhance the presenters message, so our Dashboard To Measure Display Advertising Campaigns Performance Graphics PDF was created to help save time. Instead of worrying about the design, the presenter can concentrate on the message while our designers work on creating the ideal templates for whatever situation is needed. Slidegeeks has experts for everything from amazing designs to valuable content, we have put everything into Dashboard To Measure Display Advertising Campaigns Performance Graphics PDF
Monthly Sales Performance Tracking And Monitoring Dashboard Sample PDF
This slide showcases a dashboard presenting various metrics to measure and analyze sales performance for revenue growth. It includes key components such as number of sales, revenue, profit, cost, sales revenue, sales increment, cost analysis and cross sell. Do you have to make sure that everyone on your team knows about any specific topic I yes, then you should give Monthly Sales Performance Tracking And Monitoring Dashboard Sample PDF a try. Our experts have put a lot of knowledge and effort into creating this impeccable Monthly Sales Performance Tracking And Monitoring Dashboard Sample PDF. You can use this template for your upcoming presentations, as the slides are perfect to represent even the tiniest detail. You can download these templates from the Slidegeeks website and these are easy to edit. So grab these today.

Tech Solution Company Elevator Pitch Deck Financial Performance Pictures PDF
This slide caters to the performance of the company providing integrated manufacturing execution system software solutions. It consists of information related to the companys assets and liabilities. Formulating a presentation can take up a lot of effort and time, so the content and message should always be the primary focus. The visuals of the PowerPoint can enhance the presenters message, so our Tech Solution Company Elevator Pitch Deck Financial Performance Pictures PDF was created to help save time. Instead of worrying about the design, the presenter can concentrate on the message while our designers work on creating the ideal templates for whatever situation is needed. Slidegeeks has experts for everything from amazing designs to valuable content, we have put everything into Tech Solution Company Elevator Pitch Deck Financial Performance Pictures PDF

Dashboard To Evaluate The Hospital Operations Performance Diagrams PDF
The following slide showcases dashboard which can be used by the healthcare professionals to measure the performance of operational department. The KPIs covered in the slide are total patients, operational cost, available staff per division etc. Make sure to capture your audiences attention in your business displays with our gratis customizable Dashboard To Evaluate The Hospital Operations Performance Diagrams PDF. These are great for business strategies, office conferences, capital raising or task suggestions. If you desire to acquire more customers for your tech business and ensure they stay satisfied, create your own sales presentation with these plain slides.

Impact Of Safety Management Framework On Company Performance Clipart PDF
The following slide showcases the impact of safety program on company performance in managing health and safety at workplace. Key parameters included here are decrease in compensation claims, accident numbers, increase in employees trained etc. Do you have to make sure that everyone on your team knows about any specific topic I yes, then you should give Impact Of Safety Management Framework On Company Performance Clipart PDF a try. Our experts have put a lot of knowledge and effort into creating this impeccable Impact Of Safety Management Framework On Company Performance Clipart PDF. You can use this template for your upcoming presentations, as the slides are perfect to represent even the tiniest detail. You can download these templates from the Slidegeeks website and these are easy to edit. So grab these today.

Techniques To Optimize Workforce Performance Management Kpi Dashboard Professional PDF
This slide covers staff performance management KPI dashboard to analyze current situation in organization. It involves details such as number of employees, average employee turnover, absenteeism rate etc. Whether you have daily or monthly meetings, a brilliant presentation is necessary. Techniques To Optimize Workforce Performance Management Kpi Dashboard Professional PDF can be your best option for delivering a presentation. Represent everything in detail using Techniques To Optimize Workforce Performance Management Kpi Dashboard Professional PDF and make yourself stand out in meetings. The template is versatile and follows a structure that will cater to your requirements. All the templates prepared by Slidegeeks are easy to download and edit. Our research experts have taken care of the corporate themes as well. So, give it a try and see the results.

Successful Brand Management Brand Equity Performance Assessment Dashboard Slides PDF
This slide provides information regarding brand equity performance assessment dashboard that highlights customer lifecycle value, customer adoption rate, mentions, engagement, etc. Do you have an important presentation coming up Are you looking for something that will make your presentation stand out from the rest Look no further than Successful Brand Management Brand Equity Performance Assessment Dashboard Slides PDF. With our professional designs, you can trust that your presentation will pop and make delivering it a smooth process. And with Slidegeeks, you can trust that your presentation will be unique and memorable. So why wait Grab Successful Brand Management Brand Equity Performance Assessment Dashboard Slides PDF today and make your presentation stand out from the rest.

Business Intelligence Dashboard To Review Employee Performance Pictures PDF
The following slide showcases BI dashboard to drill down major aspects of personnel management for HR department. It includes information about absenteeism, training costs, overtime hours and overall labor effectiveness. Showcasing this set of slides titled Business Intelligence Dashboard To Review Employee Performance Pictures PDF. The topics addressed in these templates are Business Intelligence Dashboard, Review Employee Performance. All the content presented in this PPT design is completely editable. Download it and make adjustments in color, background, font etc. as per your unique business setting.
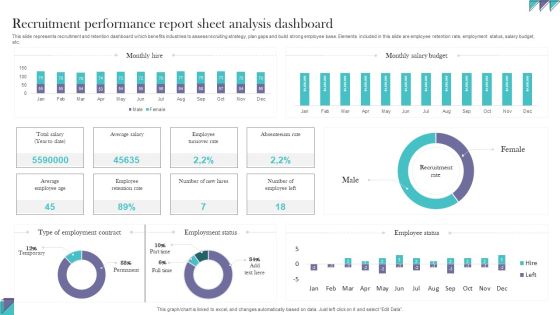
Recruitment Performance Report Sheet Analysis Dashboard Information PDF
This slide represents recruitment and retention dashboard which benefits industries to assess recruiting strategy, plan gaps and build strong employee base. Elements included in this slide are employee retention rate, employment status, salary budget, etc. Pitch your topic with ease and precision using this Recruitment Performance Report Sheet Analysis Dashboard Information PDF. This layout presents information onRecruitment Performance, Report Sheet Analysis. It is also available for immediate download and adjustment. So, changes can be made in the color, design, graphics or any other component to create a unique layout.

Vendor Performance KPI Dashboard For Distribution Business Formats PDF
This slide exhibits monthly performance dashboard for distribution businesses to track their suppliers and reduce the chance of major disruptions. It includes key elements such as cost per drop, purchase trend, top items, top suppliers, etc. Showcasing this set of slides titled Vendor Performance KPI Dashboard For Distribution Business Formats PDF. The topics addressed in these templates are Purchase Trend, Suppliers, Distribution Business. All the content presented in this PPT design is completely editable. Download it and make adjustments in color, background, font etc. as per your unique business setting.

Performance Management Strategy With Resources Needed Ppt Gallery Diagrams PDF
Showcasing this set of slides titled performance management strategy with resources needed ppt gallery diagrams pdf. The topics addressed in these templates are resources needed, timelines, evaluation plan. All the content presented in this PPT design is completely editable. Download it and make adjustments in color, background, font etc. as per your unique business setting.

PMP Tools Project Phase Earned Value Performance Forecast Demonstration PDF
This slide provides the glimpse about the earned value performance forecast graph and table which focuses on planned end and actual date, planned and earned value, and actual cost, etc.Deliver and pitch your topic in the best possible manner with this PMP Tools Project Phase Earned Value Performance Forecast Demonstration PDF Use them to share invaluable insights on Forecast Or Actual, Earned Value, Actual Cost and impress your audience. This template can be altered and modified as per your expectations. So, grab it now.

Dashboard Tracking Essential Kpis For Ecommerce Performance Slides PDF
This slide provides information regarding essential KPIs for ecommerce performance dashboard tracking average bounce rate, new vs. old customers, channel revenue vs. channel acquisitions costs, channel revenue vs. sales, average conversion rate, etc. Deliver an awe inspiring pitch with this creative Dashboard Tracking Essential Kpis For Ecommerce Performance Slides PDF bundle. Topics like Average Bounce Rate, Channel Acquisition Costs, Channel Revenue can be discussed with this completely editable template. It is available for immediate download depending on the needs and requirements of the user.
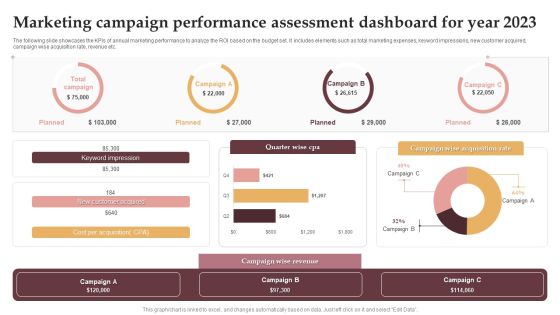
Marketing Campaign Performance Assessment Dashboard For Year 2023 Download PDF
The following slide showcases the KPIs of annual marketing performance to analyze the ROI based on the budget set. It includes elements such as total marketing expenses, keyword impressions, new customer acquired, campaign wise acquisition rate, revenue etc. Showcasing this set of slides titled Marketing Campaign Performance Assessment Dashboard For Year 2023 Download PDF. The topics addressed in these templates are Keyword Impression, New Customer Acquired, Campaign Wise Revenue. All the content presented in this PPT design is completely editable. Download it and make adjustments in color, background, font etc. as per your unique business setting.
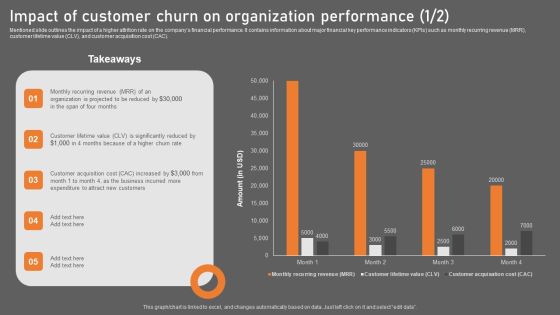
Impact Of Customer Churn On Organization Performance Background PDF
Mentioned slide outlines the impact of a higher attrition rate on the companys financial performance. It contains information about major financial key performance indicators KPIs such as monthly recurring revenue MRR, customer lifetime value CLV, and customer acquisition cost CAC. Take your projects to the next level with our ultimate collection of Impact Of Customer Churn On Organization Performance Background PDF. Slidegeeks has designed a range of layouts that are perfect for representing task or activity duration, keeping track of all your deadlines at a glance. Tailor these designs to your exact needs and give them a truly corporate look with your own brand colors they will make your projects stand out from the rest.
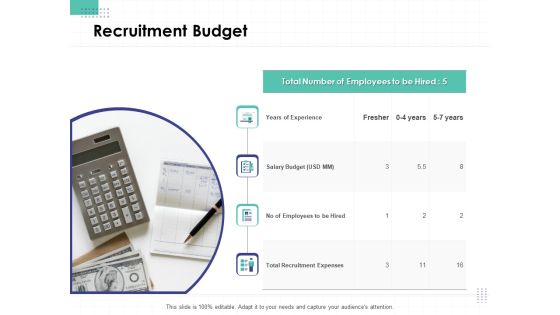
Performance Assessment Recruitment Budget Ppt File Clipart PDF
Presenting this set of slides with name performance assessment recruitment budget ppt file clipart pdf. The topics discussed in these slides are years of experience, salary budget, total recruitment expenses, no of employees to be hired. This is a completely editable PowerPoint presentation and is available for immediate download. Download now and impress your audience.

Supplier Performance And Order Cycle Time Monitoring Dashboard Introduction PDF
The following slide showcases a dashboard to supervise and manage procurement order cycle time an supplier performance. It includes key elements such as defect rate, on time supplies, supplier availability, lead time, supplier defect rate, defect type and delivery time. Do you have to make sure that everyone on your team knows about any specific topic I yes, then you should give Supplier Performance And Order Cycle Time Monitoring Dashboard Introduction PDF a try. Our experts have put a lot of knowledge and effort into creating this impeccable Supplier Performance And Order Cycle Time Monitoring Dashboard Introduction PDF. You can use this template for your upcoming presentations, as the slides are perfect to represent even the tiniest detail. You can download these templates from the Slidegeeks website and these are easy to edit. So grab these today.
Search Engine Marketing Develop Campaign Performance Tracking Framework Graphics PDF
The following slide depicts campaign performance management dashboard to measure the results. It includes elements such as conversions funnel, conversion rates, opportunity value, landing pages, sources google, twitter, Facebook etc. This Search Engine Marketing Develop Campaign Performance Tracking Framework Graphics PDF from Slidegeeks makes it easy to present information on your topic with precision. It provides customization options, so you can make changes to the colors, design, graphics, or any other component to create a unique layout. It is also available for immediate download, so you can begin using it right away. Slidegeeks has done good research to ensure that you have everything you need to make your presentation stand out. Make a name out there for a brilliant performance.

Financial Performance Introduction Of Supply Chain Management Organization Infographics PDF
This slide showcases introduction to statistics that can help supply chain management organization to evaluate the financial performance. Its key components are revenue, net income and revenue sources.Pitch your topic with ease and precision using this Financial Performance Introduction Of Supply Chain Management Organization Infographics PDF This layout presents information on Revenue Sources, Revenue Increased, Income Increased It is also available for immediate download and adjustment. So, changes can be made in the color, design, graphics or any other component to create a unique layout.
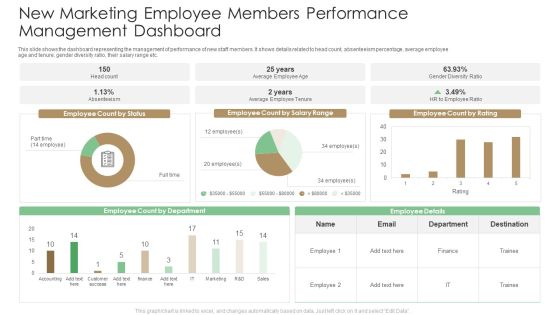
New Marketing Employee Members Performance Management Dashboard Summary PDF
This slide shows the dashboard representing the management of performance of new staff members. It shows details related to head count, absenteeism percentage, average employee age and tenure, gender diversity ratio, their salary range etc. Pitch your topic with ease and precision using this New Marketing Employee Members Performance Management Dashboard Summary PDF. This layout presents information on Employee Ratio, Average Employee Tenure. It is also available for immediate download and adjustment. So, changes can be made in the color, design, graphics or any other component to create a unique layout.
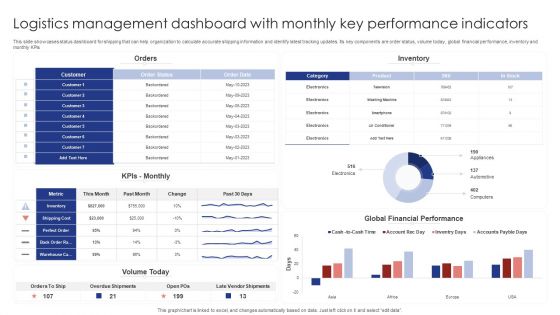
Logistics Management Dashboard With Monthly Key Performance Indicators Rules PDF
This slide showcases status dashboard for shipping that can help organization to calculate accurate shipping information and identify latest tracking updates. Its key components are order status, volume today, global financial performance, inventory and monthly KPIs. Pitch your topic with ease and precision using this Logistics Management Dashboard With Monthly Key Performance Indicators Rules PDF. This layout presents information on Orders, Inventory, Kpis Monthly. It is also available for immediate download and adjustment. So, changes can be made in the color, design, graphics or any other component to create a unique layout.
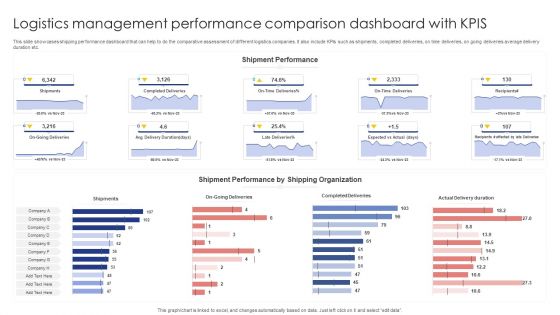
Logistics Management Performance Comparison Dashboard With Kpis Sample PDF
This slide showcases shipping performance dashboard that can help to do the comparative assessment of different logistics companies. It also include KPIs such as shipments, completed deliveries, on time deliveries, on going deliveries average delivery duration etc. Pitch your topic with ease and precision using this Logistics Management Performance Comparison Dashboard With Kpis Sample PDF. This layout presents information on Shipments, Completed Deliveries, Actual Delivery Duration. It is also available for immediate download and adjustment. So, changes can be made in the color, design, graphics or any other component to create a unique layout.
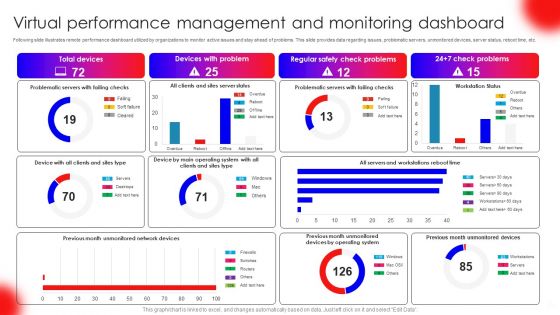
Virtual Performance Management And Monitoring Dashboard Pictures PDF
Following slide illustrates remote performance dashboard utilized by organizations to monitor active issues and stay ahead of problems. This slide provides data regarding issues, problematic servers, unmonitored devices, server status, reboot time, etc. Pitch your topic with ease and precision using this Virtual Performance Management And Monitoring Dashboard Pictures PDF. This layout presents information on Total Devices, Devices With Problem, Regular Safety Check Problems. It is also available for immediate download and adjustment. So, changes can be made in the color, design, graphics or any other component to create a unique layout.
SMS Marketing Automated Campaigns Performance Tracking Dashboard Formats PDF
This slide represents the key metrics dashboard to track, monitor and analyze the performance of SMS marketing automated campaign. It includes details related to KPIs such as new subscribers, responses received, total earned and top live automations etc. Are you searching for a SMS Marketing Automated Campaigns Performance Tracking Dashboard Formats PDF that is uncluttered, straightforward, and original. Its easy to edit, and you can change the colors to suit your personal or business branding. For a presentation that expresses how much effort youve put in, this template is ideal. With all of its features, including tables, diagrams, statistics, and lists, its perfect for a business plan presentation. Make your ideas more appealing with these professional slides. Download SMS Marketing Automated Campaigns Performance Tracking Dashboard Formats PDF from Slidegeeks today.
Website Performance Tracking And Monitoring Dashboard Ppt Summary Rules PDF
The following slide showcases a dashboard to track and measure website performance. It includes key elements such as visits, average session duration, bounce rate, page views, goal conversion, visits by week, traffic sources, top channels by conversions, etc. Do you have to make sure that everyone on your team knows about any specific topic I yes, then you should give Website Performance Tracking And Monitoring Dashboard Ppt Summary Rules PDF a try. Our experts have put a lot of knowledge and effort into creating this impeccable Website Performance Tracking And Monitoring Dashboard Ppt Summary Rules PDF. You can use this template for your upcoming presentations, as the slides are perfect to represent even the tiniest detail. You can download these templates from the Slidegeeks website and these are easy to edit. So grab these today.
Website Performance Tracking And Monitoring Dashboard Designs PDF
The following slide showcases a dashboard to track and measure website performance. It includes key elements such as visits, average session duration, bounce rate, page views, goal conversion, visits by week, traffic sources, top channels by conversions, etc. Explore a selection of the finest Website Performance Tracking And Monitoring Dashboard Designs PDF here. With a plethora of professionally designed and pre made slide templates, you can quickly and easily find the right one for your upcoming presentation. You can use our Website Performance Tracking And Monitoring Dashboard Designs PDF to effectively convey your message to a wider audience. Slidegeeks has done a lot of research before preparing these presentation templates. The content can be personalized and the slides are highly editable. Grab templates today from Slidegeeks.
Website Performance Tracking And Monitoring Dashboard Ppt Slides Files PDF
The following slide showcases a dashboard to track and measure website performance. It includes key elements such as visits, average session duration, bounce rate, page views, goal conversion, visits by week, traffic sources, top channels by conversions, etc. Whether you have daily or monthly meetings, a brilliant presentation is necessary. Website Performance Tracking And Monitoring Dashboard Ppt Slides Files PDF can be your best option for delivering a presentation. Represent everything in detail using Website Performance Tracking And Monitoring Dashboard Ppt Slides Files PDF and make yourself stand out in meetings. The template is versatile and follows a structure that will cater to your requirements. All the templates prepared by Slidegeeks are easy to download and edit. Our research experts have taken care of the corporate themes as well. So, give it a try and see the results.
SMS Marketing Automated Campaigns Performance Tracking Dashboard Professional PDF
This slide represents the key metrics dashboard to track, monitor and analyze the performance of SMS marketing automated campaign. It includes details related to KPIs such as new subscribers, responses received, total earned and top live automations etc. Get a simple yet stunning designed SMS Marketing Automated Campaigns Performance Tracking Dashboard Professional PDF. It is the best one to establish the tone in your meetings. It is an excellent way to make your presentations highly effective. So, download this PPT today from Slidegeeks and see the positive impacts. Our easy to edit SMS Marketing Automated Campaigns Performance Tracking Dashboard Professional PDF can be your go to option for all upcoming conferences and meetings. So, what are you waiting for Grab this template today.

Talent Administration And Succession HR Performance Management Dashboard Background PDF
Whether you have daily or monthly meetings, a brilliant presentation is necessary. Talent Administration And Succession HR Performance Management Dashboard Background PDF can be your best option for delivering a presentation. Represent everything in detail using Talent Administration And Succession HR Performance Management Dashboard Background PDF and make yourself stand out in meetings. The template is versatile and follows a structure that will cater to your requirements. All the templates prepared by Slidegeeks are easy to download and edit. Our research experts have taken care of the corporate themes as well. So, give it a try and see the results.

Agile Virtual Project Management Agile Performance Evaluation Metrics Icons PDF
This slide covers the metrics used by the organisation to measure agile capability on the basis of product performance, security level and user satisfaction Present like a pro with Agile Virtual Project Management Agile Performance Evaluation Metrics Icons PDF Create beautiful presentations together with your team, using our easy-to-use presentation slides. Share your ideas in real-time and make changes on the fly by downloading our templates. So whether youre in the office, on the go, or in a remote location, you can stay in sync with your team and present your ideas with confidence. With Slidegeeks presentation got a whole lot easier. Grab these presentations today.

Overall Performance Improvement Across B2B Account Management Department Guidelines PDF
This slide provides information regarding improved overall performance in terms of increased revenue generation, improved lead generation and enhanced sales and marketing alignment. This Overall Performance Improvement Across B2B Account Management Department Guidelines PDF is perfect for any presentation, be it in front of clients or colleagues. It is a versatile and stylish solution for organizing your meetings. The product features a modern design for your presentation meetings. The adjustable and customizable slides provide unlimited possibilities for acing up your presentation. Slidegeeks has done all the homework before launching the product for you. So, do not wait, grab the presentation templates today

Identifying The Need For Warehouse Performance Management Ideas PDF
This slide identifies the current challenges leading to decline in business performance and suggest solution for optimizing the same. It also analyzes warehouse inventory turnover and identifies gap between the target state and actual turnover rate. There are so many reasons you need a Identifying The Need For Warehouse Performance Management Ideas PDF. The first reason is you can not spend time making everything from scratch, Thus, Slidegeeks has made presentation templates for you too. You can easily download these templates from our website easily.
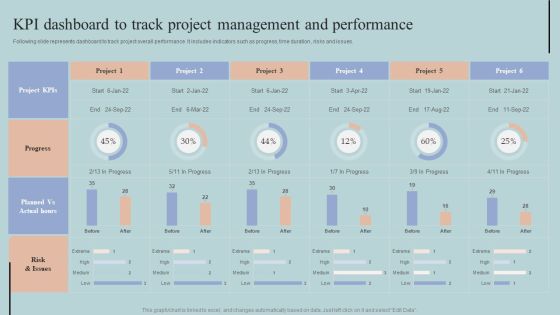
KPI Dashboard To Track Project Management And Performance Elements PDF
Following slide represents dashboard to track project overall performance. It includes indicators such as progress, time duration , risks and issues. Welcome to our selection of the KPI Dashboard To Track Project Management And Performance Elements PDF. These are designed to help you showcase your creativity and bring your sphere to life. Planning and Innovation are essential for any business that is just starting out. This collection contains the designs that you need for your everyday presentations. All of our PowerPoints are 100 percent editable, so you can customize them to suit your needs. This multi-purpose template can be used in various situations. Grab these presentation templates today

Prospective Buyer Retention Dashboard With Key Performance Indicators Themes PDF
This slide shows the dashboard representing the key performance metrics for retention of potential customers of the organization. It shows no. of active users, churn rate, cost of customer acquisition, their life time value, monthly recurring revenue etc.Pitch your topic with ease and precision using this Prospective Buyer Retention Dashboard With Key Performance Indicators Themes PDF. This layout presents information on Recurring Revenue, Revenue Growth, Customer Acquisition. It is also available for immediate download and adjustment. So, changes can be made in the color, design, graphics or any other component to create a unique layout.

Evaluation Of Risk Factor Influencing Sales Performance Inspiration PDF
This slide depicts the major factors that influences the sales performance of a company. It includes pie chart with weightage showing initial risks like shortage of raw material, increase in price. Pitch your topic with ease and precision using this Evaluation Of Risk Factor Influencing Sales Performance Inspiration PDF. This layout presents information on Production Cost, Customer Shift, Risk Influencing. It is also available for immediate download and adjustment. So, changes can be made in the color, design, graphics or any other component to create a unique layout.

Metric Dashboard To Track Supplier Diversity And Performance Designs PDF
This slide represents KPI dashboard for tracking supplier diversity in organization and measure performance. It provides information regarding organization spending cost, supplier count, diversity type, status etc. Pitch your topic with ease and precision using this Metric Dashboard To Track Supplier Diversity And Performance Designs PDF. This layout presents information on Diversity Type, Diversity Status, Diverse Supplier. It is also available for immediate download and adjustment. So, changes can be made in the color, design, graphics or any other component to create a unique layout.

Impact Of Flexible Working On Employees Performance Graphics PDF
The following slide showcases the impact of remote working on performance of the workforce. Employee productivity, job satisfaction, employee retention and absenteeism rate are the major factors that are mentioned in the slide along with key insights. The best PPT templates are a great way to save time, energy, and resources. Slidegeeks have 100 percent editable powerpoint slides making them incredibly versatile. With these quality presentation templates, you can create a captivating and memorable presentation by combining visually appealing slides and effectively communicating your message. Download Impact Of Flexible Working On Employees Performance Graphics PDF from Slidegeeks and deliver a wonderful presentation.

Media Advertising Youtube Video Ads Performance Dashboard Information PDF
This slide shows the campaign performance in terms of total number of views, traffic sources, likes, comments and shares. The best PPT templates are a great way to save time, energy, and resources. Slidegeeks have 100 percent editable powerpoint slides making them incredibly versatile. With these quality presentation templates, you can create a captivating and memorable presentation by combining visually appealing slides and effectively communicating your message. Download Media Advertising Youtube Video Ads Performance Dashboard Information PDF from Slidegeeks and deliver a wonderful presentation.

Competitive Analysis Of Sales And Revenue Performance Information PDF
The following slide showcases the competitive assessment of organizations sales and revenues to evaluate the gap and compare metrics. It includes pie chart representing performance along with key insights etc. Slidegeeks is one of the best resources for PowerPoint templates. You can download easily and regulate Competitive Analysis Of Sales And Revenue Performance Information PDF for your personal presentations from our wonderful collection. A few clicks is all it takes to discover and get the most relevant and appropriate templates. Use our Templates to add a unique zing and appeal to your presentation and meetings. All the slides are easy to edit and you can use them even for advertisement purposes.

Business Newsletter Referral Marketing Program Performance KPI Dashboard Formats PDF
This slide represents KPI dashboard designed to track performance of the program conducted to attract new leads at lower cost with the help of existing customers to generate leads that best fit the organization. It includes key metrics such as total revenue generated, monthly recurring revenue, paying customers etc. Showcasing this set of slides titled Business Newsletter Referral Marketing Program Performance KPI Dashboard Formats PDF. The topics addressed in these templates are Dashboard, Paying Customers, Monthly Recurring Revenue, Total Revenue Generated. All the content presented in this PPT design is completely editable. Download it and make adjustments in color, background, font etc. as per your unique business setting.

Business Development Program Dashboard To Track Employee Performance Portrait PDF
This slide showcases dashboard that can help organization to track on job training program. Its key components are absenteeism rate, overtime hours, training duration and cost and overall labor effectiveness rate. From laying roadmaps to briefing everything in detail, our templates are perfect for you. You can set the stage with your presentation slides. All you have to do is download these easy-to-edit and customizable templates. Business Development Program Dashboard To Track Employee Performance Portrait PDF will help you deliver an outstanding performance that everyone would remember and praise you for. Do download this presentation today.

Application Performance Management Application Cost Comparison Ppt Ideas Model PDF
This is a application performance management application cost comparison ppt ideas model pdf template with various stages. Focus and dispense information on three stages using this creative set, that comes with editable features. It contains large content boxes to add your information on topics like finance, human resource, marketing, maintenance, cost. You can also showcase facts, figures, and other relevant content using this PPT layout. Grab it now.
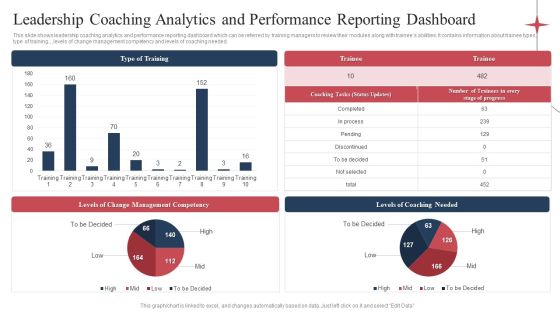
Leadership Coaching Analytics And Performance Reporting Dashboard Demonstration PDF
This slide shows leadership coaching analytics and performance reporting dashboard which can be referred by training managers to review their modules along with trainees abilities. It contains information about trainee types, type of training., ,levels of change management competency and levels of coaching needed. Pitch your topic with ease and precision using this Leadership Coaching Analytics And Performance Reporting Dashboard Demonstration PDF. This layout presents information on Levels Coaching Needed, Levels Change Management, Type Training. It is also available for immediate download and adjustment. So, changes can be made in the color, design, graphics or any other component to create a unique layout.
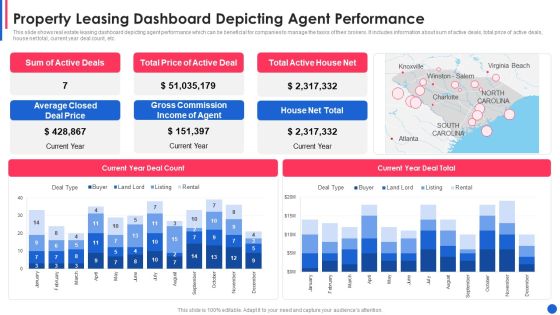
Property Leasing Dashboard Depicting Agent Performance Guidelines PDF
This slide shows real estate leasing dashboard depicting agent performance which can be beneficial for companies to manage the tasks of their brokers. It includes information about sum of active deals, total price of active deals, house net total, current year deal count, etc.Pitch your topic with ease and precision using this property leasing dashboard depicting agent performance guidelines pdf This layout presents information on average closed deal price, gross commission income, total active house net It is also available for immediate download and adjustment. So, changes can be made in the color, design, graphics or any other component to create a unique layout.

Staff Turnover Key Performance Indicators Dashboard Sample PDF
The following slide highlights the staff turnover key performance Indicators dashboard illustrating employee turn over, turn over rate, average tenure, turnover per quarter, turnover per department, turnover type, turnover time period, turnover per position and turnover reasons Deliver and pitch your topic in the best possible manner with this Staff Turnover Key Performance Indicators Dashboard Sample PDF Use them to share invaluable insights on Management Goals, Subjective Appraisal, Product Defects and impress your audience. This template can be altered and modified as per your expectations. So, grab it now.

Summary Of Financial Performance Of Present Business Survey SS
The purpose of this slide is to summarize the results of a one-page survey that can be used by policymakers to gain insights into the financial performance of all the businesses operating in the service industry to gain insights and take action accordingly. The results provided are related to executions and staffing. Pitch your topic with ease and precision using this Summary Of Financial Performance Of Present Business Survey SS. This layout presents information on Business Executions, Business Employees, Organization, Officers, Managers, Staff. It is also available for immediate download and adjustment. So, changes can be made in the color, design, graphics or any other component to create a unique layout.

Organization IT Service Desk Administration Performance Dashboard Infographics PDF
This slide represents the dashboard showing the performance of the service desk management team of the organization. It shows details related to benchmark achieved, customer satisfaction, contracts by type and manufacturer, incidents by category, computer by status, service level management etc. Showcasing this set of slides titled Organization IT Service Desk Administration Performance Dashboard Infographics PDF. The topics addressed in these templates are Service, Management, Manufacturer. All the content presented in this PPT design is completely editable. Download it and make adjustments in color, background, font etc. as per your unique business setting.
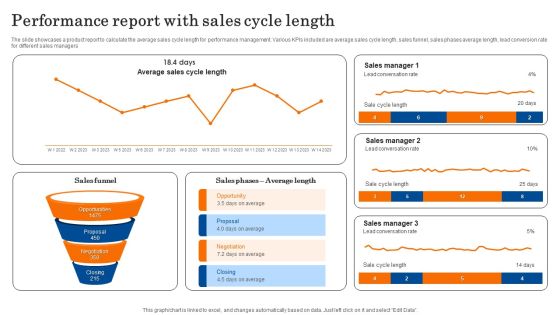
Performance Report With Sales Cycle Length Template PDF
The slide showcases a product report to calculate the average sales cycle length for performance management. Various KPIs included are average sales cycle length, sales funnel, sales phases average length, lead conversion rate for different sales managers. sPitch your topic with ease and precision using this Performance Report With Sales Cycle Length Template PDF. This layout presents information on Sales Manager, Conversation Rate, Opportunity. It is also available for immediate download and adjustment. So, changes can be made in the color, design, graphics or any other component to create a unique layout.

Application Lifecycle Management ALM Measuring Asset Performance Pictures PDF
Presenting this set of slides with name application lifecycle management alm measuring asset performance pictures pdf. The topics discussed in these slides are maintenance, cost, procurement, assets, intangible. This is a completely editable PowerPoint presentation and is available for immediate download. Download now and impress your audience.

Asset Management Lifecycle Optimization Procurement Measuring Asset Performance Guidelines PDF
Presenting this set of slides with name asset management lifecycle optimization procurement measuring asset performance guidelines pdf. The topics discussed in these slides are maintenance, cost, procurement, assets, intangible. This is a completely editable PowerPoint presentation and is available for immediate download. Download now and impress your audience.
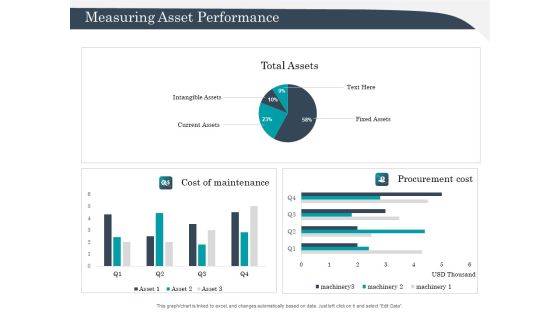
Strategic Management Of Assets Measuring Asset Performance Ideas PDF
Presenting this set of slides with name strategic management of assets measuring asset performance ideas pdf. The topics discussed in these slides are maintenance, cost, procurement, assets, intangible. This is a completely editable PowerPoint presentation and is available for immediate download. Download now and impress your audience.

Rethink Approach Asset Lifecycle Management Measuring Asset Performance Elements PDF
Presenting this set of slides with name rethink approach asset lifecycle management measuring asset performance elements pdf. The topics discussed in these slides are maintenance, cost, procurement, assets, intangible. This is a completely editable PowerPoint presentation and is available for immediate download. Download now and impress your audience.

Various Metrics Determining Online Video Hosting Platform Performance Background PDF
This slide caters details about various metrics portraying online video hosting platform progress in terms of rise in subscribers, rise in average revenue per user, and overall revenue. Deliver and pitch your topic in the best possible manner with this various metrics determining online video hosting platform performance background pdf. Use them to share invaluable insights on various metrics determining online video hosting platform performance and impress your audience. This template can be altered and modified as per your expectations. So, grab it now.
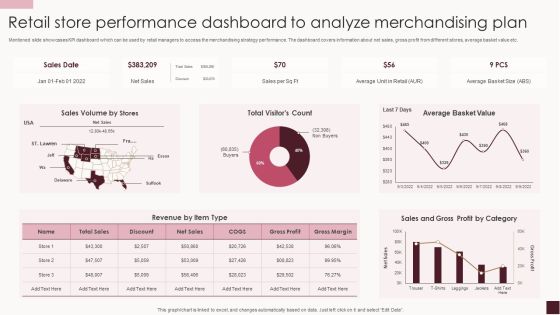
Retail Store Performance Dashboard To Analyze Merchandising Plan Structure PDF
Mentioned slide showcases KPI dashboard which can be used by retail managers to access the merchandising strategy performance. The dashboard covers information about net sales, gross profit from different stores, average basket value etc.Showcasing this set of slides titled Retail Store Performance Dashboard To Analyze Merchandising Plan Structure PDF. The topics addressed in these templates are Sales Volume, Average Basket, Gross Profit. All the content presented in this PPT design is completely editable. Download it and make adjustments in color, background, font etc. as per your unique business setting.
Retail Assortment Dashboard Depicting Store Performance Ppt Icon Structure PDF
This slide shows product assortment dashboard depicting store performance which can benefit managers in reviewing the current situation of outlets and make decisions according to reached benchmarks. It includes details about achieved sales, rate of conversion, weekday vs. Weekend sales, daily trend, etc. Showcasing this set of slides titled Retail Assortment Dashboard Depicting Store Performance Ppt Icon Structure PDF. The topics addressed in these templates are Achieved Sales, Rate Of Conversion, Daily Trend, Outlet Sales. All the content presented in this PPT design is completely editable. Download it and make adjustments in color, background, font etc. as per your unique business setting.

Analyzing Major Performance Indicators Post Extension Strategies Designs PDF
This slide showcases analyzing major performance indicators which can help branding managers to assess extension strategy KPIs. It provides details about market share, product line, launch, variants, color, size, net promotor score NPS, etc. Want to ace your presentation in front of a live audience Our Analyzing Major Performance Indicators Post Extension Strategies Designs PDF can help you do that by engaging all the users towards you. Slidegeeks experts have put their efforts and expertise into creating these impeccable powerpoint presentations so that you can communicate your ideas clearly. Moreover, all the templates are customizable, and easy-to-edit and downloadable. Use these for both personal and commercial use.
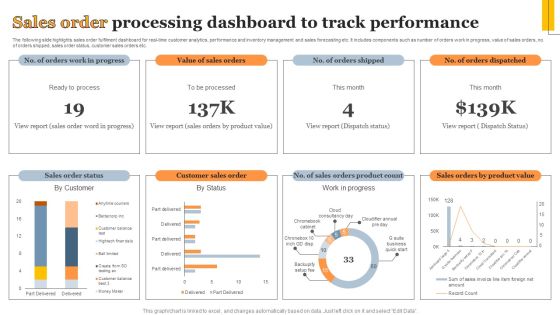
Sales Order Processing Dashboard To Track Performance Information PDF
The following slide highlights sales order fulfilment dashboard for real-time customer analytics, performance and inventory management and sales forecasting etc. It includes components such as number of orders work in progress, value of sales orders, no. of orders shipped, sales order status, customer sales orders etc. Showcasing this set of slides titled Sales Order Processing Dashboard To Track Performance Information PDF. The topics addressed in these templates are Sales Order Status, Customer Sales Order, Work Progress. All the content presented in this PPT design is completely editable. Download it and make adjustments in color, background, font etc. as per your unique business setting.

Defining Key Metrics To Analyse Current Sales Performance Background PDF
The following slide showcases some metrics to evaluate existing sales performance due to execute effective risk management strategies. It includes elements such as opportunities, win rate, average time to win, average value per win, sales velocity etc. Want to ace your presentation in front of a live audience Our Defining Key Metrics To Analyse Current Sales Performance Background PDF can help you do that by engaging all the users towards you. Slidegeeks experts have put their efforts and expertise into creating these impeccable powerpoint presentations so that you can communicate your ideas clearly. Moreover, all the templates are customizable, and easy to edit and downloadable. Use these for both personal and commercial use.

KPI Dashboard To Measure Sales Divisional Strategy Performance Microsoft PDF
This slide signifies the key performance indicator dashboard to evaluate sales department strategy. It covers information regarding to the leads generated, conversion rate, top product in revenue. Pitch your topic with ease and precision using this KPI Dashboard To Measure Sales Divisional Strategy Performance Microsoft PDF. This layout presents information on Sales Rations, Lead Generation, Customer Conversion. It is also available for immediate download and adjustment. So, changes can be made in the color, design, graphics or any other component to create a unique layout.

Dashboard To Assess Ecommerce Financial Performance Across Regions Themes PDF
This slide showcases ecommerce key performance indicators KPI dashboard with financial statement. It provides information about total sales, orders, net profit, net profit margin, average order value, channels, etc. Here you can discover an assortment of the finest PowerPoint and Google Slides templates. With these templates, you can create presentations for a variety of purposes while simultaneously providing your audience with an eye catching visual experience. Download Dashboard To Assess Ecommerce Financial Performance Across Regions Themes PDF to deliver an impeccable presentation. These templates will make your job of preparing presentations much quicker, yet still, maintain a high level of quality. Slidegeeks has experienced researchers who prepare these templates and write high quality content for you. Later on, you can personalize the content by editing the Dashboard To Assess Ecommerce Financial Performance Across Regions Themes PDF.
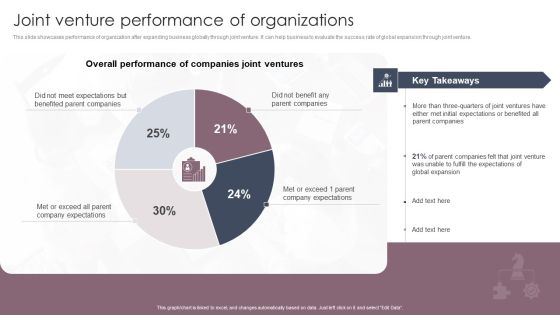
International Business Extension Joint Venture Performance Of Organizations Graphics PDF
This slide showcases performance of organization after expanding business globally through joint venture. It can help business to evaluate the success rate of global expansion through joint venture. Here you can discover an assortment of the finest PowerPoint and Google Slides templates. With these templates, you can create presentations for a variety of purposes while simultaneously providing your audience with an eye-catching visual experience. Download International Business Extension Joint Venture Performance Of Organizations Graphics PDF to deliver an impeccable presentation. These templates will make your job of preparing presentations much quicker, yet still, maintain a high level of quality. Slidegeeks has experienced researchers who prepare these templates and write high-quality content for you. Later on, you can personalize the content by editing the International Business Extension Joint Venture Performance Of Organizations Graphics PDF.
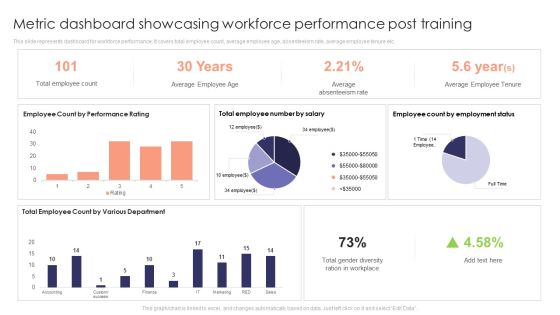
Metric Dashboard Showcasing Workforce Performance Post Training Ideas PDF
This slide represents dashboard for workforce performance. It covers total employee count, average employee age, absenteeism rate, average employee tenure etc. If you are looking for a format to display your unique thoughts, then the professionally designed Metric Dashboard Showcasing Workforce Performance Post Training Ideas PDF is the one for you. You can use it as a Google Slides template or a PowerPoint template. Incorporate impressive visuals, symbols, images, and other charts. Modify or reorganize the text boxes as you desire. Experiment with shade schemes and font pairings. Alter, share or cooperate with other people on your work. Download Metric Dashboard Showcasing Workforce Performance Post Training Ideas PDF and find out how to give a successful presentation. Present a perfect display to your team and make your presentation unforgettable.

Dashboard To Assess Ecommerce Financial Performance Across Regions Infographics PDF
This slide showcases ecommerce key performance indicators KPI dashboard with financial statement. It provides information about total sales, orders, net profit, net profit margin, average order value, channels, etc.Here you can discover an assortment of the finest PowerPoint and Google Slides templates. With these templates, you can create presentations for a variety of purposes while simultaneously providing your audience with an eye-catching visual experience. Download Dashboard To Assess Ecommerce Financial Performance Across Regions Infographics PDF to deliver an impeccable presentation. These templates will make your job of preparing presentations much quicker, yet still, maintain a high level of quality. Slidegeeks has experienced researchers who prepare these templates and write high-quality content for you. Later on, you can personalize the content by editing the Dashboard To Assess Ecommerce Financial Performance Across Regions Infographics PDF.

Dashboard To Measure Business Financial Performance Summary PDF
This slide shows the dashboard to measure business financial performance which focuses on revenues, debt to equity, net profit margin, gross profit margin and return on equity. Are you searching for a Dashboard To Measure Business Financial Performance Summary PDF that is uncluttered, straightforward, and original Its easy to edit, and you can change the colors to suit your personal or business branding. For a presentation that expresses how much effort youve put in, this template is ideal With all of its features, including tables, diagrams, statistics, and lists, its perfect for a business plan presentation. Make your ideas more appealing with these professional slides. Download Dashboard To Measure Business Financial Performance Summary PDF from Slidegeeks today.

New Product Launch Product Launch Team Performance Dashboard Portrait PDF
This slide provides information regarding product launch team performance with key result area scores for idea generation, engineering AND design and key result areas performance. Retrieve professionally designed New Product Launch Product Launch Team Performance Dashboard Portrait PDF to effectively convey your message and captivate your listeners. Save time by selecting pre-made slideshows that are appropriate for various topics, from business to educational purposes. These themes come in many different styles, from creative to corporate, and all of them are easily adjustable and can be edited quickly. Access them as PowerPoint templates or as Google Slides themes. You dont have to go on a hunt for the perfect presentation because Slidegeeks got you covered from everywhere.

Enhancing Organic Reach Social Media Campaign Performance Dashboard Rules PDF
This slide shows social media promotional campaign performance dashboard. It provides information about followers, reach, clicks, leads, shares, likes, comments, engagement, etc. Formulating a presentation can take up a lot of effort and time, so the content and message should always be the primary focus. The visuals of the PowerPoint can enhance the presenters message, so our Enhancing Organic Reach Social Media Campaign Performance Dashboard Rules PDF was created to help save time. Instead of worrying about the design, the presenter can concentrate on the message while our designers work on creating the ideal templates for whatever situation is needed. Slidegeeks has experts for everything from amazing designs to valuable content, we have put everything into Enhancing Organic Reach Social Media Campaign Performance Dashboard Rules PDF
KPI Dashboard For Tracking Email Marketing Campaign Performance Microsoft PDF
This slide covers the dashboard for analysing email marketing metrics such as overall open rate, click-through rate, click to open ratio, unsubscribe rate, hard bounce rate, soft rate, monthly open rate, total monthly subscribers, etc. Presenting this PowerPoint presentation, titled KPI Dashboard For Tracking Email Marketing Campaign Performance Microsoft PDF, with topics curated by our researchers after extensive research. This editable presentation is available for immediate download and provides attractive features when used. Download now and captivate your audience. Presenting this KPI Dashboard For Tracking Email Marketing Campaign Performance Microsoft PDF. Our researchers have carefully researched and created these slides with all aspects taken into consideration. This is a completely customizable KPI Dashboard For Tracking Email Marketing Campaign Performance Microsoft PDF that is available for immediate downloading. Download now and make an impact on your audience. Highlight the attractive features available with our PPTs.
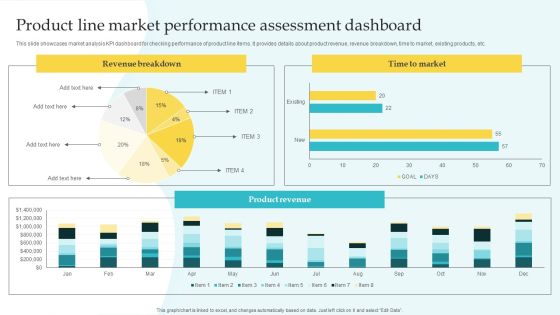
Commodity Line Expansion Product Line Market Performance Assessment Download PDF
This slide showcases market analysis KPI dashboard for checking performance of product line items. It provides details about product revenue, revenue breakdown, time to market, existing products, etc. Explore a selection of the finest Commodity Line Expansion Product Line Market Performance Assessment Download PDF here. With a plethora of professionally designed and pre-made slide templates, you can quickly and easily find the right one for your upcoming presentation. You can use our Commodity Line Expansion Product Line Market Performance Assessment Download PDF to effectively convey your message to a wider audience. Slidegeeks has done a lot of research before preparing these presentation templates. The content can be personalized and the slides are highly editable. Grab templates today from Slidegeeks.

Optimizing Online Stores Email Campaign Performance KPI Dashboard Graphics PDF
This slide covers dashboard providing an insight related to how subscribers and resonating with email marketing campaign. It key performance metrics such as sessions from email, sessions from email by campaign, sessions by email by date etc. Crafting an eye-catching presentation has never been more straightforward. Let your presentation shine with this tasteful yet straightforward Optimizing Online Stores Email Campaign Performance KPI Dashboard Graphics PDF template. It offers a minimalistic and classy look that is great for making a statement. The colors have been employed intelligently to add a bit of playfulness while still remaining professional. Construct the ideal Optimizing Online Stores Email Campaign Performance KPI Dashboard Graphics PDF that effortlessly grabs the attention of your audience Begin now and be certain to wow your customers.
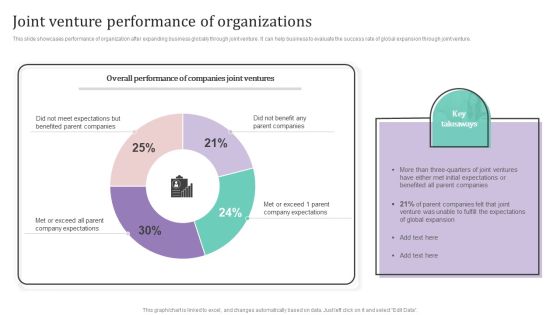
Joint Venture Performance Of Organizations Ppt PowerPoint Presentation Diagram PDF
This slide showcases performance of organization after expanding business globally through joint venture. It can help business to evaluate the success rate of global expansion through joint venture.Whether you have daily or monthly meetings, a brilliant presentation is necessary. Joint Venture Performance Of Organizations Ppt PowerPoint Presentation Diagram PDF can be your best option for delivering a presentation. Represent everything in detail using Joint Venture Performance Of Organizations Ppt PowerPoint Presentation Diagram PDF and make yourself stand out in meetings. The template is versatile and follows a structure that will cater to your requirements. All the templates prepared by Slidegeeks are easy to download and edit. Our research experts have taken care of the corporate themes as well. So, give it a try and see the results.
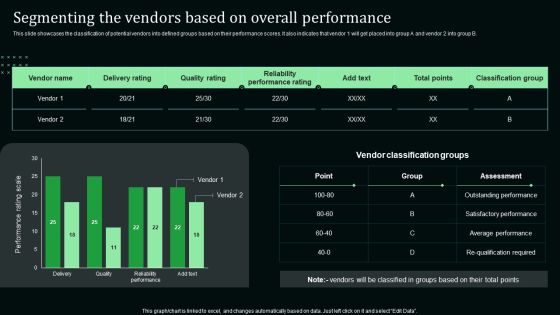
Segmenting The Vendors Based On Overall Performance Diagrams PDF
This slide showcases the classification of potential vendors into defined groups based on their performance scores. It also indicates that vendor 1 will get placed into group A and vendor 2 into group B. Do you have an important presentation coming up Are you looking for something that will make your presentation stand out from the rest Look no further than Segmenting The Vendors Based On Overall Performance Diagrams PDF. With our professional designs, you can trust that your presentation will pop and make delivering it a smooth process. And with Slidegeeks, you can trust that your presentation will be unique and memorable. So why wait Grab Segmenting The Vendors Based On Overall Performance Diagrams PDF today and make your presentation stand out from the rest
Social Media Marketing Performance Tracking Dashboard Inspiration PDF
Following slide displays KPI dashboard that can be used to monitor the performance of social media marketing campaign. Metrics covered are related to fans number, engagement rate and page impressions.This Social Media Marketing Performance Tracking Dashboard Inspiration PDF from Slidegeeks makes it easy to present information on your topic with precision. It provides customization options, so you can make changes to the colors, design, graphics, or any other component to create a unique layout. It is also available for immediate download, so you can begin using it right away. Slidegeeks has done good research to ensure that you have everything you need to make your presentation stand out. Make a name out there for a brilliant performance.
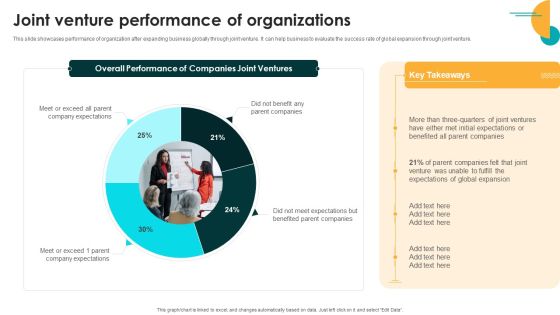
Entering International Markets And Acquiring Joint Venture Performance Themes PDF
This slide showcases performance of organization after expanding business globally through joint venture. It can help business to evaluate the success rate of global expansion through joint venture. Find highly impressive Entering International Markets And Acquiring Joint Venture Performance Themes PDF on Slidegeeks to deliver a meaningful presentation. You can save an ample amount of time using these presentation templates. No need to worry to prepare everything from scratch because Slidegeeks experts have already done a huge research and work for you. You need to download Entering International Markets And Acquiring Joint Venture Performance Themes PDF for your upcoming presentation. All the presentation templates are 100 percent editable and you can change the color and personalize the content accordingly. Download now.

Service Promotion Plan Service Marketing Quarterly Performance Improvement Guidelines PDF
This slide shows graph which can be used by the organizations to present the improvement in performance of service providing businesses through marketing. It includes metrics such as brand awareness, sales, website traffic and new leads. Are you searching for a Service Promotion Plan Service Marketing Quarterly Performance Improvement Guidelines PDF that is uncluttered, straightforward, and original Its easy to edit, and you can change the colors to suit your personal or business branding. For a presentation that expresses how much effort youve put in, this template is ideal With all of its features, including tables, diagrams, statistics, and lists, its perfect for a business plan presentation. Make your ideas more appealing with these professional slides. Download Service Promotion Plan Service Marketing Quarterly Performance Improvement Guidelines PDF from Slidegeeks today.
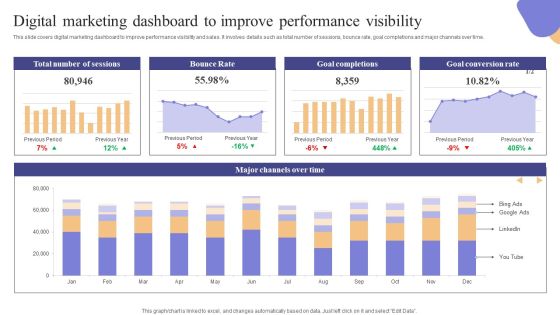
Digital Marketing Dashboard To Improve Performance Visibility Brochure PDF
This slide covers digital marketing dashboard to improve performance visibility and sales. It involves details such as total number of sessions, bounce rate, goal completions and major channels over time. If you are looking for a format to display your unique thoughts, then the professionally designed Digital Marketing Dashboard To Improve Performance Visibility Brochure PDF is the one for you. You can use it as a Google Slides template or a PowerPoint template. Incorporate impressive visuals, symbols, images, and other charts. Modify or reorganize the text boxes as you desire. Experiment with shade schemes and font pairings. Alter, share or cooperate with other people on your work. Download Digital Marketing Dashboard To Improve Performance Visibility Brochure PDF and find out how to give a successful presentation. Present a perfect display to your team and make your presentation unforgettable.
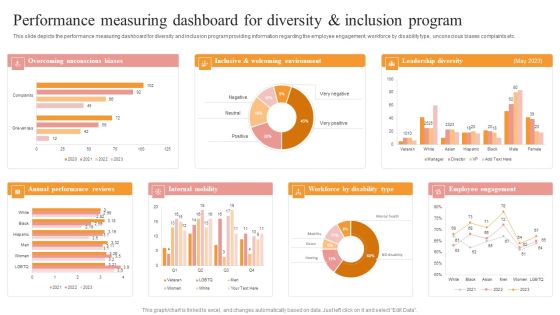
Performance Measuring Dashboard For Diversity And Inclusion Program Summary PDF
This slide depicts the performance measuring dashboard for diversity and inclusion program providing information regarding the employee engagement, workforce by disability type, unconscious biases complaints etc. Explore a selection of the finest Performance Measuring Dashboard For Diversity And Inclusion Program Summary PDF here. With a plethora of professionally designed and pre made slide templates, you can quickly and easily find the right one for your upcoming presentation. You can use our Performance Measuring Dashboard For Diversity And Inclusion Program Summary PDF to effectively convey your message to a wider audience. Slidegeeks has done a lot of research before preparing these presentation templates. The content can be personalized and the slides are highly editable. Grab templates today from Slidegeeks.

Ecommerce Data Driven Marketing Performance Analysis Dashboard Professional PDF
This slide represents the key metrics dashboard to track and analyze the performance of ecommerce business after implementing data driven marketing strategies. It includes details related to key metrics such as ecommerce revenue, new customers, repeat purchase rate etc. Get a simple yet stunning designed Ecommerce Data Driven Marketing Performance Analysis Dashboard Professional PDF. It is the best one to establish the tone in your meetings. It is an excellent way to make your presentations highly effective. So, download this PPT today from Slidegeeks and see the positive impacts. Our easy-to-edit Ecommerce Data Driven Marketing Performance Analysis Dashboard Professional PDF can be your go-to option for all upcoming conferences and meetings. So, what are you waiting for Grab this template today.
Optimize Brand Valuation Corporate Branding Performance Tracking Dashboard Structure PDF
This slide provides information regarding corporate branding performance tracking dashboard in terms of leads, conversion metrics, web traffic, etc. Whether you have daily or monthly meetings, a brilliant presentation is necessary. Optimize Brand Valuation Corporate Branding Performance Tracking Dashboard Structure PDF can be your best option for delivering a presentation. Represent everything in detail using Optimize Brand Valuation Corporate Branding Performance Tracking Dashboard Structure PDF and make yourself stand out in meetings. The template is versatile and follows a structure that will cater to your requirements. All the templates prepared by Slidegeeks are easy to download and edit. Our research experts have taken care of the corporate themes as well. So, give it a try and see the results.

Performance Summary Market Share And Brand Status Diagrams PDF
Purpose of this slide is to address information about business performance. Information covered in the slide are of competitors, product market share and brand status. If you are looking for a format to display your unique thoughts, then the professionally designed Performance Summary Market Share And Brand Status Diagrams PDF is the one for you. You can use it as a Google Slides template or a PowerPoint template. Incorporate impressive visuals, symbols, images, and other charts. Modify or reorganize the text boxes as you desire. Experiment with shade schemes and font pairings. Alter, share or cooperate with other people on your work. Download Performance Summary Market Share And Brand Status Diagrams PDF and find out how to give a successful presentation. Present a perfect display to your team and make your presentation unforgettable.

Brand Recognition Overview Different Brands Performance Tracking Dashboard Brochure PDF
This slide provides information regarding different brands performance tracking dashboard in terms of brand metric, brand commitment, advertising metrics, and purchase metrics. Do you have to make sure that everyone on your team knows about any specific topic I yes, then you should give Brand Recognition Overview Different Brands Performance Tracking Dashboard Brochure PDF a try. Our experts have put a lot of knowledge and effort into creating this impeccable Brand Recognition Overview Different Brands Performance Tracking Dashboard Brochure PDF. You can use this template for your upcoming presentations, as the slides are perfect to represent even the tiniest detail. You can download these templates from the Slidegeeks website and these are easy to edit. So grab these today

KPI Dashboard To Track Employee Performance In Organization Background PDF
This slide covers KPI dashboard to track employee performance at workplace. It involves details such as productivity rate, labour effectiveness rate, absentee rate and turnover ratio. This KPI Dashboard To Track Employee Performance In Organization Background PDF from Slidegeeks makes it easy to present information on your topic with precision. It provides customization options, so you can make changes to the colors, design, graphics, or any other component to create a unique layout. It is also available for immediate download, so you can begin using it right away. Slidegeeks has done good research to ensure that you have everything you need to make your presentation stand out. Make a name out there for a brilliant performance.
Tracking Marketing Campaign Performance With Dashboard Analysis Information PDF
This slide provides glimpse about analyzing performance of different marketing campaigns. It includes parameters such as conversion rate percent, Return on Ad Spend ROAS, monthly website traffic in MM, etc. Do you have to make sure that everyone on your team knows about any specific topic I yes, then you should give Tracking Marketing Campaign Performance With Dashboard Analysis Information PDF a try. Our experts have put a lot of knowledge and effort into creating this impeccable Tracking Marketing Campaign Performance With Dashboard Analysis Information PDF. You can use this template for your upcoming presentations, as the slides are perfect to represent even the tiniest detail. You can download these templates from the Slidegeeks website and these are easy to edit. So grab these today.

KPI Dashboard To Track Brand Performance Ppt Ideas Pictures PDF
Mentioned slide showcases KPI dashboard that can be used to check the financial performance of a brand. Metrics covered in the dashboard are return on assets, working capital ratio, return on equity etc. Formulating a presentation can take up a lot of effort and time, so the content and message should always be the primary focus. The visuals of the PowerPoint can enhance the presenters message, so our KPI Dashboard To Track Brand Performance Ppt Ideas Pictures PDF was created to help save time. Instead of worrying about the design, the presenter can concentrate on the message while our designers work on creating the ideal templates for whatever situation is needed. Slidegeeks has experts for everything from amazing designs to valuable content, we have put everything into KPI Dashboard To Track Brand Performance Ppt Ideas Pictures PDF.

Major Reasons Of Employee Poor Performance Elements PDF
The following slide depicts the main causes of staff poor performance to formulate improvement strategies and assist decision making. It constitutes elements such as lack of skills, stressful work environment, inadequate training and development opportunities etc. Get a simple yet stunning designed Major Reasons Of Employee Poor Performance Elements PDF. It is the best one to establish the tone in your meetings. It is an excellent way to make your presentations highly effective. So, download this PPT today from Slidegeeks and see the positive impacts. Our easy to edit Major Reasons Of Employee Poor Performance Elements PDF can be your go to option for all upcoming conferences and meetings. So, what are you waiting for Grab this template today.

Evaluating Projected Vs Actual Sales Performance Ppt Ideas Template PDF
The following slide depicts the evaluation of existing sales performance to set future standards and determine opportunities for improvement. It mainly includes key performance indicators KPIs such as pipeline, forecast, attainment, gap etc. The Evaluating Projected Vs Actual Sales Performance Ppt Ideas Template PDF is a compilation of the most recent design trends as a series of slides. It is suitable for any subject or industry presentation, containing attractive visuals and photo spots for businesses to clearly express their messages. This template contains a variety of slides for the user to input data, such as structures to contrast two elements, bullet points, and slides for written information. Slidegeeks is prepared to create an impression.

KPI Dashboard To Measure Customer Service Performance Pictures PDF
This slide represents dashboard to measure customer service performance. It includes number of issues, average time to close, average response time etc. Whether you have daily or monthly meetings, a brilliant presentation is necessary. KPI Dashboard To Measure Customer Service Performance Pictures PDF can be your best option for delivering a presentation. Represent everything in detail using KPI Dashboard To Measure Customer Service Performance Pictures PDF and make yourself stand out in meetings. The template is versatile and follows a structure that will cater to your requirements. All the templates prepared by Slidegeeks are easy to download and edit. Our research experts have taken care of the corporate themes as well. So, give it a try and see the results.

KPI Dashboard To Track Amazon Performance Designs PDF
This slide provides information regarding dashboard to monitor Amazon performance. The KPIs include tracking of product sales, conversion rate, advertising spends, session, organic sales, etc. Do you have to make sure that everyone on your team knows about any specific topic I yes, then you should give KPI Dashboard To Track Amazon Performance Designs PDF a try. Our experts have put a lot of knowledge and effort into creating this impeccable KPI Dashboard To Track Amazon Performance Designs PDF. You can use this template for your upcoming presentations, as the slides are perfect to represent even the tiniest detail. You can download these templates from the Slidegeeks website and these are easy to edit. So grab these today

KPI Dashboard To Track Amazon Performance Template PDF
This slide provides information regarding dashboard to monitor Amazon performance. The KPIs include tracking of product sales, conversion rate, advertising spends, session, organic sales, etc. Do you have to make sure that everyone on your team knows about any specific topic I yes, then you should give KPI Dashboard To Track Amazon Performance Template PDF a try. Our experts have put a lot of knowledge and effort into creating this impeccable KPI Dashboard To Track Amazon Performance Template PDF. You can use this template for your upcoming presentations, as the slides are perfect to represent even the tiniest detail. You can download these templates from the Slidegeeks website and these are easy to edit. So grab these today

IT Performance Dashboard To Track Customer Satisfaction Themes PDF
This slide provides information regarding the dashboard to monitor overall IT performance. The dashboard tracks occupancy rate, net promoter score, avg. first contact resolution rate, etc. Are you searching for a IT Performance Dashboard To Track Customer Satisfaction Themes PDF that is uncluttered, straightforward, and original Its easy to edit, and you can change the colors to suit your personal or business branding. For a presentation that expresses how much effort you have put in, this template is ideal With all of its features, including tables, diagrams, statistics, and lists, its perfect for a business plan presentation. Make your ideas more appealing with these professional slides. Download IT Performance Dashboard To Track Customer Satisfaction Themes PDF from Slidegeeks today.

KPI Dashboard To Evaluate Sales Performance Template PDF
The following slide outlines key performance indicator KPI dashboard to monitor sales performance of company. The key metrics covered in slide are total sales by location, monthly sales trend, average revenue AR by clients, etc. Welcome to our selection of the KPI Dashboard To Evaluate Sales Performance Template PDF. These are designed to help you showcase your creativity and bring your sphere to life. Planning and Innovation are essential for any business that is just starting out. This collection contains the designs that you need for your everyday presentations. All of our PowerPoints are 100 percent editable, so you can customize them to suit your needs. This multi-purpose template can be used in various situations. Grab these presentation templates today
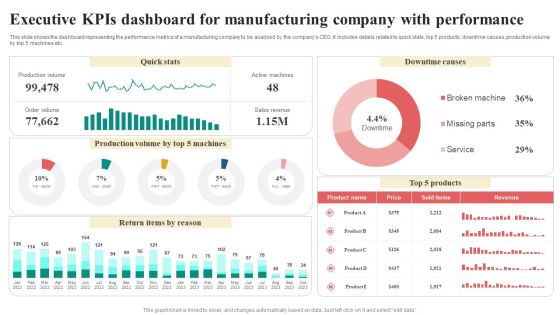
Executive Kpis Dashboard For Manufacturing Company With Performance Infographics PDF
This slide shows the dashboard representing the performance metrics of a manufacturing company to be analyzed by the companys CEO. It includes details related to quick stats, top 5 products, downtime causes, production volume by top 5 machines etc. Showcasing this set of slides titled Executive Kpis Dashboard For Manufacturing Company With Performance Infographics PDF. The topics addressed in these templates are Return Items By Reason, Quick Stats, Downtime Causes, Revenue. All the content presented in this PPT design is completely editable. Download it and make adjustments in color, background, font etc. as per your unique business setting.

Product Performance Dashboard Post Revenue Building Strategy Brochure PDF
Following slide outlines company product performance KPI dashboard post implementing revenue building strategy. The KPIs covered in the slide are revenue by different months, top five customers and products by revenue, MTD overview by different product lines etc. Showcasing this set of slides titled product performance dashboard post revenue building strategy brochure pdf. The topics addressed in these templates are revenue, target, profit margin. All the content presented in this PPT design is completely editable. Download it and make adjustments in color, background, font etc. as per your unique business setting.
Pharma Medical Dashboard To Analyze Sales Strategy Performance Icons PDF
The following slide delineates a comprehensive medical dashboard which can be used by the pharma company to measure its sales strategy performance. The KPIs covered in the slide are top sales producers, sales channels, volume by product, etc. Showcasing this set of slides titled Pharma Medical Dashboard To Analyze Sales Strategy Performance Icons PDF. The topics addressed in these templates are Market Leaders, Sales Channels, Volume Product. All the content presented in this PPT design is completely editable. Download it and make adjustments in color, background, font etc. as per your unique business setting.

Company Sales Employee Performance Measurement Dashboard Information PDF
This slide exhibits sales performance dashboard to analyze revenue and track business progress. It includes various indicators such as leads created, opportunities won, sales ratio and top revenue generating products. Showcasing this set of slides titled Company Sales Employee Performance Measurement Dashboard Information PDF. The topics addressed in these templates are Quick Ratio Target, Opportunities Won, Revenue Generating Products. All the content presented in this PPT design is completely editable. Download it and make adjustments in color, background, font etc. as per your unique business setting.
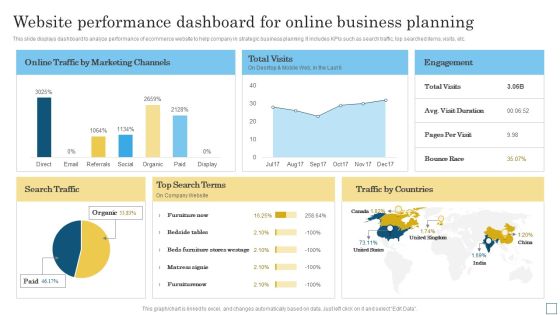
Website Performance Dashboard For Online Business Planning Graphics PDF
This slide displays dashboard to analyze performance of ecommerce website to help company in strategic business planning. It includes KPIs such as search traffic, top searched items, visits, etc. Showcasing this set of slides titled Website Performance Dashboard For Online Business Planning Graphics PDF. The topics addressed in these templates are Marketing Channels, Bounce Race, Search Traffic. All the content presented in this PPT design is completely editable. Download it and make adjustments in color, background, font etc. as per your unique business setting.
Inventory Control Techniques System Performance Tracking Dashboard Demonstration PDF
This slide represents dashboard showcasing supplier performance which helps in improving material control system processes. It provides information regarding supplier statistics, material compliance rate, top raw material suppliers, average material procurement cycle. Showcasing this set of slides titled Inventory Control Techniques System Performance Tracking Dashboard Demonstration PDF. The topics addressed in these templates are Supplier Statistics, Material Compliance Rate, Average Material Procurement. All the content presented in this PPT design is completely editable. Download it and make adjustments in color, background, font etc. as per your unique business setting.

Pet Supplies Company Fundraising Pitch Deck Financial Performance Download PDF
This slide shows information about financial performance or revenue generated by the company which can help investors to estimate companys potential earnings in coming years. Do you know about Slidesgeeks Pet Supplies Company Fundraising Pitch Deck Financial Performance Download PDF These are perfect for delivering any kind od presentation. Using it, create PowerPoint presentations that communicate your ideas and engage audiences. Save time and effort by using our pre designed presentation templates that are perfect for a wide range of topic. Our vast selection of designs covers a range of styles, from creative to business, and are all highly customizable and easy to edit. Download as a PowerPoint template or use them as Google Slides themes.

Company Yearly Sales Performance Scorecard With Cost Breakdown Elements PDF
This graph or chart is linked to excel, and changes automatically based on data. Just left click on it and select Edit Data. Deliver an awe inspiring pitch with this creative Company Yearly Sales Performance Scorecard With Cost Breakdown Elements PDF bundle. Topics like Sales Revenue, Incremental Sales, Cost Breakdown can be discussed with this completely editable template. It is available for immediate download depending on the needs and requirements of the user.
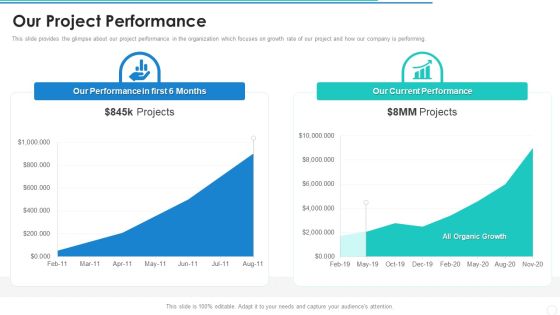
Our Project Performance Firm Pitch Deck Demonstration PDF
Make sure to capture your audiences attention in your business displays with our gratis customizable Our Project Performance Firm Pitch Deck Demonstration PDF. These are great for business strategies, office conferences, capital raising or task suggestions. If you desire to acquire more customers for your tech business and ensure they stay satisfied, create your own sales presentation with these plain slides.
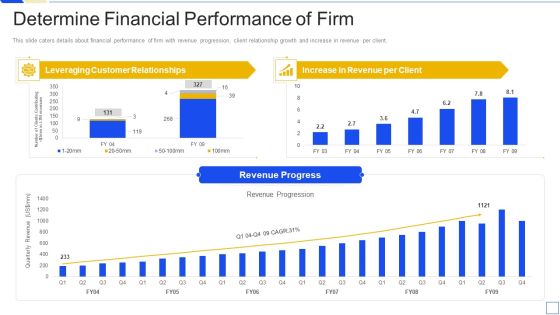
Service Marketing Fundraising Determine Financial Performance Of Firm Background PDF
Deliver and pitch your topic in the best possible manner with this service marketing fundraising determine financial performance of firm background pdf. Use them to share invaluable insights on leveraging customer relationships, increase in revenue and impress your audience. This template can be altered and modified as per your expectations. So, grab it now.
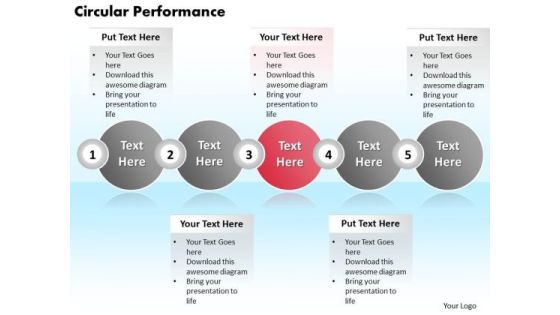
Ppt Circular Performance Of 5 Steps Involved Procedure PowerPoint Templates
PPT circular performance of 5 steps involved procedure PowerPoint Templates-Create visually stimulating Microsoft office PPT Presentations with our above Diagram. This image has been professionally designed to emphasize the concept of interrelated issues, Approaches or Methods. This Business Diagram can be used in Marketing, Banking, and Management etc. -PPT circular performance of 5 steps involved procedure PowerPoint Templates-Abstract, Art, Artistic, Backdrop, Background, Bend, Black, Business, Circle, Copy-Space, Create, Design, Dot, Dotted, Draw, Element, Flower, Gradient, Grid, Icon, Illustration, Leaf, Leaves, Logo, Mold, Motif, Nature, Pattern, Petal, Radiate, Retro, Round

Enhance Enterprise Application Performance Cost Of Replacing Applications Elements PDF
Deliver and pitch your topic in the best possible manner with this enhance enterprise application performance cost of replacing applications elements pdf. Use them to share invaluable insights on application purchase, maintenance cost, cost USD and impress your audience. This template can be altered and modified as per your expectations. So, grab it now.

Organization Financial Team Summary With Key Performance Indicators Clipart PDF
This slide represents a report prepared by the finance team showing the financial position of the organization with the help of key performance indicators. It demonstrates data related to current working capital, cash conversion cycle and vendor payment error rate of the company. Pitch your topic with ease and precision using this Organization Financial Team Summary With Key Performance Indicators Clipart PDF. This layout presents information on Current Working Capital, Cash Conversion Cycle. It is also available for immediate download and adjustment. So, changes can be made in the color, design, graphics or any other component to create a unique layout.

B2C Email Marketing Performance Benchmarks Analysis Topics PDF
The purpose of this slide is to outline e-mail marketing benchmarks metrics that are used to assess the success of an email campaign. Certain metrics include follow-up email, finance related, response rate, loyalty program etc. Pitch your topic with ease and precision using this B2C Email Marketing Performance Benchmarks Analysis Topics PDF. This layout presents information on Advertisement, Loyalty Program, Performance Benchmarks Analysis. It is also available for immediate download and adjustment. So, changes can be made in the color, design, graphics or any other component to create a unique layout.
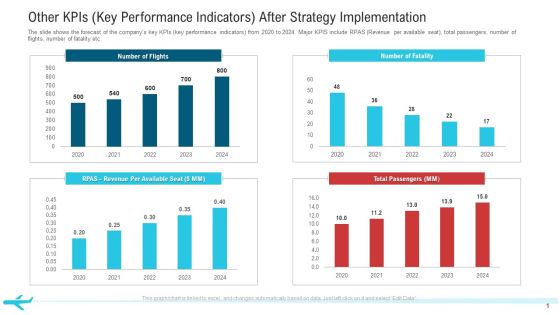
Other Kpis Key Performance Indicators After Strategy Implementation Professional PDF
The slide shows the forecast of the companys key KPIs key performance indicators from 2020 to 2024. Major KPIS include RPAS Revenue per available seat, total passengers, number of flights, number of fatality etc.Deliver and pitch your topic in the best possible manner with this other KPIs key performance indicators after strategy implementation professional pdf. Use them to share invaluable insights on total passengers, number of flights, 2020 to 2024 and impress your audience. This template can be altered and modified as per your expectations. So, grab it now.

Year Over Year Operations Performance Ppt Infographic Template Shapes PDF
Following slide compares operations performance of the company in financial years 2018 and 2019. It covers production volume, sales revenues, number of active manufacturing plant status and most common defects.Deliver and pitch your topic in the best possible manner with this year over year operations performance ppt infographic template shapes pdf. Use them to share invaluable insights on most common defects, most common defects, active manufacturing plants, production volume and impress your audience. This template can be altered and modified as per your expectations. So, grab it now.
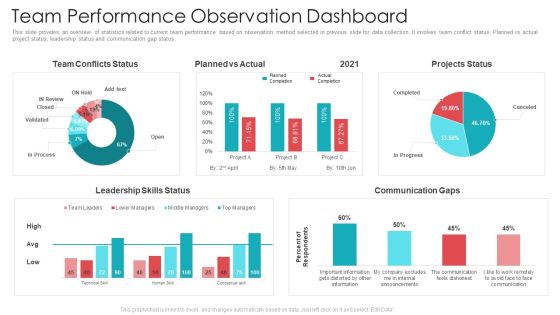
Official Team Collaboration Plan Team Performance Observation Dashboard Background PDF
This slide provides an overview of statistics related to current team performance based on observation method selected in previous slide for data collection. It involves team conflict status, Planned vs actual project status, leadership status and communication gap status. Deliver an awe-inspiring pitch with this creative official team collaboration plan team performance observation dashboard background pdf bundle. Topics like leadership skills status, team conflicts status, communication gaps can be discussed with this completely editable template. It is available for immediate download depending on the needs and requirements of the user.

Impact Of Manual Process On Business Performance Summary PDF
The following slide outlines the impact of current manual process on organization performance. The organization faces various issues such as reduction in productivity, bottom line and increase in error rate. Deliver and pitch your topic in the best possible manner with this Impact Of Manual Process On Business Performance Summary PDF. Use them to share invaluable insights on Decline In Profit, Reduction In Productivity, Increase In Errors and impress your audience. This template can be altered and modified as per your expectations. So, grab it now.
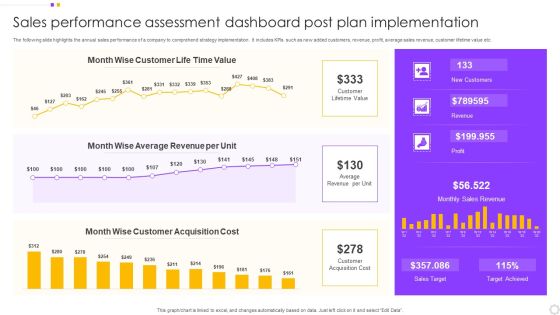
Sales Performance Assessment Dashboard Post Plan Implementation Introduction PDF
The following slide highlights the annual sales performance of a company to comprehend strategy implementation. It includes KPIs such as new added customers, revenue, profit, average sales revenue, customer lifetime value etc. Pitch your topic with ease and precision using this Sales Performance Assessment Dashboard Post Plan Implementation Introduction PDF. This layout presents information on Customer, Value, Average Revenue. It is also available for immediate download and adjustment. So, changes can be made in the color, design, graphics or any other component to create a unique layout.

Workforce Department Performance Graph Ppt Model Graphics Pictures PDF
This slide shows performance graph of HR department. Information covered in this slide is related to total hirings and turnover in the last four years. Pitch your topic with ease and precision using this Workforce Department Performance Graph Ppt Model Graphics Pictures PDF. This layout presents information on New Hiring, Continuous Increase, Employee Turnover, 2019 To 2022. It is also available for immediate download and adjustment. So, changes can be made in the color, design, graphics or any other component to create a unique layout.

Ecommerce Marketing Activities KPI Dashboard To Analyse Performance Guidelines PDF
This slide covers ecommerce marketing KPI dashboard to track performance. It involves details such as ecommerce revenue generated, number of new customers, repeat buying rate, attribute revenue and conversion rate and attributed revenue and conversion rate by marketing channel.Pitch your topic with ease and precision using this Ecommerce Marketing Activities KPI Dashboard To Analyse Performance Guidelines PDF. This layout presents information on Revenue Generated, Ecommerce Revenue, Generate Conversion. It is also available for immediate download and adjustment. So, changes can be made in the color, design, graphics or any other component to create a unique layout.
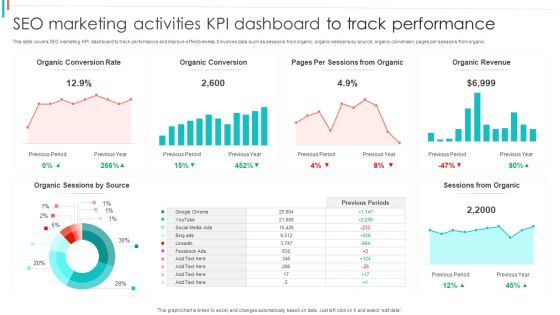
SEO Marketing Activities KPI Dashboard To Track Performance Brochure PDF
This slide covers SEO marketing KPI dashboard to track performance and improve effectiveness. It involves data such as sessions from organic, organic sessions by source, organic conversion, pages per sessions from organic.Pitch your topic with ease and precision using this SEO Marketing Activities KPI Dashboard To Track Performance Brochure PDF. This layout presents information on Organic Conversion, Sessions Organic, Organic Revenue. It is also available for immediate download and adjustment. So, changes can be made in the color, design, graphics or any other component to create a unique layout.

Financial Unsatisfactory Performance Dashboard With Accounting Ratios Diagrams PDF
This slide contains the information of the financial sector of the company to know where it stands and what needs to be done to improve the performance.It includes multiple ratios ROA, ROE, working capital ration and debt-equity ratio. Pitch your topic with ease and precision using this Financial Unsatisfactory Performance Dashboard With Accounting Ratios Diagrams PDF. This layout presents information on Return Assets, Working Capital, Return Equity. It is also available for immediate download and adjustment. So, changes can be made in the color, design, graphics or any other component to create a unique layout.

Quarterly Financial Performance Kpis With Balance Sheet Designs PDF
The given slide highlights the quarterly financial performance of a company. It also includes KPIs such as ROA, working capital ratio, return on equity, debt equity ratio etc. Pitch your topic with ease and precision using this Quarterly Financial Performance Kpis With Balance Sheet Designs PDF. This layout presents information on Total Liabilities, Return On Equity, Working Capital Ratio. It is also available for immediate download and adjustment. So, changes can be made in the color, design, graphics or any other component to create a unique layout.

Quarterly Overall Business Performance Assessment With Kpi Dashboard Microsoft PDF
The given below slide showcases the overall business performance to evaluate the trends and KPAs. It includes quarterly insights of elements such as revenue, new customers, net profit, customer satisfaction, sales profitability, growth etc. Pitch your topic with ease and precision using this Quarterly Overall Business Performance Assessment With Kpi Dashboard Microsoft PDF. This layout presents information on Revenue, Customer Satisfaction, Net Profit. It is also available for immediate download and adjustment. So, changes can be made in the color, design, graphics or any other component to create a unique layout.
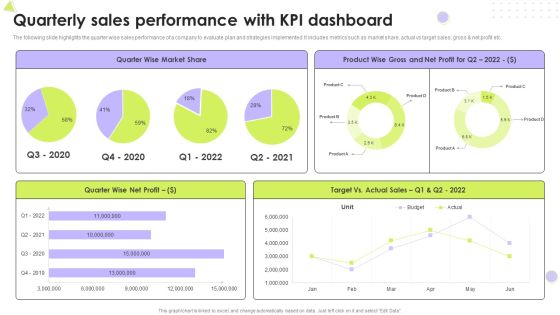
Quarterly Sales Performance With Kpi Dashboard Introduction PDF
The following slide highlights the quarter wise sales performance of a company to evaluate plan and strategies implemented. It includes metrics such as market share, actual vs target sales, gross and net profit etc. Pitch your topic with ease and precision using this Quarterly Sales Performance With Kpi Dashboard Introduction PDF. This layout presents information on Market Share, Net Profit, Target. It is also available for immediate download and adjustment. So, changes can be made in the color, design, graphics or any other component to create a unique layout.

Support Team New Employee Members Performance Dashboard Designs PDF
This slide shows the dashboard representing the performance evaluation of the new staff members of the support team staff. It shoes details related to occupancy rate, net promoter score, average first contact resolution rate etc. Pitch your topic with ease and precision using this Support Team New Employee Members Performance Dashboard Designs PDF. This layout presents information on Target Range, Occupancy Rate, Contact Resolution Rate. It is also available for immediate download and adjustment. So, changes can be made in the color, design, graphics or any other component to create a unique layout.

Social Network Promotion Campaign Performance Report Demonstration PDF
The purpose of this slide is to highlight the digital marketing campaigning performance report to track information in real-time like new leads acquired, total leads, and revenue on monthly basis. The leads generated through various platforms are Twitter, Facebook, LinkedIn, etc. Pitch your topic with ease and precision using this Social Network Promotion Campaign Performance Report Demonstration PDF. This layout presents information on Sales Ready Leads, New Leads, New Revenue. It is also available for immediate download and adjustment. So, changes can be made in the color, design, graphics or any other component to create a unique layout.

Dashboard For Web Application Firewall Performance WAF Platform Diagrams PDF
This slide describes the dashboard for web application firewall performance monitoring by covering details of application attack distribution, HTTP transaction per second, application security events source map, DDOs protected traffic, and application security events. Deliver an awe inspiring pitch with this creative Dashboard For Web Application Firewall Performance WAF Platform Diagrams PDF bundle. Topics like Application Attack Distribution, Application Security Events, Transactions Per Second can be discussed with this completely editable template. It is available for immediate download depending on the needs and requirements of the user.
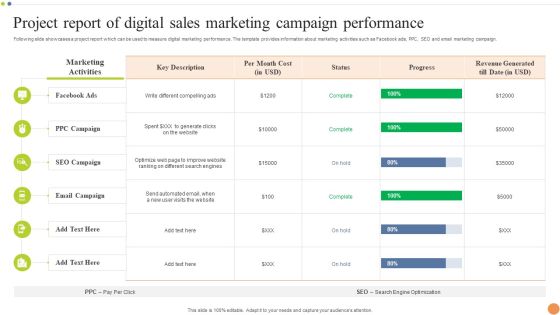
Project Report Of Digital Sales Marketing Campaign Performance Professional PDF
Following slide showcases a project report which can be used to measure digital marketing performance. The template provides information about marketing activities such as Facebook ads, PPC, SEO and email marketing campaign. Pitch your topic with ease and precision using this Project Report Of Digital Sales Marketing Campaign Performance Professional PDF. This layout presents information on Email Campaign, SEO Campaign, Marketing Activities. It is also available for immediate download and adjustment. So, changes can be made in the color, design, graphics or any other component to create a unique layout.
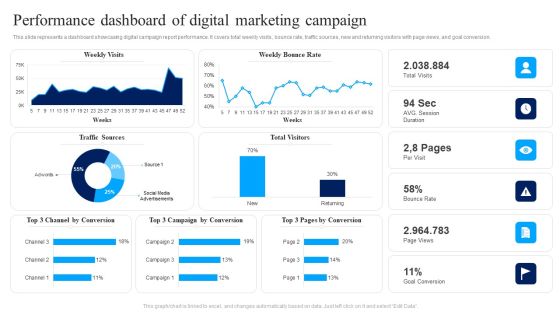
Performance Dashboard Of Digital Marketing Campaign Ppt Show Slide PDF
This slide represents a dashboard showcasing digital campaign report performance. It covers total weekly visits, bounce rate, traffic sources, new and returning visitors with page views, and goal conversion. Pitch your topic with ease and precision using this Performance Dashboard Of Digital Marketing Campaign Ppt Show Slide PDF. This layout presents information on Weekly Visits, Weekly Bounce Rate, Bounce Rate. It is also available for immediate download and adjustment. So, changes can be made in the color, design, graphics or any other component to create a unique layout.

Engineering Performance Metrics Dashboard To Track Pull Requests Background PDF
This slide covers engineering KPI dashboard to track pull request. It involves KPIs such as open time of average pull requests, average comment received, revision rounds, frequency of posting pull requests. Pitch your topic with ease and precision using this Engineering Performance Metrics Dashboard To Track Pull Requests Background PDF. This layout presents information on Dashboard Track Pull Requests, Engineering Performance Metrics. It is also available for immediate download and adjustment. So, changes can be made in the color, design, graphics or any other component to create a unique layout.
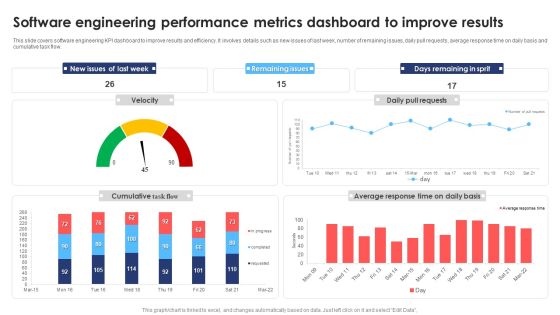
Software Engineering Performance Metrics Dashboard To Improve Results Infographics PDF
This slide covers software engineering KPI dashboard to improve results and efficiency. It involves details such as new issues of last week, number of remaining issues, daily pull requests, average response time on daily basis and cumulative task flow. Pitch your topic with ease and precision using this Software Engineering Performance Metrics Dashboard To Improve Results Infographics PDF. This layout presents information on Software Engineering Performance, Metrics Dashboard Improve Results. It is also available for immediate download and adjustment. So, changes can be made in the color, design, graphics or any other component to create a unique layout.

Monthly KPI Work Performance Monitoring By Category Microsoft PDF
This slide shows the monthly key performance indicators report on various categories with a line chart . the categories includes financial, customer success , new business activities, HR and other metrics. Pitch your topic with ease and precision using this Monthly KPI Work Performance Monitoring By Category Microsoft PDF. This layout presents information on Metrics, Financial, Customer Success. It is also available for immediate download and adjustment. So, changes can be made in the color, design, graphics or any other component to create a unique layout.
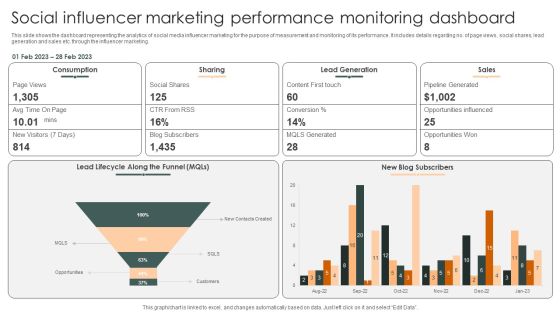
Social Influencer Marketing Performance Monitoring Dashboard Slides PDF
This slide shows the dashboard representing the analytics of social media influencer marketing for the purpose of measurement and monitoring of its performance. It includes details regarding no. of page views, social shares, lead generation and sales etc. through the influencer marketing.Pitch your topic with ease and precision using this Social Influencer Marketing Performance Monitoring Dashboard Slides PDF. This layout presents information on Lead Generation, Pipeline Generated, Opportunities Influenced. It is also available for immediate download and adjustment. So, changes can be made in the color, design, graphics or any other component to create a unique layout.

Support Center Report On Customer Executive Performance Evaluation Background PDF
This slide signifies the call center KPI dashboard on customer support executive performance. It includes daily and weekly volume, CSAT score, pie chart on service level agreement. Pitch your topic with ease and precision using this Support Center Report On Customer Executive Performance Evaluation Background PDF. This layout presents information on Weekly Call Volume, Response Time, Service Level Agreement. It is also available for immediate download and adjustment. So, changes can be made in the color, design, graphics or any other component to create a unique layout.
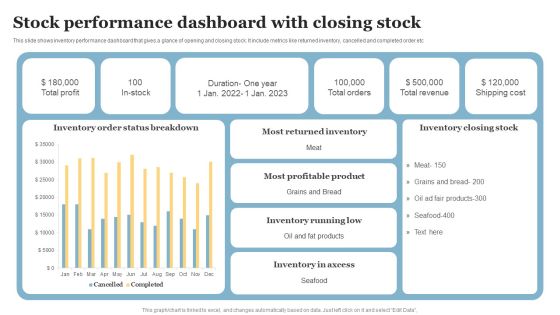
Stock Performance Dashboard With Closing Stock Diagrams PDF
This slide shows inventory performance dashboard that gives a glance of opening and closing stock. It include metrics like returned inventory, cancelled and completed order etc. Pitch your topic with ease and precision using this Stock Performance Dashboard With Closing Stock Diagrams PDF. This layout presents information on Most Returned Inventory, Most Profitable Product, Inventory Running Low. It is also available for immediate download and adjustment. So, changes can be made in the color, design, graphics or any other component to create a unique layout.
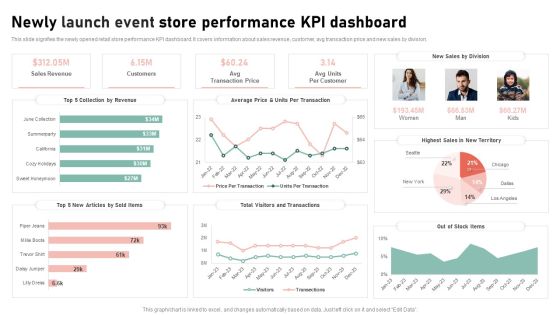
Newly Launch Event Store Performance Kpi Dashboard Elements Sample PDF
This slide signifies the newly opened retail store performance KPI dashboard. It covers information about sales revenue, customer, avg transaction price and new sales by division. Pitch your topic with ease and precision using this Newly Launch Event Store Performance Kpi Dashboard Elements Sample PDF. This layout presents information on Collection By Revenue, Articles By Sold Items, Visitors And Transactions. It is also available for immediate download and adjustment. So, changes can be made in the color, design, graphics or any other component to create a unique layout.

Branch Performance Evaluation Dashboard With Profit And Revenue Diagrams PDF
The slides showcases tips for enhancing branchs workforce performance and efficiency. It covers utilize transaction analysis data, schedule idle time, incent staff for efficiency, get bottom support and use part-time staff.Persuade your audience using this Best Practices To Improve Branch Workforce Performance Evaluation And Efficiency Introduction PDF. This PPT design covers five stages, thus making it a great tool to use. It also caters to a variety of topics including Market Opportunities, Customer Branch, Unnecessary Labor. Download this PPT design now to present a convincing pitch that not only emphasizes the topic but also showcases your presentation skills.

Online Website Performance Analysis For Business Planning Slides PDF
This slide displays statistics to analyze performance of ecommerce business to plan appropriate growth strategies for the company. It includes KPIs such as total sales, orders, customers, refunded amount, etc. Pitch your topic with ease and precision using this Online Website Performance Analysis For Business Planning Slides PDF. This layout presents information on Revenue, Customer Rate, Target. It is also available for immediate download and adjustment. So, changes can be made in the color, design, graphics or any other component to create a unique layout.
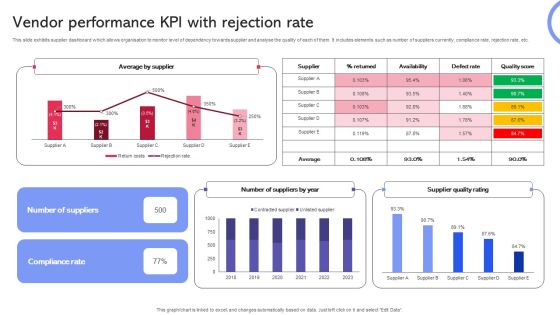
Vendor Performance KPI With Rejection Rate Inspiration PDF
This slide exhibits supplier dashboard which allows organisation to monitor level of dependency towards supplier and analyse the quality of each of them. It includes elements such as number of suppliers currently, compliance rate, rejection rate, etc. Pitch your topic with ease and precision using this Vendor Performance KPI With Rejection Rate Inspiration PDF. This layout presents information on Vendor Performance KPI, Rejection Rate. It is also available for immediate download and adjustment. So, changes can be made in the color, design, graphics or any other component to create a unique layout.

E Mail Marketing Performance Goals Achieved Survey Analysis Sample PDF
The purpose of this slide is to illustrate the survey outcomes in order to measure the effectiveness of e-mail campaigns. Certain metrics include an increase in ROI, conversions, list growth, etc. Pitch your topic with ease and precision using this E Mail Marketing Performance Goals Achieved Survey Analysis Sample PDF. This layout presents information on E Mail Marketing Performance, Goals Achieved Survey Analysis. It is also available for immediate download and adjustment. So, changes can be made in the color, design, graphics or any other component to create a unique layout.
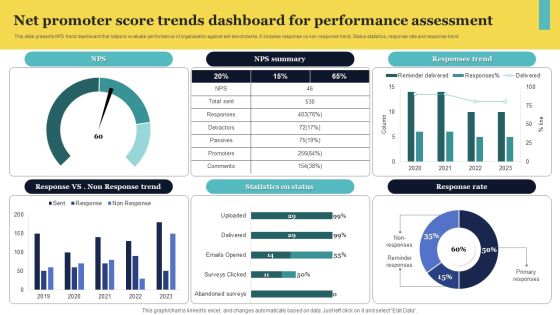
Net Promoter Score Trends Dashboard For Performance Assessment Elements PDF
This slide presents NPS trend dashboard that helps to evaluate performance of organisation against set benchmarks. It includes response vs non-response trend, Status statistics, response rate and response trend Pitch your topic with ease and precision using this Net Promoter Score Trends Dashboard For Performance Assessment Elements PDF. This layout presents information on Response Trend, Summary, Status. It is also available for immediate download and adjustment. So, changes can be made in the color, design, graphics or any other component to create a unique layout.

KPI Dashboard Highlighting Off Page Seo Performance Rules PDF
The purpose of this template is to outline KPI reporting dashboard showing results of off page SEO. The dashboard covers key metrics such as website ranking on search engine, traffic, sessions, backlinks and site audit. Showcasing this set of slides titled kpi dashboard highlighting off page seo performance rules pdf. The topics addressed in these templates are kpi dashboard highlighting off page seo performance. All the content presented in this PPT design is completely editable. Download it and make adjustments in color, background, font etc. as per your unique business setting.
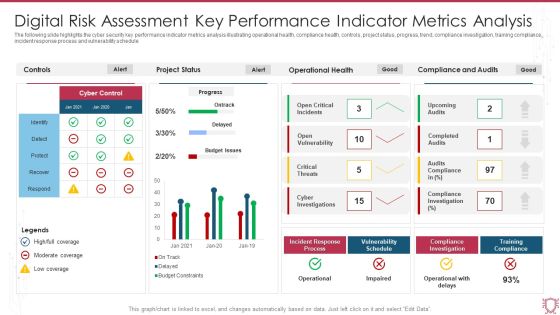
Digital Risk Assessment Key Performance Indicator Metrics Analysis Infographics PDF
The following slide highlights the cyber security key performance indicator metrics analysis illustrating operational health, compliance health, controls, project status, progress, trend, compliance investigation, training compliance, incident response process and vulnerability schedule. Showcasing this set of slides titled Digital Risk Assessment Key Performance Indicator Metrics Analysis Infographics PDF. The topics addressed in these templates are Project Status, Operational Health, Compliance And Audits. All the content presented in this PPT design is completely editable. Download it and make adjustments in color, background, font etc. as per your unique business setting.

Four Year Company Sales Unsatisfactory Performance Demonstration PDF
This slide covers the data on the performance of sales department of the company to have a clear idea about the revenues. It shows decrease in the number of sales in the last 4 years 2020 to 2023 which leads in degrading companys reputation and loss of stakeholders.Showcasing this set of slides titled Four Year Company Sales Unsatisfactory Performance Demonstration PDF. The topics addressed in these templates are Declining Sales, Restrictions, Insights. All the content presented in this PPT design is completely editable. Download it and make adjustments in color, background, font etc. as per your unique business setting.
Education Metrics Tracker For Students Performance Evaluation Professional PDF
This slide covers student performance analysis dashboard. It include metrics student count, student attendance, average subject score, branch examination results, student count by grade, etc. Showcasing this set of slides titled Education Metrics Tracker For Students Performance Evaluation Professional PDF. The topics addressed in these templates are Students Count, Grade And Gender, Students Details, Examination Results Branch. All the content presented in this PPT design is completely editable. Download it and make adjustments in color, background, font etc. as per your unique business setting.

Strategic Financial Performance Review And Evaluation Ppt Layouts Styles PDF
This slide shows financial performance assessment to identify potential problems or opportunities to achieve organizational goals. It includes various elements such as quick ratio, cash balance, days sales and payable outstanding. Showcasing this set of slides titled Strategic Financial Performance Review And Evaluation Ppt Layouts Styles PDF. The topics addressed in these templates are Cash Balance, Quick Ratio, Current Ratio. All the content presented in this PPT design is completely editable. Download it and make adjustments in color, background, font etc. as per your unique business setting.
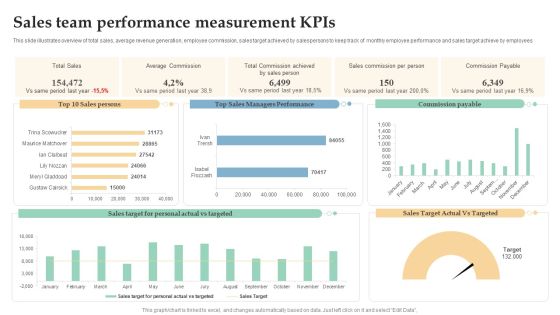
Sales Team Performance Measurement Kpis Ppt Professional Templates PDF
This slide illustrates overview of total sales, average revenue generation, employee commission, sales target achieved by salespersons to keep track of monthly employee performance and sales target achieve by employees. Showcasing this set of slides titled Sales Team Performance Measurement Kpis Ppt Professional Templates PDF. The topics addressed in these templates are Total Sales, Average Commission, Sales Commission, Per Person. All the content presented in this PPT design is completely editable. Download it and make adjustments in color, background, font etc. as per your unique business setting.

Sales Performance Dashboard After Visualization Research Implementation Introduction PDF
This slide depicts the dashboard for sales performance after the implementation of visualization research based on revenue, quantity, regional sales. Welcome to our selection of the Sales Performance Dashboard After Visualization Research Implementation Introduction PDF. These are designed to help you showcase your creativity and bring your sphere to life. Planning and Innovation are essential for any business that is just starting out. This collection contains the designs that you need for your everyday presentations. All of our PowerPoints are 100 percent editable, so you can customize them to suit your needs. This multi purpose template can be used in various situations. Grab these presentation templates today.

Brand Equity Performance Assessment Dashboard Brand Administration Template PDF
This slide provides information regarding brand equity performance assessment dashboard that highlights customer lifecycle value, customer adoption rate, mentions, engagement, etc. This modern and well-arranged Brand Equity Performance Assessment Dashboard Brand Administration Template PDF provides lots of creative possibilities. It is very simple to customize and edit with the Powerpoint Software. Just drag and drop your pictures into the shapes. All facets of this template can be edited with Powerpoint no extra software is necessary. Add your own material, put your images in the places assigned for them, adjust the colors, and then you can show your slides to the world, with an animated slide included.

Dashboard Showing Emarketing Performance Digital Marketing Strategy Deployment Demonstration PDF
This slide focuses on the dashboard that shows the e-marketing performance such ad lead funnel, traffic sources, monthly leads and key metrics.Want to ace your presentation in front of a live audience Our Dashboard Showing Emarketing Performance Digital Marketing Strategy Deployment Demonstration PDF can help you do that by engaging all the users towards you.. Slidegeeks experts have put their efforts and expertise into creating these impeccable powerpoint presentations so that you can communicate your ideas clearly. Moreover, all the templates are customizable, and easy-to-edit and downloadable. Use these for both personal and commercial use.

Business Analytics Application Workforce Performance Analysis KPI Dashboard Template PDF
This slide represents the dashboard representing key metrics to analyze the performance of overall workforce. It includes details related to absence rate, benefits satisfaction, engagement index etc. Take your projects to the next level with our ultimate collection of Business Analytics Application Workforce Performance Analysis KPI Dashboard Template PDF. Slidegeeks has designed a range of layouts that are perfect for representing task or activity duration, keeping track of all your deadlines at a glance. Tailor these designs to your exact needs and give them a truly corporate look with your own brand colors theyll make your projects stand out from the rest.

Business Referral Marketing Program Performance Metrics Dashboard Introduction PDF
This slide shows KPI dashboard to effectively track performance of business referral program in order to attract more leads and potential customers to the busines. It includes details related to key metrics such as referral participation rate, referred customers, referral conversion rate and total revenue generated. Showcasing this set of slides titled Business Referral Marketing Program Performance Metrics Dashboard Introduction PDF. The topics addressed in these templates are Referral Participation Rate, Referred Customers, Referral Conversion Rate, Total Revenue Generated. All the content presented in this PPT design is completely editable. Download it and make adjustments in color, background, font etc. as per your unique business setting.
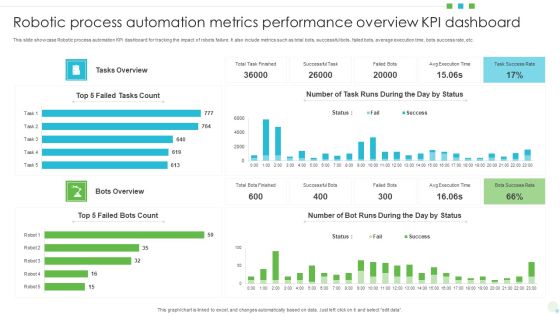
Robotic Process Automation Metrics Performance Overview KPI Dashboard Download PDF
This slide showcase Robotic process automation KPI dashboard for tracking the impact of robots failure. It also include metrics such as total bots, successful bots, failed bots, average execution time, bots success rate, etc. Showcasing this set of slides titled Robotic Process Automation Metrics Performance Overview KPI Dashboard Download PDF. The topics addressed in these templates are Robotic Process Automation, Metrics Performance Overview, Kpi Dashboard. All the content presented in this PPT design is completely editable. Download it and make adjustments in color, background, font etc. as per your unique business setting.

Support Center Report On Customer Support Executive Performance Sample PDF
This slide signifies the pie chart on performance of customer support executive in call centre. It includes the name of various employee and the strategies they implemented for there achievement. Showcasing this set of slides titled Support Center Report On Customer Support Executive Performance Sample PDF. The topics addressed in these templates are Use Of Personalise Telecalling, Provide Good Customer Service, Provide Offers And Discounts. All the content presented in this PPT design is completely editable. Download it and make adjustments in color, background, font etc. as per your unique business setting.

Social Media Marketing Performance Analysis Ppt Inspiration Smartart PDF
This slide covers performance analysis of product marketing through a dashboard. It includes elements such as count of social media followers, user engagement analytics, favourite tweets and retweets, Instagram overview, LinkedIn key metrics, etc. Showcasing this set of slides titled Social Media Marketing Performance Analysis Ppt Inspiration Smartart PDF. The topics addressed in these templates are Social Media Followers, Favourite Tweets, Favourite Retweets, Instagram Overview. All the content presented in this PPT design is completely editable. Download it and make adjustments in color, background, font etc. as per your unique business setting.
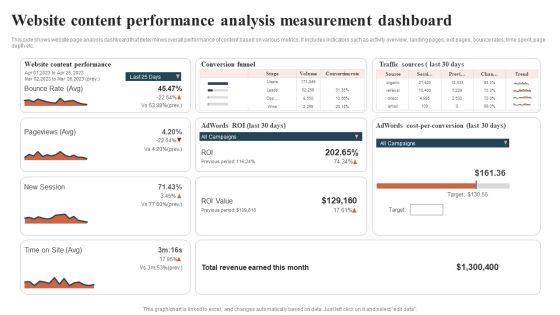
Website Content Performance Analysis Measurement Dashboard Guidelines PDF
This side shows website page analysis dashboard that determines overall performance of content based on various metrics. It includes indicators such as activity overview, landing pages, exit pages, bounce rates, time spent, page depth etc. Showcasing this set of slides titled Website Content Performance Analysis Measurement Dashboard Guidelines PDF. The topics addressed in these templates are Conversion Funnel, Traffic Sources, Total Revenue. All the content presented in this PPT design is completely editable. Download it and make adjustments in color, background, font etc. as per your unique business setting.
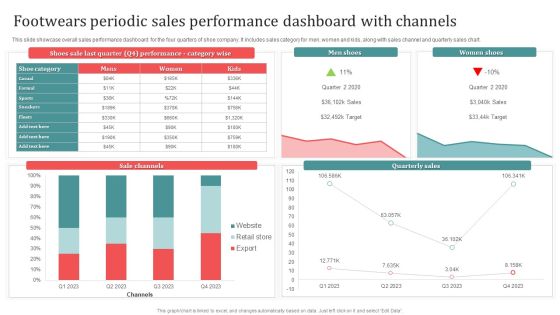
Footwears Periodic Sales Performance Dashboard With Channels Download PDF
This slide showcase overall sales performance dashboard for the four quarters of shoe company. It includes sales category for men, women and kids, along with sales channel and quarterly sales chart. Showcasing this set of slides titled Footwears Periodic Sales Performance Dashboard With Channels Download PDF. The topics addressed in these templates are Men Shoes, Women Shoes, Sale Channels. All the content presented in this PPT design is completely editable. Download it and make adjustments in color, background, font etc. as per your unique business setting.

Product Periodic Sale And Profit Performance Report Topics PDF
The mentioned slide presents the performance report of number of watches sold and revenue generated quarterly over the course of past 2 years. It showcases the sales and the profit earned quarterly. Showcasing this set of slides titled Product Periodic Sale And Profit Performance Report Topics PDF. The topics addressed in these templates are Product Category, Sub Category, Product . All the content presented in this PPT design is completely editable. Download it and make adjustments in color, background, font etc. as per your unique business setting.
Overall Marketing Dashboard Showcasing Market Performance Icons PDF
This slide showcases mass marketing dashboard which helps marketers in assessing there business performance. It provides information regarding net promoter score, inbound leads, sales per platform etc. Showcasing this set of slides titled Overall Marketing Dashboard Showcasing Market Performance Icons PDF. The topics addressed in these templates are Standard Customers, Market Share Growth Rate, Customer Locations . All the content presented in this PPT design is completely editable. Download it and make adjustments in color, background, font etc. as per your unique business setting.
Tracking Performance Of Team Building Activities Sample PDF
The following slide highlights significance of team bonding activities for skill planning, employee motivation and collaboration. It includes activities such as icebreaker games, simulated problems, blind drawing, show and tell, vacation etc. Showcasing this set of slides titled Tracking Performance Of Team Building Activities Sample PDF. The topics addressed in these templates are Tracking Performance, Team Building Activities. All the content presented in this PPT design is completely editable. Download it and make adjustments in color, background, font etc. as per your unique business setting.

KPI Dashboard To Measure Annual Marketing Plan Performance Microsoft PDF
The purpose of this slide is to illustrate performance KPI dashboard which can be used to evaluate the effectiveness of yearly marketing plan. The kpis are website visitors, lifetime value of a customer LTV, lead conversion rate, etc. Showcasing this set of slides titled KPI Dashboard To Measure Annual Marketing Plan Performance Microsoft PDF. The topics addressed in these templates are Website Visitors, Lifetime Value Customer, Bounce Dormancy Rate. All the content presented in this PPT design is completely editable. Download it and make adjustments in color, background, font etc. as per your unique business setting.

Expansion Strategic Plan Joint Venture Performance Of Organizations Mockup PDF
This slide showcases performance of organization after expanding business globally through joint venture. It can help business to evaluate the success rate of global expansion through joint venture. If your project calls for a presentation, then Slidegeeks is your go-to partner because we have professionally designed, easy-to-edit templates that are perfect for any presentation. After downloading, you can easily edit Expansion Strategic Plan Joint Venture Performance Of Organizations Mockup PDF and make the changes accordingly. You can rearrange slides or fill them with different images. Check out all the handy templates.
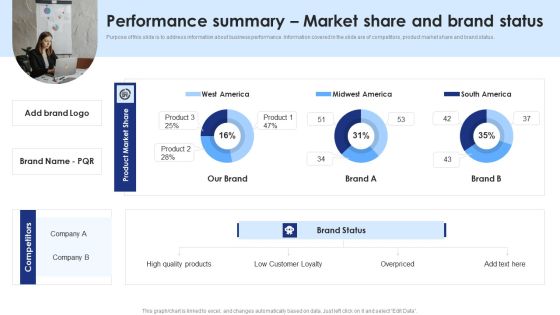
Performance Summary Market Share And Brand Status Themes PDF
Purpose of this slide is to address information about business performance. Information covered in the slide are of competitors, product market share and brand status. Find a pre designed and impeccable Performance Summary Market Share And Brand Status Themes PDF. The templates can ace your presentation without additional effort. You can download these easy to edit presentation templates to make your presentation stand out from others. So, what are you waiting for Download the template from Slidegeeks today and give a unique touch to your presentation.

360 Degree Employee Performance Evaluation Dashboard Portrait PDF
The following slide showcases the summary of 360 degree performance assessment method to analyze employee productivity and engagement rate. It includes reviews based on self, subordinate, peer, customer feedback along with project based rating etc. Find a pre designed and impeccable 360 Degree Employee Performance Evaluation Dashboard Portrait PDF. The templates can ace your presentation without additional effort. You can download these easy to edit presentation templates to make your presentation stand out from others. So, what are you waiting for Download the template from Slidegeeks today and give a unique touch to your presentation.

Historical Performance Analysis Of Bitcoin Blockchain Technology Inspiration PDF
The Slide shows the yearly price average price of bitcoin blockchain from 2009 to 2021. The slides coves the price of 1000 bitcoins in 2009 and afterwards the price of 1 Bitcoin per year from 2010 to 2021. Showcasing this set of slides titled Historical Performance Analysis Of Bitcoin Blockchain Technology Inspiration PDF. The topics addressed in these templates are Historical Performance Analysis, Bitcoin Blockchain Technology. All the content presented in this PPT design is completely editable. Download it and make adjustments in color, background, font etc. as per your unique business setting.
Sales Performance Dashboard With Average Lead Tracking Time Background PDF
This slide showcases dashboard for sales performance that can help organization to analyze the effectiveness of sales campaigns and average response time of lead. Its key components are average contract value, average sales cycle length, follow up contract rate and sales activity. Showcasing this set of slides titled Sales Performance Dashboard With Average Lead Tracking Time Background PDF. The topics addressed in these templates are Avg Contract Value, Sales Activity, Contract Rate. All the content presented in this PPT design is completely editable. Download it and make adjustments in color, background, font etc. as per your unique business setting.

Dashboard To Track Autonomous Mobile Robot Performance Infographics PDF
This slide represents the dashboard to track the AMRs performance in the warehouse. It covers various AMRs status reports, energy consumption, battery level, total working hours, and time to return. Take your projects to the next level with our ultimate collection of Dashboard To Track Autonomous Mobile Robot Performance Infographics PDF. Slidegeeks has designed a range of layouts that are perfect for representing task or activity duration, keeping track of all your deadlines at a glance. Tailor these designs to your exact needs and give them a truly corporate look with your own brand colors they will make your projects stand out from the rest.

Media Advertising Social Media Channel Performance Dashboard Pictures PDF
This slide depicts the key metrics used to track the performance of social media channels in form of increase in followers, clicks and likes. This modern and well-arranged Media Advertising Social Media Channel Performance Dashboard Pictures PDF provides lots of creative possibilities. It is very simple to customize and edit with the Powerpoint Software. Just drag and drop your pictures into the shapes. All facets of this template can be edited with Powerpoint, no extra software is necessary. Add your own material, put your images in the places assigned for them, adjust the colors, and then you can show your slides to the world, with an animated slide included.

Kpi Dashboard To Analyze Buzz Marketing Campaigns Performance Download PDF
This slide showcases the parameters that would help the business organization to evaluate buzz marketing performance. It includes user metrics, campaign metrics, social metrics, engagement rate, viral sign-ups, etc. Take your projects to the next level with our ultimate collection of Kpi Dashboard To Analyze Buzz Marketing Campaigns Performance Download PDF. Slidegeeks has designed a range of layouts that are perfect for representing task or activity duration, keeping track of all your deadlines at a glance. Tailor these designs to your exact needs and give them a truly corporate look with your own brand colors they will make your projects stand out from the rest.

Dashboard Depicting Performance Metrics Of Customer Service Template PDF
This slide showcases dashboard depicting major customer service KPIs. The performance metrics covered are search exit rate, CSAT, average first response time, tickets solved, etc. Take your projects to the next level with our ultimate collection of Dashboard Depicting Performance Metrics Of Customer Service Template PDF. Slidegeeks has designed a range of layouts that are perfect for representing task or activity duration, keeping track of all your deadlines at a glance. Tailor these designs to your exact needs and give them a truly corporate look with your own brand colors they will make your projects stand out from the rest.
Youtube Advertising Campaign Performance Tracking Report Structure PDF
This slide represents the dashboard to track and monitor the performance and effectiveness of enterprises YouTube advertising campaign. It includes details related to KPIs such as impressions, views etc. Find a pre designed and impeccable Youtube Advertising Campaign Performance Tracking Report Structure PDF. The templates can ace your presentation without additional effort. You can download these easy to edit presentation templates to make your presentation stand out from others. So, what are you waiting for Download the template from Slidegeeks today and give a unique touch to your presentation.
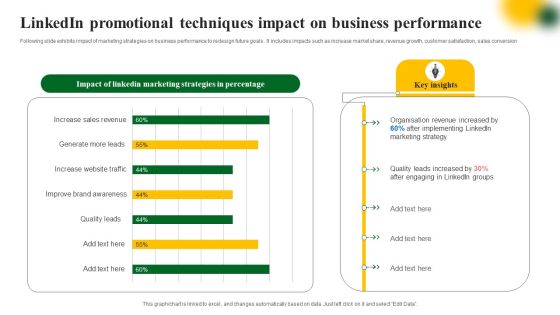
Linkedin Promotional Techniques Impact On Business Performance Slides PDF
Following slide exhibits impact of marketing strategies on business performance to redesign future goals . It includes impacts such as increase market share, revenue growth, customer satisfaction, sales conversion. Showcasing this set of slides titled Linkedin Promotional Techniques Impact On Business Performance Slides PDF. The topics addressed in these templates are Marketing Strategy, Implementing Linkedin, Organisation Revenue. All the content presented in this PPT design is completely editable. Download it and make adjustments in color, background, font etc. as per your unique business setting.

Data On Performance Based Incentive Remuneration Template PDF
This slide showcases statistical data on performance based incentive compensation. It also includes bonuses such as hiring , referral , individual incentive bonuses , retention bonuses , company wide bonuses , etc. Showcasing this set of slides titled Data On Performance Based Incentive Remuneration Template PDF. The topics addressed in these templates are Percent, Compensation Models, Implement Individual. All the content presented in this PPT design is completely editable. Download it and make adjustments in color, background, font etc. as per your unique business setting.
