Input Output Diagram
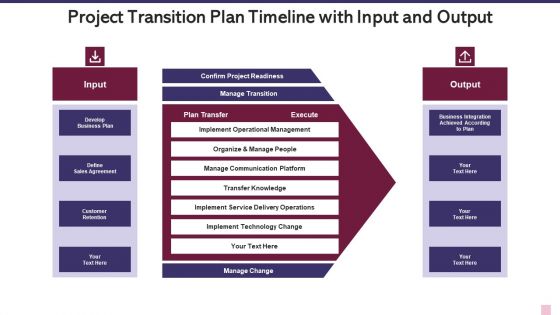
Project Transition Plan Timeline With Input And Output Diagrams PDF
Pitch your topic with ease and precision using this project transition plan timeline with input and output diagrams pdf. This layout presents information on management, implement, organize. It is also available for immediate download and adjustment. So, changes can be made in the color, design, graphics or any other component to create a unique layout.
Input Output Flow Diagram With Spiral Shape Ppt PowerPoint Presentation Icon Background Images PDF
Presenting this set of slides with name input output flow diagram with spiral shape ppt powerpoint presentation icon background images pdf. This is a four stage process. The stages in this process are start new business line, achieve sales growth in us territory by dec, 2019 to 2022. This is a completely editable PowerPoint presentation and is available for immediate download. Download now and impress your audience.
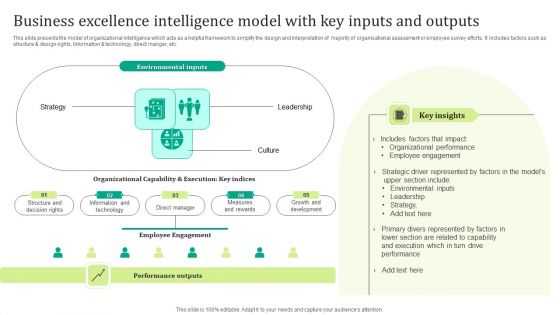
Business Excellence Intelligence Model With Key Inputs And Outputs Diagrams PDF
This slide presents the model of organizational intelligence which acts as a helpful framework to simplify the design and interpretation of majority of organisational assessment or employee survey efforts. It includes factors such as structure and design rights, Information and technology, direct manger, etc. Showcasing this set of slides titled Business Excellence Intelligence Model With Key Inputs And Outputs Diagrams PDF. The topics addressed in these templates are Environmental Inputs, Employee Engagement, Performance Outputs. All the content presented in this PPT design is completely editable. Download it and make adjustments in color, background, font etc. as per your unique business setting.

Business Diagram Arrows Of Input And Output Presentation Template
Concept of balance in input and output has been displayed in this power point template. This diagram contains the graphic of red and green arrow on balance line. Use this slide to display your ideas in effective manner.
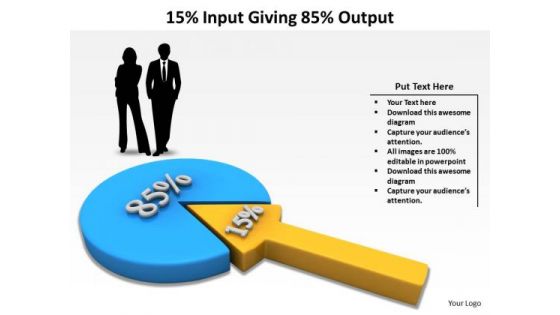
Mba Models And Frameworks 15 Input Giving 85 Output Marketing Diagram
Document Your Views On Our MBA models and frameworks 15 Input Giving 85 Output Marketing diagram Powerpoint Templates. They Will Create A Strong Impression.
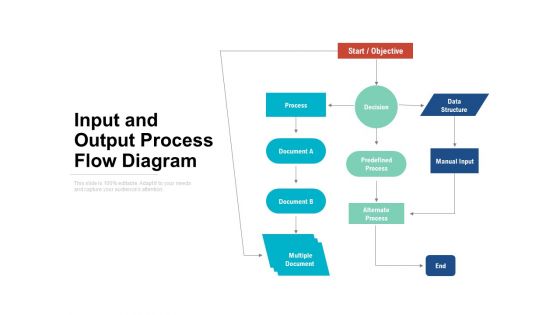
Input And Output Process Flow Diagram Ppt PowerPoint Presentation Layouts Files PDF
Presenting this set of slides with name input and output process flow diagram ppt powerpoint presentation layouts files pdf. This is a one stage process. The stages in this process are objective, process, decision, predefined process, alternate process, multiple document, manual input, data structure. This is a completely editable PowerPoint presentation and is available for immediate download. Download now and impress your audience.
Input Process Output Processing Analysis Chart Icon Sample PDF
Presenting Input Process Output Processing Analysis Chart Icon Sample PDF to dispense important information. This template comprises Three stages. It also presents valuable insights into the topics including Input Process, Output Processing, Analysis Chart. This is a completely customizable PowerPoint theme that can be put to use immediately. So, download it and address the topic impactfully.
Input Process Output Technology Performance Chart Icon Information PDF
Presenting Input Process Output Technology Performance Chart Icon Information PDF to dispense important information. This template comprises Three stages. It also presents valuable insights into the topics including Input Process Output, Technology Performance Chart. This is a completely customizable PowerPoint theme that can be put to use immediately. So, download it and address the topic impactfully.

Input Process Output Chart For Building Customer Loyalty Formats PDF
This slide covers the IPO input-process-output chart used for encouraging customer loyalty. The purpose of this chart is to define steps used to retain customers. It includes information related to the input, process, outputs and outcomes. Persuade your audience using this Input Process Output Chart For Building Customer Loyalty Formats PDF. This PPT design covers Five stages, thus making it a great tool to use. It also caters to a variety of topics including Goals, Input, Processing. Download this PPT design now to present a convincing pitch that not only emphasizes the topic but also showcases your presentation skills.
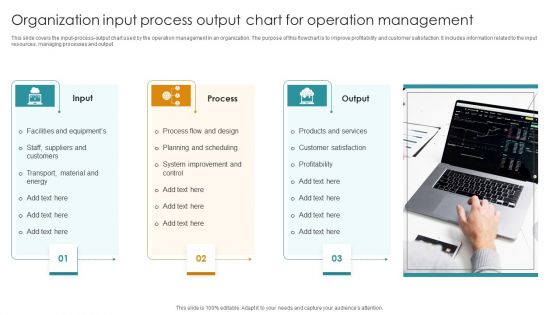
Organization Input Process Output Chart For Operation Management Designs PDF
This slide covers the input-process-output chart used by the operation management in an organization. The purpose of this flowchart is to improve profitability and customer satisfaction. It includes information related to the input resources, managing processes and output. Presenting Organization Input Process Output Chart For Operation Management Designs PDF to dispense important information. This template comprises Three stages. It also presents valuable insights into the topics including Process Flow And Design, Products And Services Transport, Material And Energy. This is a completely customizable PowerPoint theme that can be put to use immediately. So, download it and address the topic impactfully.
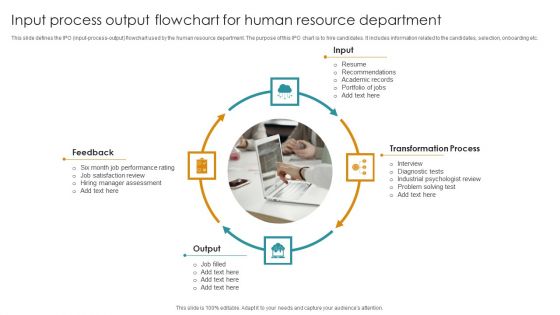
Input Process Output Flowchart For Human Resource Department Download PDF
This slide defines the IPO input-process-output flowchart used by the human resource department. The purpose of this IPO chart is to hire candidates. It includes information related to the candidates, selection, onboarding etc. Presenting Input Process Output Flowchart For Human Resource Department Download PDF to dispense important information. This template comprises Four stages. It also presents valuable insights into the topics including Input, Transformation Process, Feedback, Output. This is a completely customizable PowerPoint theme that can be put to use immediately. So, download it and address the topic impactfully.

Input Process Output Chart Analysis In Recruitment Process Sample PDF
This slide covers the IPO chart analysis used in recruitment process by the human resource department. The purpose of this table is improve the hiring process of an organization. It includes information related to the input, process, output and HR. Showcasing this set of slides titled Input Process Output Chart Analysis In Recruitment Process Sample PDF. The topics addressed in these templates are Business Leaders, Manager, Recruiter, Agency. All the content presented in this PPT design is completely editable. Download it and make adjustments in color, background, font etc. as per your unique business setting.
Analyze And Monitor Input Process Output Flow Chart Icon Themes PDF
Presenting Analyze And Monitor Input Process Output Flow Chart Icon Themes PDF to dispense important information. This template comprises Three stages. It also presents valuable insights into the topics including Analyze And Monitor, Input Process Output, Flow Chart Icon. This is a completely customizable PowerPoint theme that can be put to use immediately. So, download it and address the topic impactfully.
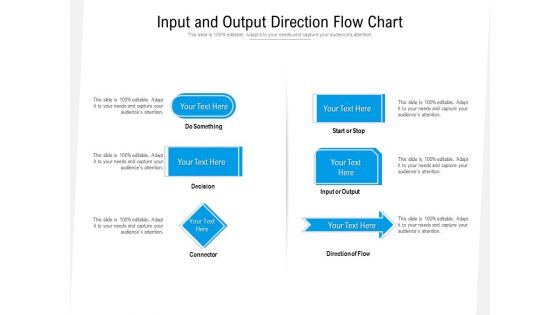
Input And Output Direction Flow Chart Ppt PowerPoint Presentation File Gallery PDF
Showcasing this set of slides titled input and output direction flow chart ppt powerpoint presentation file gallery pdf. The topics addressed in these templates are input and output direction flow chart. All the content presented in this PPT design is completely editable. Download it and make adjustments in color, background, font etc. as per your unique business setting.
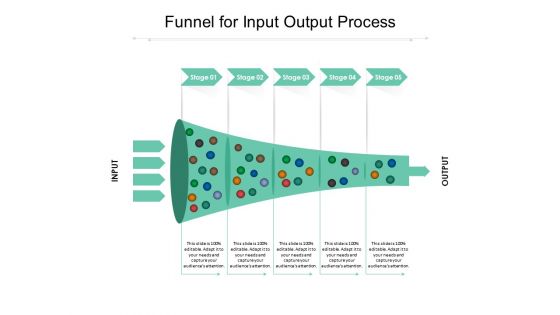
Funnel For Input Output Process Ppt PowerPoint Presentation Pictures Grid PDF
Presenting funnel for input output process ppt powerpoint presentation pictures grid pdf to dispense important information. This template comprises five stages. It also presents valuable insights into the topics including funnel for input output process. This is a completely customizable PowerPoint theme that can be put to use immediately. So, download it and address the topic impactfully.
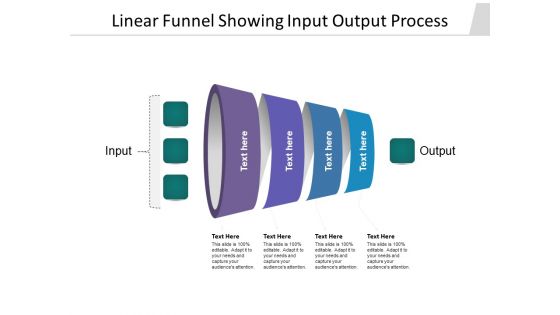
Linear Funnel Showing Input Output Process Ppt PowerPoint Presentation Pictures Structure PDF
Presenting linear funnel showing input output process ppt powerpoint presentation pictures structure pdf to dispense important information. This template comprises four stages. It also presents valuable insights into the topics including linear funnel showing input output process. This is a completely customizable PowerPoint theme that can be put to use immediately. So, download it and address the topic impactfully.
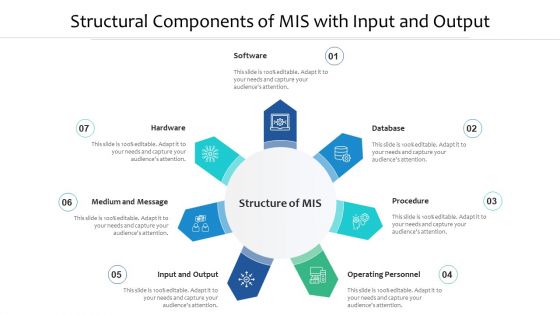
Structural Components Of MIS With Input And Output Ppt Outline Show PDF
Presenting structural components of mis with input and output ppt outline show pdf to dispense important information. This template comprises seven stages. It also presents valuable insights into the topics including operating personnel, input and output, medium and message, procedure, database. This is a completely customizable PowerPoint theme that can be put to use immediately. So, download it and address the topic impactfully.

Organizational Input Process Output Chart To Receive Products From Suppliers Topics PDF
This slide defines the IPO input-process-output chart used by the organization to receive products from suppliers. The purpose of this IPO chart is to explain the process of ordering and receiving products . It includes information related to the transactions, documents, reports etc. Pitch your topic with ease and precision using this Organizational Input Process Output Chart To Receive Products From Suppliers Topics PDF. This layout presents information on Data Collection And Input, Process, Output. It is also available for immediate download and adjustment. So, changes can be made in the color, design, graphics or any other component to create a unique layout.

Input Process Output Chart To Analyze Impact Of Technological Change Graphics PDF
This slide covers the IPO input-process-output chart depicting the impact on consumer behavior based on the changes in technology. The purpose of this IPO chart is to analyze the advancement of technology. It includes information related to the environmental factors, consumer details, etc. Pitch your topic with ease and precision using this Input Process Output Chart To Analyze Impact Of Technological Change Graphics PDF. This layout presents information on Input External Influences, Process Consumer, Output Results. It is also available for immediate download and adjustment. So, changes can be made in the color, design, graphics or any other component to create a unique layout.
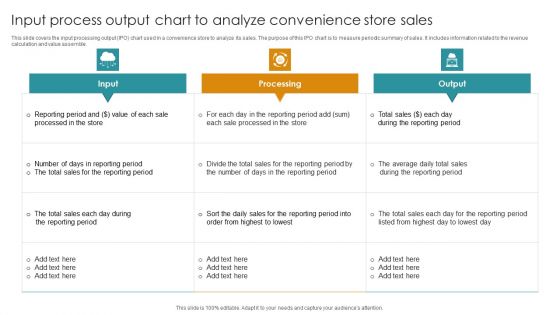
Input Process Output Chart To Analyze Convenience Store Sales Microsoft PDF
This slide covers the input processing output IPO chart used in a convenience store to analyze its sales. The purpose of this IPO chart is to measure periodic summary of sales. It includes information related to the revenue calculation and value assemble. Pitch your topic with ease and precision using this Input Process Output Chart To Analyze Convenience Store Sales Microsoft PDF. This layout presents information on Input, Processing, Output. It is also available for immediate download and adjustment. So, changes can be made in the color, design, graphics or any other component to create a unique layout.
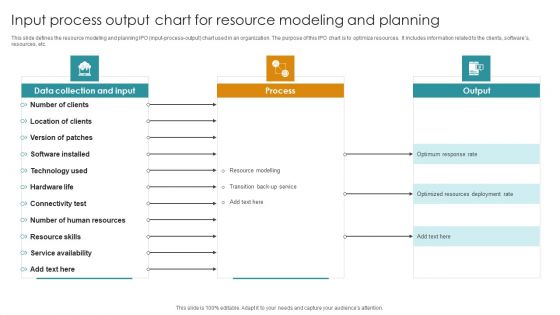
Input Process Output Chart For Resource Modeling And Planning Background PDF
This slide defines the resource modeling and planning IPO input-process-output chart used in an organization. The purpose of this IPO chart is to optimize resources. It includes information related to the clients, softwares, resources, etc. Showcasing this set of slides titled Input Process Output Chart For Resource Modeling And Planning Background PDF. The topics addressed in these templates are Data Collection And Input, Process, Output. All the content presented in this PPT design is completely editable. Download it and make adjustments in color, background, font etc. as per your unique business setting.

Project Phases Input And Output Pyramid Layout Ppt PowerPoint Presentation Slides Example Topics
This is a project phases input and output pyramid layout ppt powerpoint presentation slides example topics. This is a five stage process. The stages in this process are methods phases, methods parts, techniques phases.
Input And Output I And O Advancement Framework To Estimate Architectural Advancement Icons Slide Pictures PDF
Help your business to create an attention-grabbing presentation using our input and output i and o advancement framework to estimate architectural advancement icons slide pictures pdfset of slides. The slide contains innovative icons that can be flexibly edited. Choose this input and output i and o advancement framework to estimate architectural advancement icons slide pictures pdf template to create a satisfactory experience for your customers. Go ahead and click the download button.
Data Processing System Input And Output Ppt PowerPoint Presentation Icon Information
This is a data processing system input and output ppt powerpoint presentation icon information. This is a four stage process. The stages in this process are data flow, data management, big data.
Input Process Output Chart For Evaluating And Selecting Supplier Icons PDF
This slide depicts the IPO input-process-output chart used to select supplier. The purpose of this IPO chart is to take make or buy decision depending on the resources required in an organization. It includes information related to the materials, supplier bids, etc. Persuade your audience using this Input Process Output Chart For Evaluating And Selecting Supplier Icons PDF. This PPT design covers Four stages, thus making it a great tool to use. It also caters to a variety of topics including Processing Activities, Outputs, Clients. Download this PPT design now to present a convincing pitch that not only emphasizes the topic but also showcases your presentation skills.

Input Process Output Chart For Crowdsource Funding In Organization Guidelines PDF
Showcasing this set of slides titled Input Process Output Chart For Crowdsource Funding In Organization Guidelines PDF. The topics addressed in these templates are Input, Session Management, People Management. All the content presented in this PPT design is completely editable. Download it and make adjustments in color, background, font etc. as per your unique business setting.

Input Process Output Chart For Analyzing And Collecting Data Download PDF
This slide covers the IPO input-process-output chart used for collecting and analyzing data. The purpose of this template is to make efficient decisions based on the information available. It includes details related to the people, technology, storage etc. Showcasing this set of slides titled Input Process Output Chart For Analyzing And Collecting Data Download PDF. The topics addressed in these templates are People, Storage, Technology. All the content presented in this PPT design is completely editable. Download it and make adjustments in color, background, font etc. as per your unique business setting.
Project Requirement Management With Priority Input And Output Ppt PowerPoint Presentation Slides Icon
Presenting this set of slides with name project requirement management with priority input and output ppt powerpoint presentation slides icon. The topics discussed in these slides are business requirements, business needs, company requirements, organization requirements. This is a completely editable PowerPoint presentation and is available for immediate download. Download now and impress your audience.
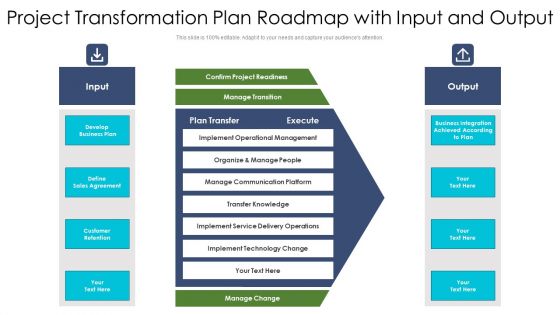
Project Transformation Plan Roadmap With Input And Output Ppt PowerPoint Presentation Gallery Format PDF
Presenting project transformation plan roadmap with input and output ppt powerpoint presentation gallery format pdf to dispense important information. This template comprises five stages. It also presents valuable insights into the topics including communication, management, service.. This is a completely customizable PowerPoint theme that can be put to use immediately. So, download it and address the topic impactfully.
Resource Demands Model With Input And Output Ppt PowerPoint Presentation Icon Layouts PDF
Persuade your audience using this resource demands model with input and output ppt powerpoint presentation icon layouts pdf. This PPT design covers two stages, thus making it a great tool to use. It also caters to a variety of topics including capacity, dashboard, opportunities. Download this PPT design now to present a convincing pitch that not only emphasizes the topic but also showcases your presentation skills.
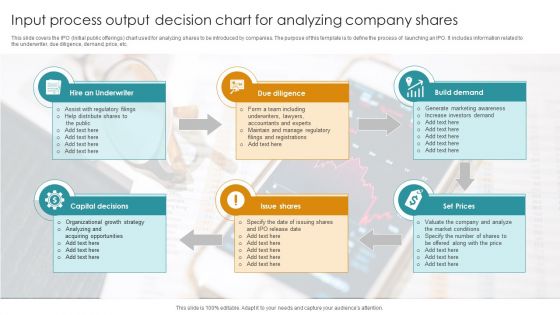
Input Process Output Decision Chart For Analyzing Company Shares Structure PDF
This slide covers the IPO Initial public offerings chart used for analyzing shares to be introduced by companies. The purpose of this template is to define the process of launching an IPO. It includes information related to the underwriter, due diligence, demand, price, etc. Presenting Input Process Output Decision Chart For Analyzing Company Shares Structure PDF to dispense important information. This template comprises Four stages. It also presents valuable insights into the topics including Hire An Underwriter, Due Diligence, Build Demand. This is a completely customizable PowerPoint theme that can be put to use immediately. So, download it and address the topic impactfully.

Summary Financial Record To Report Value Streams Input Vs Output Guidelines PDF
The slide covers the current state and expected results of various indicators such as quality, operating time, value added ratio, direct labour cot etc. Additionally, it covers the key strategies Process of adding value to achieve the expected results. This is a Summary Financial Record To Report Value Streams Input Vs Output Guidelines PDF template with various stages. Focus and dispense information on three stages using this creative set, that comes with editable features. It contains large content boxes to add your information on topics like New System, Accounting Entries, Data Management, Assign Roles And Duties. You can also showcase facts, figures, and other relevant content using this PPT layout. Grab it now.

Input Process Output Chart Ppt PowerPoint Presentation Complete Deck With Slides
Share a great deal of information on the topic by deploying this Input Process Output Chart Ppt PowerPoint Presentation Complete Deck With Slides. Support your ideas and thought process with this prefabricated set. It includes a set of Seventeen slides, all fully modifiable and editable. Each slide can be restructured and induced with the information and content of your choice. You can add or remove large content boxes as well, to make this PPT slideshow more personalized. Its high-quality graphics and visuals help in presenting a well-coordinated pitch. This PPT template is also a resourceful tool to take visual cues from and implement the best ideas to help your business grow and expand. The main attraction of this well-formulated deck is that everything is editable, giving you the freedom to adjust it to your liking and choice. Changes can be made in the background and theme as well to deliver an outstanding pitch. Therefore, click on the download button now to gain full access to this multifunctional set.

Marketing Planning Input Diagram Powerpoint Templates
This is a marketing planning input diagram powerpoint templates. This is a nine stage process. The stages in this process are financial markets and stakeholder pressures, overall company targets, acquisitions strategic partnership, corporate plan, market planning process, product industry mktg plans, territory sales plan, territory mktg plan, marketing plan.

Input And Output I And O Advancement Framework To Estimate Architectural Advancement Ppt PowerPoint Presentation Complete Deck With Slides
This complete deck acts as a great communication tool. It helps you in conveying your business message with personalized sets of graphics, icons etc. Comprising a set of thrityeight slides, this complete deck can help you persuade your audience. It also induces strategic thinking as it has been thoroughly researched and put together by our experts. Not only is it easily downloadable but also editable. The color, graphics, theme any component can be altered to fit your individual needs. So grab it now.
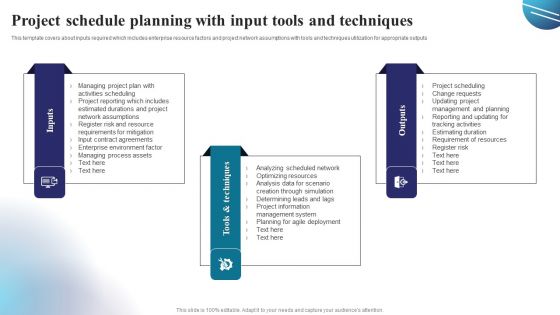
Project Schedule Planning With Input Tools And Techniques Clipart PDF
This template covers about inputs required which includes enterprise resource factors and project network assumptions with tools and techniques utilization for appropriate outputs. Presenting Project Schedule Planning With Input Tools And Techniques Clipart PDF to dispense important information. This template comprises three stages. It also presents valuable insights into the topics including Outputs, Techniques, Inputs. This is a completely customizable PowerPoint theme that can be put to use immediately. So, download it and address the topic impactfully.
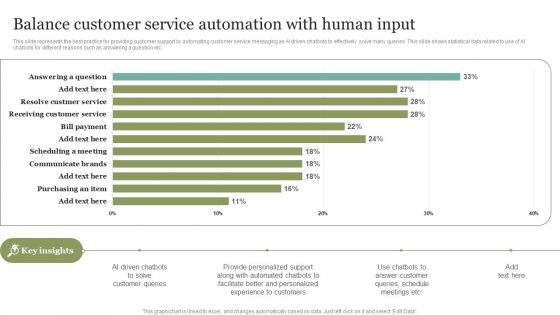
Balance Customer Service Automation With Human Input Inspiration PDF
This slide represents the best practice for providing customer support by automating customer service messaging as AI driven chatbots to effectively solve many queries. This slide shows statistical data related to use of AI chatbots for different reasons such as answering a question etc. Whether you have daily or monthly meetings, a brilliant presentation is necessary. Balance Customer Service Automation With Human Input Inspiration PDF can be your best option for delivering a presentation. Represent everything in detail using Balance Customer Service Automation With Human Input Inspiration PDF and make yourself stand out in meetings. The template is versatile and follows a structure that will cater to your requirements. All the templates prepared by Slidegeeks are easy to download and edit. Our research experts have taken care of the corporate themes as well. So, give it a try and see the results.
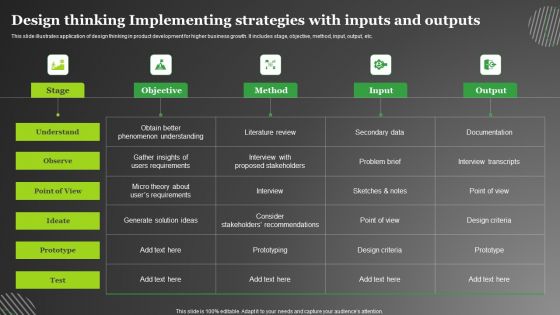
Design Thinking Implementing Strategies With Inputs And Outputs Themes PDF
This slide illustrates application of design thinking in product development for higher business growth. It includes stage, objective, method, input, output, etc. Pitch your topic with ease and precision using this Design Thinking Implementing Strategies With Inputs And Outputs Themes PDF. This layout presents information on Objective, Method, Input, Output. It is also available for immediate download and adjustment. So, changes can be made in the color, design, graphics or any other component to create a unique layout.

Business Environment Evaluation With Inputs And Outputs Themes PDF
This slide shows the business environment analysis which includes environment, inputs, transformation system, outputs, assessment and control that covers customers, regulation, technology, materials, transportation, services, change adoption, capabilities, vendors, etc. Showcasing this set of slides titled Business Environment Evaluation With Inputs And Outputs Themes PDF. The topics addressed in these templates are Environment, Transformation System, Inputs. All the content presented in this PPT design is completely editable. Download it and make adjustments in color, background, font etc. as per your unique business setting.

Balance Customer Service Automation With Human Input Ppt PowerPoint Presentation File Example File PDF
This slide represents the best practice for providing customer support by automating customer service messaging as AI driven chatbots to effectively solve many queries. This slide shows statistical data related to use of AI chatbots for different reasons such as answering a question etc. Create an editable Balance Customer Service Automation With Human Input Ppt PowerPoint Presentation File Example File PDF that communicates your idea and engages your audience. Whether you are presenting a business or an educational presentation, pre designed presentation templates help save time. Balance Customer Service Automation With Human Input Ppt PowerPoint Presentation File Example File PDF is highly customizable and very easy to edit, covering many different styles from creative to business presentations. Slidegeeks has creative team members who have crafted amazing templates. So, go and get them without any delay.

Balance Customer Service Automation With Human Input Ppt PowerPoint Presentation File Infographic Template PDF
This slide represents the best practice for providing customer support by automating customer service messaging as AI driven chatbots to effectively solve many queries. This slide shows statistical data related to use of AI chatbots for different reasons such as answering a question etc. Create an editable Balance Customer Service Automation With Human Input Ppt PowerPoint Presentation File Infographic Template PDF that communicates your idea and engages your audience. Whether you are presenting a business or an educational presentation, pre designed presentation templates help save time. Balance Customer Service Automation With Human Input Ppt PowerPoint Presentation File Infographic Template PDF is highly customizable and very easy to edit, covering many different styles from creative to business presentations. Slidegeeks has creative team members who have crafted amazing templates. So, go and get them without any delay.

Key Inputs And Outputs Of Pi Project Planning For Business Ppt Design Templates PDF
This slide covers key inputs and outputs of pi planning for business which are clear and precise scope and priorities list required by client and understandable goal roadmap. Presenting Key Inputs And Outputs Of Pi Project Planning For Business Ppt Design Templates PDF to dispense important information. This template comprises one stages. It also presents valuable insights into the topics including Pi Planning Inputs, Pi Planning Outputs. This is a completely customizable PowerPoint theme that can be put to use immediately. So, download it and address the topic impactfully.

Framework Of Business Growth With Inputs And Outputs Ppt PowerPoint Presentation File Visual Aids PDF
Presenting framework of business growth with inputs and outputs ppt powerpoint presentation file visual aids pdf to dispense important information. This template comprises three stages. It also presents valuable insights into the topics including organizational level, group level, individual level. This is a completely customizable PowerPoint theme that can be put to use immediately. So, download it and address the topic impactfully.
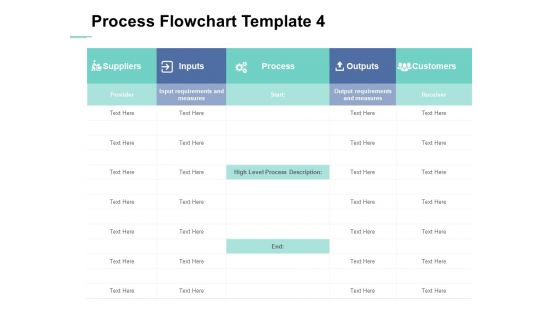
Process Flowchart Outputs Ppt PowerPoint Presentation Inspiration Diagrams
Presenting this set of slides with name process flowchart outputs ppt powerpoint presentation inspiration diagrams. The topics discussed in these slides are suppliers, inputs, process, outputs, customers. This is a completely editable PowerPoint presentation and is available for immediate download. Download now and impress your audience.
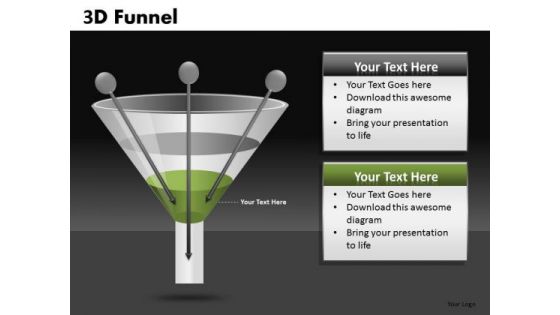
Conversion Funnel Inputs PowerPoint Templates Funnels Ppt Slides
Conversion Funnel Inputs PowerPoint templates Funnels PPT Slides-These high quality powerpoint pre-designed slides and powerpoint templates have been carefully created by our professional team to help you impress your audience. All slides have been created and are 100% editable in powerpoint. Each and every property of any graphic - color, size, orientation, shading, outline etc. can be modified to help you build an effective powerpoint presentation. Any text can be entered at any point in the powerpoint template or slide. Simply DOWNLOAD, TYPE and PRESENT! These PowerPoint presentation slides can be used to represent themes relating to --arrow, business, chart, choice, development, diagram, financial, flow, funnel, liquid, phase, process, product, select, separate, shape, sift, silver, spout, transparent-Conversion Funnel Inputs PowerPoint templates Funnels PPT Slides
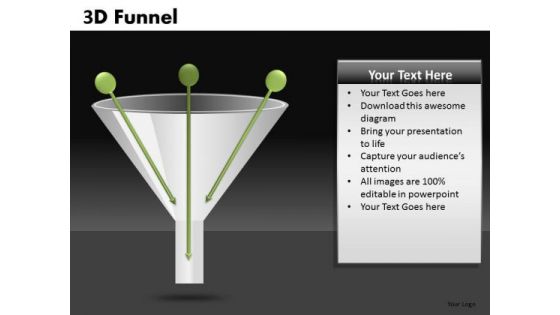
Inputs In A Funnel PowerPoint Slides And Ppt Templates
Inputs in a Funnel PowerPoint Slides and PPT templates-These high quality powerpoint pre-designed slides and powerpoint templates have been carefully created by our professional team to help you impress your audience. All slides have been created and are 100% editable in powerpoint. Each and every property of any graphic - color, size, orientation, shading, outline etc. can be modified to help you build an effective powerpoint presentation. Any text can be entered at any point in the powerpoint template or slide. Simply DOWNLOAD, TYPE and PRESENT! These PowerPoint presentation slides can be used to represent themes relating to --arrow, business, chart, choice, development, diagram, financial, flow, funnel, liquid, phase, process, product, select, separate, shape, sift, silver, spout, transparent-Inputs in a Funnel PowerPoint Slides and PPT templates
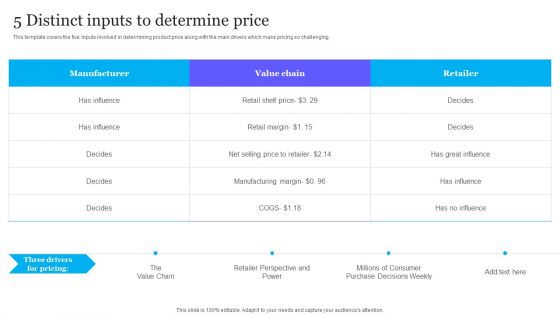
Complete Guide To Product Pricing Techniques 5 Distinct Inputs To Determine Price Diagrams PDF
This template covers the five inputs involved in determining product price along with the main drivers which make pricing so challenging. If you are looking for a format to display your unique thoughts, then the professionally designed Complete Guide To Product Pricing Techniques 5 Distinct Inputs To Determine Price Diagrams PDF is the one for you. You can use it as a Google Slides template or a PowerPoint template. Incorporate impressive visuals, symbols, images, and other charts. Modify or reorganize the text boxes as you desire. Experiment with shade schemes and font pairings. Alter, share or cooperate with other people on your work. Download Complete Guide To Product Pricing Techniques 5 Distinct Inputs To Determine Price Diagrams PDF and find out how to give a successful presentation. Present a perfect display to your team and make your presentation unforgettable.
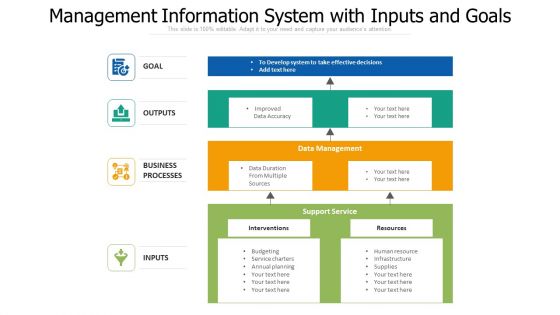
Management Information System With Inputs And Goals Ppt PowerPoint Presentation Infographic Template Themes PDF
Pitch your topic with ease and precision using this management information system with inputs and goals ppt powerpoint presentation infographic template themes pdf. This layout presents information on goal, outputs, business processes, inputs, data management, support service. It is also available for immediate download and adjustment. So, changes can be made in the color, design, graphics or any other component to create a unique layout.
Essential Data Inputs For Stock Requirement Plan Ppt PowerPoint Presentation Icon Files PDF
The following slide highlights the essential data inputs for material requirement planning. Which illustrated customer demand, bills of material, inventory status and production schedule. Presenting Essential Data Inputs For Stock Requirement Plan Ppt PowerPoint Presentation Icon Files PDF to dispense important information. This template comprises four stages. It also presents valuable insights into the topics including Customer Demand, Inventory Status, Bills Material, Production Schedule. This is a completely customizable PowerPoint theme that can be put to use immediately. So, download it and address the topic impactfully.
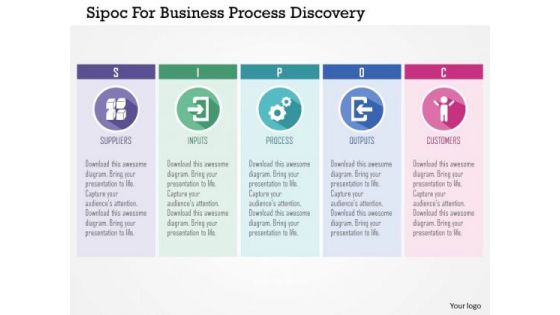
Business Diagram Sipoc For Business Process Discovery Presentation Template
Our above slide displays SIPOC diagram. This suppliers, inputs, process, outputs, customers (SIPOC) diagram defines the scope of work for a team and identifies at a high level the potential gaps between what a process expects from its suppliers and what customers expect from the process.

Quality Assurance Templates Set 3 Sipoc Diagram Along With Constraints Measures Infographics PDF
This slide illustrates supplier input process output customer diagram. It also covers information about constraints measures. This is a quality assurance templates set 3 sipoc diagram along with constraints measures infographics pdf template with various stages. Focus and dispense information on one stages using this creative set, that comes with editable features. It contains large content boxes to add your information on topics like constraints, process, measures, outputs, customers. You can also showcase facts, figures, and other relevant content using this PPT layout. Grab it now.

Quality Control Plan Sipoc Diagram Along With Constraints Measures Formats PDF
This slide illustrates supplier input process output customer diagram. It also covers information about constraints measures. This Quality Control Plan Sipoc Diagram Along With Constraints Measures Formats PDF is perfect for any presentation, be it in front of clients or colleagues. It is a versatile and stylish solution for organizing your meetings. The Quality Control Plan Sipoc Diagram Along With Constraints Measures Formats PDF features a modern design for your presentation meetings. The adjustable and customizable slides provide unlimited possibilities for acing up your presentation. Slidegeeks has done all the homework before launching the product for you. So, dont wait, grab the presentation templates today.

Collection Of Quality Assurance PPT SIPOC Diagram Along With Constraints Measures Demonstration PDF
This slide illustrates supplier input process output customer diagram. It also covers information about constraints measures. This is a collection of quality assurance ppt sipoc diagram along with constraints measures demonstration pdf template with various stages. Focus and dispense information on nine stages using this creative set, that comes with editable features. It contains large content boxes to add your information on topics like process, measures, customers, supplier. You can also showcase facts, figures, and other relevant content using this PPT layout. Grab it now.

Contents For QA Plan And Process Set 3 Sipoc Diagram Along With Constraints Measures Formats PDF
This slide illustrates supplier input process output customer diagram. It also covers information about constraints measures.This is a Contents For QA Plan And Process Set 3 Sipoc Diagram Along With Constraints Measures Formats PDF template with various stages. Focus and dispense information on one stage using this creative set, that comes with editable features. It contains large content boxes to add your information on topics like Performance Standards, Trained Employees, Approved Standards You can also showcase facts, figures, and other relevant content using this PPT layout. Grab it now.
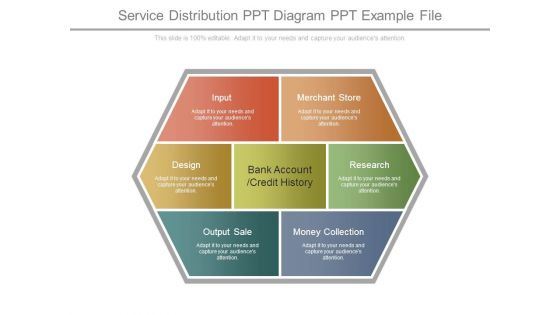
Service Distribution Ppt Diagram Ppt Example File
This is a seo service distribution ppt diagram ppt example file. This is a seven stage process. The stages in this process are input, design, output sale, bank account credit history, merchant store, research, money collection.

Processes Demonstrating Benefits Diagram Templates Microsoft
This is a processes demonstrating benefits diagram templates microsoft. This is a four stage process. The stages in this process are how, input, with what, with who, output, how many, process.

Product Supply Management Diagram Presentation Powerpoint Example
This is a product supply management diagram presentation powerpoint example. This is a seven stage process. The stages in this process are firms, money, resources input, factors for production, goods and services, production and distribution, people consumers.

Overview Of Hypercubes Hardware Structure Ppt PowerPoint Presentation Diagram PDF
This slide depicts the overview of the hypercubes hardware structure for parallel processing, and every processor in this system is a whole computer. It contains eight processors, and each processor has its memory and input and output devices. Are you searching for a Overview Of Hypercubes Hardware Structure Ppt PowerPoint Presentation Diagram PDF that is uncluttered, straightforward, and original Its easy to edit, and you can change the colors to suit your personal or business branding. For a presentation that expresses how much effort you have put in, this template is ideal With all of its features, including tables, diagrams, statistics, and lists, its perfect for a business plan presentation. Make your ideas more appealing with these professional slides. Download Overview Of Hypercubes Hardware Structure Ppt PowerPoint Presentation Diagram PDF from Slidegeeks today.
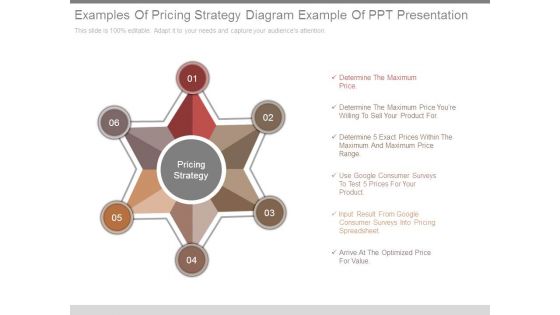
Examples Of Pricing Strategy Diagram Example Of Ppt Presentation
This is a examples of pricing strategy diagram example of ppt presentation. This is a six stage process. The stages in this process are determine the maximum price, determine the maximum price your willing to sell your product for, determine 5 exact prices within the maximum and maximum price range, use google consumer surveys to test 5 prices for your product, input result from google consumer surveys into pricing spreadsheet, arrive at the optimized price for value, pricing strategy.
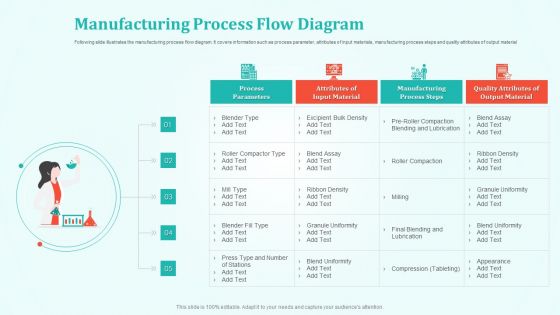
New Drug Development And Review Process Manufacturing Process Flow Diagram Brochure PDF
Following slide illustrates the manufacturing process flow diagram. It covers information such as process parameter, attributes of input materials, manufacturing process steps and quality attributes of output material. Presenting new drug development and review process manufacturing process flow diagram brochure pdf to provide visual cues and insights. Share and navigate important information on five stages that need your due attention. This template can be used to pitch topics like process parameters, attributes of input material, manufacturing process steps, quality attributes of output material. In addtion, this PPT design contains high resolution images, graphics, etc, that are easily editable and available for immediate download.
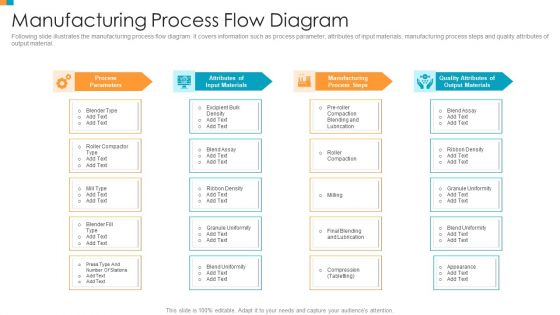
Pharmaceutical Transformation For Inclusive Goods Manufacturing Process Flow Diagram Infographics PDF
Following slide illustrates the manufacturing process flow diagram. It covers information such as process parameter, attributes of input materials, manufacturing process steps and quality attributes of output material. This is a pharmaceutical transformation for inclusive goods manufacturing process flow diagram infographics pdf template with various stages. Focus and dispense information on four stages using this creative set, that comes with editable features. It contains large content boxes to add your information on topics like process parameters, attributes of input materials, manufacturing process steps, quality attributes of output materials. You can also showcase facts, figures, and other relevant content using this PPT layout. Grab it now.
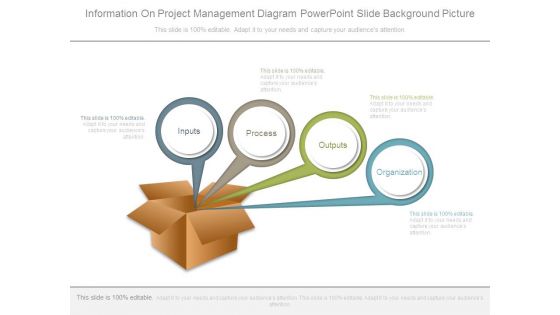
Information On Project Management Diagram Powerpoint Slide Background Picture
This is a information on project management diagram powerpoint slide background picture. This is a four stage process. The stages in this process are inputs, process, outputs, organization.
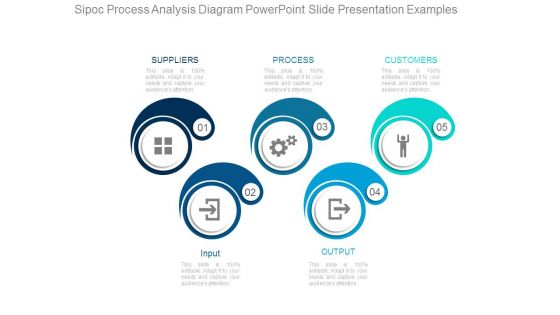
Sipoc Process Analysis Diagram Powerpoint Slide Presentation Examples
This is a sipoc process analysis diagram powerpoint slide presentation examples. This is a five stage process. The stages in this process are suppliers, process, customers, input, output.
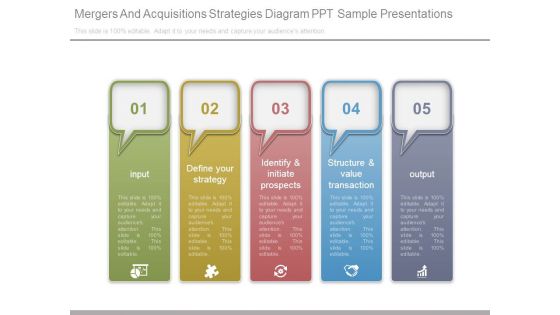
Mergers And Acquisitions Strategies Diagram Ppt Sample Presentations
This is a mergers and acquisitions strategies diagram ppt sample presentations. This is a five stage process. The stages in this process are input, define your strategy, identify and initiate prospects, structure and value transaction, output.
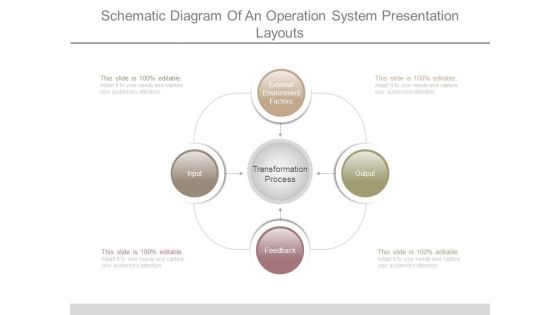
Schematic Diagram Of An Operation System Presentation Layouts
This is a schematic diagram of an operation system presentation layouts. This is a four stage process. The stages in this process are external environment factors, input, feedback, output, transformation process.
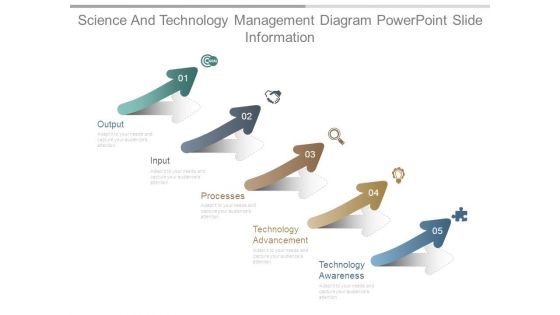
Science And Technology Management Diagram Powerpoint Slide Information
This is a science and technology management diagram powerpoint slide information. This is a five stage process. The stages in this process are output, input, processes, technology advancement, technology awareness.
Profitable Social Enterprise Business Ideas Diagram Ppt Icon
This is a profitable social enterprise business ideas diagram ppt icon. This is a four stage process. The stages in this process are increased industry demand for ethical cotton, increased consumer demand for ethical cotton, promoting ethical supply chains, textile industry events, public events, media publicity pr, product manufacture outsourced, relationship building, signature product sales, grant funding, ethically sourced cotton, social impact outputs, business model, inputs.\n\n

Controlling Cash Flow For Business Diagram Ppt Slide Themes
This is a controlling cash flow for business diagram ppt slide themess. This is a six stage process. The stages in this process are sales, balance sheet, operating, business input, cash, income statement.
Business Logic Diagram 3d Men Interconnected Networking PowerPoint Templates
We present our business logic diagram 3d men interconnected networking PowerPoint templates.Download our People PowerPoint Templates because Our PowerPoint Templates and Slides has conjured up a web of all you need with the help of our great team. Use them to string together your glistening ideas. Use our Globe PowerPoint Templates because It can Leverage your style with our PowerPoint Templates and Slides. Charm your audience with your ability. Download our Earth PowerPoint Templates because our PowerPoint Templates and Slides will give your ideas the shape. Present our Network Diagrams PowerPoint Templates because Our PowerPoint Templates and Slides provide you with a vast range of viable options. Select the appropriate ones and just fill in your text. Present our Business PowerPoint Templates because You canTake a leap off the starting blocks with our PowerPoint Templates and Slides. They will put you ahead of the competition in quick time.Use these PowerPoint slides for presentations relating to 3d, accessibility, business, cable, communication, computer, concept, connect, connection, cord, data, device, digitally, downloading, e-commerce, earth, exchanging, global, globe, green, human, imagination, information, input, inserting, interconnect, internet, man, medium, network, people, planet, plug, puppet, sign, speed, team, teamwork, technology, telecommunication. The prominent colors used in the PowerPoint template are Green, White, Gray. Customers tell us our business logic diagram 3d men interconnected networking PowerPoint templates are specially created by a professional team with vast experience. They diligently strive to come up with the right vehicle for your brilliant Ideas. We assure you our business PowerPoint templates and PPT Slides effectively help you save your valuable time. Customers tell us our business logic diagram 3d men interconnected networking PowerPoint templates effectively help you save your valuable time. Use our cable PowerPoint templates and PPT Slides look good visually. PowerPoint presentation experts tell us our business logic diagram 3d men interconnected networking PowerPoint templates are designed by professionals You can be sure our concept PowerPoint templates and PPT Slides provide you with a vast range of viable options. Select the appropriate ones and just fill in your text.
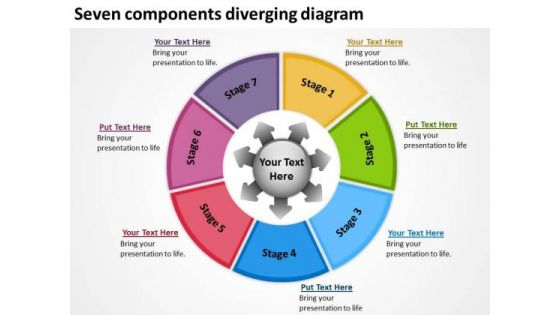
Seven Components Diverging Diagram Cycle Process PowerPoint Slides
We present our seven components diverging diagram Cycle Process PowerPoint Slides.Use our Circle Charts PowerPoint Templates because Our PowerPoint Templates and Slides will give you great value for your money. Be assured of finding the best projection to highlight your words. Download our Arrows PowerPoint Templates because you can Decorate it with your well wrapped ideas and colourful thoughts. Present our Business PowerPoint Templates because this layout helps you to bring some important aspects of your business process to the notice of all concerned. Streamline the flow of information across the board. Download and present our Shapes PowerPoint Templates because retrace your steps with your team and have a relook at the basic aspects of your work. Download and present our Flow Charts PowerPoint Templates because you can Adorn them with your ideas and thoughts.Use these PowerPoint slides for presentations relating to advice, analysis, analyze, background, banner, blank, brochure, business, center, central, combine, compile, component, concept, connect, connection, core, diagram, distribute, diverge, diverse, diversify, draw, education, element, exchange, feedback, flow, illustration, industry, infographic, input, join, link, management, manager, output, person, plan, presentation, process, reverse, show, slide, strategy, support, teamwork, transfer, vector. The prominent colors used in the PowerPoint template are Yellow, Green, Blue. Customers tell us our seven components diverging diagram Cycle Process PowerPoint Slides are second to none. PowerPoint presentation experts tell us our blank PowerPoint templates and PPT Slides are designed to make your presentations professional. People tell us our seven components diverging diagram Cycle Process PowerPoint Slides are Dynamic. People tell us our center PowerPoint templates and PPT Slides are Graceful. Customers tell us our seven components diverging diagram Cycle Process PowerPoint Slides are Radiant. People tell us our business PowerPoint templates and PPT Slides are Bold.
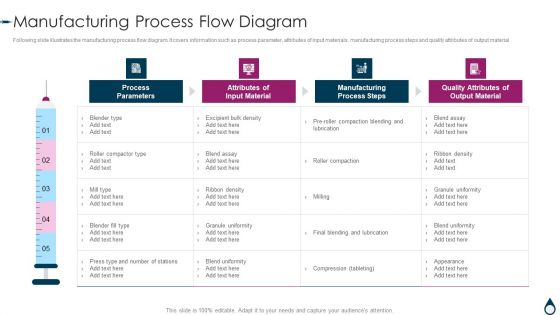
Quality Manufacturing Process For Generic Medicines Manufacturing Process Flow Diagram Guidelines PDF
Following slide illustrates the manufacturing process flow diagram. It covers information such as process parameter, attributes of input materials, manufacturing process steps and quality attributes of output material. Deliver and pitch your topic in the best possible manner with this Quality Manufacturing Process For Generic Medicines Manufacturing Process Flow Diagram Guidelines PDF. Use them to share invaluable insights on Material Process, Parameters, Manufacturing, Quality Attributes and impress your audience. This template can be altered and modified as per your expectations. So, grab it now.

Effective Manufacturing Planning And Control Administration System Venn Diagram Inspiration PDF
The Effective Manufacturing Planning And Control Administration System Venn Diagram Inspiration PDF is a compilation of the most recent design trends as a series of slides. It is suitable for any subject or industry presentation, containing attractive visuals and photo spots for businesses to clearly express their messages. This template contains a variety of slides for the user to input data, such as structures to contrast two elements, bullet points, and slides for written information. Slidegeeks is prepared to create an impression.
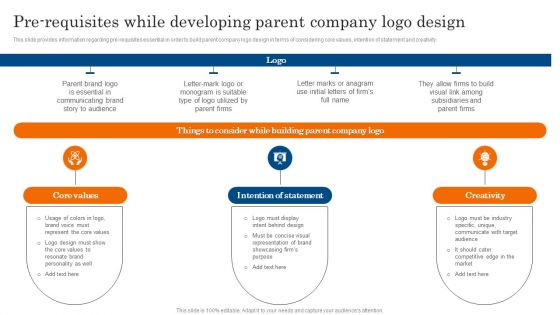
Pre Requisites While Developing Parent Company Logo Design Ppt PowerPoint Presentation Diagram Graph Charts PDF
This slide provides information regarding pre requisites essential in order to build parent company logo design in terms of considering core values, intention of statement and creativity. The Pre Requisites While Developing Parent Company Logo Design Ppt PowerPoint Presentation Diagram Graph Charts PDF is a compilation of the most recent design trends as a series of slides. It is suitable for any subject or industry presentation, containing attractive visuals and photo spots for businesses to clearly express their messages. This template contains a variety of slides for the user to input data, such as structures to contrast two elements, bullet points, and slides for written information. Slidegeeks is prepared to create an impression.
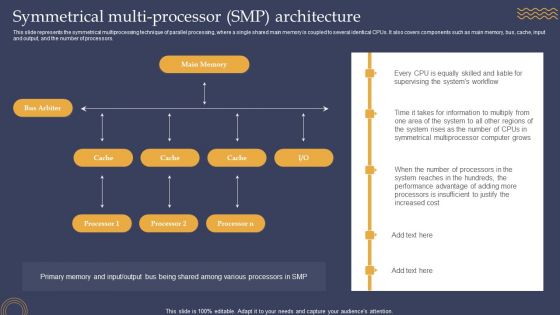
Symmetrical Multi Processor Smp Architecture Ppt PowerPoint Presentation Diagram Lists PDF
This slide represents the symmetrical multiprocessing technique of parallel processing, where a single shared main memory is coupled to several identical CPUs. It also covers components such as main memory, bus, cache, input and output, and the number of processors. Present like a pro with Symmetrical Multi Processor Smp Architecture Ppt PowerPoint Presentation Diagram Lists PDF Create beautiful presentations together with your team, using our easy to use presentation slides. Share your ideas in real time and make changes on the fly by downloading our templates. So whether you are in the office, on the go, or in a remote location, you can stay in sync with your team and present your ideas with confidence. With Slidegeeks presentation got a whole lot easier. Grab these presentations today.
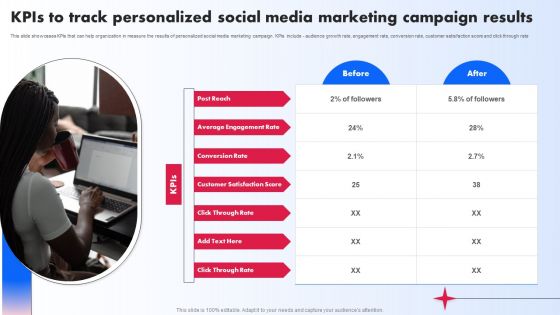
Kpis To Track Personalized Social Media Marketing Campaign Results Ppt PowerPoint Presentation Diagram Images PDF
This slide showcases KPIs that can help organization in measure the results of personalized social media marketing campaign. KPIs include audience growth rate, engagement rate, conversion rate, customer satisfaction score and click through rate. The Kpis To Track Personalized Social Media Marketing Campaign Results Ppt PowerPoint Presentation Diagram Images PDF is a compilation of the most recent design trends as a series of slides. It is suitable for any subject or industry presentation, containing attractive visuals and photo spots for businesses to clearly express their messages. This template contains a variety of slides for the user to input data, such as structures to contrast two elements, bullet points, and slides for written information. Slidegeeks is prepared to create an impression.

Impact Of Marketing Strategies On Business Performance Ppt PowerPoint Presentation Diagram Lists PDF
The following slide showcases the positive outcome of marketing strategies on companys performance. Post-implementing marketing strategies company recorded significant increase in brand awareness rate, sales and profit, market share, and customer retention rate. The Impact Of Marketing Strategies On Business Performance Ppt PowerPoint Presentation Diagram Lists PDF is a compilation of the most recent design trends as a series of slides. It is suitable for any subject or industry presentation, containing attractive visuals and photo spots for businesses to clearly express their messages. This template contains a variety of slides for the user to input data, such as structures to contrast two elements, bullet points, and slides for written information. Slidegeeks is prepared to create an impression.

Impact Of Customer Churn Prevention Strategies On Business Performance Ppt PowerPoint Presentation Diagram Images PDF
Mentioned slide outlines the impact of implementing attrition rate prevention techniques on organizational performance. The graph is covering information about monthly recurring revenue MRR, customer lifetime value CLV, and customer acquisition cost CAC along with key intakes. The Impact Of Customer Churn Prevention Strategies On Business Performance Ppt PowerPoint Presentation Diagram Images PDF is a compilation of the most recent design trends as a series of slides. It is suitable for any subject or industry presentation, containing attractive visuals and photo spots for businesses to clearly express their messages. This template contains a variety of slides for the user to input data, such as structures to contrast two elements, bullet points, and slides for written information. Slidegeeks is prepared to create an impression.
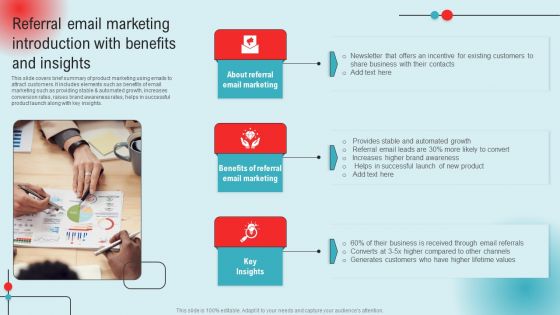
Referral Email Marketing Introduction With Benefits And Insights Ppt PowerPoint Presentation Diagram Images PDF
This slide covers brief summary of product marketing using emails to attract customers. It includes elements such as benefits of email marketing such as providing stable and automated growth, increases conversion rates, raises brand awareness rates, helps in successful product launch along with key insights. The Referral Email Marketing Introduction With Benefits And Insights Ppt PowerPoint Presentation Diagram Images PDF is a compilation of the most recent design trends as a series of slides. It is suitable for any subject or industry presentation, containing attractive visuals and photo spots for businesses to clearly express their messages. This template contains a variety of slides for the user to input data, such as structures to contrast two elements, bullet points, and slides for written information. Slidegeeks is prepared to create an impression.

Holistic Marketing Team Structure And Responsibilities Ppt PowerPoint Presentation Diagram Images PDF
This slide provides glimpse about roles and responsibilities of holistic marketing team with the team reporting structure. It includes team members such as CEO, vice president production, vice president planning and research, etc. The Holistic Marketing Team Structure And Responsibilities Ppt PowerPoint Presentation Diagram Images PDF is a compilation of the most recent design trends as a series of slides. It is suitable for any subject or industry presentation, containing attractive visuals and photo spots for businesses to clearly express their messages. This template contains a variety of slides for the user to input data, such as structures to contrast two elements, bullet points, and slides for written information. Slidegeeks is prepared to create an impression.

Measuring Brand Awareness Through Survey Form Ppt PowerPoint Presentation Diagram Lists PDF
The following slide outlines a comprehensive questionnaire form through which marketers can measure customer perception about our brand. The questions mentioned in slide are related to brand reliability, confidence when buying product, etc. The Measuring Brand Awareness Through Survey Form Ppt PowerPoint Presentation Diagram Lists PDF is a compilation of the most recent design trends as a series of slides. It is suitable for any subject or industry presentation, containing attractive visuals and photo spots for businesses to clearly express their messages. This template contains a variety of slides for the user to input data, such as structures to contrast two elements, bullet points, and slides for written information. Slidegeeks is prepared to create an impression.
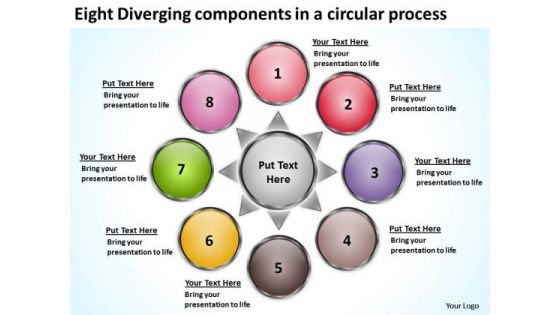
Components In A Circular Process Relative Flow Arrow Diagram PowerPoint Templates
We present our components in a circular process Relative Flow Arrow Diagram PowerPoint templates.Use our Circle Charts PowerPoint Templates because it shows the pyramid which is a symbol of the desire to reach the top in a steady manner. Download our Arrows PowerPoint Templates because you can Focus on each one and investigate which one would be the best fit for your needs. Download our Business PowerPoint Templates because spell out your advertising plans to increase market share. The feedback has been positive and productive. Download our Shapes PowerPoint Templates because it shows subtle changes that are taking place. Download and present our Flow Charts PowerPoint Templates because clarity of thought has been the key to your growth.Use these PowerPoint slides for presentations relating to advice, analysis, analyze, background, banner, blank, brochure, business, center, central, combine, compile, component, concept, connect, connection, core, diagram, distribute, diverge, diverse, diversify, draw, education, element, exchange, feedback, flow, illustration, industry, infographic, input, join, link, management, manager, output, person, plan, presentation, process, reverse, show, slide, strategy, support, teamwork, transfer, vector. The prominent colors used in the PowerPoint template are Yellow, Green, Pink. Customers tell us our components in a circular process Relative Flow Arrow Diagram PowerPoint templates are visually appealing. PowerPoint presentation experts tell us our center PowerPoint templates and PPT Slides will help you be quick off the draw. Just enter your specific text and see your points hit home. People tell us our components in a circular process Relative Flow Arrow Diagram PowerPoint templates are Amazing. People tell us our center PowerPoint templates and PPT Slides are Great. Customers tell us our components in a circular process Relative Flow Arrow Diagram PowerPoint templates are aesthetically designed to attract attention. We guarantee that they will grab all the eyeballs you need. People tell us our analyze PowerPoint templates and PPT Slides are Nice.
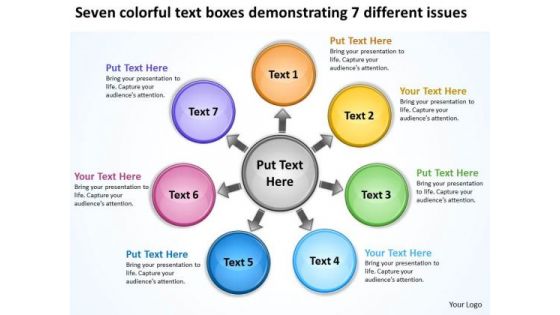
Colorful Text Boxes Demonstrating 7 Different Issues Cycle Process Diagram PowerPoint Slides
We present our colorful text boxes demonstrating 7 different issues Cycle Process Diagram PowerPoint Slides.Use our Circle Charts PowerPoint Templates because your ideas are fundamentally stable with a broad base of workable possibilities. Download and present our Arrows PowerPoint Templates because your group can behave steady in the top bracket. Present our Business PowerPoint Templates because you have analysed many global markets and come up with possibilities. Highlight the pros and cons of other likely business oppurtunities. Present our Shapes PowerPoint Templates because you can put it up there for all to see. Download and present our Flow Charts PowerPoint Templates because excite your audience with the brilliance of your thoughts.Use these PowerPoint slides for presentations relating to advice, analysis, analyze, background, banner, blank, brochure, business, center, central, combine, compile, component, concept, connect, connection, core, diagram, distribute, diverge, diverse, diversify, draw, education, element, exchange, feedback, flow, illustration, industry, infographic, input, join, link, management, manager, output, person, plan, presentation, process, reverse, show, slide, strategy, support, teamwork, transfer, vector. The prominent colors used in the PowerPoint template are Blue, Green, Yellow. Customers tell us our colorful text boxes demonstrating 7 different issues Cycle Process Diagram PowerPoint Slides are Tranquil. PowerPoint presentation experts tell us our analyze PowerPoint templates and PPT Slides are Romantic. People tell us our colorful text boxes demonstrating 7 different issues Cycle Process Diagram PowerPoint Slides are Luxuriant. People tell us our background PowerPoint templates and PPT Slides are aesthetically designed to attract attention. We guarantee that they will grab all the eyeballs you need. Customers tell us our colorful text boxes demonstrating 7 different issues Cycle Process Diagram PowerPoint Slides are Pretty. People tell us our blank PowerPoint templates and PPT Slides are Fantastic.
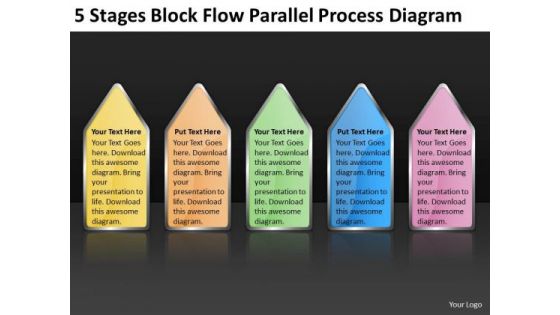
5 Stages Block Flow Parallel Process Diagram Small Business Plan Template Free PowerPoint Slides
We present our 5 stages block flow parallel process diagram small business plan template free PowerPoint Slides.Use our Arrows PowerPoint Templates because Your success is our commitment. Our PowerPoint Templates and Slides will ensure you reach your goal. Download our Signs PowerPoint Templates because You can Channelise the thoughts of your team with our PowerPoint Templates and Slides. Urge them to focus on the goals you have set. Download and present our Shapes PowerPoint Templates because Watching this your Audience will Grab their eyeballs, they wont even blink. Present our Metaphors-Visual Concepts PowerPoint Templates because Our PowerPoint Templates and Slides are like the strings of a tennis racquet. Well strung to help you serve aces. Download our Business PowerPoint Templates because You can Connect the dots. Fan expectations as the whole picture emerges.Use these PowerPoint slides for presentations relating to abstract, arrow, banner, bar, brochure, business, chart, collaboration, combined, communication, conjugate, constrain, cooperation, data, diagram, different, direction, efficiency, five, flow, flowchart, illustration, individual, information, input, joined, junction, marketing, mixed, output, plan, pointing, presentation, schematic, statistics, strategy, streamline, structure, teamwork, template, unite. The prominent colors used in the PowerPoint template are Yellow, Green, Orange. We assure you our 5 stages block flow parallel process diagram small business plan template free PowerPoint Slides are incredible easy to use. People tell us our chart PowerPoint templates and PPT Slides are visually appealing. Customers tell us our 5 stages block flow parallel process diagram small business plan template free PowerPoint Slides will make the presenter successul in his career/life. Presenters tell us our bar PowerPoint templates and PPT Slides look good visually. People tell us our 5 stages block flow parallel process diagram small business plan template free PowerPoint Slides are designed by a team of presentation professionals. We assure you our business PowerPoint templates and PPT Slides will make the presenter successul in his career/life.

Sipoc Analysis Ppt PowerPoint Presentation Inspiration Diagrams
This is a sipoc analysis ppt powerpoint presentation inspiration diagrams. This is a five stage process. The stages in this process are suppliers, inputs, process, outputs, customers.
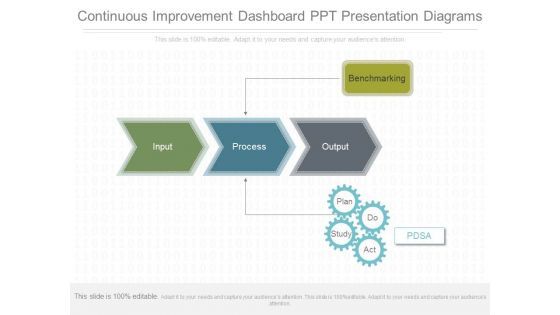
Continuous Improvement Dashboard Ppt Presentation Diagrams
This is a continuous improvement dashboard ppt presentation diagrams. This is a five stage process. The stages in this process are benchmarking, input, process, output, pdsa, plan, do, study, act.

Goal Based Tactical Planning Structure Diagrams PDF
The following slide showcases strategic planning model to establish companys vision and business objectives. It includes components such as gather facts, SWOT analysis, review inputs, strategic matrix, define strategies and review and adjust. Presenting Goal Based Tactical Planning Structure Diagrams PDF to dispense important information. This template comprises six stages. It also presents valuable insights into the topics including Gather Facts, Swot Analysis, Review Inputs. This is a completely customizable PowerPoint theme that can be put to use immediately. So, download it and address the topic impactfully.
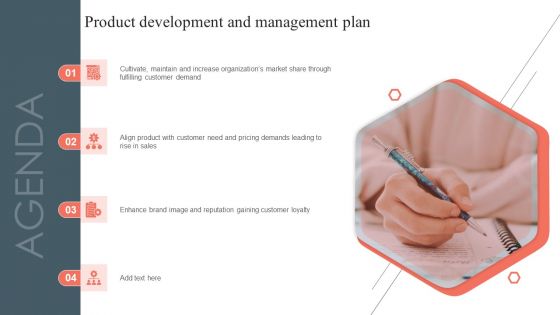
Agenda Product Development And Management Plan Diagrams PDF
The Agenda Product Development And Management Plan Diagrams PDF is a compilation of the most recent design trends as a series of slides. It is suitable for any subject or industry presentation, containing attractive visuals and photo spots for businesses to clearly express their messages. This template contains a variety of slides for the user to input data, such as structures to contrast two elements, bullet points, and slides for written information. Slidegeeks is prepared to create an impression.
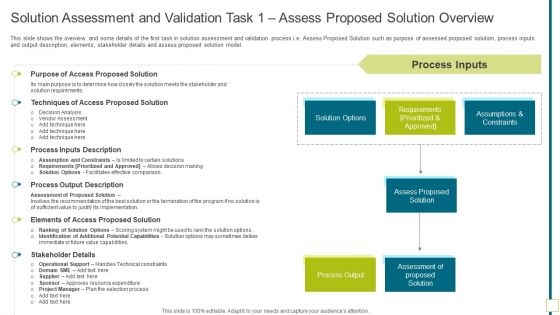
Solution Assessment And Validation Task 1 Assess Proposed Solution Overview Diagrams PDF
This slide shows the overview and some details of the first task in solution assessment and validation process i.e. Assess Proposed Solution such as purpose of assessed proposed solution, process inputs and output description, elements, stakeholder details and assess proposed solution model. Deliver and pitch your topic in the best possible manner with this solution assessment and validation task 1 assess proposed solution overview diagrams pdf. Use them to share invaluable insights on process inputs description, process output description, stakeholder details, proposed solution and impress your audience. This template can be altered and modified as per your expectations. So, grab it now.

Value Centric Enterprise Chain Optimization Mapping Process Diagrams Pdf
The slide showcases mapping process involved in business value chain management process in organization . It includes functions performed by retailers, wholesalers, brokers, producers, input supply , along with domestic market channels , export market channels , support market channels . Showcasing this set of slides titled Value Centric Enterprise Chain Optimization Mapping Process Diagrams Pdf. The topics addressed in these templates are Market Retailers, Domestic Market Channel, Export Market Channel. All the content presented in this PPT design is completely editable. Download it and make adjustments in color, background, font etc. as per your unique business setting.

Major Challenges Of Stakeholder Management Planning Diagrams PDF
This slide illustrate common stakeholder issues that results in ineffective management planning. It include pointers such as resource constraints, communication breakdown, competing priorities etc. The Major Challenges Of Stakeholder Management Planning Diagrams PDF is a compilation of the most recent design trends as a series of slides. It is suitable for any subject or industry presentation, containing attractive visuals and photo spots for businesses to clearly express their messages. This template contains a variety of slides for the user to input data, such as structures to contrast two elements, bullet points, and slides for written information. Slidegeeks is prepared to create an impression.
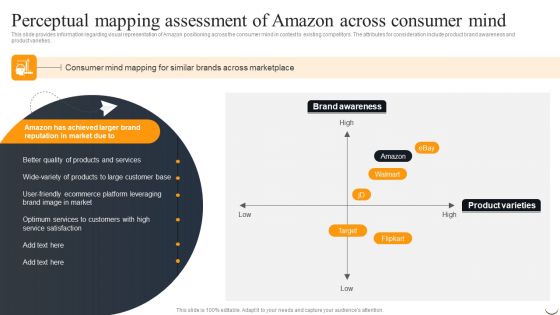
Perceptual Mapping Assessment Of Amazon Across Consumer Mind Diagrams PDF
This slide provides information regarding visual representation of Amazon positioning across the consumer mind in context to existing competitors. The attributes for consideration include product brand awareness and product varieties. The Perceptual Mapping Assessment Of Amazon Across Consumer Mind Diagrams PDF is a compilation of the most recent design trends as a series of slides. It is suitable for any subject or industry presentation, containing attractive visuals and photo spots for businesses to clearly express their messages. This template contains a variety of slides for the user to input data, such as structures to contrast two elements, bullet points, and slides for written information. Slidegeeks is prepared to create an impression.

Tools To Measure Performance Marketing Channels Results Diagrams PDF
This slide showcases various software that can help marketers to measure the effectiveness of performance marketing campaign and optimize budget accordingly. Key features of software are - engagement tracking, traffic reporting, channel grouping, customer dashboards etc. The Tools To Measure Performance Marketing Channels Results Diagrams PDF is a compilation of the most recent design trends as a series of slides. It is suitable for any subject or industry presentation, containing attractive visuals and photo spots for businesses to clearly express their messages. This template contains a variety of slides for the user to input data, such as structures to contrast two elements, bullet points, and slides for written information. Slidegeeks is prepared to create an impression.
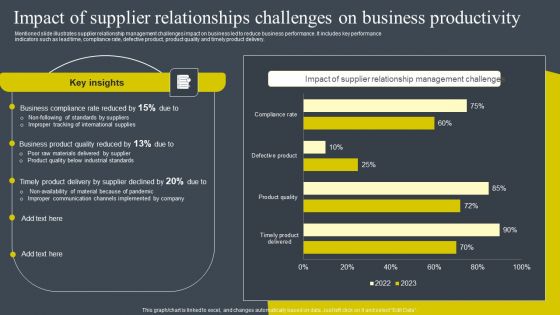
Impact Of Supplier Relationships Challenges On Business Productivity Diagrams PDF
Mentioned slide illustrates supplier relationship management challenges impact on business led to reduce business performance. It includes key performance indicators such as lead time, compliance rate, defective product, product quality and timely product delivery. The Impact Of Supplier Relationships Challenges On Business Productivity Diagrams PDF is a compilation of the most recent design trends as a series of slides. It is suitable for any subject or industry presentation, containing attractive visuals and photo spots for businesses to clearly express their messages. This template contains a variety of slides for the user to input data, such as structures to contrast two elements, bullet points, and slides for written information. Slidegeeks is prepared to create an impression.

Health Care System Components Conceptual Structure Diagrams PDF
This slide exhibits critical components of primary health care system. Purpose of this slide is to assure efficient development of medical system performance for social welfare. It include elements such as system, inputs, service delivery, outputs and outcomes. Presenting Health Care System Components Conceptual Structure Diagrams PDF to dispense important information. This template comprises five stages. It also presents valuable insights into the topics including System, Inputs, Service Delivery. This is a completely customizable PowerPoint theme that can be put to use immediately. So, download it and address the topic impactfully.
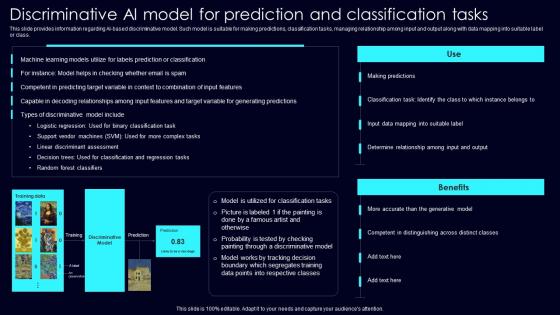
Discriminative AI Model Exploring Rise Of Generative AI In Artificial Intelligence Diagrams Pdf
This slide provides information regarding AI based discriminative model. Such model is suitable for making predictions, classification tasks, managing relationship among input and output along with data mapping into suitable label or class. Formulating a presentation can take up a lot of effort and time, so the content and message should always be the primary focus. The visuals of the PowerPoint can enhance the presenters message, so our Discriminative AI Model Exploring Rise Of Generative AI In Artificial Intelligence Diagrams Pdf was created to help save time. Instead of worrying about the design, the presenter can concentrate on the message while our designers work on creating the ideal templates for whatever situation is needed. Slidegeeks has experts for everything from amazing designs to valuable content, we have put everything into Discriminative AI Model Exploring Rise Of Generative AI In Artificial Intelligence Diagrams Pdf
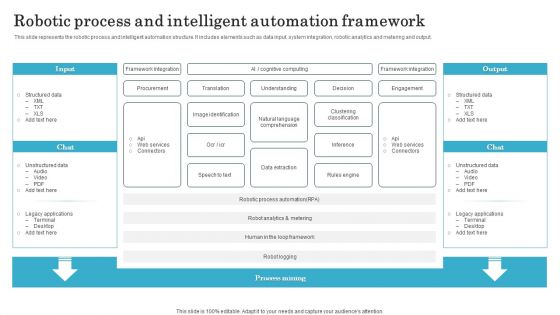
Robotic Process And Intelligent Automation Framework Diagrams PDF
This slide represents the robotic process and intelligent automation structure. It includes elements such as data input, system integration, robotic analytics and metering and output. Pitch your topic with ease and precision using this Robotic Process And Intelligent Automation Framework Diagrams PDF. This layout presents information on Robotic Process, Intelligent Automation Framework. It is also available for immediate download and adjustment. So, changes can be made in the color, design, graphics or any other component to create a unique layout.

Composition Of Effective Prompt For Code Generation Diagrams PDF
The purpose of this slide is to discuss the creation of a prompt to generate desirable results. The main components illustrated in this slide are high-level task description, high-level context, examples, user input, model completion, current user input, etc. If you are looking for a format to display your unique thoughts, then the professionally designed Composition Of Effective Prompt For Code Generation Diagrams Pdf is the one for you. You can use it as a Google Slides template or a PowerPoint template. Incorporate impressive visuals, symbols, images, and other charts. Modify or reorganize the text boxes as you desire. Experiment with shade schemes and font pairings. Alter, share or cooperate with other people on your work. Download Composition Of Effective Prompt For Code Generation Diagrams Pdf and find out how to give a successful presentation. Present a perfect display to your team and make your presentation unforgettable.

Feedback Control System In Control Theory Cybernetic Integration Diagrams Pdf
This slide shows feedback control system in control theory. The purpose of this slide is to explain the working of feedback control system with its different components such as input, process controller, output, etc. Do you know about Slidesgeeks Feedback Control System In Control Theory Cybernetic Integration Diagrams Pdf These are perfect for delivering any kind od presentation. Using it, create PowerPoint presentations that communicate your ideas and engage audiences. Save time and effort by using our pre-designed presentation templates that are perfect for a wide range of topic. Our vast selection of designs covers a range of styles, from creative to business, and are all highly customizable and easy to edit. Download as a PowerPoint template or use them as Google Slides themes.
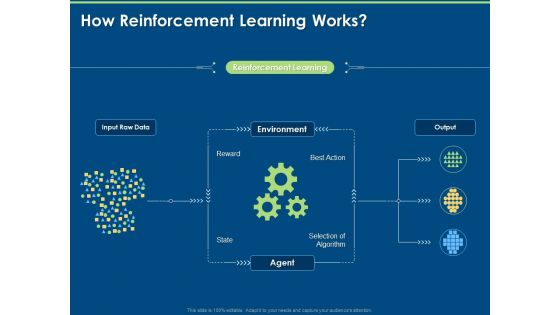
Segments Of Reinforcement Learning How Reinforcement Learning Works Ppt Professional Diagrams PDF
Presenting this set of slides with name segments of reinforcement learning how reinforcement learning works ppt professional diagrams pdf. This is a three stage process. The stages in this process are input raw data, environment, agent, output, reward. This is a completely editable PowerPoint presentation and is available for immediate download. Download now and impress your audience.

Business Framework Lean Six Sigma Improvement Cycle PowerPoint Presentation
This diagram displays framework for lean six sigma improvement cycle. It contains boxes around a gear. This business diagram depicts transformation process of inputs and outputs for a business or a company. For an effective impact on the viewers, use this stunning diagram for business presentations.
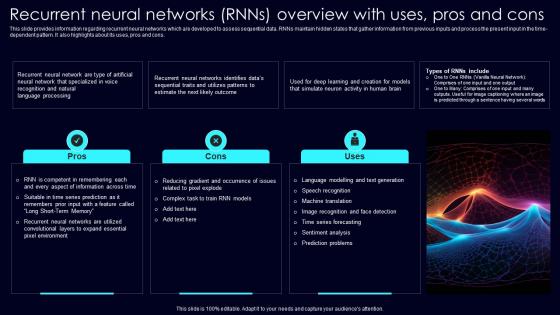
Recurrent Neural Networks RNNs Exploring Rise Of Generative AI In Artificial Intelligence Diagrams Pdf
This slide provides information regarding recurrent neural networks which are developed to assess sequential data. RNNs maintain hidden states that gather information from previous inputs and process the present input in the time dependent pattern. It also highlights about its uses, pros and cons. Find highly impressive Recurrent Neural Networks RNNs Exploring Rise Of Generative AI In Artificial Intelligence Diagrams Pdf on Slidegeeks to deliver a meaningful presentation. You can save an ample amount of time using these presentation templates. No need to worry to prepare everything from scratch because Slidegeeks experts have already done a huge research and work for you. You need to download Recurrent Neural Networks RNNs Exploring Rise Of Generative AI In Artificial Intelligence Diagrams Pdf for your upcoming presentation. All the presentation templates are 100 percent editable and you can change the color and personalize the content accordingly. Download now
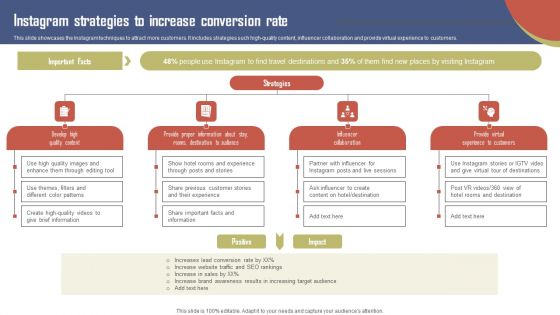
Instagram Strategies To Increase Conversion Rate Effective Travel Marketing Guide For Improving Diagrams PDF
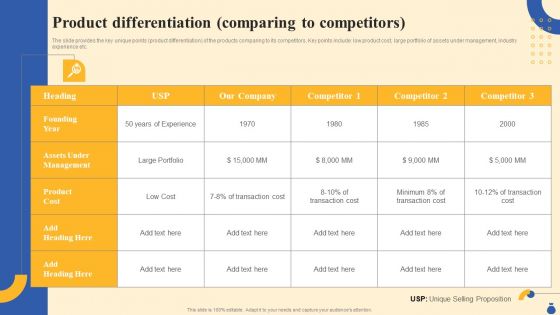
Equity Funding And Debt Financing Pitchbook Product Differentiation Comparing Diagrams PDF
The slide provides the key unique points product differentiation of the products comparing to its competitors. Key points include low product cost, large portfolio of assets under management, industry experience etc. The Equity Funding And Debt Financing Pitchbook Product Differentiation Comparing Diagrams PDF is a compilation of the most recent design trends as a series of slides. It is suitable for any subject or industry presentation, containing attractive visuals and photo spots for businesses to clearly express their messages. This template contains a variety of slides for the user to input data, such as structures to contrast two elements, bullet points, and slides for written information. Slidegeeks is prepared to create an impression.
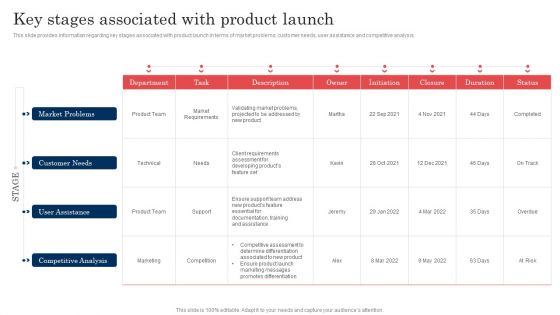
Commodity Launch Administration Playbook Key Stages Associated With Product Diagrams PDF
This slide provides information regarding key stages associated with product marketing launch plan in terms of reference and planning, positioning and messaging, PR and web. The Commodity Launch Administration Playbook Key Stages Associated With Product Diagrams PDF is a compilation of the most recent design trends as a series of slides. It is suitable for any subject or industry presentation, containing attractive visuals and photo spots for businesses to clearly express their messages. This template contains a variety of slides for the user to input data, such as structures to contrast two elements, bullet points, and slides for written information. Slidegeeks is prepared to create an impression.
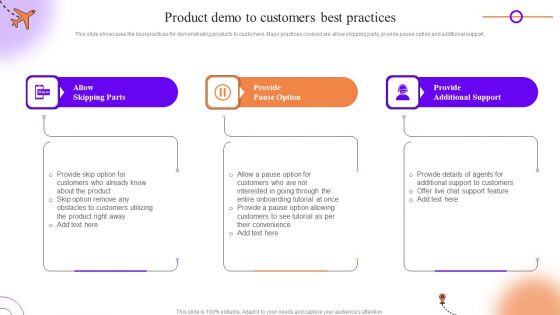
Client Onboarding Journey Impact On Business Product Demo To Customers Best Practices Diagrams PDF
This slide showcases the best practices for demonstrating products to customers. Major practices covered are allow skipping parts, provide pause option and additional support. The Client Onboarding Journey Impact On Business Product Demo To Customers Best Practices Diagrams PDF is a compilation of the most recent design trends as a series of slides. It is suitable for any subject or industry presentation, containing attractive visuals and photo spots for businesses to clearly express their messages. This template contains a variety of slides for the user to input data, such as structures to contrast two elements, bullet points, and slides for written information. Slidegeeks is prepared to create an impression.
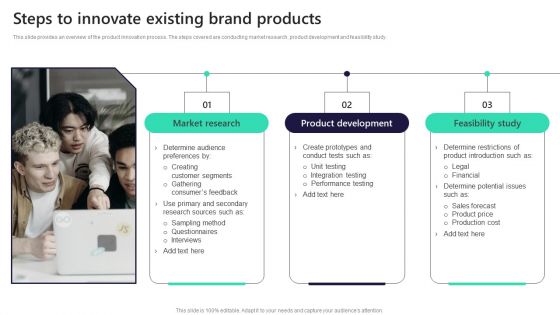
Leveraging Market Penetration For Increased Awareness Steps To Innovate Existing Brand Diagrams PDF
This slide provides an overview of the product innovation process. The steps covered are conducting market research, product development and feasibility study. The Leveraging Market Penetration For Increased Awareness Steps To Innovate Existing Brand Diagrams PDF is a compilation of the most recent design trends as a series of slides. It is suitable for any subject or industry presentation, containing attractive visuals and photo spots for businesses to clearly express their messages. This template contains a variety of slides for the user to input data, such as structures to contrast two elements, bullet points, and slides for written information. Slidegeeks is prepared to create an impression.

Effective Go To Marketing Strategies Beverage Vending Machine Business Plan Go To Market Strategy Diagrams Pdf
The purpose of this slide is to implement an effective go to market strategy for bringing vending start up services to an end customer taking into consideration elements like sales, positioning, and price. The Effective Go To Marketing Strategies Beverage Vending Machine Business Plan Go To Market Strategy Diagrams Pdf is a compilation of the most recent design trends as a series of slides. It is suitable for any subject or industry presentation, containing attractive visuals and photo spots for businesses to clearly express their messages. This template contains a variety of slides for the user to input data, such as structures to contrast two elements, bullet points, and slides for written information. Slidegeeks is prepared to create an impression.
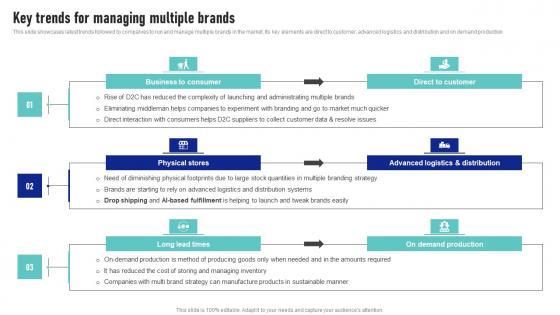
Key Trends For Managing Multiple Brands Launching New Product Brand Diagrams Pdf
This slide showcases latest trends followed by companies to run and manage multiple brands in the market. Its key elements are direct to customer, advanced logistics and distribution and on demand production The Key Trends For Managing Multiple Brands Launching New Product Brand Diagrams Pdf is a compilation of the most recent design trends as a series of slides. It is suitable for any subject or industry presentation, containing attractive visuals and photo spots for businesses to clearly express their messages. This template contains a variety of slides for the user to input data, such as structures to contrast two elements, bullet points, and slides for written information. Slidegeeks is prepared to create an impression.

Target Audience Analysis Driving Business Success By Hosting Experiential Diagrams Pdf
This slide showcases target audience analysis and sample persona which can be used by companies focusing on customer experience. It provides details about age group, occupation, locality, goals, behavior, motivations, frustrations, etc. The Target Audience Analysis Driving Business Success By Hosting Experiential Diagrams Pdf is a compilation of the most recent design trends as a series of slides. It is suitable for any subject or industry presentation, containing attractive visuals and photo spots for businesses to clearly express their messages. This template contains a variety of slides for the user to input data, such as structures to contrast two elements, bullet points, and slides for written information. Slidegeeks is prepared to create an impression.
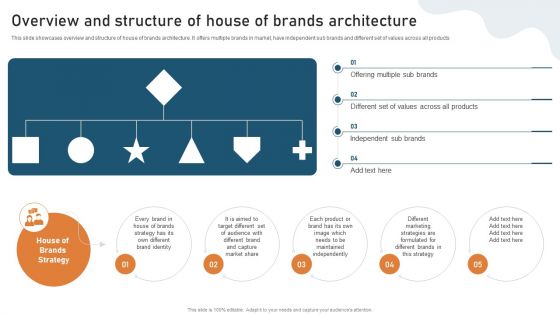
Targeted Market Entry Strategy Overview And Structure Of House Of Brands Architecture Diagrams PDF
This slide showcases overview and structure of house of brands architecture. It offers multiple brands in market, have independent sub brands and different set of values across all products. The Targeted Market Entry Strategy Overview And Structure Of House Of Brands Architecture Diagrams PDF is a compilation of the most recent design trends as a series of slides. It is suitable for any subject or industry presentation, containing attractive visuals and photo spots for businesses to clearly express their messages. This template contains a variety of slides for the user to input data, such as structures to contrast two elements, bullet points, and slides for written information. Slidegeeks is prepared to create an impression.
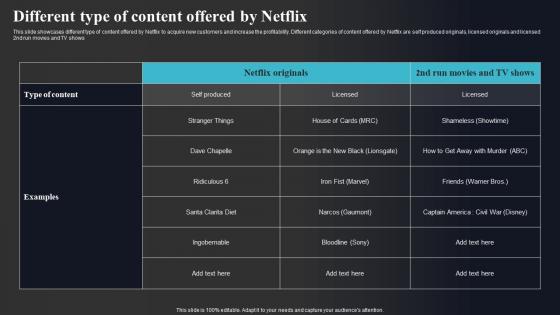
Different Type Of Content Offered By Netflix Enhancing Online Visibility Diagrams Pdf
This slide showcases different type of content offered by Netflix to acquire new customers and increase the profitability. Different categories of content offered by Netflix are self produced originals, licensed originals and licensed 2nd run movies and TV shows The Different Type Of Content Offered By Netflix Enhancing Online Visibility Diagrams Pdf is a compilation of the most recent design trends as a series of slides. It is suitable for any subject or industry presentation, containing attractive visuals and photo spots for businesses to clearly express their messages. This template contains a variety of slides for the user to input data, such as structures to contrast two elements, bullet points, and slides for written information. Slidegeeks is prepared to create an impression.
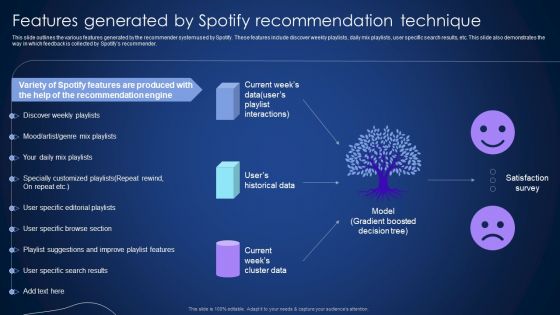
Features Generated By Spotify Recommendation Technique Integrating Recommender System To Enhance Diagrams PDF
This slide outlines the various features generated by the recommender system used by Spotify. These features include discover weekly playlists, daily mix playlists, user specific search results, etc. This slide also demonstrates the way in which feedback is collected by Spotifys recommender.The Features Generated By Spotify Recommendation Technique Integrating Recommender System To Enhance Diagrams PDF is a compilation of the most recent design trends as a series of slides. It is suitable for any subject or industry presentation, containing attractive visuals and photo spots for businesses to clearly express their messages. This template contains a variety of slides for the user to input data, such as structures to contrast two elements, bullet points, and slides for written information. Slidegeeks is prepared to create an impression.

AI Chatbot Case Study Decathlon AI Bot Application For Various Industries Diagrams Pdf
This slide showcases Decathlon case study that leveraged AI chatbot for increasing sales and acquire new customers. Key elements of this case study are business requirement, solutions implemented and results generated The AI Chatbot Case Study Decathlon AI Bot Application For Various Industries Diagrams Pdf is a compilation of the most recent design trends as a series of slides. It is suitable for any subject or industry presentation, containing attractive visuals and photo spots for businesses to clearly express their messages. This template contains a variety of slides for the user to input data, such as structures to contrast two elements, bullet points, and slides for written information. Slidegeeks is prepared to create an impression.
Near Field Communication NFC Maximizing Efficiency With Asset Tracking Solutions Diagrams Pdf
This slide covers near field communication technology for effective asset management and enhanced customer service. It involves operation modes of device such as reader, card emulation and peer to peer mode. The Near Field Communication NFC Maximizing Efficiency With Asset Tracking Solutions Diagrams Pdf is a compilation of the most recent design trends as a series of slides. It is suitable for any subject or industry presentation, containing attractive visuals and photo spots for businesses to clearly express their messages. This template contains a variety of slides for the user to input data, such as structures to contrast two elements, bullet points, and slides for written information. Slidegeeks is prepared to create an impression.

Outsource Bookkeeping Service Manage Financial Transactions Account Outsourcing Approach Of The Company Diagrams PDF
Presenting this set of slides with name outsource bookkeeping service manage financial transactions account outsourcing approach of the company diagrams pdf. The topics discussed in these slides are data input, data output, data transfer, data processing, quality control. This is a completely editable PowerPoint presentation and is available for immediate download. Download now and impress your audience.

Parallel Computing Processing Single Instruction And Single Data Stream SISD Diagrams PDF
This slide represents the single instruction and single data stream type of parallel processing, including components such as a control unit, a processing element, memory, input, and output. It also includes how commands are carried out in this type of processing. Deliver and pitch your topic in the best possible manner with this Parallel Computing Processing Single Instruction And Single Data Stream SISD Diagrams PDF. Use them to share invaluable insights on Parallel Processing, Execution Phases, Processor Unit and impress your audience. This template can be altered and modified as per your expectations. So, grab it now.

Artificial Intelligence Transformation Playbook Stage Three Selection Of Right Solution Diagrams PDF
This slide shows stage three of five stage process, businesses can use it to ensure that they are selecting the best fit technology. Elements covered are objective, inputs, business need, key activities, participants and outputs. Presenting artificial intelligence transformation playbook stage three selection of right solution diagrams pdf to provide visual cues and insights. Share and navigate important information on three stages that need your due attention. This template can be used to pitch topics like behavioral scientists, smes. In addtion, this PPT design contains high resolution images, graphics, etc, that are easily editable and available for immediate download.
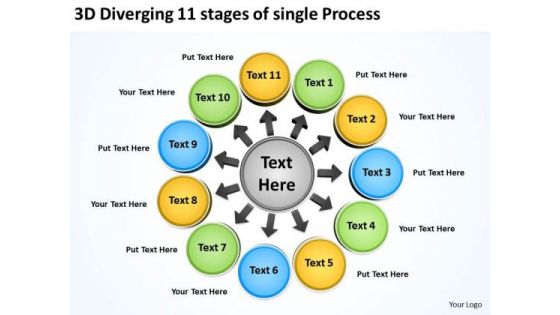
3d Diverging 11 Stages Of Single Process Ppt Charts And Diagrams PowerPoint Templates
We present our 3d diverging 11 stages of single process ppt Charts and Diagrams PowerPoint templates.Use our Circle Charts PowerPoint Templates because it is a step by step process with levels rising at every stage. Use our Arrows PowerPoint Templates because this PPt slide can educate your listeners on the relevance and importance of each one as per your plan and how they all contribute as you strive to hit the Bullseye. Download our Business PowerPoint Templates because The foundation of the structure of your business is resilient and dependable. Convey this confidence to your colleagues and assure them of a great and enduring future. Download our Shapes PowerPoint Templates because others naturally tend to follow in the path blazed by you. Present our Flow Charts PowerPoint Templates because our PowerPoint templates designed for your ideas to sell.Use these PowerPoint slides for presentations relating to advice, analysis, analyze, background, blank, business, center, central, chalk, component, concept, connection, core, counter, deploy, diagram, distribute, draw, education, element, exchange, flow, gather, industry, input, join, link, management, manager, output, people, person, plan, process, reaction, strategy, support, surround, teamwork. The prominent colors used in the PowerPoint template are Yellow, Green, Blue. Customers tell us our 3d diverging 11 stages of single process ppt Charts and Diagrams PowerPoint templates are Liberated. PowerPoint presentation experts tell us our analyze PowerPoint templates and PPT Slides are Ultra. People tell us our 3d diverging 11 stages of single process ppt Charts and Diagrams PowerPoint templates are topically designed to provide an attractive backdrop to any subject. People tell us our background PowerPoint templates and PPT Slides will help you be quick off the draw. Just enter your specific text and see your points hit home. Customers tell us our 3d diverging 11 stages of single process ppt Charts and Diagrams PowerPoint templates are Fashionable. People tell us our center PowerPoint templates and PPT Slides are Enchanting.
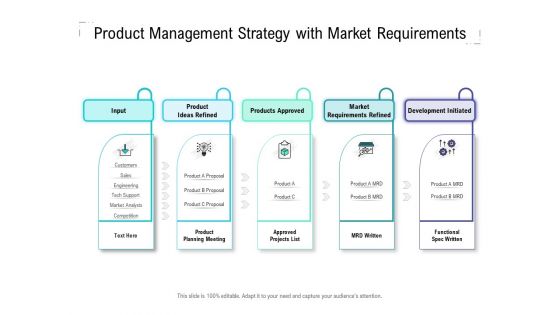
Product Management Strategy With Market Requirements Ppt PowerPoint Presentation Layouts Diagrams
Presenting this set of slides with name product management strategy with market requirements ppt powerpoint presentation layouts diagr. This is a five stage process. The stages in this process are input, product idea refined, products approved, market requirements refined, development initiated. This is a completely editable PowerPoint presentation and is available for immediate download. Download now and impress your audience.
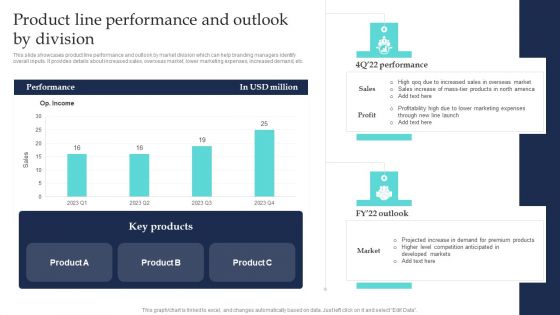
Commodity Line Extension Techniques Product Line Performance And Outlook By Division Diagrams PDF
This slide showcases product line performance and outlook by market division which can help branding managers identify overall inputs. It provides details about increased sales, overseas market, lower marketing expenses, increased demand, etc. Do you have to make sure that everyone on your team knows about any specific topic I yes, then you should give Commodity Line Extension Techniques Product Line Performance And Outlook By Division Diagrams PDF a try. Our experts have put a lot of knowledge and effort into creating this impeccable Commodity Line Extension Techniques Product Line Performance And Outlook By Division Diagrams PDF. You can use this template for your upcoming presentations, as the slides are perfect to represent even the tiniest detail. You can download these templates from the Slidegeeks website and these are easy to edit. So grab these today.

 Home
Home