Infographic Circular
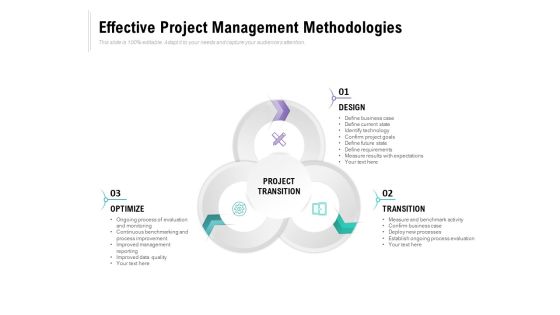
Effective Project Management Methodologies Ppt PowerPoint Presentation Ideas Infographics
Presenting this set of slides with name effective project management methodologies ppt powerpoint presentation ideas infographics. This is a three stage process. The stages in this process are project transition, optimize, transition, design. This is a completely editable PowerPoint presentation and is available for immediate download. Download now and impress your audience.

Components Of Marketing Information System Ppt PowerPoint Presentation Slides Infographics
Presenting this set of slides with name components of marketing information system ppt powerpoint presentation slides infographics. This is a five stage process. The stages in this process are maintaining consistency, timing it important, ensuring accuracy, update and maintain database, management team. This is a completely editable PowerPoint presentation and is available for immediate download. Download now and impress your audience.

Team Building Experiences Ppt PowerPoint Presentation File Infographics
Presenting this set of slides with name team building experiences ppt powerpoint presentation file infographics. This is an editable Powerpoint five stages graphic that deals with topics like team building experiences to help convey your message better graphically. This product is a premium product available for immediate download, and is 100 percent editable in Powerpoint. Download this now and use it in your presentations to impress your audience.

Business Classification By Industry Sectors Ppt PowerPoint Presentation Inspiration Infographics
Presenting this set of slides with name business classification by industry sectors ppt powerpoint presentation inspiration infographics. This is a four stage process. The stages in this process are application, mobile screen, business transformation. This is a completely editable PowerPoint presentation and is available for immediate download. Download now and impress your audience.

Business Infographics Cycle Of Five Steps Powerpoint Template
Our above business slide has been designed with cycle diagram of five options. This slide is suitable to present business management and strategy. Use our creative PowerPoint template to lay down your views.

Interviewing Tips Managers Ppt PowerPoint Presentation Show Infographics Cpb
Presenting this set of slides with name interviewing tips managers ppt powerpoint presenta. This is an editable Powerpoint four stages graphic that deals with topics like interviewing tips managers to help convey your message better graphically. This product is a premium product available for immediate download and is 100 percent editable in Powerpoint. Download this now and use it in your presentations to impress your audience.
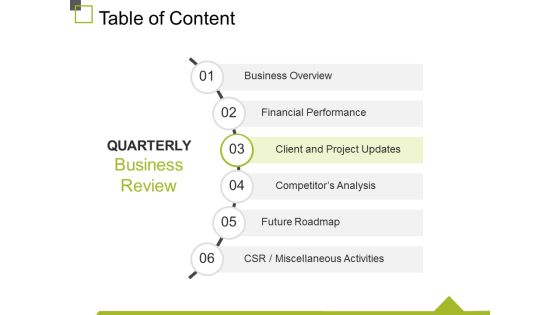
Table Of Content Template 4 Ppt PowerPoint Presentation Infographics Maker
This is a table of content template 1 ppt powerpoint presentation outline template. This is a six stage process. The stages in this process are business overview, financial performance, client and project updates, competitor s analysis, future roadmap.

Business Strategies Ppt PowerPoint Presentation Infographics Layout Cpb
This is a Business Strategies Ppt PowerPoint Presentation Outline Display Cpb. This is a six stage process. The stages in this process are Business Strategies.

Competitive And Market Analysis Ppt PowerPoint Presentation Infographics Pictures
This is a competitive and market analysis ppt powerpoint presentation infographics pictures. This is a seven stage process. The stages in this process are market size, market segments, customer mix, competition influence, competitors, spending group, market analysis, market share.

Mind Map Ppt PowerPoint Presentation Infographics Design Inspiration
This is a mind map ppt powerpoint presentation infographics design inspiration. This is a four stage process. The stages in this process are mind map, process, ideas, business, marketing.
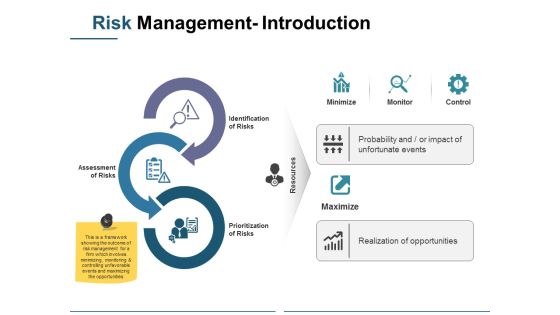
Risk Management Introduction Ppt PowerPoint Presentation Infographics Design Inspiration
This is a risk management introduction ppt powerpoint presentation infographics design inspiration. This is a three stage process. The stages in this process are prioritization of risks, assessment of risks, identification of risks, minimize, monitor.
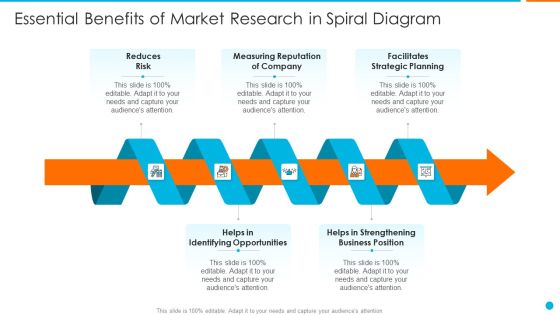
Essential Benefits Of Market Research In Spiral Diagram Infographics PDF
Persuade your audience using this essential benefits of market research in spiral diagram infographics pdf. This PPT design covers five stages, thus making it a great tool to use. It also caters to a variety of topics including reduces risk, measuring reputation of company, facilitates strategic planning, helps in identifying opportunities, helps in strengthening business position. Download this PPT design now to present a convincing pitch that not only emphasizes the topic but also showcases your presentation skills.

Digital Marketing Process For Insurance Companies Infographics PDF
This slide shows digital marketing process for insurance companies which contains messaging, search optimization, authority, conversion, visibility, trust and lead generation. Presenting Digital Marketing Process For Insurance Companies Infographics PDF to dispense important information. This template comprises seven stages. It also presents valuable insights into the topics including Search Optimization, Lead Generation, Conversion. This is a completely customizable PowerPoint theme that can be put to use immediately. So, download it and address the topic impactfully.

Four Option Infographics Circle With Globe Powerpoint Template
Download this exclusive business diagram to present ideas of global business management. This PPT slide contains four option infographic circles with globe. This diagram can be used for business related presentations.
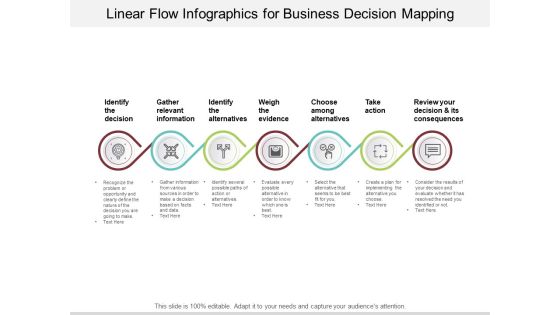
Linear Flow Infographics For Business Decision Mapping Ppt PowerPoint Presentation Infographics Graphics Example
Presenting this set of slides with name linear flow infographics for business decision mapping ppt powerpoint presentation infographics graphics example. This is a seven stage process. The stages in this process are decision making slides, strategic decision, business decision. This is a completely editable PowerPoint presentation and is available for immediate download. Download now and impress your audience.
Seven Steps Concentric Circles Process With Icons Ppt Powerpoint Presentation Infographics Introduction
This is a seven steps concentric circles process with icons ppt powerpoint presentation infographics introduction. This is a seven stage process. The stages in this process are 7 concentric circles, 7 circular cycle, 7 circular diagram.
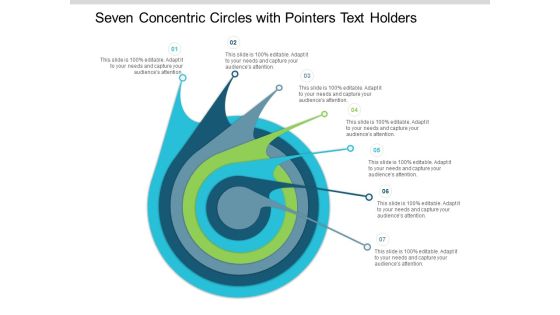
Seven Concentric Circles With Pointers Text Holders Ppt Powerpoint Presentation Infographics Visual Aids
This is a seven concentric circles with pointers text holders ppt powerpoint presentation infographics visual aids. This is a seven stage process. The stages in this process are 7 concentric circles, 7 circular cycle, 7 circular diagram.
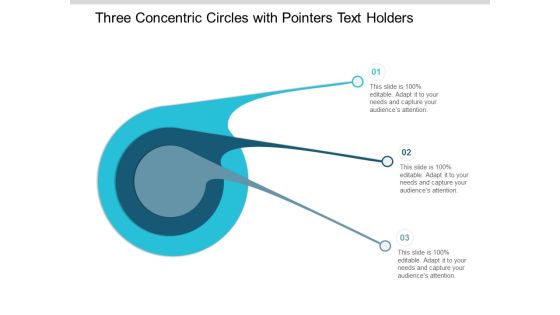
Three Concentric Circles With Pointers Text Holders Ppt Powerpoint Presentation Infographics Slides
This is a three concentric circles with pointers text holders ppt powerpoint presentation infographics slides. This is a three stage process. The stages in this process are 7 concentric circles, 7 circular cycle, 7 circular diagram.
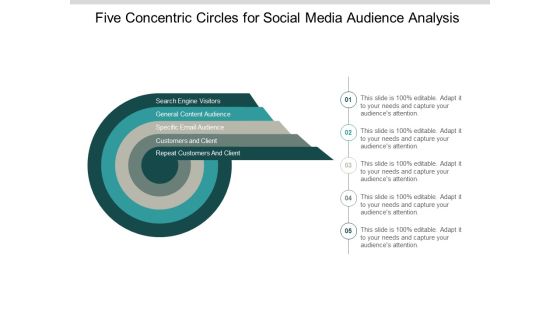
Five Concentric Circles For Social Media Audience Analysis Ppt PowerPoint Presentation Infographics File Formats
This is a Five Concentric Circles For Social Media Audience Analysis Ppt PowerPoint Presentation Infographics File Formats. This is a stage process. The stages in this process are 7 concentric circles, 7 circular cycle, 7 circular diagram.

Six Concentric Circles With Outward Pointers And Text Holders Ppt Powerpoint Presentation Infographics Information
This is a six concentric circles with outward pointers and text holders ppt powerpoint presentation infographics information. This is a stage process. The stages in this process are 7 concentric circles, 7 circular cycle, 7 circular diagram.
Four Arrows With Icons For Business Process Flow Ppt Powerpoint Presentation Infographics File Formats
This is a four arrows with icons for business process flow ppt powerpoint presentation infographics file formats. This is a four stage process. The stages in this process are 6 Circular Arrows, 6 Cyclic Arrows, Six Circular Arrows.
Four Arrows Around Target Board With Icons Ppt Powerpoint Presentation Infographics Picture
This is a four arrows around target board with icons ppt powerpoint presentation infographics picture. This is a four stage process. The stages in this process are 6 Circular Arrows, 6 Cyclic Arrows, Six Circular Arrows.
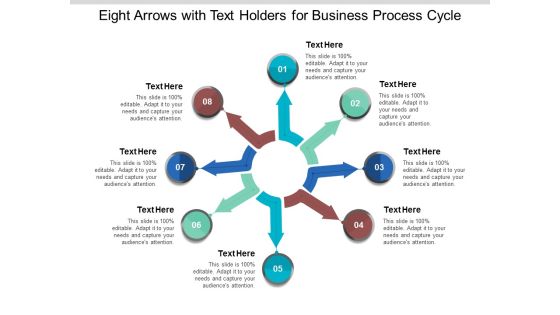
Eight Arrows With Text Holders For Business Process Cycle Ppt Powerpoint Presentation Infographics Example Introduction
This is a eight arrows with text holders for business process cycle ppt powerpoint presentation infographics example introduction. This is a eight stage process. The stages in this process are 6 circular arrows, 6 cyclic arrows, six circular arrows.

Buying Process Brand Awareness And Evaluation Of Alternatives Ppt PowerPoint Presentation Infographics Graphics Tutorials
This is a buying process brand awareness and evaluation of alternatives ppt powerpoint presentation infographics graphics tutorials. This is a five stage process. The stages in this process are purchasing process, purchasing cycle, procurement cycle.

Continuous Series Of Business Steps Ppt PowerPoint Presentation Infographics Templates
This is a continuous series of business steps ppt powerpoint presentation infographics templates. This is a six stage process. The stages in this process are circular, continuity, continuum.
Personality Traits Percentage Scale Ppt PowerPoint Presentation Infographics Icon
This is a personality traits percentage scale ppt powerpoint presentation infographics icon. This is a six stage process. The stages in this process are circular, continuity, continuum.

The Problem Template 1 Ppt PowerPoint Presentation Infographics Background
This is a the problem template 1 ppt powerpoint presentation infographics background. This is a one stage process. The stages in this process are strategy, business, process, circular.
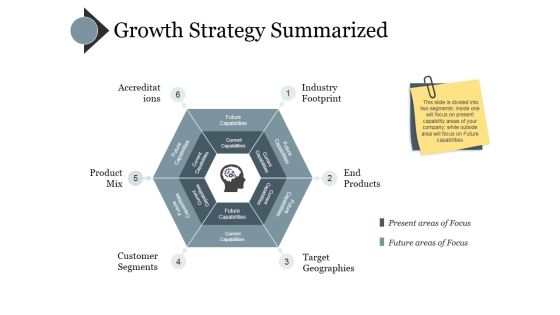
Growth Strategy Summarized Ppt PowerPoint Presentation Infographics Example Introduction
This is a growth strategy summarized ppt powerpoint presentation infographics example introduction. This is a six stage process. The stages in this process are future capabilities, current capabilities.
Talent Acquisition Icon Ppt PowerPoint Presentation Infographics Good
This is a talent acquisition icon ppt powerpoint presentation infographics good. This is a six stage process. The stages in this process are talent acquisition icon, human resource management icon, talent management icon, hr icon.
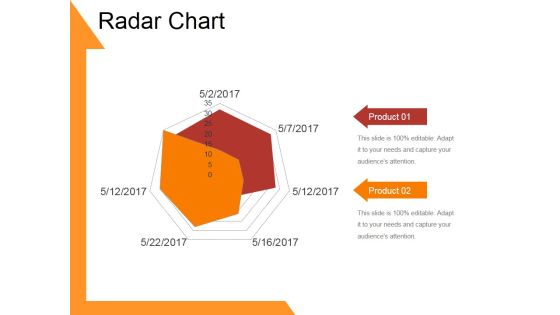
Radar Chart Template 1 Ppt PowerPoint Presentation Infographics Designs
This is a radar chart template 1 ppt powerpoint presentation infographics designs. This is a two stage process. The stages in this process are business, strategy, analysis, pretention, radar chart.
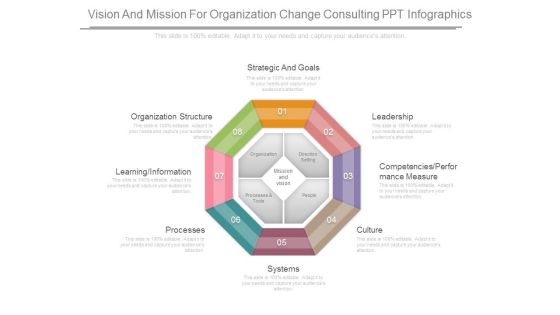
Vision And Mission For Organization Change Consulting Ppt Infographics
This is a vision and mission for organization change consulting ppt infographics. This is a eight stage process. The stages in this process are strategic and goals, leadership , culture , systems , processes , organization, structure , organization, direction setting.

Kaizen Ideas For Quality Improvement Ppt Powerpoint Presentation Infographics Graphics
Presenting this set of slides with name kaizen ideas for quality improvement ppt powerpoint presentation infographics graphics. This is a six stage process. The stages in this process are kaizen umbrella, continuous improvement, business process. This is a completely editable PowerPoint presentation and is available for immediate download. Download now and impress your audience.

Sprint Planning In Agile Project Management Ppt PowerPoint Presentation Infographics Sample
This is a sprint planning in agile project management ppt powerpoint presentation infographics sample. This is a six stage process. The stages in this process are agile cycle, sprint cycle, scrum cycle.
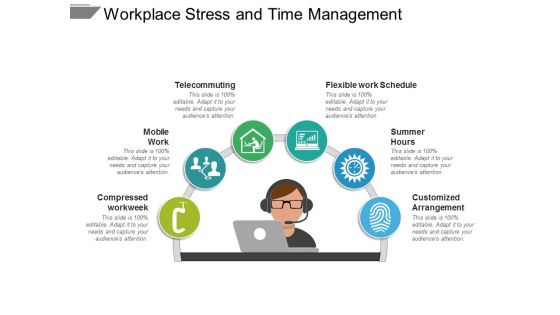
Workplace Stress And Time Management Ppt PowerPoint Presentation Infographics Designs Download
This is a workplace stress and time management ppt powerpoint presentation infographics designs download. This is a six stage process. The stages in this process are work life balance, work and leisure, career and ambition.

Data Exploration And Visualization Virtual Machine Ppt PowerPoint Presentation Infographics Diagrams
This is a data exploration and visualization virtual machine ppt powerpoint presentation infographics diagrams. This is a seven stage process. The stages in this process are data, analysis, data science, information science.

Economic Cost Efficiency Optimize The Resources Ppt PowerPoint Presentation Infographics Model
This is a economic cost efficiency optimize the resources ppt powerpoint presentation infographics model. This is a five stage process. The stages in this process are cost planning, cost efficiency, cost organization.
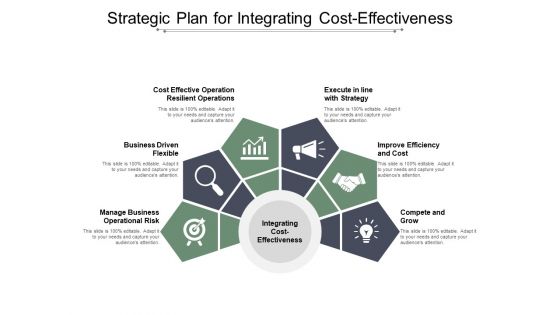
Strategic Plan For Integrating Cost Effectiveness Ppt PowerPoint Presentation Infographics Example
This is a strategic plan for integrating cost effectiveness ppt powerpoint presentation infographics example. This is a six stage process. The stages in this process are cost planning, cost efficiency, cost organization.
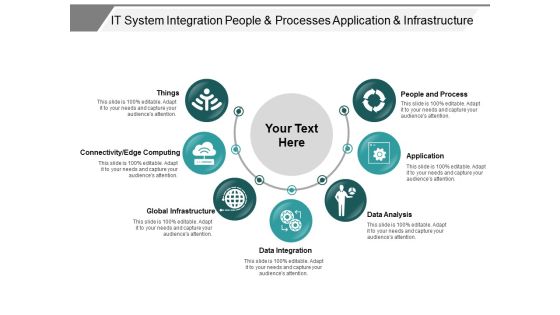
It System Integration People And Processes Application And Infrastructure Ppt PowerPoint Presentation Infographics Graphic Tips
This is a it system integration people and processes application and infrastructure ppt powerpoint presentation infographics graphic tips. This is a seven stage process. The stages in this process are osi model, technology layers, internetworking layer.
Three Stages Scp Paradigm With Icons Ppt Powerpoint Presentation Infographics Graphics
This is a three stages scp paradigm with icons ppt powerpoint presentation infographics graphics. This is a three stage process. The stages in this process are performance management, structure conduct performance, performance review and analysis.
Sperm With Male Female Icon Ppt Powerpoint Presentation Infographics Background Image
This is a sperm with male female icon ppt powerpoint presentation infographics background image. This is a two stage process. The stages in this process are fertility, productiveness, fecundity.
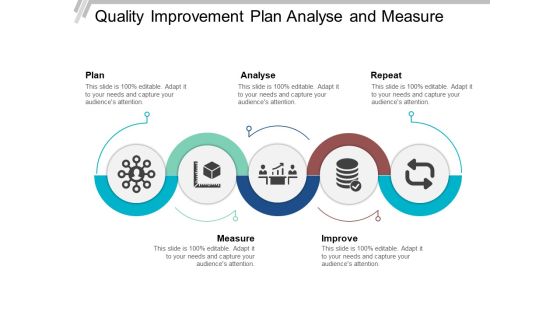
Quality Improvement Plan Analyse And Measure Ppt PowerPoint Presentation Infographics Picture
This is a quality improvement plan analyse and measure ppt powerpoint presentation infographics picture. This is a five stage process. The stages in this process are quality roadmap, quality timeline, quality linear process.
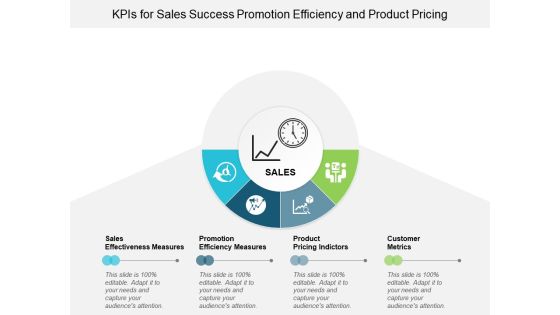
Kpis For Sales Success Promotion Efficiency And Product Pricing Ppt Powerpoint Presentation Infographics Background Images
This is a kpis for sales success promotion efficiency and product pricing ppt powerpoint presentation infographics background images. This is a four stage process. The stages in this process are dashboard, kpi, metrics.

Factors Affecting Work Performance Communication And Cooperation Ppt Powerpoint Presentation Infographics Introduction
This is a factors affecting work performance communication and cooperation ppt powerpoint presentation infographics introduction. This is a four stage process. The stages in this process are business outcomes, business results, business output.
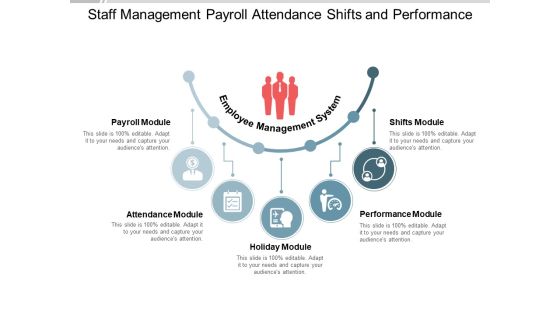
Staff Management Payroll Attendance Shifts And Performance Ppt PowerPoint Presentation Infographics Ideas
This is a staff management payroll attendance shifts and performance ppt powerpoint presentation infographics ideas. This is a five stage process. The stages in this process are employee information system, staff management system.
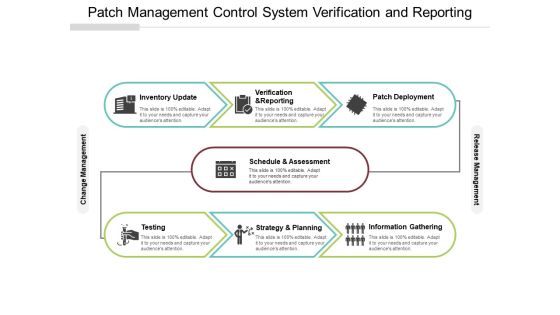
Patch Management Control System Verification And Reporting Ppt PowerPoint Presentation Infographics Backgrounds
This is a patch management control system verification and reporting ppt powerpoint presentation infographics backgrounds. This is a seven stage process. The stages in this process are patch management process, patch management procedure, patch management approach.

Ways To Promote Healthy Work Life Balance For Employees Ppt PowerPoint Presentation Infographics Example
This is a ways to promote healthy work life balance for employees ppt powerpoint presentation infographics example. This is a five stage process. The stages in this process are work life balance, work and leisure, career and ambition.

Downward Arrow On Bar Graph For Financial Loss Ppt PowerPoint Presentation Infographics Sample
This is a downward arrow on bar graph for financial loss ppt powerpoint presentation infographics sample. This is a three stage process. The stages in this process are business failure, unsuccessful business, business non success.

Implementing Clm Negotiate Approve Track And Renew Ppt PowerPoint Presentation Infographics Objects
This is a implementing clm negotiate approve track and renew ppt powerpoint presentation infographics objects. This is a eight stage process. The stages in this process are contract management, contract negotiation, deal making.
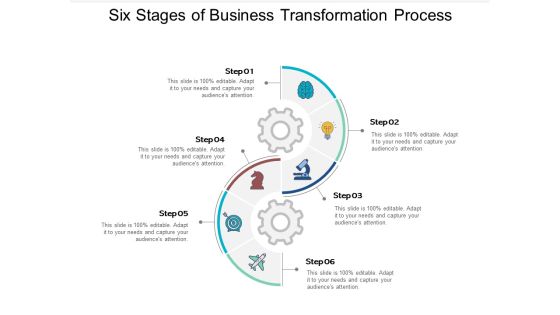
Six Stages Of Business Transformation Process Ppt PowerPoint Presentation Infographics Model
This is a six stages of business transformation process ppt powerpoint presentation infographics model. This is a six stage process. The stages in this process are 6 steps, 6 phases, 6 segments.

Internal Customer Satisfaction Responsibilities And Negotiated Priorities Ppt PowerPoint Presentation Infographics Aids
This is a internal customer satisfaction responsibilities and negotiated priorities ppt powerpoint presentation infographics aids. This is a four stage process. The stages in this process are internal customer services, internal customer satisfaction, internal customer management.
Three Arrows On Circle For Continuous Deployment Icon Ppt PowerPoint Presentation Infographics Example File
Presenting this set of slides with name three arrows on circle for continuous deployment icon ppt powerpoint presentation infographics example file. This is a three stage process. The stages in this process are continuous integration, continuous deployment, continuous deployment. This is a completely editable PowerPoint presentation and is available for immediate download. Download now and impress your audience.
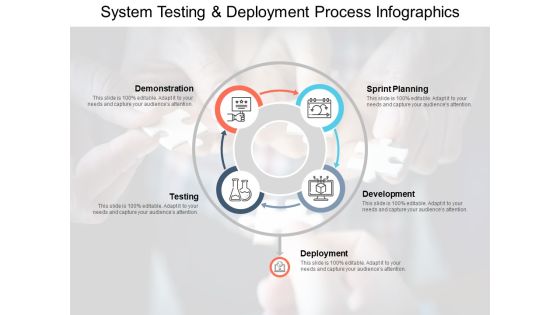
System Testing And Deployment Process Infographics Ppt PowerPoint Presentation File Visual Aids
Presenting this set of slides with name system testing and deployment process infographics ppt powerpoint presentation file visual aids. This is a four stage process. The stages in this process are software implementation, application development, implementation develop. This is a completely editable PowerPoint presentation and is available for immediate download. Download now and impress your audience.
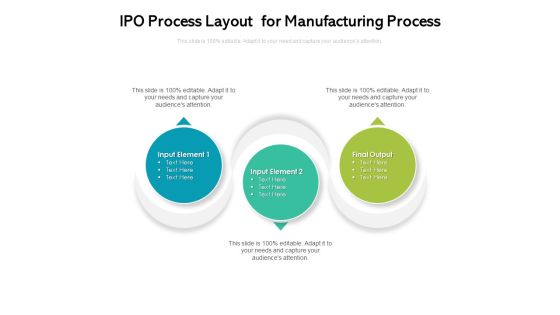
IPO Process Layout For Manufacturing Process Ppt PowerPoint Presentation Infographics Example Topics PDF
Presenting ipo process layout for manufacturing process ppt powerpoint presentation infographics example topics pdf to dispense important information. This template comprises three stages. It also presents valuable insights into the topics including input element. This is a completely customizable PowerPoint theme that can be put to use immediately. So, download it and address the topic impactfully.

Boosting Product Sales Through Branding Why Branding Strategy Is Important Infographics PDF
This slide focuses on the importance of branding strategy for company which includes communicates value proposition, develops trust and loyalty, differentiates company from competitors, boosts value, etc. Get a simple yet stunning designed Boosting Product Sales Through Branding Why Branding Strategy Is Important Infographics PDF. It is the best one to establish the tone in your meetings. It is an excellent way to make your presentations highly effective. So, download this PPT today from Slidegeeks and see the positive impacts. Our easy-to-edit Boosting Product Sales Through Branding Why Branding Strategy Is Important Infographics PDF can be your go-to option for all upcoming conferences and meetings. So, what are you waiting for Grab this template today.

Steps Involved In Devops Process And Methodology Ppt Infographics Designs Download PDF
This slide provides the glimpse about the steps involved in DevOps process and methodology which focuses on plan, code, build, test, package, release, operate and monitor. Whether you have daily or monthly meetings, a brilliant presentation is necessary. Steps Involved In Devops Process And Methodology Ppt Infographics Designs Download PDF can be your best option for delivering a presentation. Represent everything in detail using Steps Involved In Devops Process And Methodology Ppt Infographics Designs Download PDF and make yourself stand out in meetings. The template is versatile and follows a structure that will cater to your requirements. All the templates prepared by Slidegeeks are easy to download and edit. Our research experts have taken care of the corporate themes as well. So, give it a try and see the results.

Role Of Insider Threat In Cyber Security Management Technologies In Banking Industry Infographics PDF
This slide shows role of insider threat management technologies in banking industry. It provides information about identifying user risk, protecting from data loss and accelerating threat response. Presenting Role Of Insider Threat In Cyber Security Management Technologies In Banking Industry Infographics PDF to dispense important information. This template comprises three stages. It also presents valuable insights into the topics including Identifying User Risk, Accelerating Threat Response, Protecting Data Loss. This is a completely customizable PowerPoint theme that can be put to use immediately. So, download it and address the topic impactfully.

Tactics For Medical Equipment Design And Development Ppt Icon Infographics PDF
The following slide showcases tactics to assist in designing and developing medical devices. Common tactics covered are record critical requirements, prototyping and obtaining clinical inputs. Persuade your audience using this Tactics For Medical Equipment Design And Development Ppt Icon Infographics PDF. This PPT design covers three stages, thus making it a great tool to use. It also caters to a variety of topics including Record Critical Requirements, Prototyping Obtain, Clinical Input. Download this PPT design now to present a convincing pitch that not only emphasizes the topic but also showcases your presentation skills.

Major Clients Of Our Brand Strategy Consulting Proposal Ppt PowerPoint Presentation Gallery Infographics PDF
The purpose of this slide is to showcase the most important clients which have worked with our brand consulting firm. It covers information about the total sales generated for clients by offering. Take your presentations to the next level with our Major Clients Of Our Brand Strategy Consulting Proposal Ppt PowerPoint Presentation Gallery Infographics PDF template. With its sleek design and seamless editing features, this single-slide PPT template is a game-changer for professionals who want to make an impact. Impress your audience with stunning visuals and engaging content that will capture their attention from start to finish. Get your hands on our template and elevate your presentations to new heights.

Three Stages Circle Infographics Layout Ppt PowerPoint Presentation File Visuals
Presenting this set of slides with name three stages circle infographics layout ppt powerpoint presentation file visuals. This is a three stage process. The stages in this process are 3 step circle diagram, process infographic, business goals. This is a completely editable PowerPoint presentation and is available for immediate download. Download now and impress your audience.
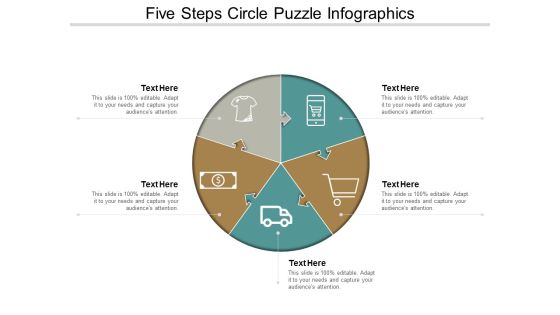
Five Steps Circle Puzzle Infographics Ppt Powerpoint Presentation Professional Structure
This is a five steps circle puzzle infographics ppt powerpoint presentation professional structure. This is a five stage process. The stages in this process are strategy, problem solution, arrow puzzle.

About The Product Template 2 Ppt PowerPoint Presentation Visual Aids Infographics
This is a about the product template 2 ppt powerpoint presentation visual aids infographics. This is a six stage process. The stages in this process are architectural design, originality, quality of product, ideas, cheap price.
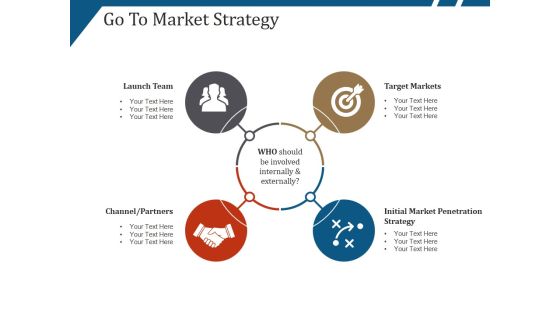
Go To Market Strategy Template 1 Ppt PowerPoint Presentation Pictures Infographics
This is a go to market strategy template 1 ppt powerpoint presentation pictures infographics. This is a four stage process. The stages in this process are launch team, target markets, channel partners.

Business Solutions Tech Savvy Knowledge And Collaboration Ppt PowerPoint Presentation Show Infographics
This is a business solutions tech savvy knowledge and collaboration ppt powerpoint presentation show infographics. This is a six stage process. The stages in this process are guidelines, values, guiding principles.
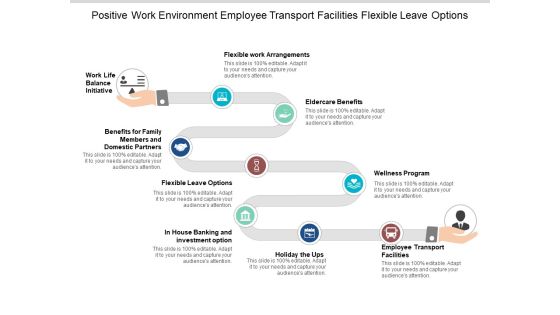
Positive Work Environment Employee Transport Facilities Flexible Leave Options Ppt PowerPoint Presentation File Infographics
This is a positive work environment employee transport facilities flexible leave options ppt powerpoint presentation file infographics. This is a nine stage process. The stages in this process are work life balance, work and leisure, career and ambition.
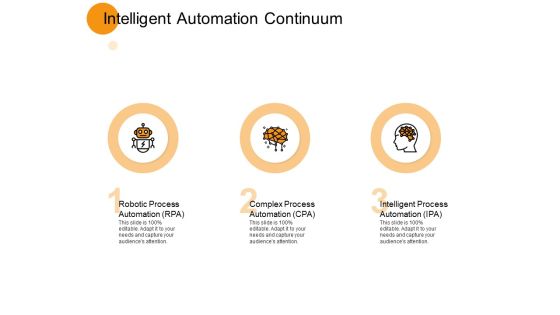
Intelligent Automation Continuum Ppt PowerPoint Presentation Infographics Designs Download
Presenting this set of slides with name intelligent automation continuum ppt powerpoint presentation infographics designs download. This is a three stage process. The stages in this process are robotic process automation, complex process automation, intelligent process automation. This is a completely editable PowerPoint presentation and is available for immediate download. Download now and impress your audience.
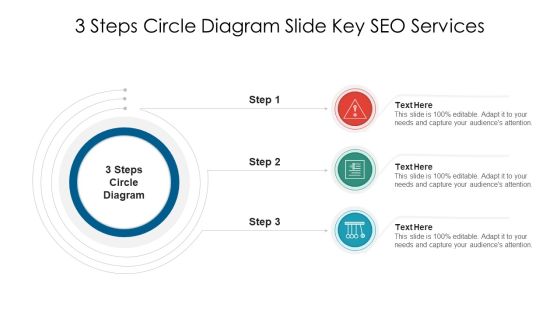
3 Steps Circle Diagram Slide Key SEO Services Infographics PDF
Presenting 3 steps circle diagram slide key seo services infographics pdf to dispense important information. This template comprises three stages. It also presents valuable insights into the topics including 3 steps circle diagram slide key seo services. This is a completely customizable PowerPoint theme that can be put to use immediately. So, download it and address the topic impactfully.

Risks Types Of Outsourcing Fraud Financial And Data Security Ppt PowerPoint Presentation File Example
Presenting this set of slides with name risks types of outsourcing fraud financial and data security ppt powerpoint presentation file example. This is a four stage process. The stages in this process are business process outsourcing, circular infographics, threats. This is a completely editable PowerPoint presentation and is available for immediate download. Download now and impress your audience.

Business Continuity Planners Ppt Powerpoint Presentation Infographics Elements Cpb
This is a business continuity planners ppt powerpoint presentation infographics elements cpb. This is a five stage process. The stages in this process are business continuity planners .
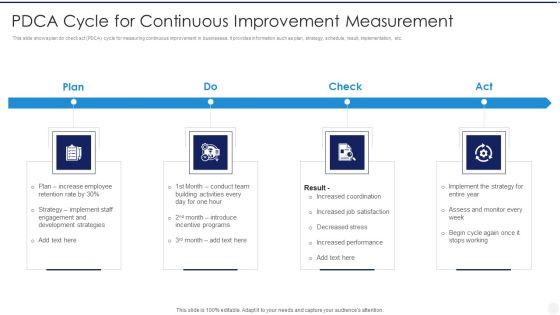
PDCA Cycle For Continuous Improvement Measurement Infographics PDF
Presenting PDCA Cycle For Continuous Improvement Measurement Infographics PDF to dispense important information. This template comprises four stages. It also presents valuable insights into the topics including Increase Employee, Development Strategies, Increased Coordination This is a completely customizable PowerPoint theme that can be put to use immediately. So, download it and address the topic impactfully.

Key Sales Skills With Social Listening Infographics PDF
Persuade your audience using this key sales skills with social listening infographics pdf.This PPT design covers four stages, thus making it a great tool to use. It also caters to a variety of topics including product knowledge, business communication skills, sales demos and social listening. Download this PPT design now to present a convincing pitch that not only emphasizes the topic but also showcases your presentation skills.
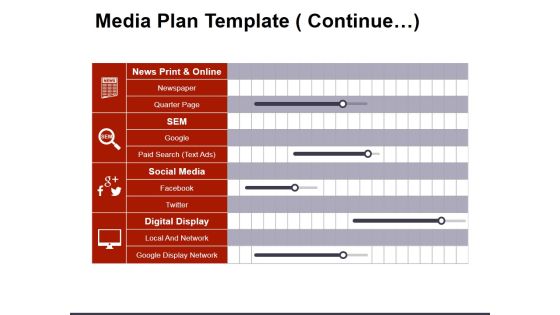
Media Plan Template Continue Ppt PowerPoint Presentation Infographics Graphics Tutorials
This is a media plan template continue ppt powerpoint presentation infographics graphics tutorials. This is a five stage process. The stages in this process are news print and online, newspaper, quarter page, social media, facebook.
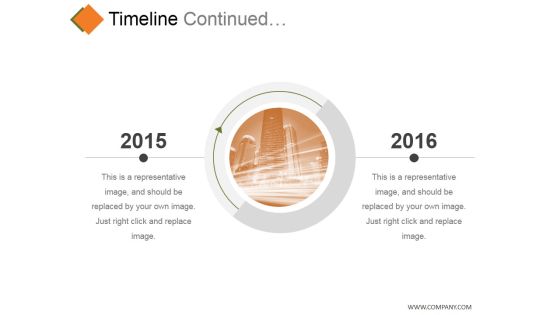
Timeline Continued Template 2 Ppt PowerPoint Presentation Infographics Objects
This is a timeline continued template 2 ppt powerpoint presentation infographics objects. This is a two stage process. The stages in this process are year, growth, success, time planning, business.

the dmadv method ppt powerpoint presentation infographics outfit
This is a the dmadv method ppt powerpoint presentation infographics outfit. This is a five stage process. The stages in this process are dmadv, business, marketing, circle, management.

Donut Pie Chart Ppt PowerPoint Presentation Infographics Summary
This is a donut pie chart ppt powerpoint presentation infographics summary. This is a four stage process. The stages in this process are business, marketing, chart, percentage, process.

My Values Template 1 Ppt PowerPoint Presentation Infographics Information
This is a my values template 1 ppt powerpoint presentation infographics information. This is a six stage process. The stages in this process areprocess, business, marketing, strategy, icons.

Donut Pie Chart Ppt PowerPoint Presentation Infographics Styles
This is a donut pie chart ppt powerpoint presentation infographics styles. This is a six stage process. The stages in this process are chart, percentage, years, business, management.

Fourteen Strategies For Strengthening Customer Relationships In Circles Infographics PDF
Persuade your audience using this Fourteen Strategies For Strengthening Customer Relationships In Circles Infographics PDF. This PPT design covers forteen stages, thus making it a great tool to use. It also caters to a variety of topics including Customers, Innovations, Communicate Changes. Download this PPT design now to present a convincing pitch that not only emphasizes the topic but also showcases your presentation skills.

Continuous Testing Vector Icon Ppt PowerPoint Presentation Infographics Slideshow
Presenting this set of slides with name continuous testing vector icon ppt powerpoint presentation infographics slideshow. The topics discussed in these slides are continuous integration, continuous deployment, continuous deployment. This is a completely editable PowerPoint presentation and is available for immediate download. Download now and impress your audience.

Continual Improvement Model Puzzle Ppt Infographics Graphics PDF
Presenting this set of slides with name continual improvement model puzzle ppt infographics graphics pdf. This is a four stage process. The stages in this process are puzzle. This is a completely editable PowerPoint presentation and is available for immediate download. Download now and impress your audience.
Devops Continuous Delivery Pipeline Ppt Infographics Icons PDF
Deliver an awe inspiring pitch with this creative devops continuous delivery pipeline ppt infographics icons pdf bundle. Topics like version control, deploy to test, deploy to production can be discussed with this completely editable template. It is available for immediate download depending on the needs and requirements of the user.
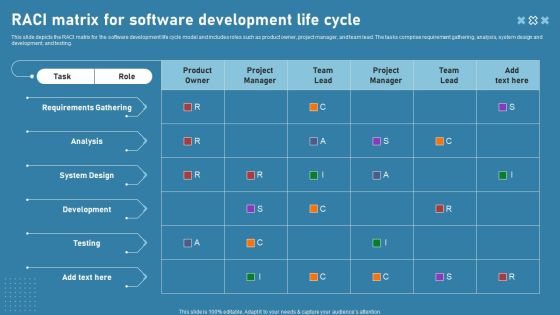
RACI Matrix For Software Development Life Cycle Infographics PDF
This slide depicts the RACI matrix for the software development life cycle model and includes roles such as product owner, project manager, and team lead. The tasks comprise requirement gathering, analysis, system design and development, and testing. Presenting this PowerPoint presentation, titled RACI Matrix For Software Development Life Cycle Infographics PDF, with topics curated by our researchers after extensive research. This editable presentation is available for immediate download and provides attractive features when used. Download now and captivate your audience. Presenting this RACI Matrix For Software Development Life Cycle Infographics PDF. Our researchers have carefully researched and created these slides with all aspects taken into consideration. This is a completely customizable RACI Matrix For Software Development Life Cycle Infographics PDF that is available for immediate downloading. Download now and make an impact on your audience. Highlight the attractive features available with our PPTs.

Current Staff Composition Ppt PowerPoint Presentation Infographics Design Inspiration
This is a current staff composition ppt powerpoint presentation infographics design inspiration. This is a five stage process. The stages in this process are staff composition, business, circle, process, planning.

Resource Capacity Planning Template 1 Ppt PowerPoint Presentation Infographics Topics
This is a resource capacity planning template 1 ppt powerpoint presentation infographics topics. This is a four stage process. The stages in this process are business, pie, planning, process, marketing, strategy.
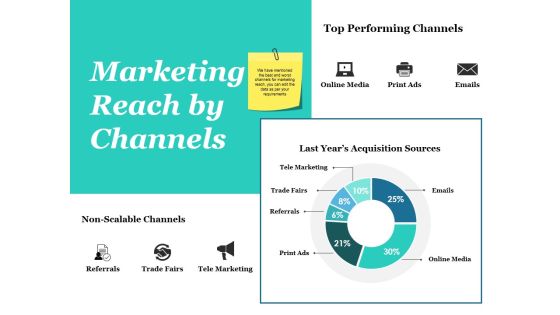
Marketing Reach By Channels Ppt PowerPoint Presentation Infographics Design Templates
This is a marketing reach by channels ppt powerpoint presentation infographics design templates. This is a six stage process. The stages in this process are tele marketing, trade fairs, referrals, business, process.

Business Contracts Forms Ppt PowerPoint Presentation Infographics Microsoft Cpb
This is a business contracts forms ppt powerpoint presentation infographics microsoft cpb. This is a seven stage process. The stages in this process are business contracts forms, marketing, management, business.

Service Continuity Management Ppt PowerPoint Presentation Infographics Pictures Cpb
Presenting this set of slides with name service continuity management ppt powerpoint presentation infographics pictures cpb. This is an editable Powerpoint four stages graphic that deals with topics like service continuity management to help convey your message better graphically. This product is a premium product available for immediate download and is 100 percent editable in Powerpoint. Download this now and use it in your presentations to impress your audience.

Transition Management Plan For Continual Service Optimization Infographics PDF
This slide illustrates model for continuous service transitioning for process improvement and optimization. It includes service strategy, service design, service transition and service operation etc. Presenting Transition Management Plan For Continual Service Optimization Infographics PDF to dispense important information. This template comprises four stages. It also presents valuable insights into the topics including Service Strategy, Service Design, Service Transition, Service Operation. This is a completely customizable PowerPoint theme that can be put to use immediately. So, download it and address the topic impactfully.
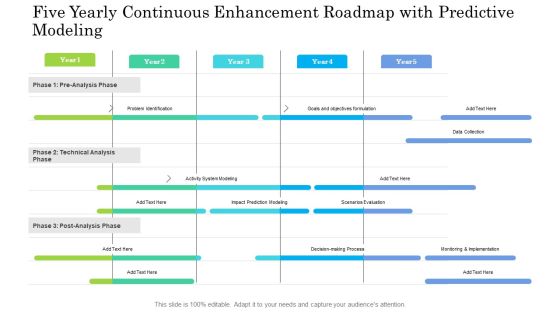
Five Yearly Continuous Enhancement Roadmap With Predictive Modeling Infographics
Presenting our innovatively structured five yearly continuous enhancement roadmap with predictive modeling infographics Template. Showcase your roadmap process in different formats like PDF, PNG, and JPG by clicking the download button below. This PPT design is available in both Standard Screen and Widescreen aspect ratios. It can also be easily personalized and presented with modified font size, font type, color, and shapes to measure your progress in a clear way.

Continuous Enhancement In Project Based Companies Visually Mapping Infographics PDF
This slide provides the glimpse about the software process which maps out the current steps involved in a project such as plan and track work, report progress, view progress, etc. Deliver an awe inspiring pitch with this creative continuous enhancement in project based companies visually mapping infographics pdf bundle. Topics like requirements for standard, review response, project dashboard can be discussed with this completely editable template. It is available for immediate download depending on the needs and requirements of the user.

Continuous IT Project Tracking In Devops Dashboard Infographics PDF
This slide illustrates facts and data figures related to software project monitoring with DevOps. It includes lines of code, code elements, quality gates, rules, issues, etc. Showcasing this set of slides titled Continuous IT Project Tracking In Devops Dashboard Infographics PDF. The topics addressed in these templates are Most Recent, Baseline Build, Code Elements. All the content presented in this PPT design is completely editable. Download it and make adjustments in color, background, font etc. as per your unique business setting.

Data Migration Life Cycle Ppt PowerPoint Presentation Infographics Inspiration
Presenting this set of slides with name data migration life cycle ppt powerpoint presentation infographics inspiration. This is a five stage process. The stages in this process are objects rules, transformation, validation migrate code, simulation review, execute migration, performance test. This is a completely editable PowerPoint presentation and is available for immediate download. Download now and impress your audience.
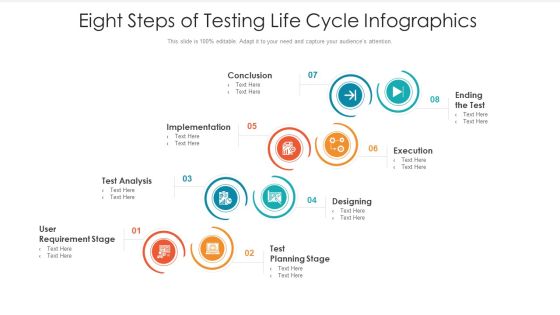
Eight Steps Of Testing Life Cycle Infographics Inspiration PDF
Presenting eight steps of testing life cycle infographics inspiration pdf to dispense important information. This template comprises eight stages. It also presents valuable insights into the topics including implementation, conclusion, planning, designing, analysis. This is a completely customizable PowerPoint theme that can be put to use immediately. So, download it and address the topic impactfully.

Catastrophe Recovery Application Plan And Business Continuity Plan Infographics PDF
This slide represents the similarities and differences between a disaster recovery plan and a business continuity plan. It explains how a disaster recovery plan is a part of the business continuity plan. Presenting catastrophe recovery application plan and business continuity plan infographics pdf to provide visual cues and insights. Share and navigate important information on nine stages that need your due attention. This template can be used to pitch topics like business continuity plans, validation and testing, risk management, policies and strategies, business continuity plan. In addtion, this PPT design contains high resolution images, graphics, etc, that are easily editable and available for immediate download.

Tqm Implementation Framework For Continuous Advancement Infographics PDF
This slide covers the implementation framework of total quality management for continuous improvements which involves personnel and customer satisfaction, teamwork, full participation, fulfil customer needs, employee training, quality management policies, etc. Showcasing this set of slides titled tqm implementation framework for continuous advancement infographics pdf. The topics addressed in these templates are tqm implementation framework for continuous advancement. All the content presented in this PPT design is completely editable. Download it and make adjustments in color, background, font etc. as per your unique business setting.

7 Steps Of The Sales Cycle Procedure Infographics PDF
This slide mentions 7 steps of the sales cycle process. It includes identifying prospects, making contact, qualifying prospect, nurturing prospect, presenting offer and overcoming objections. Presenting 7 Steps Of The Sales Cycle Procedure Infographics PDF to dispense important information. This template comprises seven stages. It also presents valuable insights into the topics including Identify Prospect, Qualify Prospect, Nurture Prospect, Overcome Objections. This is a completely customizable PowerPoint theme that can be put to use immediately. So, download it and address the topic impactfully.

Software Glitch Life Cycle Testing Framework Infographics PDF
This slide represents framework to track bug. It include various steps such as new, assign, open, fixed, pending request, test, reopened, verified, closed, duplicate, rejected and deferred. Showcasing this set of slides titled Software Glitch Life Cycle Testing Framework Infographics PDF. The topics addressed in these templates are Duplicate, Software Developer Analysis, Involves Reimplementation. All the content presented in this PPT design is completely editable. Download it and make adjustments in color, background, font etc. as per your unique business setting.

Lego Blocks For Leadership Ppt PowerPoint Presentation Infographics
This is a lego blocks for leadership ppt powerpoint presentation infographics. This is a four stage process. The stages in this process are business, marketing, management, process, lego.
Marketing Growth Strategy Template 1 Ppt PowerPoint Presentation Infographics Icons
This is a marketing growth strategy template 1 ppt powerpoint presentation infographics icons. This is a six stage process. The stages in this process are synchronistic strategies, branding to led, innovative design and media, websites that work, customer centric culture, new ways to sell.

Innovation Butterfly Four Placeholders Ppt PowerPoint Presentation Infographics Elements PDF
Presenting this set of slides with name innovation butterfly four placeholders ppt powerpoint presentation infographics elements pdf. This is a four stage process. The stages in this process are innovation butterfly four placeholders. This is a completely editable PowerPoint presentation and is available for immediate download. Download now and impress your audience.

Configuration Management With Puppet Features Of Puppet Infographics PDF
Presenting this set of slides with name configuration management with puppet features of puppet infographics pdf. This is a four stage process. The stages in this process are continuous delivery, continuous compliance, incident rectification, configuration management. This is a completely editable PowerPoint presentation and is available for immediate download. Download now and impress your audience.
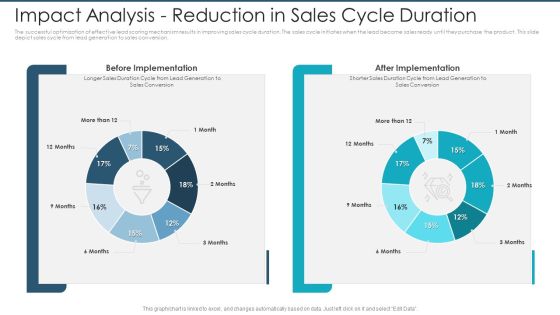
Impact Analysis Reduction In Sales Cycle Duration Infographics PDF
The successful optimization of effective lead scoring mechanism results in improving sales cycle duration. The sales cycle initiates when the lead become sales ready until they purchase the product. This slide depict sales cycle from lead generation to sales conversion.Deliver an awe-inspiring pitch with this creative impact analysis reduction in sales cycle duration infographics pdf. bundle. Topics like before implementation, after implementation can be discussed with this completely editable template. It is available for immediate download depending on the needs and requirements of the user.

Pricing For Software Development Life Cycle Models Infographics PDF
This slide represents the pricing for software development life cycle models, such as the waterfall model, RAD model, spiral, V-model, agile, iterative, and the big bang. Deliver and pitch your topic in the best possible manner with this pricing for software development life cycle models infographics pdf. Use them to share invaluable insights on maintenance of the product, requirement gathering and analysis, deployment in the market and impress your audience. This template can be altered and modified as per your expectations. So, grab it now.

Aligning Market Development Life Cycle With Innovation Strategies Infographics PDF
This slide illustrates the timing of implementation of innovation strategies during the various phases of market development life cycle. It include strategies such as disruptive,product,application, process, radical,incremental innovation strategies. Presenting Aligning Market Development Life Cycle With Innovation Strategies Infographics PDF to dispense important information. This template comprises five stages. It also presents valuable insights into the topics including Experimental Innovation Strategy, Marketing Innovation Strategy, Radical Innovation Strategy. This is a completely customizable PowerPoint theme that can be put to use immediately. So, download it and address the topic impactfully.

Working Of Software Development Life Cycle Infographics PDF
This slide describes the software development life cycle working that runs in a loop and starts from business needs, solution requirements, solutions features, software needs, analysis and design, code development, testing, and so on. If your project calls for a presentation, then Slidegeeks is your go to partner because we have professionally designed, easy to edit templates that are perfect for any presentation. After downloading, you can easily edit Working Of Software Development Life Cycle Infographics PDF and make the changes accordingly. You can rearrange slides or fill them with different images. Check out all the handy templates.
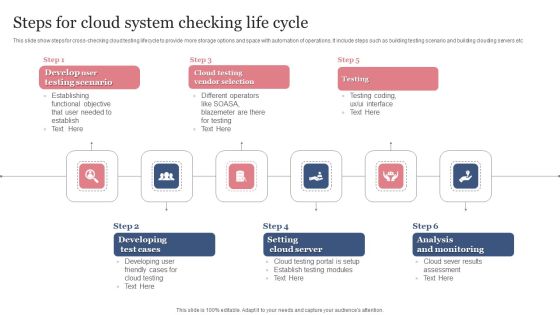
Steps For Cloud System Checking Life Cycle Infographics PDF
This slide show steps for cross checking cloud testing lifecycle to provide more storage options and space with automation of operations. It include steps such as building testing scenario and building clouding servers etc. Presenting Steps For Cloud System Checking Life Cycle Infographics PDF to dispense important information. This template comprises six stages. It also presents valuable insights into the topics including Developing Test Cases, Setting Cloud Server, Analysis And Monitoring. This is a completely customizable PowerPoint theme that can be put to use immediately. So, download it and address the topic impactfully.

Churn Rate Prediction Ppt PowerPoint Presentation Ideas Infographics Cpb
Presenting this set of slides with name churn rate prediction ppt powerpoint presentation ideas infographics cpb This is an editable Powerpoint four stages graphic that deals with topics like churn rate prediction to help convey your message better graphically. This product is a premium product available for immediate download and is 100 percent editable in Powerpoint. Download this now and use it in your presentations to impress your audience.

Business Process Improvement Ppt PowerPoint Presentation Infographics Ideas
Presenting this set of slides with name business process improvement ppt powerpoint presentation infographics ideas. This is a five stage process. The stages in this process are 5 stages continuous improvement process, business process improvement. This is a completely editable PowerPoint presentation and is available for immediate download. Download now and impress your audience.

Pharmaceutical Management Healthcare Organisation Self Assessment Ppt Infographics Grid PDF
Deliver an awe-inspiring pitch with this creative pharmaceutical management healthcare organisation self assessment ppt infographics grid pdf bundle. Topics like strategic planning, id areas, improvement, decision core competencies, h continual financial viability and sustainability, weaknesses, strengths, core competencies can be discussed with this completely editable template. It is available for immediate download depending on the needs and requirements of the user.
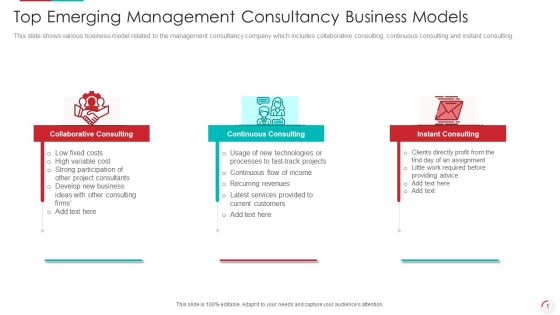
Top Emerging Management Consultancy Business Models Infographics PDF
Presenting top emerging management consultancy business models infographics pdf. to provide visual cues and insights. Share and navigate important information on three stages that need your due attention. This template can be used to pitch topics like collaborative consulting, continuous consulting, instant consulting. In addtion, this PPT design contains high resolution images, graphics, etc, that are easily editable and available for immediate download.

Sales Force Automation Benefits Ppt PowerPoint Presentation Infographics Samples
This is a sales force automation benefits ppt powerpoint presentation infographics samples. This is a two stage process. The stages in this process are increases deal closure by, reduces sales cycle by, cuts down the sales administrative time by, business, marketing.
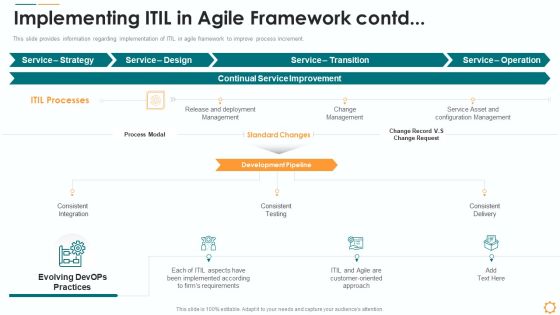
Implementing ITIL In Agile Framework Contd Ppt Infographics Images PDF
This slide provides information regarding implementation of ITIL in agile framework to improve process increment. Deliver an awe inspiring pitch with this creative implementing itil in agile framework contd ppt infographics images pdf bundle. Topics like deployment management, continual service improvement, change management, configuration management, consistent delivery can be discussed with this completely editable template. It is available for immediate download depending on the needs and requirements of the user.

Basic Architecture Of Concurrent Computing Ppt Infographics Examples PDF
This slide represents the basic architecture of edge computing, and its consists of edge servers, edge networks or micro data centers, and edge devices. Deliver and pitch your topic in the best possible manner with this basic architecture of concurrent computing ppt infographics examples pdf. Use them to share invaluable insights on software, maintain, continual, devices, networks and impress your audience. This template can be altered and modified as per your expectations. So, grab it now.

Brand Story Setting And Storytelling Steps Infographics PDF
The following slide highlights the brand story setting and storytelling steps illustrating exposition, incident, rising action, value proposition, implement, resolution and outcome for developing a continuous and engaging brand story. Presenting brand story setting and storytelling steps infographics pdf to dispense important information. This template comprises seven stages. It also presents valuable insights into the topics including exposition, incident, rising action. This is a completely customizable PowerPoint theme that can be put to use immediately. So, download it and address the topic impactfully.

QRM Quality Risk Identification Ppt Infographics Example File PDF
This slide covers Risk identification addresses the What might go wrong question, including identifying the possible consequences. Deliver an awe inspiring pitch with this creative QRM Quality Risk Identification Ppt Infographics Example File PDF bundle. Topics like Risk Category, Business Continuity, Financial can be discussed with this completely editable template. It is available for immediate download depending on the needs and requirements of the user.

Change Management And Deployment Release Pipeline Infographics PDF
This slide shows the pipeline of change release and deploy management. It starts with ready to share and continuous integration of developer tasks, ready to accept, continuous delivery and deployment of end user tasks.Showcasing this set of slides titled Change Management And Deployment Release Pipeline Infographics PDF. The topics addressed in these templates are Continuous Integration, Continuous Integration, Success Pipeline. All the content presented in this PPT design is completely editable. Download it and make adjustments in color, background, font etc. as per your unique business setting.
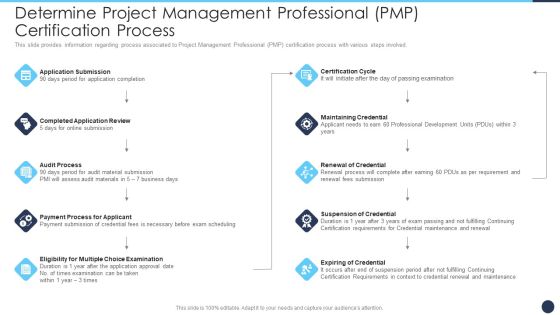
Determine Project Management Professional PMP Certification Process Infographics PDF
This slide provides information regarding process associated to Project Management Professional PMP certification process with various steps involved. Presenting determine project management professional pmp certification process infographics pdf to provide visual cues and insights. Share and navigate important information on ten stages that need your due attention. This template can be used to pitch topics like audit process, maintaining credential, certification cycle. In addtion, this PPT design contains high resolution images, graphics, etc, that are easily editable and available for immediate download.

Solution Development Process SDLC Big Bang Model Infographics PDF
This slide depicts the big bang model of the software development life cycle, including its needed inputs such as time, efforts, and resources.Deliver an awe inspiring pitch with this creative Solution Development Process SDLC Big Bang Model Infographics PDF bundle. Topics like Required Finances, Developers Working, Even Customers can be discussed with this completely editable template. It is available for immediate download depending on the needs and requirements of the user.

Devops Team Capabilities IT Cloud Skills Ppt Model Infographics PDF
This slide provides the glimpse about the cloud skills which focuses on delivering business values in every sprint such as focusing on customer feedback, agile process, continuous reporting, etc. This is a devops team capabilities it cloud skills ppt model infographics pdf template with various stages. Focus and dispense information on seven stages using this creative set, that comes with editable features. It contains large content boxes to add your information on topics like customer feedback, product planning, unified agile process, continuous monitoring, reporting, daily scrum. You can also showcase facts, figures, and other relevant content using this PPT layout. Grab it now.
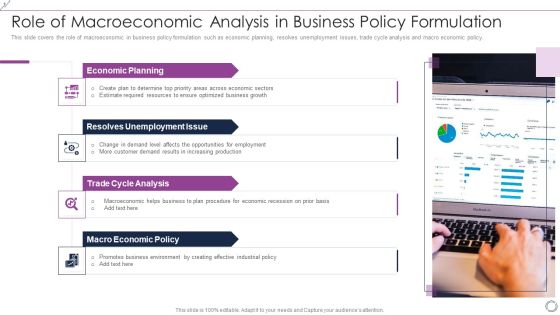
Role Of Macroeconomic Analysis In Business Policy Formulation Infographics PDF
This slide covers the role of macroeconomic in business policy formulation such as economic planning, resolves unemployment issues, trade cycle analysis and macro economic policy. Persuade your audience using this Role Of Macroeconomic Analysis In Business Policy Formulation Infographics PDF. This PPT design covers four stages, thus making it a great tool to use. It also caters to a variety of topics including Economic Planning, Resolves Unemployment Issue, Trade Cycle Analysis, Macro Economic Policy. Download this PPT design now to present a convincing pitch that not only emphasizes the topic but also showcases your presentation skills.

Major Metrics To Manage Cash Flow Ppt Infographics Portfolio PDF
This slide showcases main performance metric for cashflow management and improvement. The KPIs covered are account receivable turnover, sustainable growth rate, cash conversion cycle and quick ratio. Presenting Major Metrics To Manage Cash Flow Ppt Infographics Portfolio PDF to dispense important information. This template comprises four stages. It also presents valuable insights into the topics including Account Receivable Turnover, Sustainable Growth Rate, Cash Conversion Cycle. This is a completely customizable PowerPoint theme that can be put to use immediately. So, download it and address the topic impactfully.

Sales Quarterly Performance Review System With Improvement Plan Infographics PDF
This slide shows sales division quarterly business review QBR with improvement steps. It provides information about deals closed, average sales cycle, revenue, customer buying motivation, leads onboard, gross margin, etc. Presenting Sales Quarterly Performance Review System With Improvement Plan Infographics PDF to dispense important information. This template comprises four stages. It also presents valuable insights into the topics including Deals Closed, Average Sales Cycle, Revenue. This is a completely customizable PowerPoint theme that can be put to use immediately. So, download it and address the topic impactfully.

Stakeholder Governance Analysis Of The Company Infographics PDF
This slide shows the Stakeholder Governance Analysis of the company showing that how the effectively and efficiently governance structure is executed which continues to strengthen sustainability and ensures that all business operations are conducted appropriately. This is a stakeholder governance analysis of the company infographics pdf template with various stages. Focus and dispense information on five stages using this creative set, that comes with editable features. It contains large content boxes to add your information on topics like stakeholder governance analysis of the company. You can also showcase facts, figures, and other relevant content using this PPT layout. Grab it now.
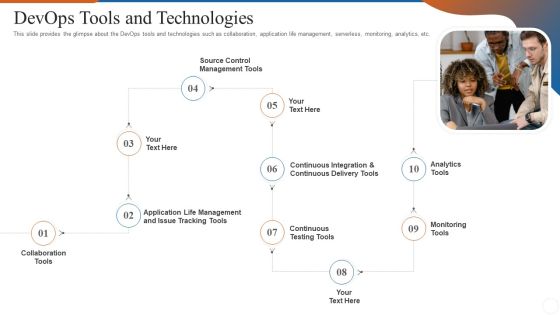
Operations Management Skills Devops Tools And Technologies Infographics PDF
This slide provides the glimpse about the DevOps tools and technologies such as collaboration, application life management, serverless, monitoring, analytics, etc. This is a operations management skills devops tools and technologies infographics pdf template with various stages. Focus and dispense information on ten stages using this creative set, that comes with editable features. It contains large content boxes to add your information on topics like collaboration tools, monitoring tools, analytics tools, continuous testing tools, source control management tools. You can also showcase facts, figures, and other relevant content using this PPT layout. Grab it now.

Steps For Devops Implementation IT Determine Crucial Strategies Infographics PDF
This slide provides information regarding crucial strategies for effective DevOps adoption in terms of focus on coordinated activities, continuous delivery of small increments, focus on cross functional product teams, etc. Presenting steps for devops implementation it determine crucial strategies infographics pdf to provide visual cues and insights. Share and navigate important information on four stages that need your due attention. This template can be used to pitch topics like value, goals, optimize, development, quality. In addtion, this PPT design contains high resolution images, graphics, etc, that are easily editable and available for immediate download.

Agile Dynamic Systems Development Method DSDM Ppt Infographics Smartart PDF
This slide covers agile dynamic system development methodology including MoSCoW rules and DSDM principles such as Focus on the business need, Deliver on time, Collaborate, Communicate continuously and clearly etc. Presenting agile dynamic systems development method dsdm ppt infographics smartart pdf to provide visual cues and insights. Share and navigate important information on three stages that need your due attention. This template can be used to pitch topics like system, production, designed, requirements. In addtion, this PPT design contains high resolution images, graphics, etc, that are easily editable and available for immediate download.
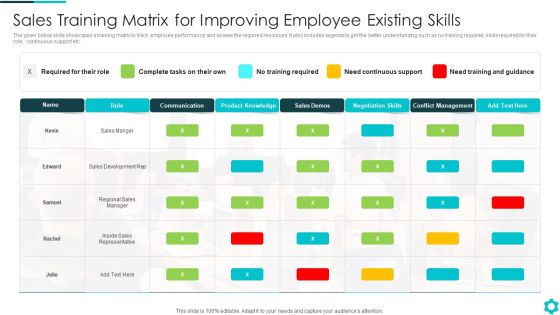
Sales Training Matrix For Improving Employee Existing Skills Infographics PDF
The given below slide showcases a training matrix to track employee performance and assess the required resources. It also includes legends to get the better understanding such as no training required, skills required for their role, continuous support etc.Pitch your topic with ease and precision using this Sales Training Matrix For Improving Employee Existing Skills Infographics PDF This layout presents information on Communication, Conflict Management, Inside Sales Representative It is also available for immediate download and adjustment. So, changes can be made in the color, design, graphics or any other component to create a unique layout.

Loyalty Programs Leveraging Positive In Store Experience Infographics PDF
Retail Store introducing loyalty programs to reward loyal customer that frequently engage with retail store. This strategy helps in increasing customer loyalty and ensures continuous business growth and positive word of mouth. Rewards consists of gifts, reward points, etc. Deliver an awe inspiring pitch with this creative Loyalty Programs Leveraging Positive In Store Experience Infographics PDF bundle. Topics like Custom Makeovers, Exclusive Events, Reward Points can be discussed with this completely editable template. It is available for immediate download depending on the needs and requirements of the user.

Building Employee Experience Strategy 10 Steps To Follow Infographics PDF
Employee experience includes all the interactions employee has with your company at every stage of the lifecycle. Therefore, build a strategy that covers all the stages.This is a Building Employee Experience Strategy 10 Steps To Follow Infographics PDF template with various stages. Focus and dispense information on ten stages using this creative set, that comes with editable features. It contains large content boxes to add your information on topics like Employee Experience, Implement Concepts, Continuously Improve. You can also showcase facts, figures, and other relevant content using this PPT layout. Grab it now.

Communication Plan For Pandemic Preparedness Training Infographics PDF
This template covers pandemic training plans considered while workplace reopening or continuing to operate. It also includes workers training and confirmation of understandings status that are properly tracked and recorded. This is a Communication Plan For Pandemic Preparedness Training Infographics PDF template with various stages. Focus and dispense information on three stages using this creative set, that comes with editable features. It contains large content boxes to add your information on topics like Audience, Content Included, Pandemic Protocols. You can also showcase facts, figures, and other relevant content using this PPT layout. Grab it now.
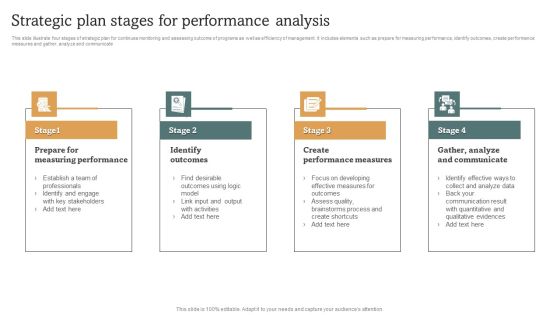
Strategic Plan Stages For Performance Analysis Infographics PDF
This slide illustrate four stages of strategic plan for continues monitoring and assessing outcome of programs as well as efficiency of management. It includes elements such as prepare for measuring performance, identify outcomes, create performance measures and gather, analyze and communicate. Persuade your audience using this Strategic Plan Stages For Performance Analysis Infographics PDF. This PPT design covers four stages, thus making it a great tool to use. It also caters to a variety of topics including Identify Outcomes, Create Performance Measures, Prepare For Measuring Performance. Download this PPT design now to present a convincing pitch that not only emphasizes the topic but also showcases your presentation skills.

Evolutionary Phase Framework Of Company Failure Effect Infographics PDF
This slide shows evolutionary and analysis phase model after business failure to reduce negative impact and maintain continuity. It contains four phases acceptance, transformation, development and founder legacy. Persuade your audience using this Evolutionary Phase Framework Of Company Failure Effect Infographics PDF. This PPT design covers four stages, thus making it a great tool to use. It also caters to a variety of topics including Business Formation, Development Phase, Transformation Phase. Download this PPT design now to present a convincing pitch that not only emphasizes the topic but also showcases your presentation skills.
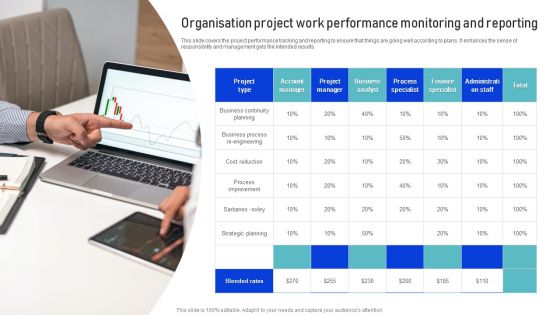
Organisation Project Work Performance Monitoring And Reporting Infographics PDF
This slide covers the project performance tracking and reporting to ensure that things are going well according to plans. It enhances the sense of responsibility and management gets the intended results. Presenting Organisation Project Work Performance Monitoring And Reporting Infographics PDF to dispense important information. This template comprises one stages. It also presents valuable insights into the topics including Business Continuity Planning, Strategic Planning, Business Analyst. This is a completely customizable PowerPoint theme that can be put to use immediately. So, download it and address the topic impactfully.

Bi Annual Communication Plan For Agile Transformation Infographics PDF
The following slide displays a roadmap for phases of agile journey in organization to guide teams with a proper sequence of actions. It includes details such as kickoff, design, validate education, launch, continuous improvement, etc. Showcasing this set of slides titled Bi Annual Communication Plan For Agile Transformation Infographics PDF. The topics addressed in these templates are Audience, Channel, Frequency. All the content presented in this PPT design is completely editable. Download it and make adjustments in color, background, font etc. as per your unique business setting.

Key Principles For Successful Devops Culture Ppt Infographics Show PDF
This slide provides the glimpse about the IT DevOps principles such as automation, iteration, continuous improvement, and collaboration. Slidegeeks is here to make your presentations a breeze with Key Principles For Successful Devops Culture Ppt Infographics Show PDF With our easy-to-use and customizable templates, you can focus on delivering your ideas rather than worrying about formatting. With a variety of designs to choose from, you are sure to find one that suits your needs. And with animations and unique photos, illustrations, and fonts, you can make your presentation pop. So whether you are giving a sales pitch or presenting to the board, make sure to check out Slidegeeks first

Business Accomplishment Monitoring Process For Employee Evaluation Infographics PDF
This slide depicts comparative chart for performance management cycle. It includes stages such as feedback, setting goals, performance, development, recognition and workflow integration. Persuade your audience using this business accomplishment monitoring process for employee evaluation infographics pdf. This PPT design covers four stages, thus making it a great tool to use. It also caters to a variety of topics including business performance, leadership practices, customer results. Download this PPT design now to present a convincing pitch that not only emphasizes the topic but also showcases your presentation skills.

Modern Native Vs Standard Computing Application Development Infographics PDF
This slide showcase the variation between the various measures of cloud native and traditional application development process. It includes the difference between focus area, team structure, delivery cycle, application architectures and so on. Pitch your topic with ease and precision using this Modern Native Vs Standard Computing Application Development Infographics PDF. This layout presents information on Development Approach, Application Architecture, Team Structure. It is also available for immediate download and adjustment. So, changes can be made in the color, design, graphics or any other component to create a unique layout.

Benefits Of Continual Improvement Ppt PowerPoint Presentation Model Infographics
This is a benefits of continual improvement ppt powerpoint presentation model infographics. This is a four stage process. The stages in this process are for policy and strategy formulation, for goal and target setting, for operation management, for human resource management.

Business Continuity Plans Ppt PowerPoint Presentation Pictures Infographics
Presenting this set of slides with name business continuity plans ppt powerpoint presentation pictures infographics. The topics discussed in these slides are alternate sourcing location, alternate supplier identification. This is a completely editable PowerPoint presentation and is available for immediate download. Download now and impress your audience.
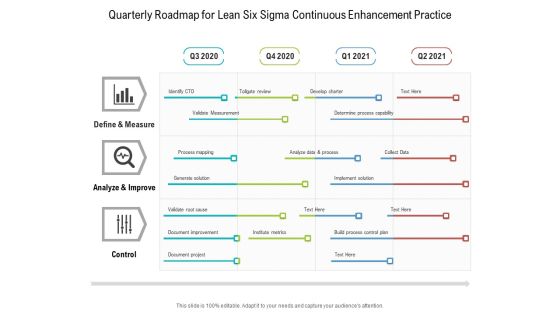
Quarterly Roadmap For Lean Six Sigma Continuous Enhancement Practice Infographics
Introducing our quarterly roadmap for lean six sigma continuous enhancement practice infographics. This PPT presentation is Google Slides compatible, therefore, you can share it easily with the collaborators for measuring the progress. Also, the presentation is available in both standard screen and widescreen aspect ratios. So edit the template design by modifying the font size, font type, color, and shapes as per your requirements. As this PPT design is fully editable it can be presented in PDF, JPG and PNG formats.
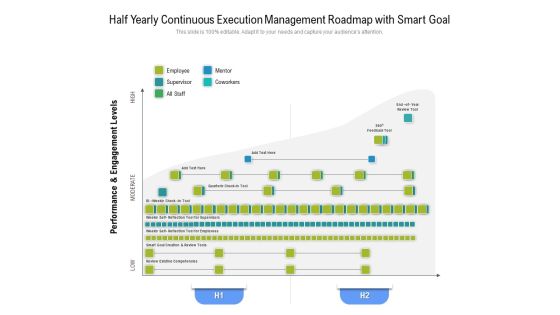
Half Yearly Continuous Execution Management Roadmap With Smart Goal Infographics
Presenting our jaw-dropping half yearly continuous execution management roadmap with smart goal infographics. You can alternate the color, font size, font type, and shapes of this PPT layout according to your strategic process. This PPT presentation is compatible with Google Slides and is available in both standard screen and widescreen aspect ratios. You can also download this well-researched PowerPoint template design in different formats like PDF, JPG, and PNG. So utilize this visually-appealing design by clicking the download button given below.
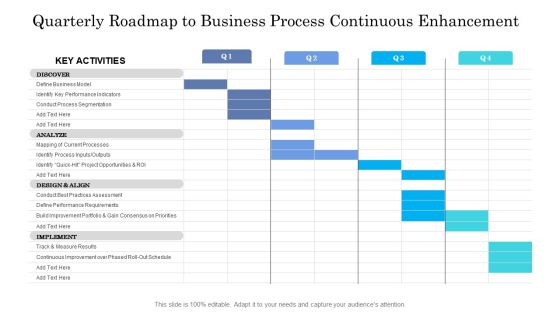
Quarterly Roadmap To Business Process Continuous Enhancement Infographics
Presenting our jaw dropping quarterly roadmap to business process continuous enhancement infographics. You can alternate the color, font size, font type, and shapes of this PPT layout according to your strategic process. This PPT presentation is compatible with Google Slides and is available in both standard screen and widescreen aspect ratios. You can also download this well researched PowerPoint template design in different formats like PDF, JPG, and PNG. So utilize this visually appealing design by clicking the download button given below.
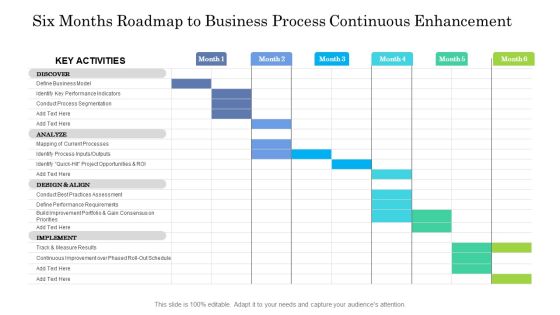
Six Months Roadmap To Business Process Continuous Enhancement Infographics
Presenting our jaw dropping six months roadmap to business process continuous enhancement infographics. You can alternate the color, font size, font type, and shapes of this PPT layout according to your strategic process. This PPT presentation is compatible with Google Slides and is available in both standard screen and widescreen aspect ratios. You can also download this well researched PowerPoint template design in different formats like PDF, JPG, and PNG. So utilize this visually appealing design by clicking the download button given below.
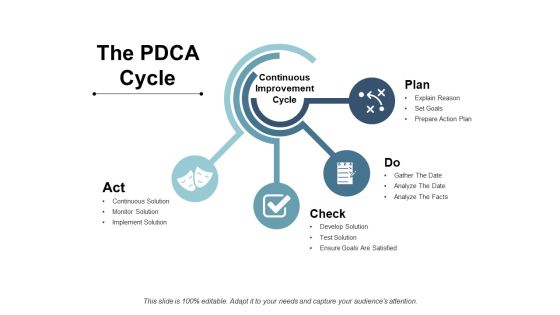
The Pdca Cycle Ppt PowerPoint Presentation Model Infographics
This is a the pdca cycle ppt powerpoint presentation model infographics. This is a four stage process. The stages in this process are business, management, planning, strategy, marketing.
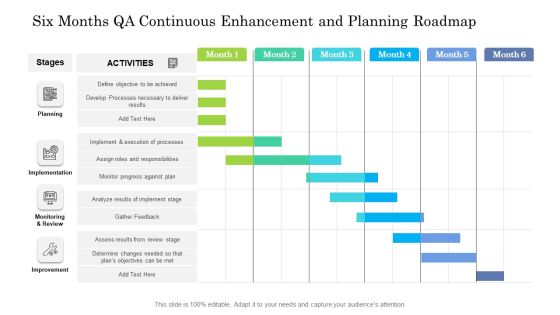
Six Months QA Continuous Enhancement And Planning Roadmap Infographics
Presenting the six months qa continuous enhancement and planning roadmap infographics. The template includes a roadmap that can be used to initiate a strategic plan. Not only this, the PowerPoint slideshow is completely editable and you can effortlessly modify the font size, font type, and shapes according to your needs. This PPT slide can be easily reached in standard screen and widescreen aspect ratios. The set is also available in various formats like PDF, PNG, and JPG. So download and use it multiple times as per your knowledge.

Implementing Devops In Organization Ppt PowerPoint Presentation File Infographics PDF
This slide provides the glimpse about the steps involved in implementing DevOps in the organization which covers agile development process, cloud computing, CI or CD workflow, software deployment, testing and continuous deployment. Slidegeeks is here to make your presentations a breeze with Implementing Devops In Organization Ppt PowerPoint Presentation File Infographics PDF With our easy to use and customizable templates, you can focus on delivering your ideas rather than worrying about formatting. With a variety of designs to choose from, you are sure to find one that suits your needs. And with animations and unique photos, illustrations, and fonts, you can make your presentation pop. So whether you are giving a sales pitch or presenting to the board, make sure to check out Slidegeeks first.
Technology Adoption Life Cycle Ppt PowerPoint Presentation Icon Infographics
This is a technology adoption life cycle ppt powerpoint presentation icon infographics. This is a five stage process. The stages in this process are adoption curve, crossing the chasm, hype cycle.

Determine Challenges And Solutions During Implementation Phase Infographics PDF
The following slide highlights some major challenges faced by employees while executing performance management cycle along with its solutions. It includes activities such as setting goals, milestone, lack of leadership, assessment KPIs, tools, outdated review method etc. This Determine Challenges And Solutions During Implementation Phase Infographics PDF from Slidegeeks makes it easy to present information on your topic with precision. It provides customization options, so you can make changes to the colors, design, graphics, or any other component to create a unique layout. It is also available for immediate download, so you can begin using it right away. Slidegeeks has done good research to ensure that you have everything you need to make your presentation stand out. Make a name out there for a brilliant performance.
Business Daigram Four Step Business Infographics And Icons Presentation Templets
This business slide has been designed with four intersecting circles with icons. Our above given Venn diagram with intersecting circles can be used illustrate the similarities. Download this diagram slide to make business process related presentations.
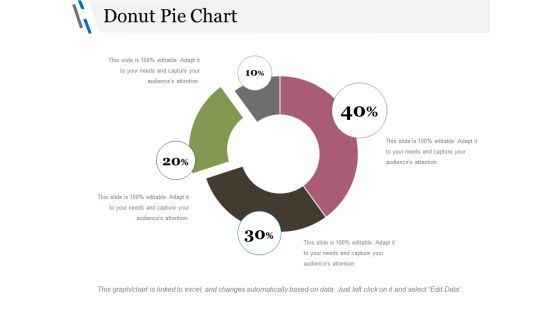
Donut Pie Chart Ppt PowerPoint Presentation Gallery Infographics
This is a donut pie chart ppt powerpoint presentation gallery infographics. This is a four stage process. The stages in this process are chart, business, management, percentage, process.

Who Is Your Buyer Ppt PowerPoint Presentation Visual Aids Infographics
This is a who is your buyer ppt powerpoint presentation visual aids infographics. This is a six stage process. The stages in this process are demographics, psychographics, biographies, relationships, motivation.

Project Monitoring And Control Ppt PowerPoint Presentation Inspiration Infographics
This is a project monitoring and control ppt powerpoint presentation inspiration infographics. This is a three stage process. The stages in this process are monitoring controls, continuous controls, ccm.
Six Stages Project Planning Cycle With Icons Ppt Powerpoint Presentation Infographics Objects
This is a six stages project planning cycle with icons ppt powerpoint presentation infographics objects. This is a six stage process. The stages in this process are cycle diagram, circular process, cyclical process.
Eleven Steps Workflow Management With Icons Ppt PowerPoint Presentation Infographics Slides
This is a eleven steps workflow management with icons ppt powerpoint presentation infographics slides. This is a eleven stage process. The stages in this process are 10 circle, 10 circular diagram, 10 cycle.
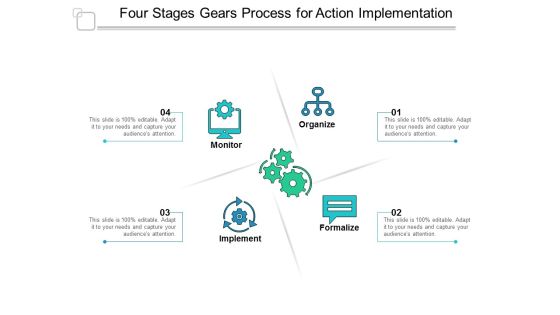
Four Stages Gears Process For Action Implementation Ppt Powerpoint Presentation Infographics Skills
This is a four stages gears process for action implementation ppt powerpoint presentation infographics skills. This is a four stage process. The stages in this process are cycle diagram, circular process, cyclical process.
Seven Stages Stage Cyclic Process With Business Planning Icons Ppt Powerpoint Presentation Infographics Microsoft
This is a seven stages stage cyclic process with business planning icons ppt powerpoint presentation infographics microsoft. This is a seven stage process. The stages in this process are cycle diagram, circular process, cyclical process.

eight cyclic steps for leadership development strategy ppt powerpoint presentation styles infographics
This is a eight cyclic steps for leadership development strategy ppt powerpoint presentation styles infographics. This is a eight stage process. The stages in this process are cycle diagram, circular process, cyclical process.
Gear In Hands With Money Icons Powerpoint Templates
This business diagram displays circular gear steps infographic. This business diagram has been designed with graphic of gear with icons. Use this diagram to depict business planning process in your presentations.

Five Steps Star Layout For Communication Process Ppt PowerPoint Presentation Infographics Skills PDF
Presenting this set of slides with name five steps star infographic for risk analysis ppt powerpoint presentation inspiration background images pdf. This is a five stage process. The stages in this process are understanding, remembering, evaluating, feedback, receiving. This is a completely editable PowerPoint presentation and is available for immediate download. Download now and impress your audience.
Eleven Business Steps With Text Holders And Icons Ppt PowerPoint Presentation Infographics Guidelines
This is a eleven business steps with text holders and icons ppt powerpoint presentation infographics guidelines. This is a eleven stage process. The stages in this process are 10 circle, 10 circular diagram, 10 cycle.
Ten Business Steps With Text Holders And Icons Ppt PowerPoint Presentation Infographics Example
This is a ten business steps with text holders and icons ppt powerpoint presentation infographics example. This is a ten stage process. The stages in this process are 10 circle, 10 circular diagram, 10 cycle.

Four Options Technology Banners Powerpoint Templates
This business slide contains circular infographic. This diagram is suitable to present team plan for financial growth. Download this diagram for schematic representation of any information. Visual effect of this slide helps in maintaining the flow of the discussion and provides more clarity to the subject.

Concentric Sphere Chart Infographics For Defining Scope Ppt Gallery Slide Portrait PDF
Presenting concentric sphere chart infographics for defining scope ppt gallery slide portrait pdf to dispense important information. This template comprises five stages. It also presents valuable insights into the topics including concentric sphere chart infographics for defining scope. This is a completely customizable PowerPoint theme that can be put to use immediately. So, download it and address the topic impactfully.

9 Process Diagram Infographics For Relevant Cost Ppt PowerPoint Presentation Model Slideshow PDF
Presenting 9 process diagram infographics for relevant cost ppt powerpoint presentation model slideshow pdf to dispense important information. This template comprises nine stages. It also presents valuable insights into the topics including 9 process diagram infographics for relevant cost. This is a completely customizable PowerPoint theme that can be put to use immediately. So, download it and address the topic impactfully.

3 Division Circle Infographics For Commission Structure Ppt PowerPoint Presentation File Designs PDF
Presenting 3 division circle infographics for commission structure ppt powerpoint presentation file designs pdf to dispense important information. This template comprises three stages. It also presents valuable insights into the topics including 3 division circle infographics for commission structure. This is a completely customizable PowerPoint theme that can be put to use immediately. So, download it and address the topic impactfully.

Eight Steps Infographics For Object Oriented Language Ppt PowerPoint Presentation Gallery Display PDF
Presenting eight steps infographics for object oriented language ppt powerpoint presentation gallery display pdf to dispense important information. This template comprises eight stages. It also presents valuable insights into the topics including eight steps infographics for object oriented language. This is a completely customizable PowerPoint theme that can be put to use immediately. So, download it and address the topic impactfully.

Curved Roadmap Infographics For Recession Proof Business Ppt PowerPoint Presentation File Background Image PDF
Presenting curved roadmap infographics for recession proof business ppt powerpoint presentation file background image pdf to dispense important information. This template comprises nine stages. It also presents valuable insights into the topics including curved roadmap infographics for recession proof business. This is a completely customizable PowerPoint theme that can be put to use immediately. So, download it and address the topic impactfully.

5S Methodology Infographics For Business Intelligence Analysis Ppt PowerPoint Presentation Model Background PDF
Presenting 5s methodology infographics for business intelligence analysis ppt powerpoint presentation model background pdf to dispense important information. This template comprises five stages. It also presents valuable insights into the topics including 5s methodology infographics for business intelligence analysis. This is a completely customizable PowerPoint theme that can be put to use immediately. So, download it and address the topic impactfully.

5 Drivers Infographics For Business Forecasting Techniques Ppt PowerPoint Presentation Gallery Example Topics PDF
Presenting 5 drivers infographics for business forecasting techniques ppt powerpoint presentation gallery example topics pdf to dispense important information. This template comprises five stages. It also presents valuable insights into the topics including 5 drivers infographics for business forecasting techniques. This is a completely customizable PowerPoint theme that can be put to use immediately. So, download it and address the topic impactfully.

5 Phase Procedure Infographics For Remote Business Services Ppt PowerPoint Presentation File Sample PDF
Presenting 5 phase procedure infographics for remote business services ppt powerpoint presentation file sample pdf to dispense important information. This template comprises five stages. It also presents valuable insights into the topics including 5 phase procedure infographics for remote business services. This is a completely customizable PowerPoint theme that can be put to use immediately. So, download it and address the topic impactfully.

Twelve Stages To Preparing Business Statement Ppt PowerPoint Presentation Infographics Graphics Template
Presenting this set of slides with name twelve stages to preparing business statement ppt powerpoint presentation infographics graphics template. This is a twelve stage process. The stages in this process are data report, infographics brochure, business statement. This is a completely editable PowerPoint presentation and is available for immediate download. Download now and impress your audience.

Connected Four Steps Business Process Infographics Ppt PowerPoint Presentation Gallery Inspiration
Presenting this set of slides with name connected four steps business process infographics ppt powerpoint presentation gallery inspiration. This is a four stage process. The stages in this process are connected four steps, business process, infographics. This is a completely editable PowerPoint presentation and is available for immediate download. Download now and impress your audience.

Company Four Stage Roadmap Infographics Ppt PowerPoint Presentation File Information PDF
Presenting this set of slides with name company four stage roadmap infographics ppt powerpoint presentation file information pdf. This is a four stage process. The stages in this process are company four stage roadmap infographics. This is a completely editable PowerPoint presentation and is available for immediate download. Download now and impress your audience.

Five Steps Bulb Infographics With Innovation Process Ppt PowerPoint Presentation File Deck PDF
Presenting five steps bulb infographics with innovation process ppt powerpoint presentation file deck pdf to dispense important information. This template comprises six stages. It also presents valuable insights into the topics including five steps bulb infographics with innovation process. This is a completely customizable PowerPoint theme that can be put to use immediately. So, download it and address the topic impactfully.

3 Circle Diagram Infographics Of Secure Content Sharing Ppt PowerPoint Presentation File Professional PDF
Persuade your audience using this 3 circle diagram infographics of secure content sharing ppt powerpoint presentation file professional pdf. This PPT design covers three stages, thus making it a great tool to use. It also caters to a variety of topics including 3 circle diagram infographics of secure content sharing. Download this PPT design now to present a convincing pitch that not only emphasizes the topic but also showcases your presentation skills.

Concentric Sphere Chart Infographics For Determining Business Value Ppt Professional Template PDF
Persuade your audience using this concentric sphere chart infographics for determining business value ppt professional template pdf. This PPT design covers four stages, thus making it a great tool to use. It also caters to a variety of topics including concentric sphere chart infographics for determining business value. Download this PPT design now to present a convincing pitch that not only emphasizes the topic but also showcases your presentation skills.
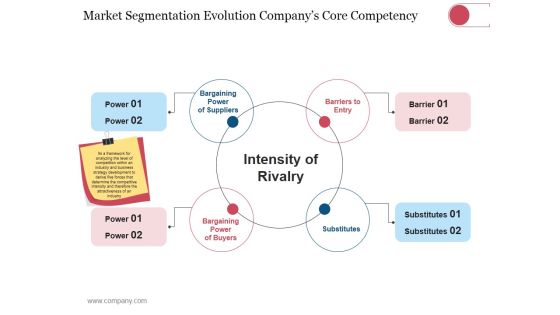
Market Segmentation Evolution Companys Core Competency Template 1 Ppt PowerPoint Presentation Infographics Styles
This is a market segmentation evolution companys core competency template 1 ppt powerpoint presentation infographics styles. This is a four stage process. The stages in this process are bargaining power of suppliers, barriers to entry, bargaining power of buyers, substitutes.
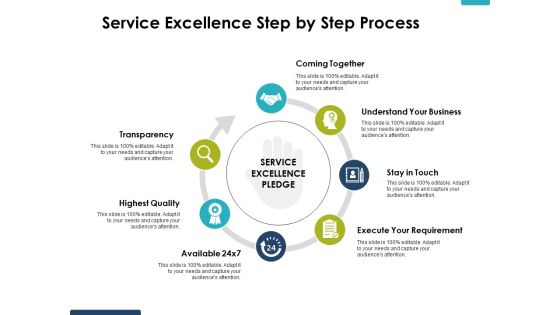
Service Excellence Step By Step Process Ppt PowerPoint Presentation Infographics Topics
This is a service excellence step by step process ppt powerpoint presentation infographics topics. This is a seven stage process. The stages in this process are transparency, highest quality, understand your business.
Four Stages Business Process Planning And Controlling Ppt PowerPoint Presentation Infographics Icons
This is a four stages business process planning and controlling ppt powerpoint presentation infographics icons. This is a four stage process. The stages in this process are product lifecycle, management cycle, project cycle.

Six Steps Cycle Infographics For Overview Of Project Management Ppt PowerPoint Presentation Gallery Master Slide PDF
Presenting six steps cycle infographics for overview of project management ppt powerpoint presentation gallery master slide pdf to dispense important information. This template comprises six stages. It also presents valuable insights into the topics including six steps cycle infographics for overview of project management. This is a completely customizable PowerPoint theme that can be put to use immediately. So, download it and address the topic impactfully.
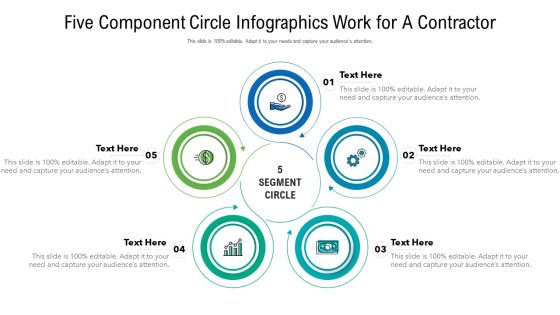
Five Component Circle Infographics Work For A Contractor Ppt PowerPoint Presentation File Professional PDF
Persuade your audience using this five component circle infographics work for a contractor ppt powerpoint presentation file professional pdf. This PPT design covers five stages, thus making it a great tool to use. It also caters to a variety of topics including five component circle infographics work for a contractor. Download this PPT design now to present a convincing pitch that not only emphasizes the topic but also showcases your presentation skills.

 Home
Home