Infographic Circular
Market Strategy Organizational Structure Ppt PowerPoint Presentation Infographics Templates Cpb
Presenting this set of slides with name market strategy organizational structure ppt powerpoint presentation infographics templates cpb. This is an editable Powerpoint four stages graphic that deals with topics like market strategy organizational structure to help convey your message better graphically. This product is a premium product available for immediate download and is 100 percent editable in Powerpoint. Download this now and use it in your presentations to impress your audience.
Unemployment Rate Graph Ppt PowerPoint Presentation Infographics Gallery Cpb
Presenting this set of slides with name unemployment rate graph ppt powerpoint presentation infographics gallery cpb. This is an editable Powerpoint five stages graphic that deals with topics like unemployment rate graph to help convey your message better graphically. This product is a premium product available for immediate download and is 100 percent editable in Powerpoint. Download this now and use it in your presentations to impress your audience.

User Behavioural Analytics Ppt PowerPoint Presentation Infographics Graphics Template Cpb
Presenting this set of slides with name user behavioural analytics ppt powerpoint presentation infographics graphics template cpb. This is an editable Powerpoint seven stages graphic that deals with topics like user behavioural analytics to help convey your message better graphically. This product is a premium product available for immediate download and is 100 percent editable in Powerpoint. Download this now and use it in your presentations to impress your audience.
Human Resources Transformation Ppt Powerpoint Presentation Infographics Display Cpb
Presenting this set of slides with name human resources transformation ppt powerpoint presentation infographics display cpb. This is an editable Powerpoint four stages graphic that deals with topics like human resources transformation to help convey your message better graphically. This product is a premium product available for immediate download and is 100 percent editable in Powerpoint. Download this now and use it in your presentations to impress your audience.

Mobile Emerging Technology Ppt PowerPoint Presentation Infographics Example Cpb
Presenting this set of slides with name mobile emerging technology ppt powerpoint presentation infographics example cpb. This is an editable Powerpoint three stages graphic that deals with topics like mobile emerging technology to help convey your message better graphically. This product is a premium product available for immediate download and is 100 percent editable in Powerpoint. Download this now and use it in your presentations to impress your audience.
Market Based Pricing Strategy Ppt PowerPoint Presentation Infographics Topics Cpb
Presenting this set of slides with name market based pricing strategy ppt powerpoint presentation infographics topics cpb. This is an editable Powerpoint three stages graphic that deals with topics like market based pricing strategy to help convey your message better graphically. This product is a premium product available for immediate download and is 100 percent editable in Powerpoint. Download this now and use it in your presentations to impress your audience.

Modernization Trends Strategies Ppt PowerPoint Presentation Infographics Graphics Cpb
Presenting this set of slides with name modernization trends strategies ppt powerpoint presentation infographics graphics cpb. This is an editable Powerpoint five stages graphic that deals with topics like modernization trends strategies to help convey your message better graphically. This product is a premium product available for immediate download and is 100 percent editable in Powerpoint. Download this now and use it in your presentations to impress your audience.

Open Communication Ppt PowerPoint Presentation Infographics Influencers Cpb
Presenting this set of slides with name open communication ppt powerpoint presentation infographics influencers cpb. This is an editable Powerpoint five stages graphic that deals with topics like open communication to help convey your message better graphically. This product is a premium product available for immediate download and is 100 percent editable in Powerpoint. Download this now and use it in your presentations to impress your audience.

Data Flow Graph Ppt PowerPoint Presentation Model Infographics Cpb Pdf
Presenting this set of slides with name data flow graph ppt powerpoint presentation model infographics cpb pdf. This is an editable Powerpoint six stages graphic that deals with topics like data flow graph to help convey your message better graphically. This product is a premium product available for immediate download and is 100 percent editable in Powerpoint. Download this now and use it in your presentations to impress your audience.

Intelligent Manufacturing Timeline Of 3D Printing Technologies Infographics PDF
Slidegeeks is one of the best resources for PowerPoint templates. You can download easily and regulate Intelligent Manufacturing Timeline Of 3D Printing Technologies Infographics PDF for your personal presentations from our wonderful collection. A few clicks is all it takes to discover and get the most relevant and appropriate templates. Use our Templates to add a unique zing and appeal to your presentation and meetings. All the slides are easy to edit and you can use them even for advertisement purposes.

Leveraged Client Engagement Optimization Model For Digital Engagement Infographics PDF
This slide provides information regarding the process of optimizing customer engagement on digital platform. This is a leveraged client engagement optimization model for digital engagement infographics pdf template with various stages. Focus and dispense information on three stages using this creative set, that comes with editable features. It contains large content boxes to add your information on topics like improve processes, enrich interactions, optimize the work force. You can also showcase facts, figures, and other relevant content using this PPT layout. Grab it now.

Quality Control Plan 5 Impacts Of Product Recall Infographics PDF
This slide portrays five impacts any organization recall its product. Impacts covered in the slide are direct cost of product recall, regulatory sanctions, negative customer reactions, lost revenues and reputational damages. Find a pre-designed and impeccable Quality Control Plan 5 Impacts Of Product Recall Infographics PDF. The templates can ace your presentation without additional effort. You can download these easy-to-edit presentation templates to make your presentation stand out from others. So, what are you waiting for Download the template from Slidegeeks today and give a unique touch to your presentation.
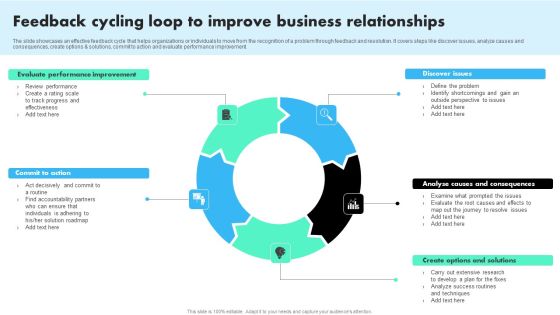
Feedback Cycling Loop To Improve Business Relationships Infographics PDF
The slide showcases an effective feedback cycle that helps organizations or individuals to move from the recognition of a problem through feedback and resolution. It covers steps like discover issues, analyze causes and consequences, create options and solutions, commit to action and evaluate performance improvement. Persuade your audience using this Feedback Cycling Loop To Improve Business Relationships Infographics PDF. This PPT design covers five stages, thus making it a great tool to use. It also caters to a variety of topics including Evaluate Performance Improvement, Commit Action, Discover Issues. Download this PPT design now to present a convincing pitch that not only emphasizes the topic but also showcases your presentation skills.
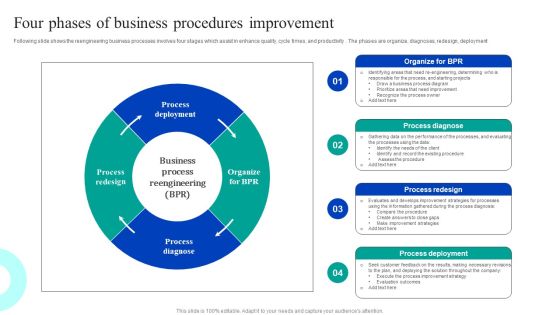
Four Phases Of Business Procedures Improvement Infographics PDF
Following slide shows the reengineering business processes involves four stages which assist in enhance quality, cycle times, and productivity . The phases are organize, diagnoses, redesign, deployment. Persuade your audience using this Four Phases Of Business Procedures Improvement Infographics PDF. This PPT design covers four stages, thus making it a great tool to use. It also caters to a variety of topics including Process Diagnose, Process Redesign, Process Deployment. Download this PPT design now to present a convincing pitch that not only emphasizes the topic but also showcases your presentation skills.
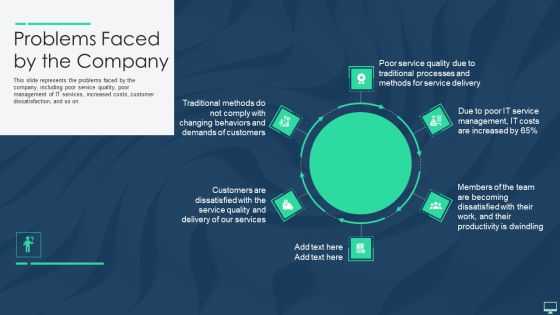
Problems Faced By The Company Ppt Infographics Themes PDF
This slide represents the problems faced by the company, including poor service quality, poor management of IT services, increased costs, customer dissatisfaction, and so on. Presenting problems faced by the company ppt infographics themes pdf to provide visual cues and insights. Share and navigate important information on six stages that need your due attention. This template can be used to pitch topics like quality, customers, service, methods, management. In addtion, this PPT design contains high resolution images, graphics, etc, that are easily editable and available for immediate download.
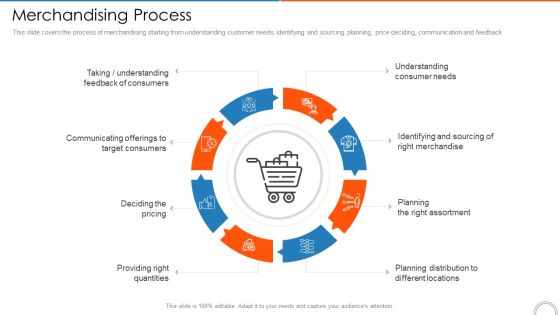
Merchandising Process Retail Store Positioning Ppt Infographics Gridlines PDF
This slide covers the process of merchandising starting from understanding customer needs, identifying and sourcing, planning, price deciding, communication and feedback. This is a merchandising process retail store positioning ppt infographics gridlines pdf template with various stages. Focus and dispense information on eight stages using this creative set, that comes with editable features. It contains large content boxes to add your information on topics like planning, target, communicating, pricing. You can also showcase facts, figures, and other relevant content using this PPT layout. Grab it now.

Digital Transformation Process Automation System Applications Infographics PDF
This slide shows the significance of using digital technology in real business scenarios to automate processes and optimize workflow. The key areas include customer onboarding, loan and credit, purchase orders, and logistics. Presenting Digital Transformation Process Automation System Applications Infographics PDF to dispense important information. This template comprises four stages. It also presents valuable insights into the topics including Loan And Credit Approval, Transportation And Logistics, Customer Onboarding, Purchase Orders. This is a completely customizable PowerPoint theme that can be put to use immediately. So, download it and address the topic impactfully.
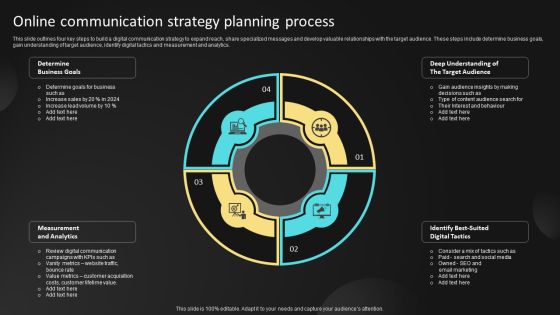
Online Communication Strategy Planning Process Ppt Styles Infographics PDF
This slide outlines four key steps to build a digital communication strategy to expand reach, share specialized messages and develop valuable relationships with the target audience. These steps include determine business goals, gain understanding of target audience, identify digital tactics and measurement and analytics. Presenting Online Communication Strategy Planning Process Ppt Styles Infographics PDF to dispense important information. This template comprises four stages. It also presents valuable insights into the topics including Determine Business Goals, Identify Best Suited, Digital Tactics, Measurement And Analytics, Deep Understanding, The Target Audience. This is a completely customizable PowerPoint theme that can be put to use immediately. So, download it and address the topic impactfully.

Debt Retrieval Techniques Restricting Credit Grant Ppt Gallery Infographics PDF
The following slide displays the credit grant restriction details as it highlights the process of loan grant along with the key details of how the organization can reduce credit grant Presenting debt retrieval techniques restricting credit grant ppt gallery infographics pdf to provide visual cues and insights. Share and navigate important information on nine stages that need your due attention. This template can be used to pitch topics like pre qualification, pricing and locking, final loan approval, loan application, loan processing. In addtion, this PPT design contains high resolution images, graphics, etc, that are easily editable and available for immediate download.
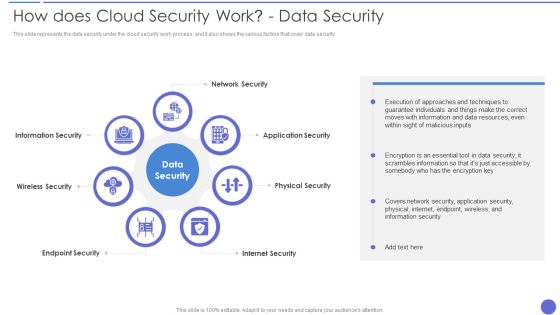
How Does Cloud Security Work Data Security Infographics PDF
This slide represents the data security under the cloud security work process, and it also shows the various factors that cover data security. This is a How Does Cloud Security Work Data Security Infographics PDF template with various stages. Focus and dispense information on seven stages using this creative set, that comes with editable features. It contains large content boxes to add your information on topics like Application Security, Physical Security, Internet Security. You can also showcase facts, figures, and other relevant content using this PPT layout. Grab it now.

Development Model To Achieve Business Goals Infographics PDF
The following slide illustrates the business development model to streamline processes and goals. It includes key activities such as evaluating existing customers and competitors, determining unsatisfied needs, developing new product etc. Persuade your audience using this Development Model To Achieve Business Goals Infographics PDF. This PPT design covers six stages, thus making it a great tool to use. It also caters to a variety of topics including Evaluate Existing Customers, Determine Unsatisfied, Develop New Product. Download this PPT design now to present a convincing pitch that not only emphasizes the topic but also showcases your presentation skills.
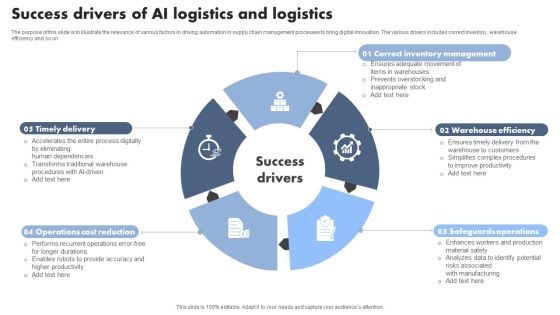
Success Drivers Of AI Logistics And Logistics Infographics PDF
The purpose of this slide is to illustrate the relevance of various factors in driving automation in supply chain management processes to bring digital innovation. The various drivers includes correct inventory, warehouse efficiency and so on. Presenting Success Drivers Of AI Logistics And Logistics Infographics PDF to dispense important information. This template comprises five stages. It also presents valuable insights into the topics including Correct Inventory Management, Warehouse Efficiency, Safeguards Operations. This is a completely customizable PowerPoint theme that can be put to use immediately. So, download it and address the topic impactfully.
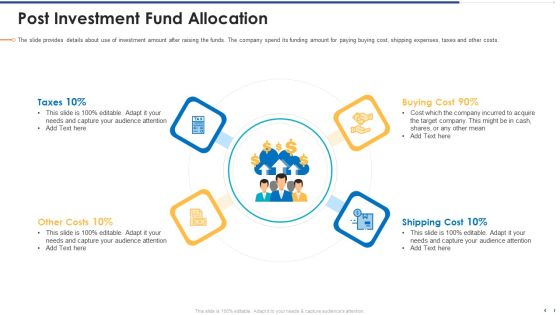
Funding Document Management Presentation Post Investment Fund Allocation Infographics PDF
The slide provides details about use of investment amount after raising the funds. The company spend its funding amount for paying buying cost, shipping expenses, taxes and other costs.Presenting funding document management presentation post investment fund allocation infographics pdf. to provide visual cues and insights. Share and navigate important information on fourstages that need your due attention. This template can be used to pitch topics like costs, shipping cost, buying cost. In addtion, this PPT design contains high resolution images, graphics, etc, that are easily editable and available for immediate download.

Discipline Agile Delivery Software Development Scaling Agile Delivery Infographics PDF
After implementing DAD agility is done on scale and following are the factors that are considered while scaling agile like large teams , geographically distributed teams, compliance, domain complexity, technical complexity and organizational distribution. This is a discipline agile delivery software development scaling agile delivery infographics pdf template with various stages. Focus and dispense information on six stages using this creative set, that comes with editable features. It contains large content boxes to add your information on topics like domain complexity, compliance, technical complexity, organizational distribution, geographically distributed teams. You can also showcase facts, figures, and other relevant content using this PPT layout. Grab it now.

Agile Project Management Strategy Agile Management Team Structures Infographics PDF
This slide provides the glimpse about the agile management team structures such as T shaped, cross functional, adaptable, curious, entrepreneurial, team oriented and committed to excellence.Presenting agile project management strategy agile management team structures infographics pdf to provide visual cues and insights. Share and navigate important information on seven stages that need your due attention. This template can be used to pitch topics like committed to excellence, cross functional, entrepreneurial. In addtion, this PPT design contains high resolution images, graphics, etc, that are easily editable and available for immediate download.
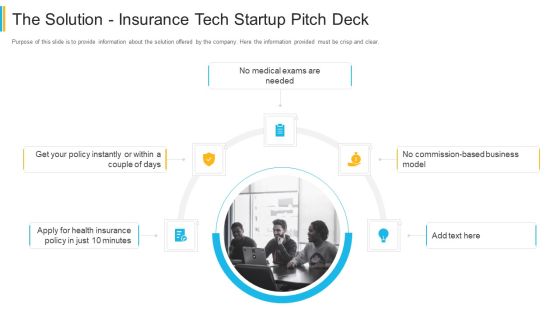
The Solution Insurance Tech Startup Pitch Deck Infographics PDF
Purpose of this slide is to provide information about the solution offered by the company. Here the information provided must be crisp and clear. Presenting the solution insurance tech startup pitch deck infographics pdf to provide visual cues and insights. Share and navigate important information on five stages that need your due attention. This template can be used to pitch topics like policy instantly, health insurance, medical exams. In addtion, this PPT design contains high resolution images, graphics, etc, that are easily editable and available for immediate download.

Cyber Exploitation IT Purpose Of Hackers Infographics PDF
This slide describes the common types of cybercrime such as identity theft, computer fraud, privacy breach, electronic money laundering, electronic funds transfer, and so on. This is a cyber exploitation it purpose of hackers infographics pdf template with various stages. Focus and dispense information on ten stages using this creative set, that comes with editable features. It contains large content boxes to add your information on topics like computer fraud, privacy breach, electronic money laundering, electronic funds transfer, denial of service attacks. You can also showcase facts, figures, and other relevant content using this PPT layout. Grab it now.
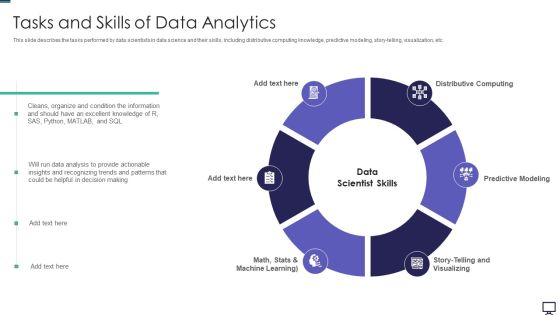
Tasks And Skills Of Data Analytics Ppt Infographics Summary PDF
This slide describes the tasks performed by data scientists in data science and their skills, including distributive computing knowledge, predictive modeling, story-telling, visualization, etc. Presenting tasks and skills of data analytics ppt infographics summary pdf to provide visual cues and insights. Share and navigate important information on six stages that need your due attention. This template can be used to pitch topics like data analysis, information, predictive modeling, distributive computing. In addtion, this PPT design contains high resolution images, graphics, etc, that are easily editable and available for immediate download.
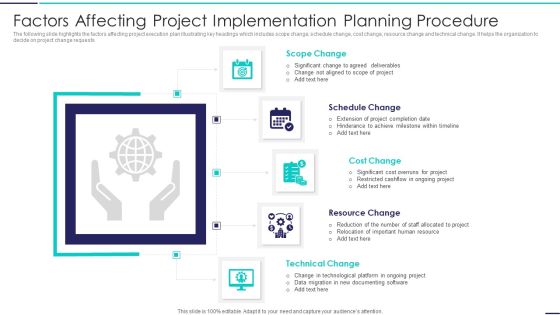
Factors Affecting Project Implementation Planning Procedure Infographics PDF
The following slide highlights the factors affecting project execution plan illustrating key headings which includes scope change, schedule change, cost change, resource change and technical change. It helps the organization to decide on project change requests Presenting Factors Affecting Project Implementation Planning Procedure Infographics PDF to dispense important information. This template comprises five stages. It also presents valuable insights into the topics including Schedule Change, Cost Change, Resource Change. This is a completely customizable PowerPoint theme that can be put to use immediately. So, download it and address the topic impactfully.

Asset Monitoring Technologies To Improve Maintenance Infographics PDF
This slide covers technologies of asset tracking to improve asset lifecycle maintenance. It involves technologies such as barcode, radio frequency identification, bluetooth low energy and global positioning system.Persuade your audience using this Asset Monitoring Technologies To Improve Maintenance Infographics PDF This PPT design covers four stages, thus making it a great tool to use. It also caters to a variety of topics including Frequency Identification, Global Positioning, Bluetooth Energy Download this PPT design now to present a convincing pitch that not only emphasizes the topic but also showcases your presentation skills.
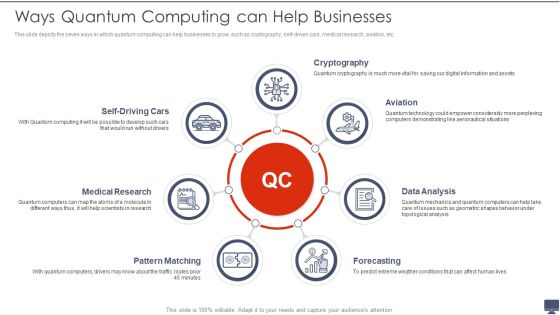
Ways Quantum Computing Can Help Businesses Ppt Infographics Portrait PDF
This slide depicts the seven ways in which quantum computing can help businesses to grow, such as cryptography, self driven cars, medical research, aviation, etc. This is a Ways Quantum Computing Can Help Businesses Ppt Infographics Portrait PDF template with various stages. Focus and dispense information on seven stages using this creative set, that comes with editable features. It contains large content boxes to add your information on topics like Cryptography, Data Analysis, Pattern Matching. You can also showcase facts, figures, and other relevant content using this PPT layout. Grab it now.

VID Managing End User Computing In The Company Infographics PDF
This slide represents how we will manage to end user computing and it includes to adopt centralized application deployment, preparation for changing job roles, know users and so on.Presenting VID Managing End User Computing In The Company Infographics PDF to provide visual cues and insights. Share and navigate important information on five stages that need your due attention. This template can be used to pitch topics like Security Implications, Application Performance, Endeavor And Metrics. In addtion, this PPT design contains high resolution images, graphics, etc, that are easily editable and available for immediate download.

Procurement Analytics Tools And Strategies Contract Management Terms Infographics PDF
This slide covers contract management terms with suppliers or vendors in procurement analysis such as effective and efficient management of performance.Presenting Procurement Analytics Tools And Strategies Contract Management Terms Infographics PDF to provide visual cues and insights. Share and navigate important information on seven stages that need your due attention. This template can be used to pitch topics like Effective And Efficient, Management Of Performance, Delivery And Payment. In addtion, this PPT design contains high resolution images, graphics, etc, that are easily editable and available for immediate download.

Data Analytics Management Big Data Management In Telecommunication Infographics PDF
This slide represents the big data application in telecommunication and helps in product optimization, increased network protection, predictive analytics, and fraud detection.Presenting Data Analytics Management Big Data Management In Telecommunication Infographics PDF to provide visual cues and insights. Share and navigate important information on ten stages that need your due attention. This template can be used to pitch topics like Product Optimization, Predictive Analytics, Fraud Detection. In addtion, this PPT design contains high resolution images, graphics, etc, that are easily editable and available for immediate download.

Information Studies Tasks And Skills Of Data Architect Infographics PDF
This slide defines the data architects tasks in data science projects and their skills, covering data warehousing solutions, database knowledge, ETL, spreadsheets, and data modeling. This is a Information Studies Tasks And Skills Of Data Architect Infographics PDF template with various stages. Focus and dispense information on six stages using this creative set, that comes with editable features. It contains large content boxes to add your information on topics like Data Warehousing Solutions, System Development, Data Modeling. You can also showcase facts, figures, and other relevant content using this PPT layout. Grab it now.

Four Effective Bussiness Strategies For Retail Stores Infographics PDF
This slide represents the four effective retail marketing strategies to be adopted by retail business owners. It includes taking strategic decisions regarding the type of product to be produced, its price, location and promotional strategies. Persuade your audience using this Four Effective Bussiness Strategies For Retail Stores Infographics PDF. This PPT design covers four stages, thus making it a great tool to use. It also caters to a variety of topics including Product, Price, Promotion. Download this PPT design now to present a convincing pitch that not only emphasizes the topic but also showcases your presentation skills.

Certified Information Systems Security Professional CISSP Examination Details Infographics PDF
This slide covers information about CISSP Examination such as weight of each domain in exams, prep courses details, qualification details etc. This is a Certified Information Systems Security Professional CISSP Examination Details Infographics PDF template with various stages. Focus and dispense information on eight stages using this creative set, that comes with editable features. It contains large content boxes to add your information on topics like Requirements, Network Security, Risk Management. You can also showcase facts, figures, and other relevant content using this PPT layout. Grab it now.
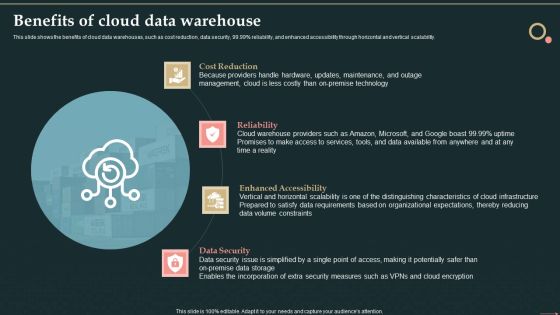
Management Information System Benefits Of Cloud Data Warehouse Infographics PDF
This slide shows the benefits of cloud data warehouses, such as cost reduction, data security, 99.99 present reliability, and enhanced accessibility through horizontal and vertical scalability.This is a Management Information System Benefits Of Cloud Data Warehouse Infographics PDF template with various stages. Focus and dispense information on four stages using this creative set, that comes with editable features. It contains large content boxes to add your information on topics like Distinguishing Characteristics, Organizational Expectations, Cloud Infrastructure. You can also showcase facts, figures, and other relevant content using this PPT layout. Grab it now.

Value Creation Business Integrated Supply Chain Management Model Infographics PDF
This slide shows ways of creating value in supply chain management to create competitive edge for the company. It includes steps such as logistics, information technology, supply chain integration etc. Presenting Value Creation Business Integrated Supply Chain Management Model Infographics PDF to dispense important information. This template comprises four stages. It also presents valuable insights into the topics including Network And Relationship Management, Information Technology, Supply Chain Integration. This is a completely customizable PowerPoint theme that can be put to use immediately. So, download it and address the topic impactfully.

Why Economic Stability Is Essential In Life Infographics PDF
This slide covers need of financial stability in life. It involves reasons such as physical and mental wellbeing, job opportunities, retirement and owning permanent home. Persuade your audience using this Why Economic Stability Is Essential In Life Infographics PDF. This PPT design covers four stages, thus making it a great tool to use. It also caters to a variety of topics including Job Opportunities, Mental Wellbeing, Age Retirement. Download this PPT design now to present a convincing pitch that not only emphasizes the topic but also showcases your presentation skills.

Diversity Dimensions Currently Focused At Workplace Infographics PDF
This slide provides information regarding the primary, secondary and tertiary dimensions of workplace diversity. It also highlights the diversity dimensions currently focused at workplace such as gender, age, ethnicity etc. Slidegeeks is one of the best resources for PowerPoint templates. You can download easily and regulate Diversity Dimensions Currently Focused At Workplace Infographics PDF for your personal presentations from our wonderful collection. A few clicks is all it takes to discover and get the most relevant and appropriate templates. Use our Templates to add a unique zing and appeal to your presentation and meetings. All the slides are easy to edit and you can use them even for advertisement purposes.

Major Trends Associated With International Marketing Ppt Infographics Guidelines PDF
This slide represents key global marketing trends that helps organizations to grow and expand in market. It covers automated marketing, brand advocates, live streaming etc. Present like a pro with Major Trends Associated With International Marketing Ppt Infographics Guidelines PDF Create beautiful presentations together with your team, using our easy to use presentation slides. Share your ideas in real time and make changes on the fly by downloading our templates. So whether you are in the office, on the go, or in a remote location, you can stay in sync with your team and present your ideas with confidence. With Slidegeeks presentation got a whole lot easier. Grab these presentations today.

Roles And Responsibilities Of Data Profiling Solutions Scientist Infographics PDF
This slide illustrates roles and responsibilities of data profiling scientist which can be referred by IT companies HR managers to get familiar with business requirements linked with hiring or selecting of new candidate for the said position. It contains information about machine learning, data mining, extending, augmenting, processing, etc. Presenting Roles And Responsibilities Of Data Profiling Solutions Scientist Infographics PDF to dispense important information. This template comprises five stages. It also presents valuable insights into the topics including Data Mining, Machine Learning, Processing, Augmenting. This is a completely customizable PowerPoint theme that can be put to use immediately. So, download it and address the topic impactfully.

Building Blocks Of IT Operating Framework Ppt Infographics Microsoft PDF
This slide shows building blocks of IT operating model to implement technologically superior strategy. It includes parts such as technology, process, culture, structure, change management, and digitize platform. Persuade your audience using this Building Blocks Of IT Operating Framework Ppt Infographics Microsoft PDF. This PPT design covers six stages, thus making it a great tool to use. It also caters to a variety of topics including Technology, Digitize Platform, Change Management. Download this PPT design now to present a convincing pitch that not only emphasizes the topic but also showcases your presentation skills.

Steps To Conduct Information Technology Assessment Infographics PDF
The following slide illustrates the process to conduct IT assessment leverage advantage of latest tools. It includes elements such as determine goals, drafting project budget, list of queries, connecting with consultant, improving current solutions etc. Persuade your audience using this Steps To Conduct Information Technology Assessment Infographics PDF. This PPT design covers six stages, thus making it a great tool to use. It also caters to a variety of topics including Determine Goals, Draft Project Budget, Draft List Quer. Download this PPT design now to present a convincing pitch that not only emphasizes the topic but also showcases your presentation skills.
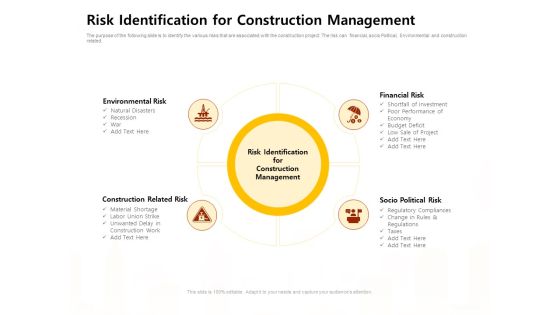
Risk Identification For Construction Management Work Ppt Infographics Graphics PDF
The purpose of the following slide is to identify the various risks that are associated with the construction project. The risk can financial, socio Political, Environmental and construction related. This is a risk identification for construction management work ppt infographics graphics pdf template with various stages. Focus and dispense information on four stages using this creative set, that comes with editable features. It contains large content boxes to add your information on topics like environmental risk, construction related risk, financial risk, socio political risk. You can also showcase facts, figures, and other relevant content using this PPT layout. Grab it now.

Steps For Insights In Dataset With Analysis Ppt Infographics PDF
This slide illustrate step for data analytics for extracting insights from the available data set for data mining and cleaning. It include steps like descriptive analytics, diagnosis analytics, predictive analytics and perspective analytics. Persuade your audience using this Steps For Insights In Dataset With Analysis Ppt Infographics PDF. This PPT design covers four stages, thus making it a great tool to use. It also caters to a variety of topics including Descriptive Analytics, Diagnostics Analytics, Predicative Analytics, Prescriptive Analytics. Download this PPT design now to present a convincing pitch that not only emphasizes the topic but also showcases your presentation skills.

Tips To Redesign Successful Operating Framework Ppt File Infographics PDF
This slide shows ways of successfully redesigning an operating model to apply approved approaches. It includes steps such as strategic clarity, design parameters, and decision effectiveness. Persuade your audience using this Tips To Redesign Successful Operating Framework Ppt File Infographics PDF. This PPT design covers four stages, thus making it a great tool to use. It also caters to a variety of topics including Strategic Clarity, Prioritize Capabilities, Decision Effectiveness. Download this PPT design now to present a convincing pitch that not only emphasizes the topic but also showcases your presentation skills.

Major Constituents Of Hospital Management Software Ppt Infographics Professional PDF
This Slide shows various components of hospital management system. It includes informati0on about cash billing, appointment, operation department, inventory, medicine, security, accounting, etc. Persuade your audience using this Major Constituents Of Hospital Management Software Ppt Infographics Professional PDF. This PPT design covers thirteen stages, thus making it a great tool to use. It also caters to a variety of topics including Operation Department, Inpatient Department, Hospital Laboratory. Download this PPT design now to present a convincing pitch that not only emphasizes the topic but also showcases your presentation skills.

E Commerce Tech Partnership Ecosystem Ppt Infographics Example PDF
This slide exhibits e-commerce technology partnership illustrating business and cloud services, hardware, artificial intelligence, smart devices etc to develop and ecosystem landscape. Persuade your audience using this E Commerce Tech Partnership Ecosystem Ppt Infographics Example PDF. This PPT design covers four stages, thus making it a great tool to use. It also caters to a variety of topics including Hardware, Smart Devices, Artificial Intelligence, Healthcare. Download this PPT design now to present a convincing pitch that not only emphasizes the topic but also showcases your presentation skills.

New Software Training Project Rollout Roadmap Calendar Infographics PDF
This slide shows new software training plan rollout schedule for helping employees to adapt technical advancement. It include steps such as passing login instructions, getting familiar with app, building separate project team etc. Presenting New Software Training Project Rollout Roadmap Calendar Infographics PDF to dispense important information. This template comprises Nine stages. It also presents valuable insights into the topics including Pass Login Instructions, Build Separate Project Team, Develop Content Plan. This is a completely customizable PowerPoint theme that can be put to use immediately. So, download it and address the topic impactfully.

Workplace Safety Best Practices Hazard Prevention And Control Infographics PDF
This slide highlights the hard prevention and control measures which includes check control options, select control plan, measure non routine operations and implement hazard controls. If your project calls for a presentation, then Slidegeeks is your go to partner because we have professionally designed, easy to edit templates that are perfect for any presentation. After downloading, you can easily edit Workplace Safety Best Practices Hazard Prevention And Control Infographics PDF and make the changes accordingly. You can rearrange slides or fill them with different images. Check out all the handy templates

Implementing Marketing Strategies Off Site Seo Overview Infographics PDF
The following site provides an overview of the Off-Site SEO as a strategy that is being performed by the organization, the provided slide displays overview of the off site SEO activities such as Blogs, forums, articles and social media. Are you in need of a template that can accommodate all of your creative concepts This one is crafted professionally and can be altered to fit any style. Use it with Google Slides or PowerPoint. Include striking photographs, symbols, depictions, and other visuals. Fill, move around, or remove text boxes as desired. Test out color palettes and font mixtures. Edit and save your work, or work with colleagues. Download Implementing Marketing Strategies Off Site Seo Overview Infographics PDF and observe how to make your presentation outstanding. Give an impeccable presentation to your group and make your presentation unforgettable.

Market Intelligence Framework Ppt PowerPoint Presentation Outline Infographics
This is a market intelligence framework ppt powerpoint presentation outline infographics. This is a eight stage process. The stages in this process are definitions and taxonomy, market models, analyst insight, technology adoption, forecast methodology, supply site analysis.
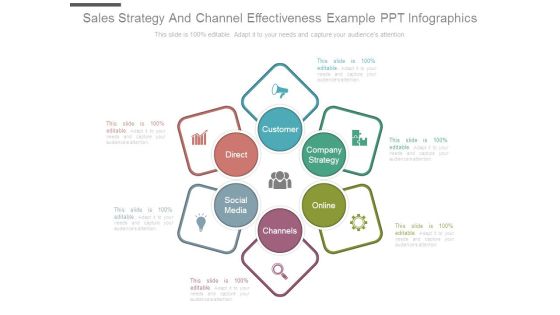
Sales Strategy And Channel Effectiveness Example Ppt Infographics
This is a sales strategy and channel effectiveness example ppt infographics. This is a six stage process. The stages in this process are customer, direct, company strategy, online, channels, social media.

Key Points To Increase Market Share Ppt PowerPoint Presentation Infographics
This is a key points to increase market share ppt powerpoint presentation infographics. This is a four stage process. The stages in this process are increased sales performance, higher deal completion rate, increased deal visibility, increased deal flow.
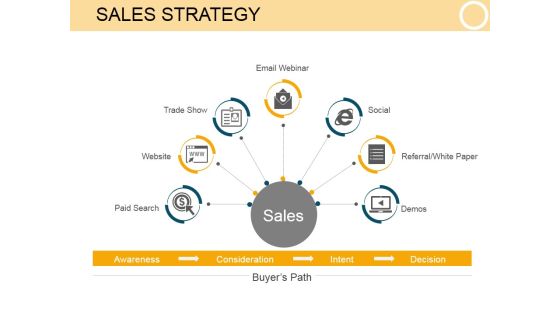
Sales Strategy Template 2 Ppt PowerPoint Presentation Infographics
This is a sales strategy template 2 ppt powerpoint presentation infographics. This is a seven stage process. The stages in this process are paid search, website, trade show, email webinar, social, referral white paper, demos, sales.
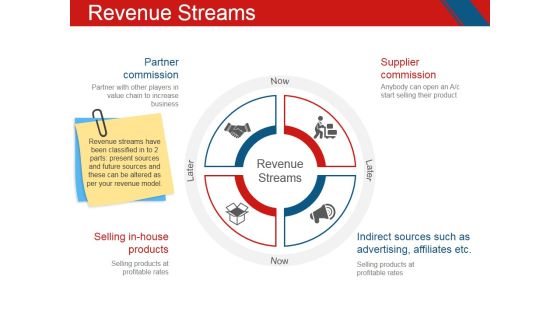
Revenue Streams Template 1 Ppt PowerPoint Presentation Infographics
This is a revenue streams template 1 ppt powerpoint presentation infographics. This is a four stage process. The stages in this process are partner commission, supplier commission, selling in house products, indirect sources such as advertising, affiliates.

Business Model Innovation Segments Ppt PowerPoint Presentation Gallery Infographics
This is a business model innovation segments ppt powerpoint presentation gallery infographics. This is a three stage process. The stages in this process are revenue model innovation, customer model innovation, organizational model innovation, business model innovation.

Demand Creation System Ppt PowerPoint Presentation Outline Infographics
Presenting this set of slides with name demand creation system ppt powerpoint presentation outline infographics. This is a three stage process. The stages in this process are value innovation, opportunity and threat discovery, value enhancement. This is a completely editable PowerPoint presentation and is available for immediate download. Download now and impress your audience.
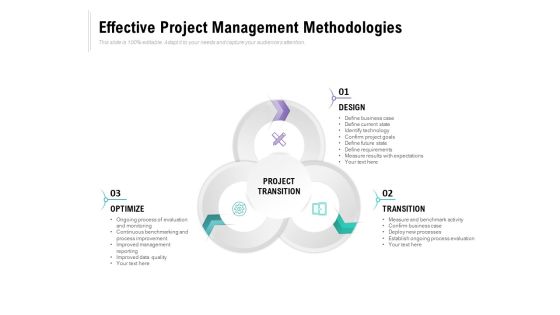
Effective Project Management Methodologies Ppt PowerPoint Presentation Ideas Infographics
Presenting this set of slides with name effective project management methodologies ppt powerpoint presentation ideas infographics. This is a three stage process. The stages in this process are project transition, optimize, transition, design. This is a completely editable PowerPoint presentation and is available for immediate download. Download now and impress your audience.

Components Of Marketing Information System Ppt PowerPoint Presentation Slides Infographics
Presenting this set of slides with name components of marketing information system ppt powerpoint presentation slides infographics. This is a five stage process. The stages in this process are maintaining consistency, timing it important, ensuring accuracy, update and maintain database, management team. This is a completely editable PowerPoint presentation and is available for immediate download. Download now and impress your audience.

Team Building Experiences Ppt PowerPoint Presentation File Infographics
Presenting this set of slides with name team building experiences ppt powerpoint presentation file infographics. This is an editable Powerpoint five stages graphic that deals with topics like team building experiences to help convey your message better graphically. This product is a premium product available for immediate download, and is 100 percent editable in Powerpoint. Download this now and use it in your presentations to impress your audience.

Business Classification By Industry Sectors Ppt PowerPoint Presentation Inspiration Infographics
Presenting this set of slides with name business classification by industry sectors ppt powerpoint presentation inspiration infographics. This is a four stage process. The stages in this process are application, mobile screen, business transformation. This is a completely editable PowerPoint presentation and is available for immediate download. Download now and impress your audience.

Business Infographics Cycle Of Five Steps Powerpoint Template
Our above business slide has been designed with cycle diagram of five options. This slide is suitable to present business management and strategy. Use our creative PowerPoint template to lay down your views.

Interviewing Tips Managers Ppt PowerPoint Presentation Show Infographics Cpb
Presenting this set of slides with name interviewing tips managers ppt powerpoint presenta. This is an editable Powerpoint four stages graphic that deals with topics like interviewing tips managers to help convey your message better graphically. This product is a premium product available for immediate download and is 100 percent editable in Powerpoint. Download this now and use it in your presentations to impress your audience.
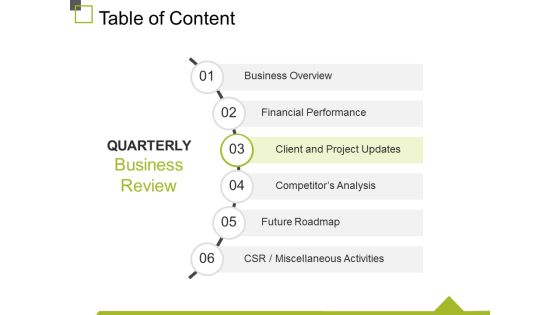
Table Of Content Template 4 Ppt PowerPoint Presentation Infographics Maker
This is a table of content template 1 ppt powerpoint presentation outline template. This is a six stage process. The stages in this process are business overview, financial performance, client and project updates, competitor s analysis, future roadmap.

Business Strategies Ppt PowerPoint Presentation Infographics Layout Cpb
This is a Business Strategies Ppt PowerPoint Presentation Outline Display Cpb. This is a six stage process. The stages in this process are Business Strategies.

Competitive And Market Analysis Ppt PowerPoint Presentation Infographics Pictures
This is a competitive and market analysis ppt powerpoint presentation infographics pictures. This is a seven stage process. The stages in this process are market size, market segments, customer mix, competition influence, competitors, spending group, market analysis, market share.

Mind Map Ppt PowerPoint Presentation Infographics Design Inspiration
This is a mind map ppt powerpoint presentation infographics design inspiration. This is a four stage process. The stages in this process are mind map, process, ideas, business, marketing.
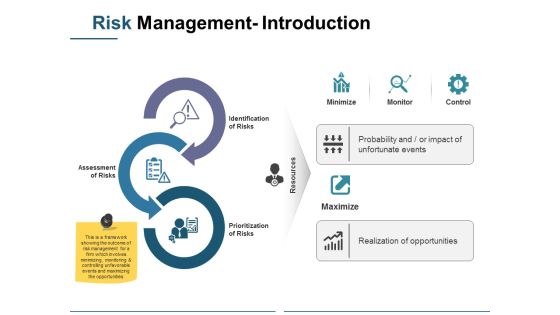
Risk Management Introduction Ppt PowerPoint Presentation Infographics Design Inspiration
This is a risk management introduction ppt powerpoint presentation infographics design inspiration. This is a three stage process. The stages in this process are prioritization of risks, assessment of risks, identification of risks, minimize, monitor.
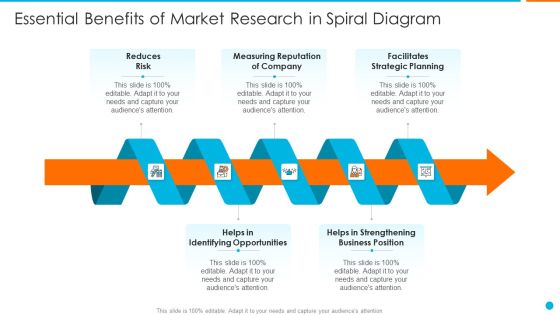
Essential Benefits Of Market Research In Spiral Diagram Infographics PDF
Persuade your audience using this essential benefits of market research in spiral diagram infographics pdf. This PPT design covers five stages, thus making it a great tool to use. It also caters to a variety of topics including reduces risk, measuring reputation of company, facilitates strategic planning, helps in identifying opportunities, helps in strengthening business position. Download this PPT design now to present a convincing pitch that not only emphasizes the topic but also showcases your presentation skills.

Digital Marketing Process For Insurance Companies Infographics PDF
This slide shows digital marketing process for insurance companies which contains messaging, search optimization, authority, conversion, visibility, trust and lead generation. Presenting Digital Marketing Process For Insurance Companies Infographics PDF to dispense important information. This template comprises seven stages. It also presents valuable insights into the topics including Search Optimization, Lead Generation, Conversion. This is a completely customizable PowerPoint theme that can be put to use immediately. So, download it and address the topic impactfully.

Four Option Infographics Circle With Globe Powerpoint Template
Download this exclusive business diagram to present ideas of global business management. This PPT slide contains four option infographic circles with globe. This diagram can be used for business related presentations.
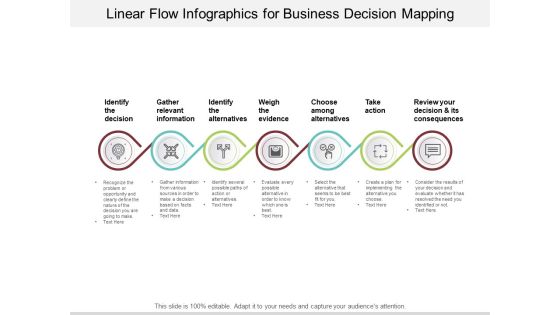
Linear Flow Infographics For Business Decision Mapping Ppt PowerPoint Presentation Infographics Graphics Example
Presenting this set of slides with name linear flow infographics for business decision mapping ppt powerpoint presentation infographics graphics example. This is a seven stage process. The stages in this process are decision making slides, strategic decision, business decision. This is a completely editable PowerPoint presentation and is available for immediate download. Download now and impress your audience.
Seven Steps Concentric Circles Process With Icons Ppt Powerpoint Presentation Infographics Introduction
This is a seven steps concentric circles process with icons ppt powerpoint presentation infographics introduction. This is a seven stage process. The stages in this process are 7 concentric circles, 7 circular cycle, 7 circular diagram.
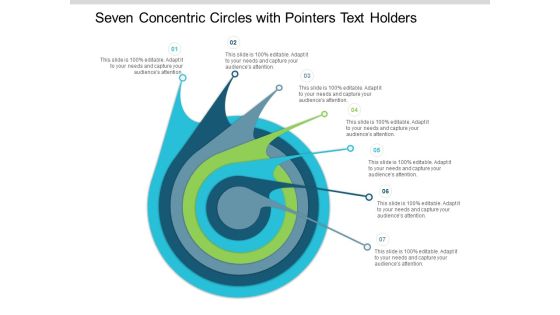
Seven Concentric Circles With Pointers Text Holders Ppt Powerpoint Presentation Infographics Visual Aids
This is a seven concentric circles with pointers text holders ppt powerpoint presentation infographics visual aids. This is a seven stage process. The stages in this process are 7 concentric circles, 7 circular cycle, 7 circular diagram.
Three Concentric Circles With Pointers Text Holders Ppt Powerpoint Presentation Infographics Slides
This is a three concentric circles with pointers text holders ppt powerpoint presentation infographics slides. This is a three stage process. The stages in this process are 7 concentric circles, 7 circular cycle, 7 circular diagram.
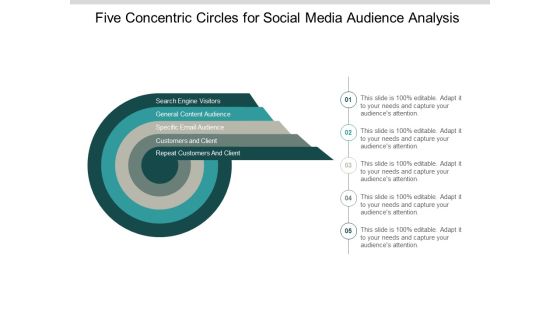
Five Concentric Circles For Social Media Audience Analysis Ppt PowerPoint Presentation Infographics File Formats
This is a Five Concentric Circles For Social Media Audience Analysis Ppt PowerPoint Presentation Infographics File Formats. This is a stage process. The stages in this process are 7 concentric circles, 7 circular cycle, 7 circular diagram.

Six Concentric Circles With Outward Pointers And Text Holders Ppt Powerpoint Presentation Infographics Information
This is a six concentric circles with outward pointers and text holders ppt powerpoint presentation infographics information. This is a stage process. The stages in this process are 7 concentric circles, 7 circular cycle, 7 circular diagram.
Four Arrows With Icons For Business Process Flow Ppt Powerpoint Presentation Infographics File Formats
This is a four arrows with icons for business process flow ppt powerpoint presentation infographics file formats. This is a four stage process. The stages in this process are 6 Circular Arrows, 6 Cyclic Arrows, Six Circular Arrows.
Four Arrows Around Target Board With Icons Ppt Powerpoint Presentation Infographics Picture
This is a four arrows around target board with icons ppt powerpoint presentation infographics picture. This is a four stage process. The stages in this process are 6 Circular Arrows, 6 Cyclic Arrows, Six Circular Arrows.
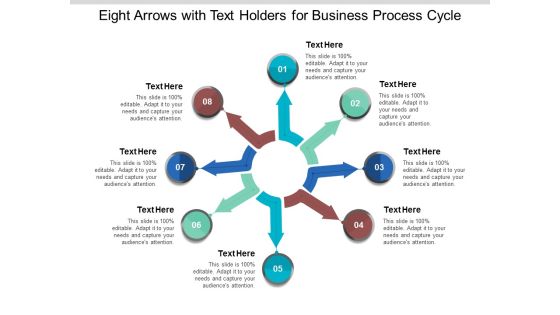
Eight Arrows With Text Holders For Business Process Cycle Ppt Powerpoint Presentation Infographics Example Introduction
This is a eight arrows with text holders for business process cycle ppt powerpoint presentation infographics example introduction. This is a eight stage process. The stages in this process are 6 circular arrows, 6 cyclic arrows, six circular arrows.

Buying Process Brand Awareness And Evaluation Of Alternatives Ppt PowerPoint Presentation Infographics Graphics Tutorials
This is a buying process brand awareness and evaluation of alternatives ppt powerpoint presentation infographics graphics tutorials. This is a five stage process. The stages in this process are purchasing process, purchasing cycle, procurement cycle.

Continuous Series Of Business Steps Ppt PowerPoint Presentation Infographics Templates
This is a continuous series of business steps ppt powerpoint presentation infographics templates. This is a six stage process. The stages in this process are circular, continuity, continuum.
Personality Traits Percentage Scale Ppt PowerPoint Presentation Infographics Icon
This is a personality traits percentage scale ppt powerpoint presentation infographics icon. This is a six stage process. The stages in this process are circular, continuity, continuum.

The Problem Template 1 Ppt PowerPoint Presentation Infographics Background
This is a the problem template 1 ppt powerpoint presentation infographics background. This is a one stage process. The stages in this process are strategy, business, process, circular.
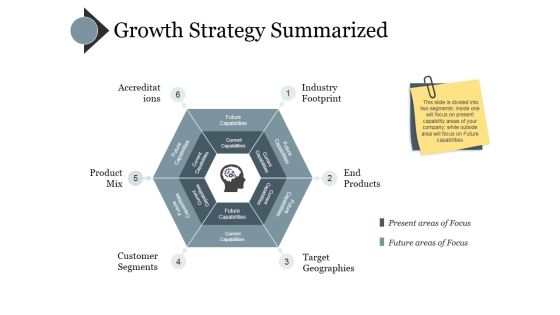
Growth Strategy Summarized Ppt PowerPoint Presentation Infographics Example Introduction
This is a growth strategy summarized ppt powerpoint presentation infographics example introduction. This is a six stage process. The stages in this process are future capabilities, current capabilities.
Talent Acquisition Icon Ppt PowerPoint Presentation Infographics Good
This is a talent acquisition icon ppt powerpoint presentation infographics good. This is a six stage process. The stages in this process are talent acquisition icon, human resource management icon, talent management icon, hr icon.
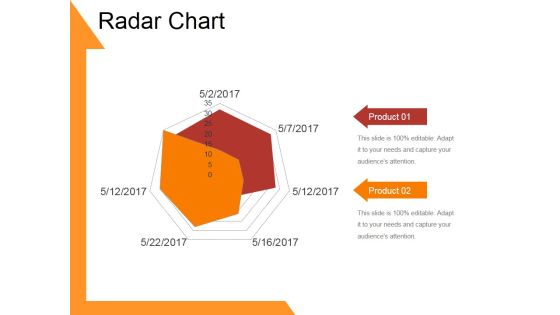
Radar Chart Template 1 Ppt PowerPoint Presentation Infographics Designs
This is a radar chart template 1 ppt powerpoint presentation infographics designs. This is a two stage process. The stages in this process are business, strategy, analysis, pretention, radar chart.
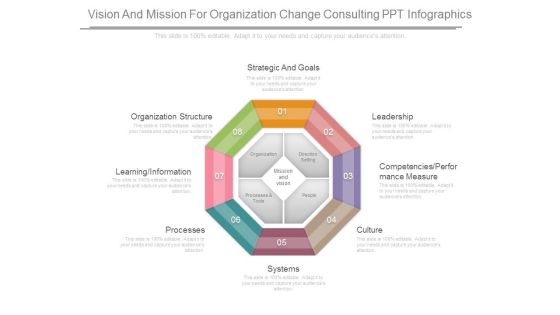
Vision And Mission For Organization Change Consulting Ppt Infographics
This is a vision and mission for organization change consulting ppt infographics. This is a eight stage process. The stages in this process are strategic and goals, leadership , culture , systems , processes , organization, structure , organization, direction setting.

Kaizen Ideas For Quality Improvement Ppt Powerpoint Presentation Infographics Graphics
Presenting this set of slides with name kaizen ideas for quality improvement ppt powerpoint presentation infographics graphics. This is a six stage process. The stages in this process are kaizen umbrella, continuous improvement, business process. This is a completely editable PowerPoint presentation and is available for immediate download. Download now and impress your audience.

Sprint Planning In Agile Project Management Ppt PowerPoint Presentation Infographics Sample
This is a sprint planning in agile project management ppt powerpoint presentation infographics sample. This is a six stage process. The stages in this process are agile cycle, sprint cycle, scrum cycle.
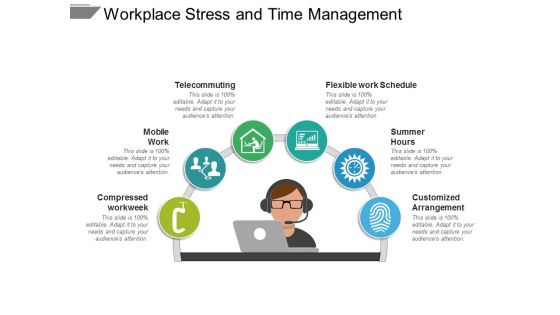
Workplace Stress And Time Management Ppt PowerPoint Presentation Infographics Designs Download
This is a workplace stress and time management ppt powerpoint presentation infographics designs download. This is a six stage process. The stages in this process are work life balance, work and leisure, career and ambition.

Data Exploration And Visualization Virtual Machine Ppt PowerPoint Presentation Infographics Diagrams
This is a data exploration and visualization virtual machine ppt powerpoint presentation infographics diagrams. This is a seven stage process. The stages in this process are data, analysis, data science, information science.

Economic Cost Efficiency Optimize The Resources Ppt PowerPoint Presentation Infographics Model
This is a economic cost efficiency optimize the resources ppt powerpoint presentation infographics model. This is a five stage process. The stages in this process are cost planning, cost efficiency, cost organization.
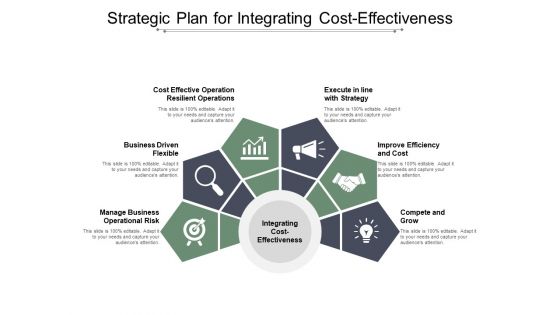
Strategic Plan For Integrating Cost Effectiveness Ppt PowerPoint Presentation Infographics Example
This is a strategic plan for integrating cost effectiveness ppt powerpoint presentation infographics example. This is a six stage process. The stages in this process are cost planning, cost efficiency, cost organization.
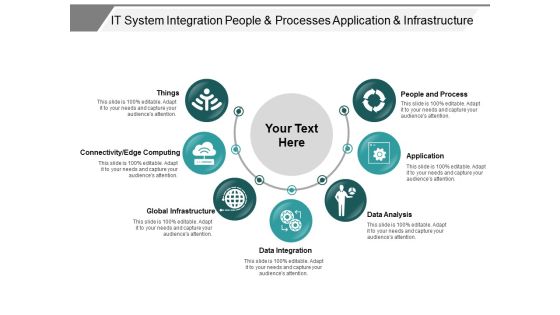
It System Integration People And Processes Application And Infrastructure Ppt PowerPoint Presentation Infographics Graphic Tips
This is a it system integration people and processes application and infrastructure ppt powerpoint presentation infographics graphic tips. This is a seven stage process. The stages in this process are osi model, technology layers, internetworking layer.
Three Stages Scp Paradigm With Icons Ppt Powerpoint Presentation Infographics Graphics
This is a three stages scp paradigm with icons ppt powerpoint presentation infographics graphics. This is a three stage process. The stages in this process are performance management, structure conduct performance, performance review and analysis.
Sperm With Male Female Icon Ppt Powerpoint Presentation Infographics Background Image
This is a sperm with male female icon ppt powerpoint presentation infographics background image. This is a two stage process. The stages in this process are fertility, productiveness, fecundity.
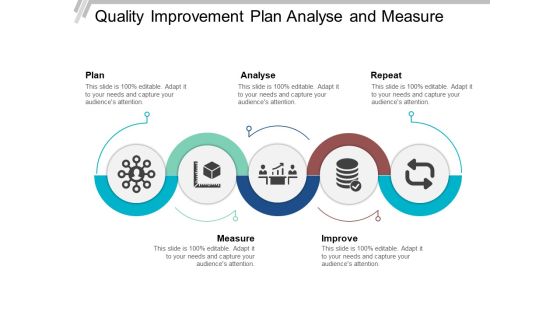
Quality Improvement Plan Analyse And Measure Ppt PowerPoint Presentation Infographics Picture
This is a quality improvement plan analyse and measure ppt powerpoint presentation infographics picture. This is a five stage process. The stages in this process are quality roadmap, quality timeline, quality linear process.
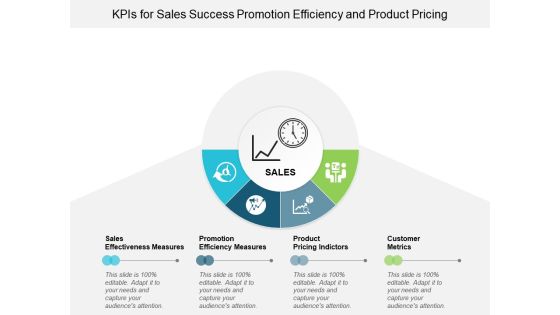
Kpis For Sales Success Promotion Efficiency And Product Pricing Ppt Powerpoint Presentation Infographics Background Images
This is a kpis for sales success promotion efficiency and product pricing ppt powerpoint presentation infographics background images. This is a four stage process. The stages in this process are dashboard, kpi, metrics.

Factors Affecting Work Performance Communication And Cooperation Ppt Powerpoint Presentation Infographics Introduction
This is a factors affecting work performance communication and cooperation ppt powerpoint presentation infographics introduction. This is a four stage process. The stages in this process are business outcomes, business results, business output.
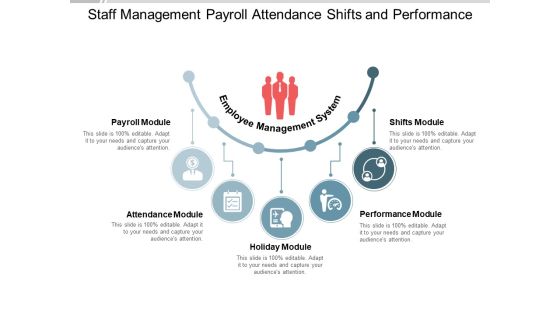
Staff Management Payroll Attendance Shifts And Performance Ppt PowerPoint Presentation Infographics Ideas
This is a staff management payroll attendance shifts and performance ppt powerpoint presentation infographics ideas. This is a five stage process. The stages in this process are employee information system, staff management system.
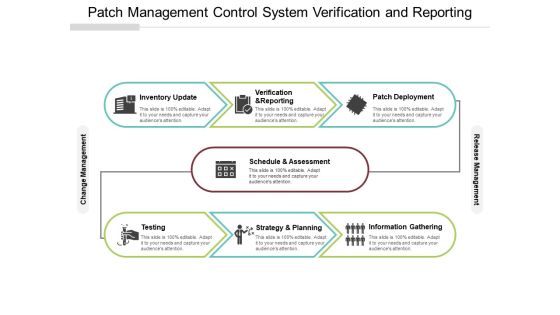
Patch Management Control System Verification And Reporting Ppt PowerPoint Presentation Infographics Backgrounds
This is a patch management control system verification and reporting ppt powerpoint presentation infographics backgrounds. This is a seven stage process. The stages in this process are patch management process, patch management procedure, patch management approach.

Ways To Promote Healthy Work Life Balance For Employees Ppt PowerPoint Presentation Infographics Example
This is a ways to promote healthy work life balance for employees ppt powerpoint presentation infographics example. This is a five stage process. The stages in this process are work life balance, work and leisure, career and ambition.

Downward Arrow On Bar Graph For Financial Loss Ppt PowerPoint Presentation Infographics Sample
This is a downward arrow on bar graph for financial loss ppt powerpoint presentation infographics sample. This is a three stage process. The stages in this process are business failure, unsuccessful business, business non success.

Implementing Clm Negotiate Approve Track And Renew Ppt PowerPoint Presentation Infographics Objects
This is a implementing clm negotiate approve track and renew ppt powerpoint presentation infographics objects. This is a eight stage process. The stages in this process are contract management, contract negotiation, deal making.
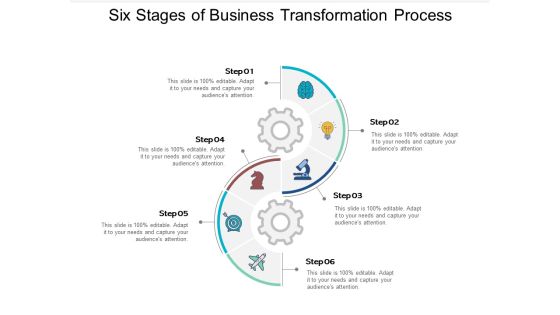
Six Stages Of Business Transformation Process Ppt PowerPoint Presentation Infographics Model
This is a six stages of business transformation process ppt powerpoint presentation infographics model. This is a six stage process. The stages in this process are 6 steps, 6 phases, 6 segments.

Internal Customer Satisfaction Responsibilities And Negotiated Priorities Ppt PowerPoint Presentation Infographics Aids
This is a internal customer satisfaction responsibilities and negotiated priorities ppt powerpoint presentation infographics aids. This is a four stage process. The stages in this process are internal customer services, internal customer satisfaction, internal customer management.
Three Arrows On Circle For Continuous Deployment Icon Ppt PowerPoint Presentation Infographics Example File
Presenting this set of slides with name three arrows on circle for continuous deployment icon ppt powerpoint presentation infographics example file. This is a three stage process. The stages in this process are continuous integration, continuous deployment, continuous deployment. This is a completely editable PowerPoint presentation and is available for immediate download. Download now and impress your audience.
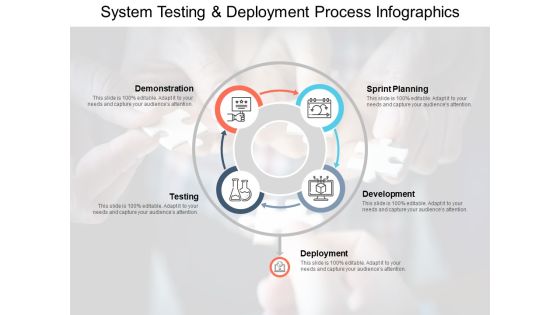
System Testing And Deployment Process Infographics Ppt PowerPoint Presentation File Visual Aids
Presenting this set of slides with name system testing and deployment process infographics ppt powerpoint presentation file visual aids. This is a four stage process. The stages in this process are software implementation, application development, implementation develop. This is a completely editable PowerPoint presentation and is available for immediate download. Download now and impress your audience.
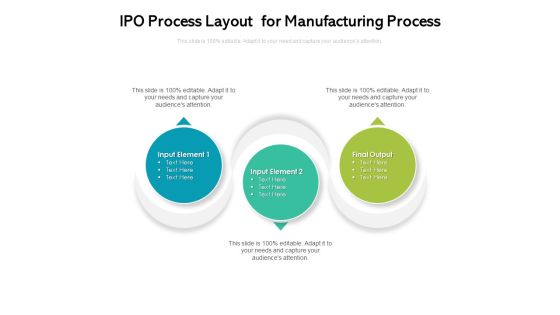
IPO Process Layout For Manufacturing Process Ppt PowerPoint Presentation Infographics Example Topics PDF
Presenting ipo process layout for manufacturing process ppt powerpoint presentation infographics example topics pdf to dispense important information. This template comprises three stages. It also presents valuable insights into the topics including input element. This is a completely customizable PowerPoint theme that can be put to use immediately. So, download it and address the topic impactfully.

Boosting Product Sales Through Branding Why Branding Strategy Is Important Infographics PDF
This slide focuses on the importance of branding strategy for company which includes communicates value proposition, develops trust and loyalty, differentiates company from competitors, boosts value, etc. Get a simple yet stunning designed Boosting Product Sales Through Branding Why Branding Strategy Is Important Infographics PDF. It is the best one to establish the tone in your meetings. It is an excellent way to make your presentations highly effective. So, download this PPT today from Slidegeeks and see the positive impacts. Our easy-to-edit Boosting Product Sales Through Branding Why Branding Strategy Is Important Infographics PDF can be your go-to option for all upcoming conferences and meetings. So, what are you waiting for Grab this template today.

Steps Involved In Devops Process And Methodology Ppt Infographics Designs Download PDF
This slide provides the glimpse about the steps involved in DevOps process and methodology which focuses on plan, code, build, test, package, release, operate and monitor. Whether you have daily or monthly meetings, a brilliant presentation is necessary. Steps Involved In Devops Process And Methodology Ppt Infographics Designs Download PDF can be your best option for delivering a presentation. Represent everything in detail using Steps Involved In Devops Process And Methodology Ppt Infographics Designs Download PDF and make yourself stand out in meetings. The template is versatile and follows a structure that will cater to your requirements. All the templates prepared by Slidegeeks are easy to download and edit. Our research experts have taken care of the corporate themes as well. So, give it a try and see the results.

Role Of Insider Threat In Cyber Security Management Technologies In Banking Industry Infographics PDF
This slide shows role of insider threat management technologies in banking industry. It provides information about identifying user risk, protecting from data loss and accelerating threat response. Presenting Role Of Insider Threat In Cyber Security Management Technologies In Banking Industry Infographics PDF to dispense important information. This template comprises three stages. It also presents valuable insights into the topics including Identifying User Risk, Accelerating Threat Response, Protecting Data Loss. This is a completely customizable PowerPoint theme that can be put to use immediately. So, download it and address the topic impactfully.

Tactics For Medical Equipment Design And Development Ppt Icon Infographics PDF
The following slide showcases tactics to assist in designing and developing medical devices. Common tactics covered are record critical requirements, prototyping and obtaining clinical inputs. Persuade your audience using this Tactics For Medical Equipment Design And Development Ppt Icon Infographics PDF. This PPT design covers three stages, thus making it a great tool to use. It also caters to a variety of topics including Record Critical Requirements, Prototyping Obtain, Clinical Input. Download this PPT design now to present a convincing pitch that not only emphasizes the topic but also showcases your presentation skills.

Major Clients Of Our Brand Strategy Consulting Proposal Ppt PowerPoint Presentation Gallery Infographics PDF
The purpose of this slide is to showcase the most important clients which have worked with our brand consulting firm. It covers information about the total sales generated for clients by offering. Take your presentations to the next level with our Major Clients Of Our Brand Strategy Consulting Proposal Ppt PowerPoint Presentation Gallery Infographics PDF template. With its sleek design and seamless editing features, this single-slide PPT template is a game-changer for professionals who want to make an impact. Impress your audience with stunning visuals and engaging content that will capture their attention from start to finish. Get your hands on our template and elevate your presentations to new heights.

Three Stages Circle Infographics Layout Ppt PowerPoint Presentation File Visuals
Presenting this set of slides with name three stages circle infographics layout ppt powerpoint presentation file visuals. This is a three stage process. The stages in this process are 3 step circle diagram, process infographic, business goals. This is a completely editable PowerPoint presentation and is available for immediate download. Download now and impress your audience.
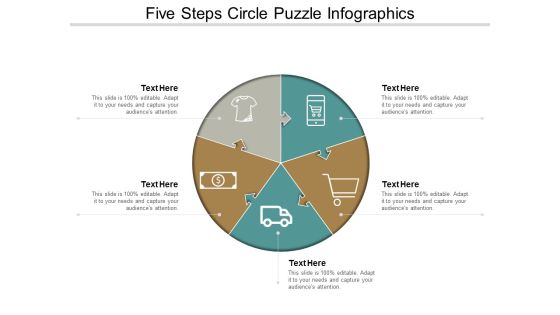
Five Steps Circle Puzzle Infographics Ppt Powerpoint Presentation Professional Structure
This is a five steps circle puzzle infographics ppt powerpoint presentation professional structure. This is a five stage process. The stages in this process are strategy, problem solution, arrow puzzle.

 Home
Home