Indicators
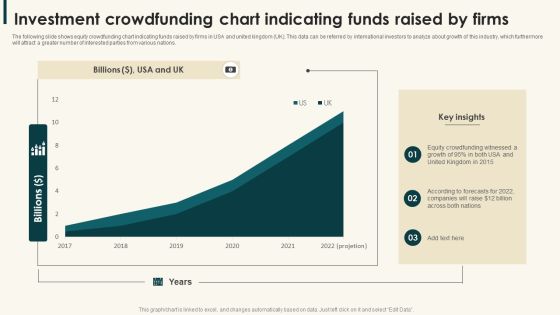
Investment Crowdfunding Chart Indicating Funds Raised By Firms Demonstration PDF
The following slide shows equity crowdfunding chart indicating funds raised by firms in USA and united kingdom UK. This data can be referred by international investors to analyze about growth of this industry, which furthermore will attract a greater number of interested parties from various nations.Showcasing this set of slides titled Investment Crowdfunding Chart Indicating Funds Raised By Firms Demonstration PDF. The topics addressed in these templates are Crowdfunding Witnessed, United Kingdom, Companies Raise. All the content presented in this PPT design is completely editable. Download it and make adjustments in color, background, font etc. as per your unique business setting.

Share Portfolio Tracking Sheet To Analyze Market Indices Themes PDF
Following slide showcases portfolio tracking sheet to analyze stock market performance. This slide provides information about total number of shares purchased, price at which share bought, total cost, current market value of share, etc. Pitch your topic with ease and precision using this Share Portfolio Tracking Sheet To Analyze Market Indices Themes PDF. This layout presents information on Share Portfolio, Tracking Sheet, Market Indices. It is also available for immediate download and adjustment. So, changes can be made in the color, design, graphics or any other component to create a unique layout.

Signs Indicating Tail End Cost In Business Demonstration PDF
This slide presents signs that indicate presence of tail spends in business helpful in identifying barriers to cost efficiency and providing solutions for same. It includes mismatch of ERP, sourcing data hidden in email, too much stock holding that should be treated on priority basis. Persuade your audience using this Signs Indicating Tail End Cost In Business Demonstration PDF. This PPT design covers three stages, thus making it a great tool to use. It also caters to a variety of topics including Stocks, Resource, Supplier. Download this PPT design now to present a convincing pitch that not only emphasizes the topic but also showcases your presentation skills.
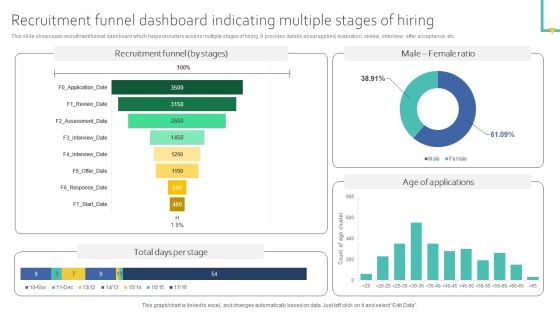
Recruitment Funnel Dashboard Indicating Multiple Stages Of Hiring Ideas PDF
This slide showcases recruitment funnel dashboard which helps recruiters access multiple stages of hiring. It provides details about applied, evaluation, review, interview, offer acceptance, etc. Get a simple yet stunning designed Recruitment Funnel Dashboard Indicating Multiple Stages Of Hiring Ideas PDF. It is the best one to establish the tone in your meetings. It is an excellent way to make your presentations highly effective. So, download this PPT today from Slidegeeks and see the positive impacts. Our easy to edit Recruitment Funnel Dashboard Indicating Multiple Stages Of Hiring Ideas PDF can be your go to option for all upcoming conferences and meetings. So, what are you waiting for Grab this template today.
Sales By Lead Source Performance Indicator Ppt Icon Images PDF
Explore a selection of the finest Sales By Lead Source Performance Indicator Ppt Icon Images PDF here. With a plethora of professionally designed and pre made slide templates, you can quickly and easily find the right one for your upcoming presentation. You can use our Sales By Lead Source Performance Indicator Ppt Icon Images PDF to effectively convey your message to a wider audience. Slidegeeks has done a lot of research before preparing these presentation templates. The content can be personalized and the slides are highly editable. Grab templates today from Slidegeeks.

Customer Lifetime Value Indication Bar Chart Ppt Samples
This is a customer lifetime value indication bar chart ppt samples. This is a three stage process. The stages in this process are inactive nonprofit able customer, active profitable customers, very active very profitable customers, lifetime value, average order value, number of repeat sales, average retention time.
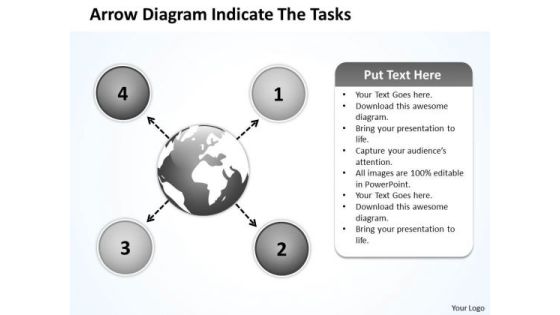
Arrow Diagram Indicate The Tasks Ppt Charts And PowerPoint Templates
We present our arrow diagram indicate the tasks ppt Charts and PowerPoint templates.Use our Process and Flows PowerPoint Templates because a lot of hard work has gone in and you are almost there. Download our Arrows PowerPoint Templates because you have the ideas, you have got a brainwave. Use our Business PowerPoint Templates because your thoughts are pointed and sharp as arrows. Download our Circle Charts PowerPoint Templates because you can Show them how you can save the day. Present our Flow Charts PowerPoint Templates because you have some excellent plans to spread some more of it across your community.Use these PowerPoint slides for presentations relating to Arrows, choice, connect, design, direction, flows, four, info graph, instruction, layout, manual, marketing, modern, one, option, order, page, paper, pointing, process, product, promotion, sequence, simple, special, step, symbol. The prominent colors used in the PowerPoint template are Black, White, Gray. Presenters tell us our arrow diagram indicate the tasks ppt Charts and PowerPoint templates will help them to explain complicated concepts. Professionals tell us our flows PowerPoint templates and PPT Slides are Enchanting. PowerPoint presentation experts tell us our arrow diagram indicate the tasks ppt Charts and PowerPoint templates are effectively colour coded to prioritise your plans They automatically highlight the sequence of events you desire. The feedback we get is that our four PowerPoint templates and PPT Slides are Beautiful. Use our arrow diagram indicate the tasks ppt Charts and PowerPoint templates are Efficient. Use our connect PowerPoint templates and PPT Slides are Ultra.
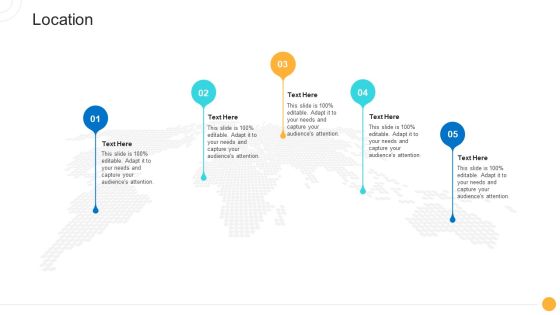
Drug Indicator Extension In A Pharmaceuticals Company Location Formats PDF
This is a drug indicator extension in a pharmaceuticals company location formats pdf template with various stages. Focus and dispense information on five stages using this creative set, that comes with editable features. It contains large content boxes to add your information on topics like location. You can also showcase facts, figures, and other relevant content using this PPT layout. Grab it now.
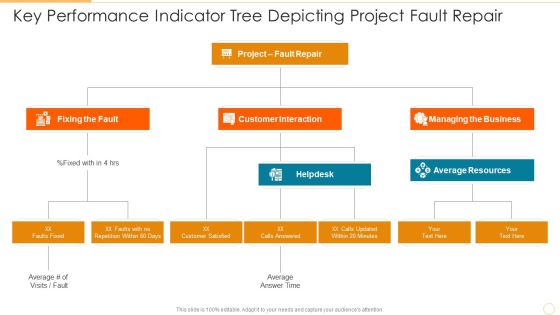
Key Performance Indicator Tree Depicting Project Fault Repair Diagrams PDF
Presenting key performance indicator tree depicting project fault repair diagrams pdf to dispense important information. This template comprises three stages. It also presents valuable insights into the topics including customer interaction, managing the business, fixing the fault. This is a completely customizable PowerPoint theme that can be put to use immediately. So, download it and address the topic impactfully.
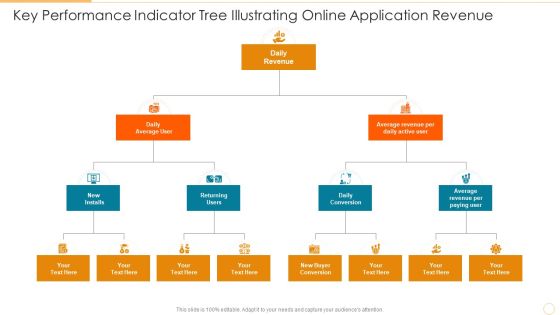
Key Performance Indicator Tree Illustrating Online Application Revenue Download PDF
Presenting key performance indicator tree illustrating online application revenue download pdf to dispense important information. This template comprises three stages. It also presents valuable insights into the topics including daily conversion, returning users, daily revenue. This is a completely customizable PowerPoint theme that can be put to use immediately. So, download it and address the topic impactfully.

Financial Statement Indicating Company Book Value Mockup PDF
Showcasing this set of slides titled financial statement indicating company book value mockup pdf. The topics addressed in these templates are book value statement, assets, liabilities. All the content presented in this PPT design is completely editable. Download it and make adjustments in color, background, font etc. as per your unique business setting.

Corporate Identity Icon Indicating Business Card And Letterhead Diagrams PDF
Presenting Corporate Identity Icon Indicating Business Card And Letterhead Diagrams PDF to dispense important information. This template comprises four stages. It also presents valuable insights into the topics including Business, Letterhead, Corporate. This is a completely customizable PowerPoint theme that can be put to use immediately. So, download it and address the topic impactfully.

Analysis Architecture Indicating Business Impact On Economic Development Background PDF
Pitch your topic with ease and precision using this Analysis Architecture Indicating Business Impact On Economic Development Background PDF. This layout presents information on Profitability Increases, Economy Witnesses, Existing Businesses. It is also available for immediate download and adjustment. So, changes can be made in the color, design, graphics or any other component to create a unique layout.

2023 Business Calendar Indicating Business Meeting Agenda Download PDF
Presenting 2023 Business Calendar Indicating Business Meeting Agenda Download PDF to dispense important information. This template comprises tweleve stages. It also presents valuable insights into the topics including Marketing Meeting, Market Opportunities, Check Goal Status. This is a completely customizable PowerPoint theme that can be put to use immediately. So, download it and address the topic impactfully.

2023 Business Calendar Indicating Project Management Planning Brochure PDF
Presenting 2023 Business Calendar Indicating Project Management Planning Brochure PDF to dispense important information. This template comprises one stages. It also presents valuable insights into the topics including Design Specifications, Finalize Budget Report, Develop Cost. This is a completely customizable PowerPoint theme that can be put to use immediately. So, download it and address the topic impactfully.
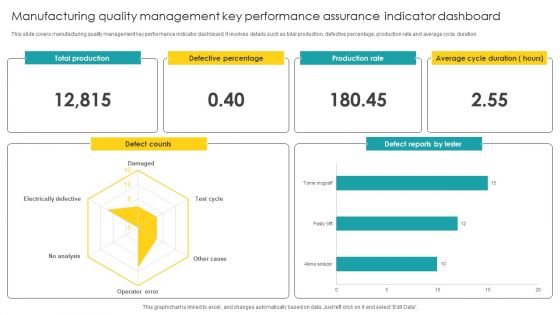
Manufacturing Quality Management Key Performance Assurance Indicator Dashboard Microsoft PDF
Pitch your topic with ease and precision using this Manufacturing Quality Management Key Performance Assurance Indicator Dashboard Microsoft PDF. This layout presents information on Quality Management, Key Performance Assurance. It is also available for immediate download and adjustment. So, changes can be made in the color, design, graphics or any other component to create a unique layout.

Asset Assessment Dashboard Indicating Revenue And Productivity Infographics PDF
This slide showcases asset valuation dashboard highlighting company revenue and productivity index. It provides information about geographical evaluation, development cost, commercial cost, etc.Pitch your topic with ease and precision using this Asset Assessment Dashboard Indicating Revenue And Productivity Infographics PDF. This layout presents information on Projected Development, Productivity Index, Geographical Evaluation. It is also available for immediate download and adjustment. So, changes can be made in the color, design, graphics or any other component to create a unique layout.

Framework Indicating Bdd Automated Testing Design Ppt Gallery Ideas PDF
This slide showcase framework indicating BDD test automation design which can be referred by analysts who want to streamline the process of making changes in the system through advanced methods. It includes information about product owners, business analysts, self service catalogue, database, files, mainframe, developers, etc. Persuade your audience using this Framework Indicating Bdd Automated Testing Design Ppt Gallery Ideas PDF. This PPT design covers four stages, thus making it a great tool to use. It also caters to a variety of topics including Example Data, Data Table, Product Owners, Business Analysts. Download this PPT design now to present a convincing pitch that not only emphasizes the topic but also showcases your presentation skills.

Vehicle Maintenance Dashboard Indicating Trips And Compliances Structure PDF
This slide showcases dashboard which can help fleet managers in carefully monitoring their vehicle status. It provides details about vehicle conditions, free vehicles, moving vehicles, insurance, permit, license validity, trip alerts, etc. Here you can discover an assortment of the finest PowerPoint and Google Slides templates. With these templates, you can create presentations for a variety of purposes while simultaneously providing your audience with an eye-catching visual experience. Download Vehicle Maintenance Dashboard Indicating Trips And Compliances Structure PDF to deliver an impeccable presentation. These templates will make your job of preparing presentations much quicker, yet still, maintain a high level of quality. Slidegeeks has experienced researchers who prepare these templates and write high-quality content for you. Later on, you can personalize the content by editing the Vehicle Maintenance Dashboard Indicating Trips And Compliances Structure PDF.
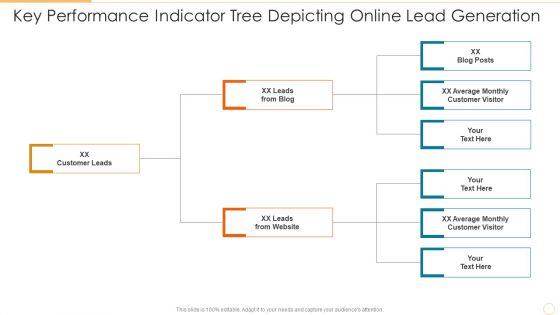
Key Performance Indicator Tree Depicting Online Lead Generation Information PDF
Persuade your audience using this key performance indicator tree depicting online lead generation information pdf. This PPT design covers three stages, thus making it a great tool to use. It also caters to a variety of topics including customer leads, leads from blog, leads from website. Download this PPT design now to present a convincing pitch that not only emphasizes the topic but also showcases your presentation skills.

Key Performance Indicator Tree For Application Performance Management Background PDF
Persuade your audience using this key performance indicator tree for application performance management background pdf. This PPT design covers six stages, thus making it a great tool to use. It also caters to a variety of topics including collaboration platforms, competency development, knowledge management programmers. Download this PPT design now to present a convincing pitch that not only emphasizes the topic but also showcases your presentation skills.
Project Key Performance Indicator Tree Illustrating Customer Satisfaction Icons PDF
Persuade your audience using this project key performance indicator tree illustrating customer satisfaction icons pdf. This PPT design covers four stages, thus making it a great tool to use. It also caters to a variety of topics including total customer complaints, total customer notifications, customer satisfaction project. Download this PPT design now to present a convincing pitch that not only emphasizes the topic but also showcases your presentation skills.

Digital Dashboard Indicating Insurance Agent Sales Performance Portrait PDF
This slide illustrates insurance agent sales performance digital dashboard. It provides information about total proposals, policies, accident, claims, sales revenue, rewards, etc. Pitch your topic with ease and precision using this Digital Dashboard Indicating Insurance Agent Sales Performance Portrait PDF. This layout presents information on Sales Revenue, Reward And Recognition. It is also available for immediate download and adjustment. So, changes can be made in the color, design, graphics or any other component to create a unique layout.
HR Dashboard Indicating Weekly Professional Counselling Kpis Icons PDF
This slide illustrates HR career counselling dashboard. It provides information about hours of consultation, satisfaction rate, per consultant rate, popular counselors, etc. Showcasing this set of slides titled HR Dashboard Indicating Weekly Professional Counselling Kpis Icons PDF. The topics addressed in these templates are Specialization, Hours Of Consultation, Popular Counselors. All the content presented in this PPT design is completely editable. Download it and make adjustments in color, background, font etc. as per your unique business setting.

Finance Metrics Dashboard Indicating Portfolio Performance Microsoft PDF
This graph or chart is linked to excel, and changes automatically based on data. Just left click on it and select edit data. Pitch your topic with ease and precision using this Finance Metrics Dashboard Indicating Portfolio Performance Microsoft PDF. This layout presents information on Portfolio Performance Portfolio, Asset Management Manager, Top 10 Assets. It is also available for immediate download and adjustment. So, changes can be made in the color, design, graphics or any other component to create a unique layout.
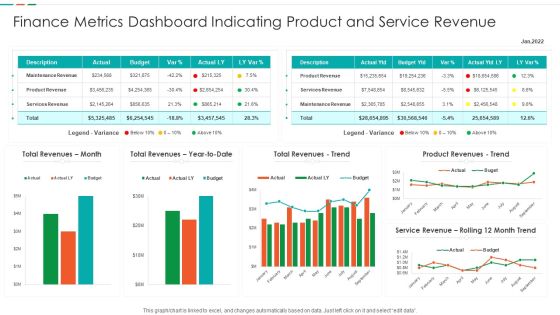
Finance Metrics Dashboard Indicating Product And Service Revenue Designs PDF
This graph or chart is linked to excel, and changes automatically based on data. Just left click on it and select edit data. Showcasing this set of slides titled Finance Metrics Dashboard Indicating Product And Service Revenue Designs PDF. The topics addressed in these templates are Maintenance Revenue Product, Revenue Product Revenues, Service Revenue Rolling. All the content presented in this PPT design is completely editable. Download it and make adjustments in color, background, font etc. as per your unique business setting.

Finance Metrics Dashboard Indicating Short Term Assets Download PDF
This graph or chart is linked to excel, and changes automatically based on data. Just left click on it and select edit data. Pitch your topic with ease and precision using this Finance Metrics Dashboard Indicating Short Term Assets Download PDF. This layout presents information on Short Term Assets, Global Financial Performance, Revenue YTD 2022. It is also available for immediate download and adjustment. So, changes can be made in the color, design, graphics or any other component to create a unique layout.
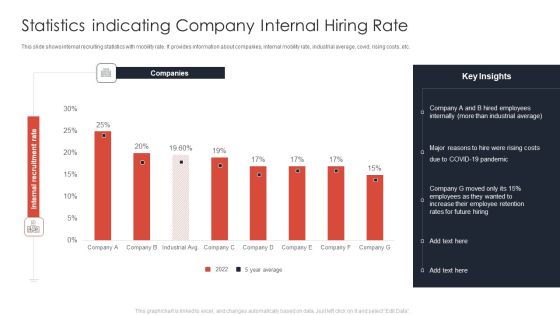
Statistics Indicating Company Internal Hiring Rate Ppt Ideas Templates PDF
This slide shows internal recruiting statistics with mobility rate. It provides information about companies, internal mobility rate, industrial average, covid, rising costs, etc. Showcasing this set of slides titled Statistics Indicating Company Internal Hiring Rate Ppt Ideas Templates PDF. The topics addressed in these templates are Companies, Employees Internally, COVID 19 Pandemic. All the content presented in this PPT design is completely editable. Download it and make adjustments in color, background, font etc. as per your unique business setting.
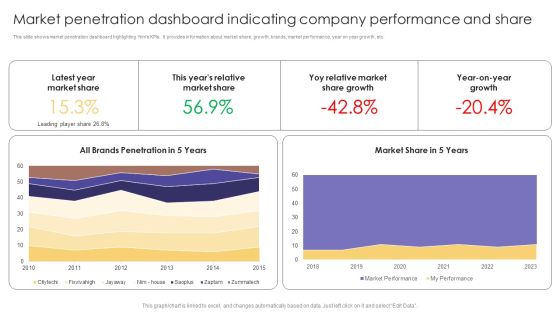
Market Penetration Dashboard Indicating Company Performance And Share Formats PDF
This slide shows market penetration dashboard highlighting firms KPIs. It provides information about market share, growth, brands, market performance, year on year growth, etc. Showcasing this set of slides titled Market Penetration Dashboard Indicating Company Performance And Share Formats PDF. The topics addressed in these templates are Latest Year, Market Share, Market Share Growth. All the content presented in this PPT design is completely editable. Download it and make adjustments in color, background, font etc. as per your unique business setting.
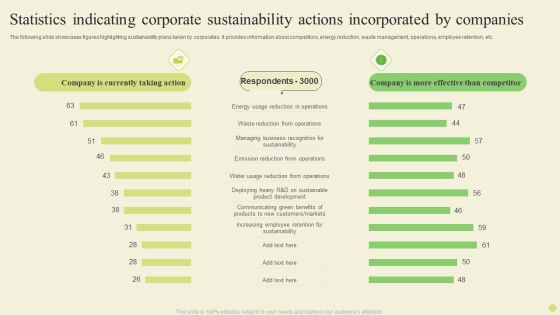
Statistics Indicating Corporate Sustainability Actions Incorporated By Companies Diagrams PDF
The following slide showcases figures highlighting sustainability plans taken by corporates. It provides information about competitors, energy reduction, waste management, operations, employee retention, etc.Pitch your topic with ease and precision using this Statistics Indicating Corporate Sustainability Actions Incorporated By Companies Diagrams PDF. This layout presents information on Energy Reduction, Emission Reduction, Increasing Employee. It is also available for immediate download and adjustment. So, changes can be made in the color, design, graphics or any other component to create a unique layout.

Leadership Effectiveness Framework Indicating Employee Behaviors Elements PDF
This slide showcases the framework containing key leadership behaviors for getting growth in the business. It includes organize, innovate, connect, enjoy and voice. Presenting Leadership Effectiveness Framework Indicating Employee Behaviors Elements PDF to dispense important information. This template comprises five stages. It also presents valuable insights into the topics including Organize, Innovate, Connect, Enjoy, Voice. This is a completely customizable PowerPoint theme that can be put to use immediately. So, download it and address the topic impactfully.
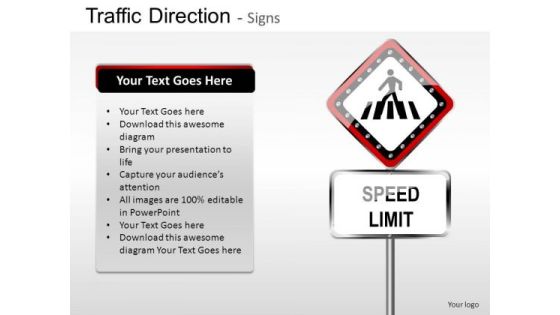
Indication Traffic Direction PowerPoint Slides And Ppt Diagram Templates
Indication Traffic Direction PowerPoint Slides And PPT Diagram Templates-These high quality powerpoint pre-designed slides and powerpoint templates have been carefully created by our professional team to help you impress your audience. All slides have been created and are 100% editable in powerpoint. Each and every property of any graphic - color, size, orientation, shading, outline etc. can be modified to help you build an effective powerpoint presentation. Any text can be entered at any point in the powerpoint template or slide. Simply DOWNLOAD, TYPE and PRESENT!
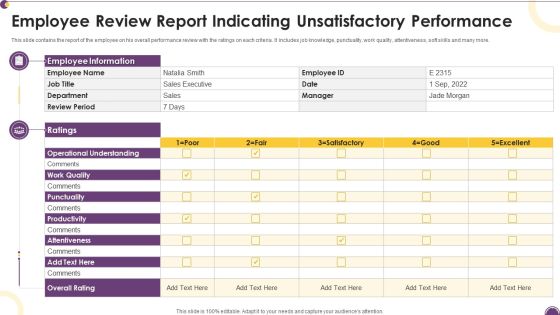
Employee Review Report Indicating Unsatisfactory Performance Themes PDF
This slide contains the report of the employee on his overall performance review with the ratings on each criteria. It includes job knowledge, punctuality, work quality, attentiveness, soft skills and many more.Pitch your topic with ease and precision using this Employee Review Report Indicating Unsatisfactory Performance Themes PDF. This layout presents information on Operational Understanding, Employee Information, Punctuality. It is also available for immediate download and adjustment. So, changes can be made in the color, design, graphics or any other component to create a unique layout.

Yearly Sales Assessment With Key Performance Indicator Matrix Introduction PDF
This slide covers quarterly product units sold through out a financial year in an organization with growth in revenue, profit and number of customer from previous years sales. It includes product sold and growth rate. Presenting Yearly Sales Assessment With Key Performance Indicator Matrix Introduction PDF to dispense important information. This template comprises four stages. It also presents valuable insights into the topics including Sold Growth Rate, Customers, Growth In Profit. This is a completely customizable PowerPoint theme that can be put to use immediately. So, download it and address the topic impactfully.

Business Expansion Geography Indicating Market Size Inspiration PDF
The slide demonstrates market size geography to identify potential areas to expand business. The slides includes a geographical map representing areas of market expansion. Persuade your audience using this Business Expansion Geography Indicating Market Size Inspiration PDF. This PPT design covers four stages, thus making it a great tool to use. It also caters to a variety of topics including Potential Markets, Business Expansion, Growth Opportunities. Download this PPT design now to present a convincing pitch that not only emphasizes the topic but also showcases your presentation skills.

B2C Content Marketing Statistics Indicating Usage Of Techniques Sample PDF
This slide showcases business to consumer B2C content marketing figures highlighting usage of key strategies. It provides information about targeting, editorial calendar, promotion, website UI, social media, service development, etc. Pitch your topic with ease and precision using this B2C Content Marketing Statistics Indicating Usage Of Techniques Sample PDF. This layout presents information on Strategies, Marketers, Content Team. It is also available for immediate download and adjustment. So, changes can be made in the color, design, graphics or any other component to create a unique layout.
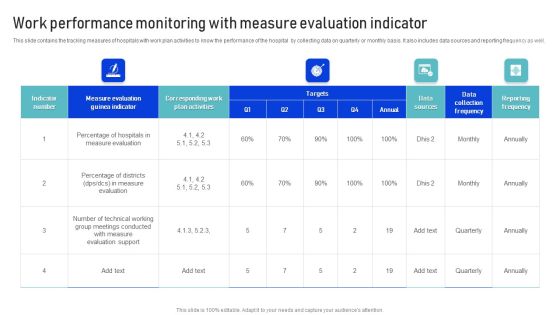
Work Performance Monitoring With Measure Evaluation Indicator Download PDF
This slide contains the tracking measures of hospitals with work plan activities to know the performance of the hospital by collecting data on quarterly or monthly basis. It also includes data sources and reporting frequency as well. Pitch your topic with ease and precision using this Work Performance Monitoring With Measure Evaluation Indicator Download PDF. This layout presents information on Measure Evaluation, Targets, Work Performance Monitoring. It is also available for immediate download and adjustment. So, changes can be made in the color, design, graphics or any other component to create a unique layout.
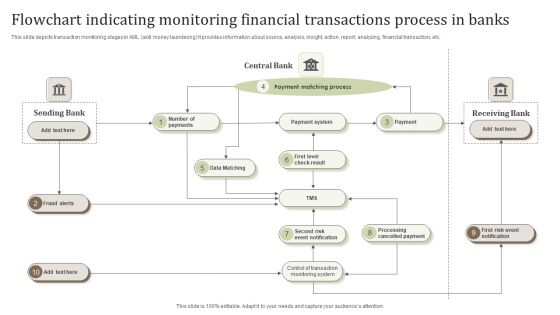
Flowchart Indicating Monitoring Financial Transactions Process In Banks Pictures PDF
This slide depicts transaction monitoring stages in AML anti money laundering It provides information about source, analysis, insight, action, report, analyzing, financial transaction, etc.Persuade your audience using this Flowchart Indicating Monitoring Financial Transactions Process In Banks Pictures PDF. This PPT design covers one stage, thus making it a great tool to use. It also caters to a variety of topics including Payment Matching Process, Cancelled Payment, Cancelled Payment. Download this PPT design now to present a convincing pitch that not only emphasizes the topic but also showcases your presentation skills.
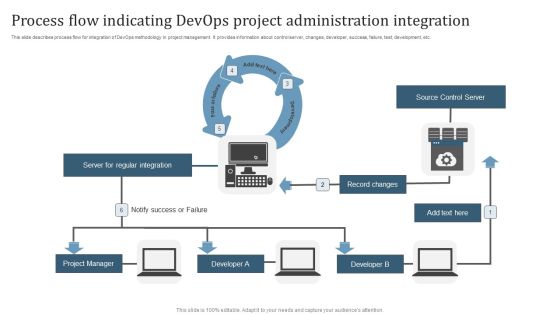
Process Flow Indicating Devops Project Administration Integration Microsoft PDF
This slide describes process flow for integration of DevOps methodology in project management. It provides information about control server, changes, developer, success, failure, test, development, etc. Presenting Process Flow Indicating Devops Project Administration Integration Microsoft PDF to dispense important information. This template comprises three stages. It also presents valuable insights into the topics including Server For Regular Integration, Source Control Server, Record Changes. This is a completely customizable PowerPoint theme that can be put to use immediately. So, download it and address the topic impactfully.

Share Market Dashboard Indicating Candlestick Time Series Formats PDF
Following slide showcase stock market KPI dashboard which will assist company to understand stock performance. It provides information about open, close, highest and lowest price of stock on particular day, candlestick time series etc. Pitch your topic with ease and precision using this Share Market Dashboard Indicating Candlestick Time Series Formats PDF. This layout presents information on Candlestick Time Series, Stock Change, US Sector. It is also available for immediate download and adjustment. So, changes can be made in the color, design, graphics or any other component to create a unique layout.
Sales By Lead Source Performance Indicator Icons PDF
Are you in need of a template that can accommodate all of your creative concepts This one is crafted professionally and can be altered to fit any style. Use it with Google Slides or PowerPoint. Include striking photographs, symbols, depictions, and other visuals. Fill, move around, or remove text boxes as desired. Test out color palettes and font mixtures. Edit and save your work, or work with colleagues. Download Sales By Lead Source Performance Indicator Icons PDF and observe how to make your presentation outstanding. Give an impeccable presentation to your group and make your presentation unforgettable.

Stoplight Traffic Signal Go Indication Ppt PowerPoint Presentation Complete Deck
This stoplight traffic signal go indication ppt powerpoint presentation complete deck acts as backup support for your ideas, vision, thoughts, etc. Use it to present a thorough understanding of the topic. This PPT slideshow can be utilized for both in-house and outside presentations depending upon your needs and business demands. Entailing twelve slides with a consistent design and theme, this template will make a solid use case. As it is intuitively designed, it suits every business vertical and industry. All you have to do is make a few tweaks in the content or any other component to design unique presentations. The biggest advantage of this complete deck is that it can be personalized multiple times once downloaded. The color, design, shapes, and other elements are free to modify to add personal touches. You can also insert your logo design in this PPT layout. Therefore a well-thought and crafted presentation can be delivered with ease and precision by downloading this stoplight traffic signal go indication ppt powerpoint presentation complete deck PPT slideshow.

Progress Indicator Ring Ppt PowerPoint Presentation Complete Deck With Slides
This progress indicator ring ppt powerpoint presentation complete deck with slides acts as backup support for your ideas, vision, thoughts, etc. Use it to present a thorough understanding of the topic. This PPT slideshow can be utilized for both in-house and outside presentations depending upon your needs and business demands. Entailing twelve slides with a consistent design and theme, this template will make a solid use case. As it is intuitively designed, it suits every business vertical and industry. All you have to do is make a few tweaks in the content or any other component to design unique presentations. The biggest advantage of this complete deck is that it can be personalized multiple times once downloaded. The color, design, shapes, and other elements are free to modify to add personal touches. You can also insert your logo design in this PPT layout. Therefore a well-thought and crafted presentation can be delivered with ease and precision by downloading this progress indicator ring ppt powerpoint presentation complete deck with slides PPT slideshow.
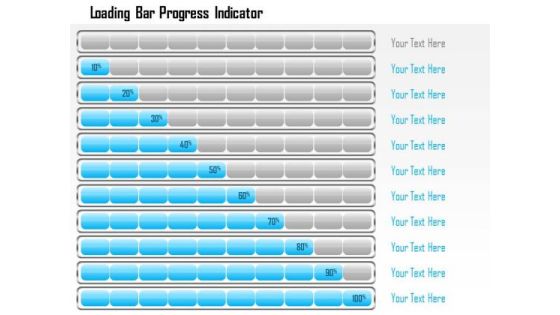
Business Framework Loading Bar Progress Indicator PowerPoint Presentation
This business diagram displays bar progress indicators. This business slide contains the concept of business growth shown in multiple levels. Use this diagram to present and compare data in an impressive manner.

Dashboard With Low High Medium Indication Powerpoint Slides
This innovative, stunningly beautiful dashboard has been designed for data visualization. It contains dashboard with low, high and medium indication. This PowerPoint template helps to display your information in a useful, simple and orderly way.

Business Diagram Pie Chart With Key Performance Indicator Presentation Template
This power point template slide has been crafted with graphic of pie chart and magnifier. This PPT contains the concept of performance indication. Use this PPT for data technology and business related presentations.

Stock Photo Arrow Indicating Solution Path Of Maze Pwerpoint Slide
This conceptual image is designed with graphic of maze and arrow. In this image maze shows the concept of problem while arrow is reflecting the idea of solution. Build a innovative presentation for displaying the complexity of problem solving topic. Use this image for business, sales and marketing related presentations.

Business Diagram Multiple Cells For Charging Indication Diagram Presentation Template
Graphic of multiple cells is used to decorate this power point template slide. This PPt slide contains the concept of charging and power consumption. Use this PPT slide and explain these topics in a graphical manner.

Business Diagram Danger Warning Symbol For Safety Indication Presentation Template
This Power Point template has been designed with graphic of danger board. This diagram contains the concept of safety warning for danger area. Use this diagram for your warning and safety related presentation.
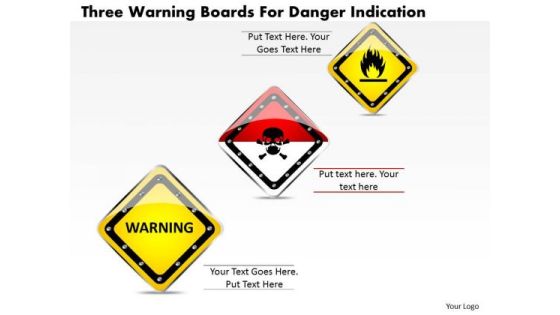
Business Diagram Three Warning Boards For Danger Indication Presentation Template
This Power Point image template has been designed with graphic of three different sign boards. These signs are designed to identify dangerous places. Use this diagram for safety and prevention related topics.

Business Diagram Human Hand Indicating On Multiple Apps PowerPoint Template
Graphic of human hand with multiple apps has been used to craft this PPT. This PPT diagram contains the concept of app usage. Use this PPT for your technology and data related topics in any presentation.

Business Diagram Thermometer Graphics Indicating Progress Presentation Template
This power point template diagram has been designed with graphic of thermometer and bar graph. This PPT contains the concept of growth analysis. Use this PPT for business and marketing related presentations.
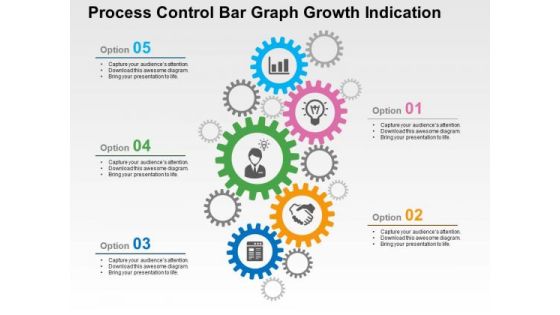
Process Control Bar Graph Growth Indication PowerPoint Template
Download our business slide with gear graphics to convincingly convey your important ideas in presentations. It also contains graphics of business icons. Create captivating presentations using this template

Eight Tags For Business Process Indication Powerpoint Template
Our above PPT slide contains graphics of eight text tags with icons. This PowerPoint template may be used to display business process steps. Use this diagram to impart more clarity to data and to create more sound impact on viewers.
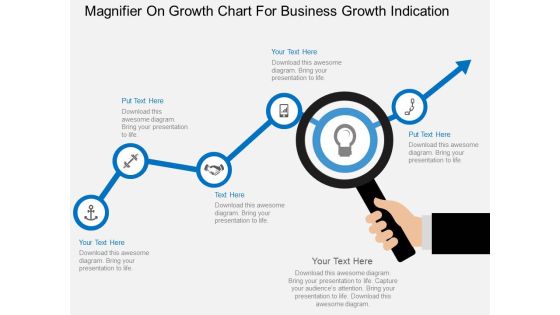
Magnifier On Growth Chart For Business Growth Indication Powerpoint Template
This business slide contains graphics of magnifier on growth chart. This PowerPoint template helps to display business planning and analysis. Use this diagram to impart more clarity to concept and to create more sound impact on viewers.

Plant With Bulb Education Growth Indication Powerpoint Template
This PowerPoint slide has been designed with graphics of plant and bulb. This diagram is designed to display education and growth. This professional slide helps in making an instant impact on viewers.

Three Arrows For Business Process Indication Powerpoint Template
This business slide displays diagram of three arrows with icons. Download this diagram to display information in visual manner. Visual effect of this diagram helps in maintaining the flow of the discussion and provides more clarity to the subject.

Aviation Fuel Biofuel Impact Indicator Matrix For Environmental Sustainability Graphics PDF
This slide covers impact matrix to show direct effect of sustainable aviation fuel on several environment indicators. It includes indicators such as energy usage, greenhouse gases, air quality index, biodiversity, use of land, water quality, etc. Showcasing this set of slides titled Aviation Fuel Biofuel Impact Indicator Matrix For Environmental Sustainability Graphics PDF. The topics addressed in these templates are Energy Usage, Greenhouse Gases, Air Quality Index. All the content presented in this PPT design is completely editable. Download it and make adjustments in color, background, font etc. as per your unique business setting.
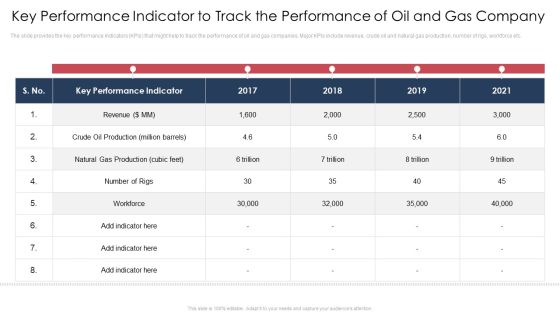
Key Performance Indicator To Track The Performance Of Oil And Gas Company Slides PDF
The slide provides the key performance indicators KPIs that might help to track the performance of oil and gas companies. Major KPIs include revenue, crude oil and natural gas production, number of rigs, workforce etc.Deliver and pitch your topic in the best possible manner with this key performance indicator to track the performance of oil and gas company slides pdf. Use them to share invaluable insights on revenue, crude oil production, natural gas production and impress your audience. This template can be altered and modified as per your expectations. So, grab it now.

Cyber Risk Report With Risk Indicator And Affected Systems Brochure PDF
This slide highlights the cyber threat risk indicator which include risk level, risk indication, likelihood, impacts and potential affected system. Pitch your topic with ease and precision using this cyber risk report with risk indicator and affected systems brochure pdf. This layout presents information on risk indication, risk level, key risk indicator. It is also available for immediate download and adjustment. So, changes can be made in the color, design, graphics or any other component to create a unique layout.
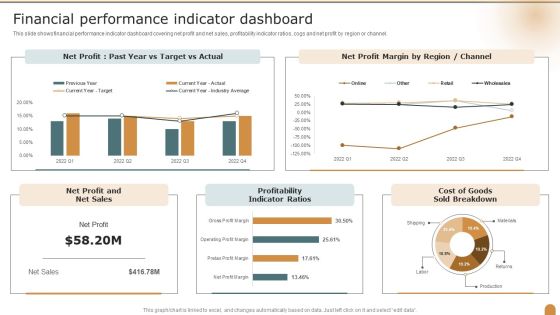
Financial Performance Indicator Dashboard Company Performance Evaluation Using KPI Structure PDF
This slide shows financial performance indicator dashboard covering net profit and net sales, profitability indicator ratios, cogs and net profit by region or channel. Deliver and pitch your topic in the best possible manner with this Financial Performance Indicator Dashboard Company Performance Evaluation Using KPI Structure PDF. Use them to share invaluable insights on Financial Performance, Indicator Dashboard, Profitability Indicator and impress your audience. This template can be altered and modified as per your expectations. So, grab it now.

Performance Indicator Business Opportunity Marketing Mix Collections Management Ppt PowerPoint Presentation Infographic Template Backgrounds
This is a performance indicator business opportunity marketing mix collections management ppt powerpoint presentation infographic template backgrounds. This is a three stage process. The stages in this process are performance indicator, business opportunity, marketing mix, collections management.
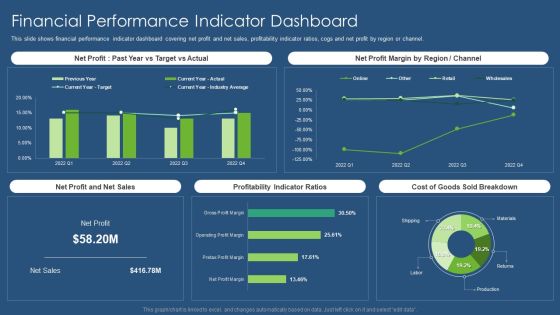
Sustainability Calculation With KPI Financial Performance Indicator Dashboard Infographics PDF Template PDF
This slide shows financial performance indicator dashboard covering net profit and net sales, profitability indicator ratios, cogs and net profit by region or channel. Deliver an awe inspiring pitch with this creative sustainability calculation with kpi financial performance indicator dashboard infographics pdf bundle. Topics like net profit margin, net profit and net sales, profitability indicator ratios, sold breakdown can be discussed with this completely editable template. It is available for immediate download depending on the needs and requirements of the user.
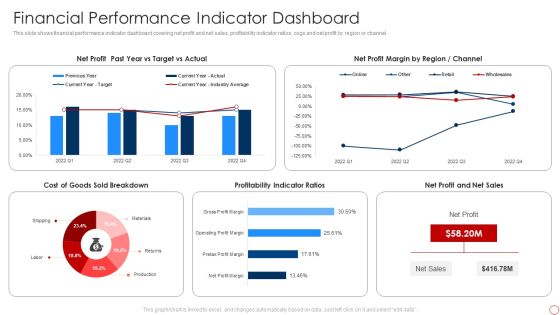
Kpis For Evaluating Business Sustainability Financial Performance Indicator Dashboard Demonstration PDF
This slide shows financial performance indicator dashboard covering net profit and net sales, profitability indicator ratios, cogs and net profit by region or channel. Deliver and pitch your topic in the best possible manner with this Kpis For Evaluating Business Sustainability Financial Performance Indicator Dashboard Demonstration PDF. Use them to share invaluable insights on Net Profit, Net Profit Margin, Profitability Indicator Ratios and impress your audience. This template can be altered and modified as per your expectations. So, grab it now.

Metrics To Measure Business Performance Financial Performance Indicator Dashboard Pictures PDF
This slide shows financial performance indicator dashboard covering net profit and net sales, profitability indicator ratios, cogs and net profit by region or channel. Deliver an awe inspiring pitch with this creative Metrics To Measure Business Performance Financial Performance Indicator Dashboard Pictures PDF bundle. Topics like Net Profit, Net Sales, Cost Goods, Sold Breakdown can be discussed with this completely editable template. It is available for immediate download depending on the needs and requirements of the user.
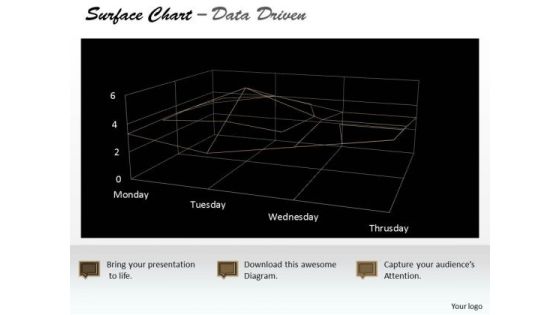
Data Analysis Template Driven Surface Chart Indicating Areas PowerPoint Slides Templates
Highlight Your Drive With Our data analysis template driven surface chart indicating areas powerpoint slides Templates . Prove The Fact That You Have Control.
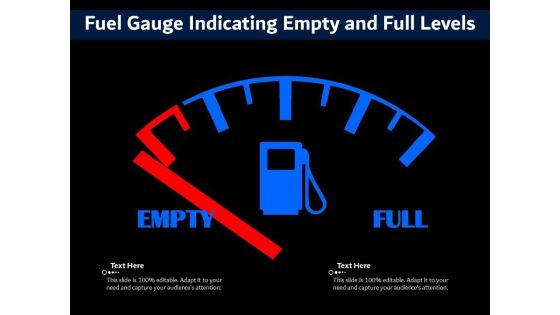
Fuel Gauge Indicating Empty And Full Levels Ppt PowerPoint Presentation Portfolio Clipart PDF
Presenting fuel gauge indicating empty and full levels ppt powerpoint presentation portfolio clipart pdf to dispense important information. This template comprises one stages. It also presents valuable insights into the topics including fuel gauge indicating empty and full levels. This is a completely customizable PowerPoint theme that can be put to use immediately. So, download it and address the topic impactfully.

Chart Indicates Diminishing Graph And Chart Stock Market Indexes Themes PDF
Showcasing this set of slides titled Chart Indicates Diminishing Graph And Chart Stock Market Indexes Themes PDF. The topics addressed in these templates are Chart Indicates Diminishing Graph, Chart Stock Market Indexes. All the content presented in this PPT design is completely editable. Download it and make adjustments in color, background, font etc. as per your unique business setting.
Product Sales Order Accomplishment Icon Indicating Supply Chain Logistics Slides PDF
Showcasing this set of slides titled Product Sales Order Accomplishment Icon Indicating Supply Chain Logistics Slides PDF The topics addressed in these templates are Product Sales, Order Accomplishment, Indicating Logistics All the content presented in this PPT design is completely editable. Download it and make adjustments in color, background, font etc. as per your unique business setting.
Speedometer Performance Indicator Vector Icon Ppt PowerPoint Presentation Show Deck PDF
Presenting this set of slides with name speedometer performance indicator vector icon ppt powerpoint presentation show deck pdf. This is a three stage process. The stages in this process are speedometer performance indicator vector icon. This is a completely editable PowerPoint presentation and is available for immediate download. Download now and impress your audience.
Red Light Indicating Stop Vector Icon Ppt PowerPoint Presentation Gallery Topics PDF
Presenting this set of slides with name red light indicating stop vector icon ppt powerpoint presentation gallery topics pdf. The topics discussed in these slide is red light indicating stop vector icon. This is a completely editable PowerPoint presentation and is available for immediate download. Download now and impress your audience.
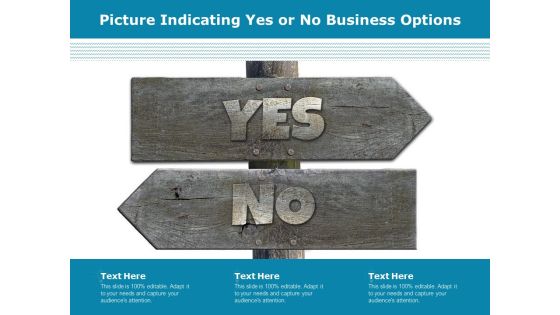
Picture Indicating Yes Or No Business Options Ppt PowerPoint Presentation Styles Elements PDF
Presenting this set of slides with name picture indicating yes or no business options ppt powerpoint presentation styles elements pdf. This is a two stage process. The stages in this process are picture indicating yes or no business options. This is a completely editable PowerPoint presentation and is available for immediate download. Download now and impress your audience.

Women Football Referee Indicating Rule Breaking Punishment Ppt PowerPoint Presentation Gallery Slide PDF
Presenting this set of slides with name women football referee indicating rule breaking punishment ppt powerpoint presentation gallery slide pdf. The topics discussed in these slide is women football referee indicating rule breaking punishment. This is a completely editable PowerPoint presentation and is available for immediate download. Download now and impress your audience.

Chart Indicating Two Years Business Performance Analysis Ppt PowerPoint Presentation File Grid PDF
Showcasing this set of slides titled chart indicating two years business performance analysis ppt powerpoint presentation file grid pdf. The topics addressed in these templates are chart indicating two years business performance analysis. All the content presented in this PPT design is completely editable. Download it and make ajustments in color, background, font etc. as per your unique business setting.
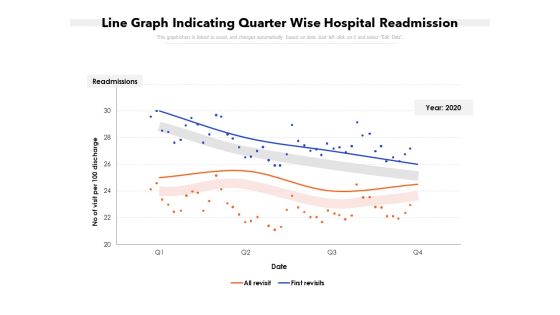
Line Graph Indicating Quarter Wise Hospital Readmission Ppt PowerPoint Presentation Gallery Layouts PDF
Showcasing this set of slides titled line graph indicating quarter wise hospital readmission ppt powerpoint presentation gallery layouts pdf. The topics addressed in these templates are line graph indicating quarter wise hospital readmission. All the content presented in this PPT design is completely editable. Download it and make ajustments in color, background, font etc. as per your unique business setting.
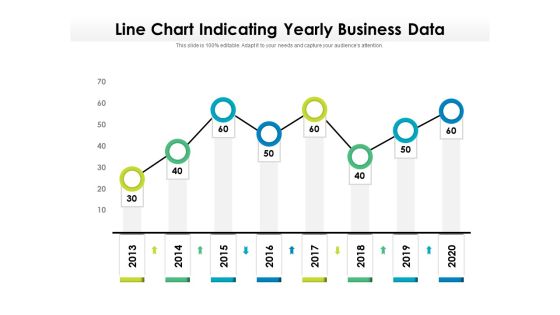
Line Chart Indicating Yearly Business Data Ppt PowerPoint Presentation Styles Deck PDF
Showcasing this set of slides titled line chart indicating yearly business data ppt powerpoint presentation styles deck pdf. The topics addressed in these templates are line chart indicating yearly business data, 2013 to 2020. All the content presented in this PPT design is completely editable. Download it and make adjustments in color, background, font etc. as per your unique business setting.
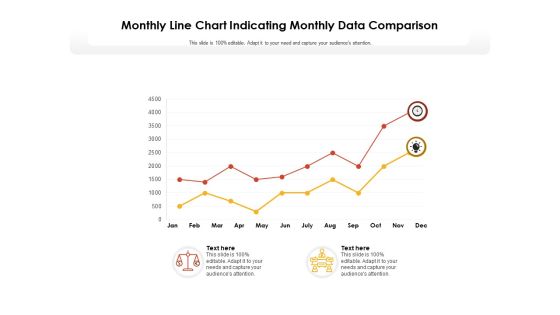
Monthly Line Chart Indicating Monthly Data Comparison Ppt PowerPoint Presentation Model Slide Portrait
Showcasing this set of slides titled monthly line chart indicating monthly data comparison ppt powerpoint presentation model slide portrait. The topics addressed in these templates are monthly line chart indicating monthly data comparison. All the content presented in this PPT design is completely editable. Download it and make adjustments in color, background, font etc. as per your unique business setting.

Bar Graph Showing Key Indicator Of Market Competitiveness Ppt PowerPoint Presentation Icon Example PDF
Showcasing this set of slides titled bar graph showing key indicator of market competitiveness ppt powerpoint presentation icon example pdf. The topics addressed in these templates are bar graph showing key indicator of market competitiveness. All the content presented in this PPT design is completely editable. Download it and make adjustments in color, background, font etc. as per your unique business setting.
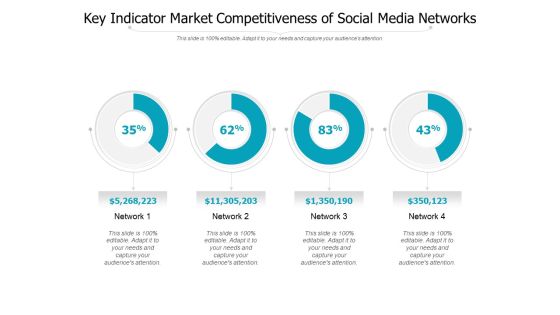
Key Indicator Market Competitiveness Of Social Media Networks Ppt PowerPoint Presentation Gallery Example PDF
Pitch your topic with ease and precision using this key indicator market competitiveness of social media networks ppt powerpoint presentation gallery example pdf. This layout presents information on key indicator market competitiveness of social media networks. It is also available for immediate download and adjustment. So, changes can be made in the color, design, graphics or any other component to create a unique layout.
Key Indicator Of Market Competitiveness Icon Ppt PowerPoint Presentation Gallery Deck PDF
Presenting key indicator of market competitiveness icon ppt powerpoint presentation gallery deck pdf to dispense important information. This template comprises three stages. It also presents valuable insights into the topics including key indicator of market competitiveness icon. This is a completely customizable PowerPoint theme that can be put to use immediately. So, download it and address the topic impactfully.

Picture Of Red Odometer With Speed Indicator Ppt PowerPoint Presentation Summary Ideas PDF
Presenting picture of red odometer with speed indicator ppt powerpoint presentation summary ideas pdf to dispense important information. This template comprises two stages. It also presents valuable insights into the topics including picture of red odometer, speed indicator. This is a completely customizable PowerPoint theme that can be put to use immediately. So, download it and address the topic impactfully.

Metal Rooster With Weather Vane Indicator Ppt PowerPoint Presentation Pictures Layout Ideas PDF
Pitch your topic with ease and precision using this metal rooster with weather vane indicator ppt powerpoint presentation pictures layout ideas pdf. This layout presents information on metal rooster with weather vane indicator. It is also available for immediate download and adjustment. So, changes can be made in the color, design, graphics or any other component to create a unique layout.

Bulb Indicator For Car Parking Vector Icon Ppt PowerPoint Presentation File Outfit PDF
Pitch your topic with ease and precision using this bulb indicator for car parking vector icon ppt powerpoint presentation file outfit pdf. This layout presents information on bulb indicator for car parking vector icon. It is also available for immediate download and adjustment. So, changes can be made in the color, design, graphics or any other component to create a unique layout.

Key Performance Indicator To Track The Performance Of Oil And Gas Company Inspiration PDF
Deliver an awe inspiring pitch with this creative key performance indicator to track the performance of oil and gas company inspiration pdf bundle. Topics likekey performance indicator, natural gas production cubic feet, crude oil production can be discussed with this completely editable template. It is available for immediate download depending on the needs and requirements of the user.
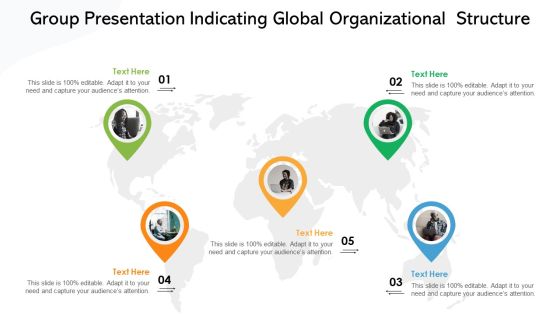
Group Presentation Indicating Global Organizational Structure Ppt PowerPoint Presentation File Infographics PDF
Presenting group presentation indicating global organizational structure ppt powerpoint presentation file infographics pdf to dispense important information. This template comprises five stages. It also presents valuable insights into the topics including group presentation indicating global organizational structure. This is a completely customizable PowerPoint theme that can be put to use immediately. So, download it and address the topic impactfully.

Scorecard Indicating Employee Morale Measured Across Multiple Factors Ppt Infographics Topics PDF
Deliver and pitch your topic in the best possible manner with this scorecard indicating employee morale measured across multiple factors ppt infographics topics pdf. Use them to share invaluable insights on scorecard indicating employee morale measured across multiple factors and impress your audience. This template can be altered and modified as per your expectations. So, grab it now.

Progress Indicator Ring Diagram For Business To Business Trading Graphics PDF
Pitch your topic with ease and precision using this progress indicator ring diagram for business to business trading graphics pdf. This layout presents information on progress indicator ring diagram for business to business trading. It is also available for immediate download and adjustment. So, changes can be made in the color, design, graphics or any other component to create a unique layout.
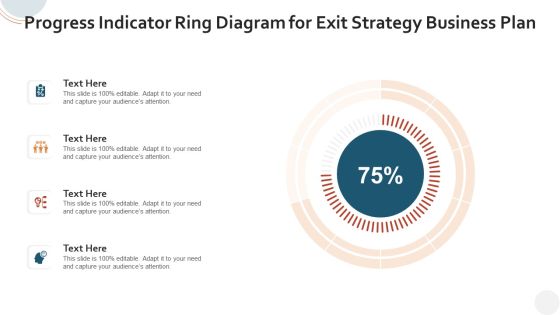
Progress Indicator Ring Diagram For Exit Strategy Business Plan Information PDF
Showcasing this set of slides titled progress indicator ring diagram for exit strategy business plan information pdf. The topics addressed in these templates are progress indicator ring diagram for exit strategy business plan. All the content presented in this PPT design is completely editable. Download it and make adjustments in color, background, font etc. as per your unique business setting.

Progress Indicator Ring Graphics For Marketing Plans In Strategic Management Slides PDF
Showcasing this set of slides titled progress indicator ring graphics for marketing plans in strategic management slides pdf. The topics addressed in these templates are progress indicator ring graphics for marketing plans in strategic management. All the content presented in this PPT design is completely editable. Download it and make adjustments in color, background, font etc. as per your unique business setting.

Progress Indicator Ring Infographics For Build Customer Service Approach Inspiration PDF
Showcasing this set of slides titled progress indicator ring infographics for build customer service approach inspiration pdf. The topics addressed in these templates are progress indicator ring infographics for build customer service approach. All the content presented in this PPT design is completely editable. Download it and make adjustments in color, background, font etc. as per your unique business setting.
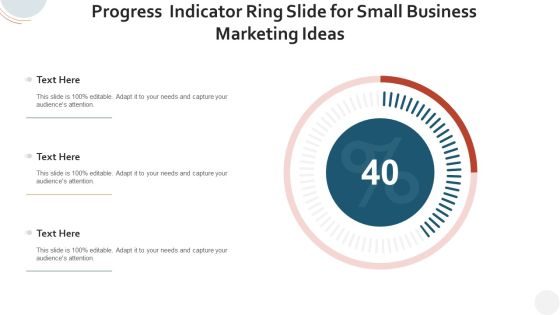
Progress Indicator Ring Slide For Small Business Marketing Ideas Guidelines PDF
Pitch your topic with ease and precision using this progress indicator ring slide for small business marketing ideas guidelines pdf. This layout presents information on progress indicator ring slide for small business marketing ideas. It is also available for immediate download and adjustment. So, changes can be made in the color, design, graphics or any other component to create a unique layout.
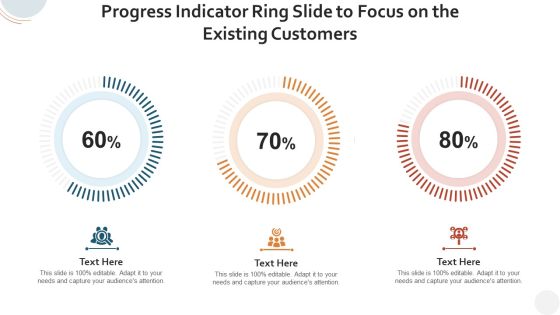
Progress Indicator Ring Slide To Focus On The Existing Customers Rules PDF
Showcasing this set of slides titled progress indicator ring slide to focus on the existing customers rules pdf. The topics addressed in these templates are progress indicator ring slide to focus on the existing customers. All the content presented in this PPT design is completely editable. Download it and make adjustments in color, background, font etc. as per your unique business setting.

Calculate Facebook Key Performance Indicator And Track Your Performance Information PDF
Showcasing this set of slides titled calculate facebook key performance indicator and track your performance information pdf. The topics addressed in these templates are calculate facebook key performance indicator and track your performance. All the content presented in this PPT design is completely editable. Download it and make adjustments in color, background, font etc. as per your unique business setting.
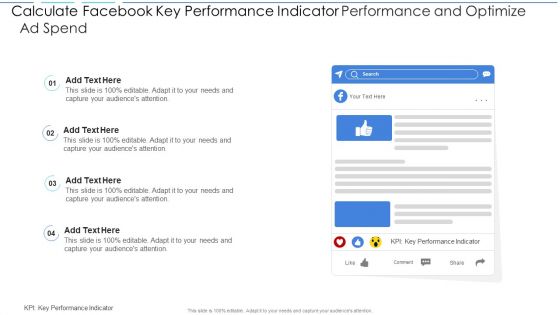
Calculate Facebook Key Performance Indicator Performance And Optimize Ad Spend Brochure PDF
Showcasing this set of slides titled calculate facebook key performance indicator performance and optimize ad spend brochure pdf. The topics addressed in these templates are calculate facebook key performance indicator performance and optimize ad spend. All the content presented in this PPT design is completely editable. Download it and make adjustments in color, background, font etc. as per your unique business setting.

Calculate Facebook Key Performance Indicator The Specific Campaign Details Introduction PDF
Showcasing this set of slides titled calculate facebook key performance indicator the specific campaign details introduction pdf. The topics addressed in these templates are calculate facebook key performance indicator the specific campaign details. All the content presented in this PPT design is completely editable. Download it and make adjustments in color, background, font etc. as per your unique business setting.
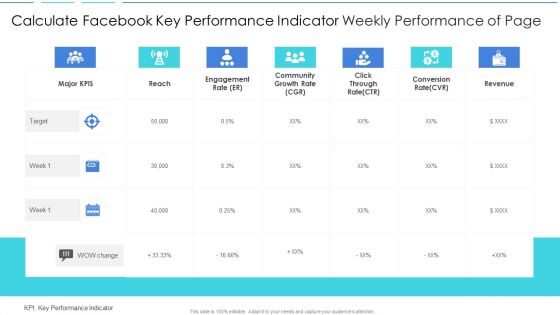
Calculate Facebook Key Performance Indicator Weekly Performance Of Page Elements PDF
Pitch your topic with ease and precision using this calculate facebook key performance indicator weekly performance of page elements pdf. This layout presents information on calculate facebook key performance indicator weekly performance of page. It is also available for immediate download and adjustment. So, changes can be made in the color, design, graphics or any other component to create a unique layout.
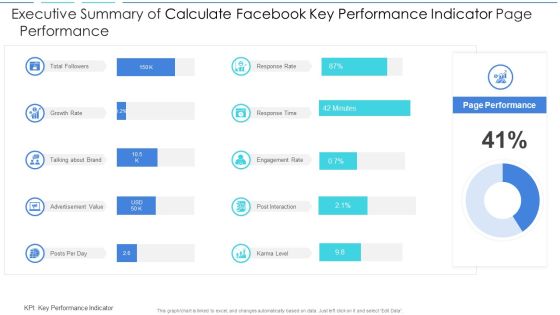
Executive Summary Of Calculate Facebook Key Performance Indicator Page Performance Download PDF
Showcasing this set of slides titled executive summary of calculate facebook key performance indicator page performance download pdf. The topics addressed in these templates are executive summary of calculate facebook key performance indicator page performance. All the content presented in this PPT design is completely editable. Download it and make adjustments in color, background, font etc. as per your unique business setting.
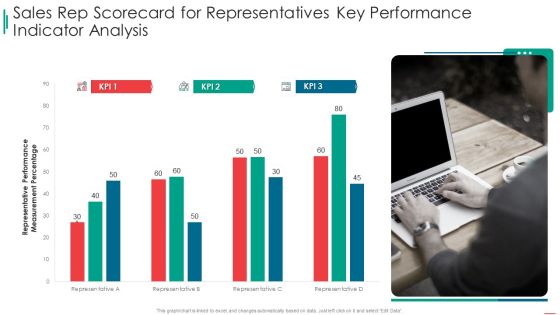
Sales Rep Scorecard Sales Rep Scorecard For Representatives Key Performance Indicator Analysis Portrait PDF
Deliver an awe inspiring pitch with this creative sales rep scorecard sales rep scorecard for representatives key performance indicator analysis portrait pdf bundle. Topics like sales rep scorecard for representatives key performance indicator analysis can be discussed with this completely editable template. It is available for immediate download depending on the needs and requirements of the user.

Total Cost Of Ownership Dashboard Indicating Cost Breakdown And Storage Analysis Rules PDF
Showcasing this set of slides titled total cost of ownership dashboard indicating cost breakdown and storage analysis rules pdf. The topics addressed in these templates are total cost of ownership dashboard indicating cost breakdown and storage analysis. All the content presented in this PPT design is completely editable. Download it and make adjustments in color, background, font etc. as per your unique business setting.
Icon Indicating Quality Control Management In Assembly Line Process Portrait PDF
Showcasing this set of slides titled icon indicating quality control management in assembly line process portrait pdf. The topics addressed in these templates are icon indicating quality control management in assembly line process. All the content presented in this PPT design is completely editable. Download it and make adjustments in color, background, font etc. as per your unique business setting.

KPI Compare Dashboard Indicating Website Visitors With Sales Conversion Demonstration PDF
Pitch your topic with ease and precision using this KPI Compare Dashboard Indicating Website Visitors With Sales Conversion Demonstration PDF This layout presents information on KPI Compare Dashboard Indicating Website Visitors With Sales Conversion It is also available for immediate download and adjustment. So, changes can be made in the color, design, graphics or any other component to create a unique layout.
Icon Indicating Manager Sharing Employee Performance Performance Enhancement Plan Information PDF
Presenting Icon Indicating Manager Sharing Employee Performance Performance Enhancement Plan Information PDF to dispense important information. This template comprises four stages. It also presents valuable insights into the topics including Icon Indicating Manager Sharing Employee Performance Performance Enhancement Plan. This is a completely customizable PowerPoint theme that can be put to use immediately. So, download it and address the topic impactfully.

Political Map Indicating Multiple Regions Of Japan Ppt PowerPoint Presentation Gallery Inspiration PDF
Presenting Political Map Indicating Multiple Regions Of Japan Ppt PowerPoint Presentation Gallery Inspiration PDF to dispense important information. This template comprises one stages. It also presents valuable insights into the topics including Political Map Indicating Multiple Regions Of Japan. This is a completely customizable PowerPoint theme that can be put to use immediately. So, download it and address the topic impactfully.

Chart Indicates Diminishing Graph And Chart Cash Payment Mode Inspiration PDF
Showcasing this set of slides titled Chart Indicates Diminishing Graph And Chart Cash Payment Mode Inspiration PDF. The topics addressed in these templates are Chart Indicates Diminishing Graph, Chart Cash Payment Mode. All the content presented in this PPT design is completely editable. Download it and make adjustments in color, background, font etc. as per your unique business setting.

Chart Indicates Diminishing Graph And Chart Retail Value And Volume Download PDF
Pitch your topic with ease and precision using this Chart Indicates Diminishing Graph And Chart Retail Value And Volume Download PDF. This layout presents information on Chart Indicates Diminishing Graph, Chart Retail Value And Volume. It is also available for immediate download and adjustment. So, changes can be made in the color, design, graphics or any other component to create a unique layout.

Employee Health And Risk Key Performance Indicator Dashboard Icon Ppt Professional Diagrams PDF
Presenting Employee Health And Risk Key Performance Indicator Dashboard Icon Ppt Professional Diagrams PDF to dispense important information. This template comprises four stages. It also presents valuable insights into the topics including Employee, Health And Risk, Key Performance, Indicator Dashboard, Icon. This is a completely customizable PowerPoint theme that can be put to use immediately. So, download it and address the topic impactfully.

Icon Indicating Indian Food Dishes Bread Ppt PowerPoint Presentation Outline Vector PDF
Pitch your topic with ease and precision using this Icon Indicating Indian Food Dishes Bread Ppt PowerPoint Presentation Outline Vector PDF. This layout presents information on Icon Indicating, Indian Food, Dishes Bread. It is also available for immediate download and adjustment. So, changes can be made in the color, design, graphics or any other component to create a unique layout.

Icon Indicating Malware Detection In Business Threats Landscape Ppt Layouts Influencers PDF
Presenting Icon Indicating Malware Detection In Business Threats Landscape Ppt Layouts Influencers PDF to dispense important information. This template comprises three stages. It also presents valuable insights into the topics including Icon Indicating, Malware Detection, Business Threats Landscape. This is a completely customizable PowerPoint theme that can be put to use immediately. So, download it and address the topic impactfully.

Plant Management Icon Indicating Industrial Wastewater Treatment System Ppt Styles Maker PDF
Showcasing this set of slides titled Plant Management Icon Indicating Industrial Wastewater Treatment System Ppt Styles Maker PDF. The topics addressed in these templates are Plant Management, Icon Indicating Industrial, Wastewater Treatment System. All the content presented in this PPT design is completely editable. Download it and make adjustments in color, background, font etc. as per your unique business setting.

Plant Management Icon Indicating Industrial Wastewater Treatment Systems Ppt Gallery Elements PDF
Presenting Plant Management Icon Indicating Industrial Wastewater Treatment Systems Ppt Gallery Elements PDF to dispense important information. This template comprises three stages. It also presents valuable insights into the topics including Plant Management, Icon Indicating Industrial, Wastewater Treatment Systems. This is a completely customizable PowerPoint theme that can be put to use immediately. So, download it and address the topic impactfully.
Icon Indicating Scrum Task Project Kanban Board For Time Management Inspiration PDF
Presenting Icon Indicating Scrum Task Project Kanban Board For Time Management Inspiration PDF to dispense important information. This template comprises three stages. It also presents valuable insights into the topics including Icon Indicating Scrum Task, Project Kanban Board, Management. This is a completely customizable PowerPoint theme that can be put to use immediately. So, download it and address the topic impactfully.

Blockchain Platform For Industries Nodes Icon Indicating Smooth Process Summary PDF
Showcasing this set of slides titled Blockchain Platform For Industries Nodes Icon Indicating Smooth Process Summary PDF. The topics addressed in these templates are Blockchain Platform Industries Nodes, Icon Indicating Smooth Process. All the content presented in this PPT design is completely editable. Download it and make adjustments in color, background, font etc. as per your unique business setting.

Call Center Quality Key Performance Assurance Indicator Metrics Dashboard Portrait PDF
Showcasing this set of slides titled Call Center Quality Key Performance Assurance Indicator Metrics Dashboard Portrait PDF. The topics addressed in these templates are Key Performance, Assurance Indicator, Metrics Dashboard. All the content presented in this PPT design is completely editable. Download it and make adjustments in color, background, font etc. as per your unique business setting.
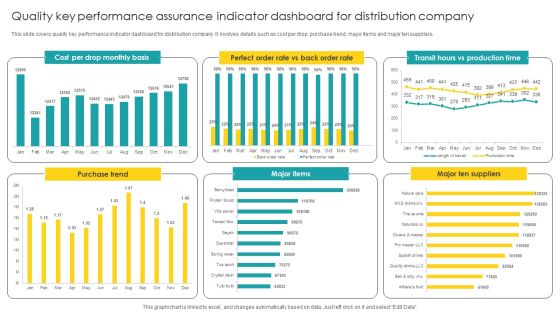
Quality Key Performance Assurance Indicator Dashboard For Distribution Company Mockup PDF
Showcasing this set of slides titled Quality Key Performance Assurance Indicator Dashboard For Distribution Company Mockup PDF. The topics addressed in these templates are Performance Assurance, Indicator Dashboard, Distribution Company. All the content presented in this PPT design is completely editable. Download it and make adjustments in color, background, font etc. as per your unique business setting.
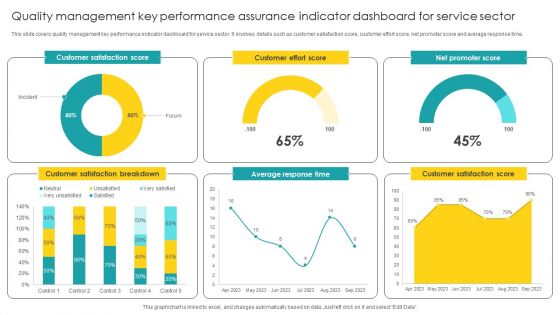
Quality Management Key Performance Assurance Indicator Dashboard For Service Sector Designs PDF
Showcasing this set of slides titled Quality Management Key Performance Assurance Indicator Dashboard For Service Sector Designs PDF. The topics addressed in these templates are Assurance Indicator, Dashboard For Service Sector. All the content presented in this PPT design is completely editable. Download it and make adjustments in color, background, font etc. as per your unique business setting.
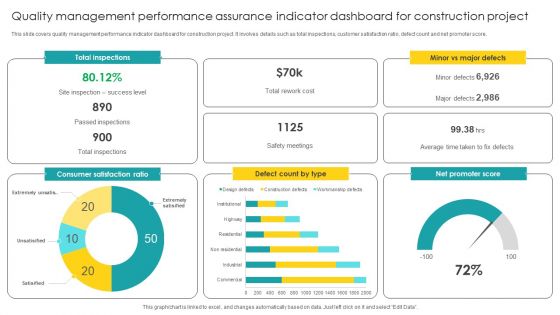
Quality Management Performance Assurance Indicator Dashboard For Construction Project Pictures PDF
Pitch your topic with ease and precision using this Quality Management Performance Assurance Indicator Dashboard For Construction Project Pictures PDF. This layout presents information on Assurance Indicator, Dashboard For Construction Project. It is also available for immediate download and adjustment. So, changes can be made in the color, design, graphics or any other component to create a unique layout.

Icon Indicating Price Negotiation Between Supplier And Client Ppt Model Good PDF
Presenting Icon Indicating Price Negotiation Between Supplier And Client Ppt Model Good PDF to dispense important information. This template comprises three stages. It also presents valuable insights into the topics including Icon Indicating, Price Negotiation Between, Supplier And Client. This is a completely customizable PowerPoint theme that can be put to use immediately. So, download it and address the topic impactfully.
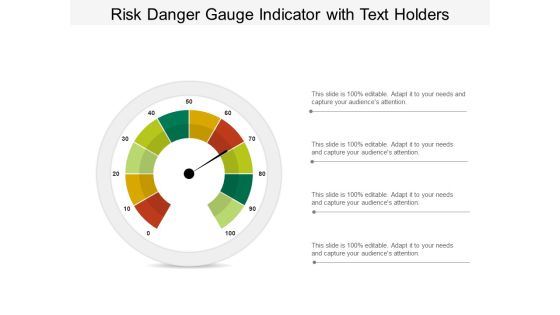
Risk Danger Gauge Indicator With Text Holders Ppt PowerPoint Presentation Outline Good
This is a risk danger gauge indicator with text holders ppt powerpoint presentation outline good. This is a four stage process. The stages in this process are risk meter, risk speedometer, hazard meter.
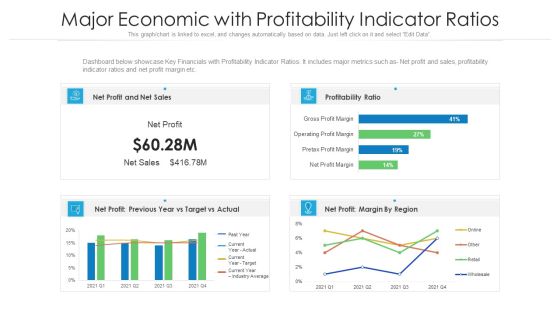
Major Economic With Profitability Indicator Ratios Ppt PowerPoint Presentation Gallery Layouts PDF
Dashboard below showcase Key Financials with Profitability Indicator Ratios. It includes major metrics such as- Net profit and sales, profitability indicator ratios and net profit margin etc. Pitch your topic with ease and precision using this major economic with profitability indicator ratios ppt powerpoint presentation gallery layouts pdf. This layout presents information on sales, profitability ratio, target. It is also available for immediate download and adjustment. So, changes can be made in the color, design, graphics or any other component to create a unique layout.
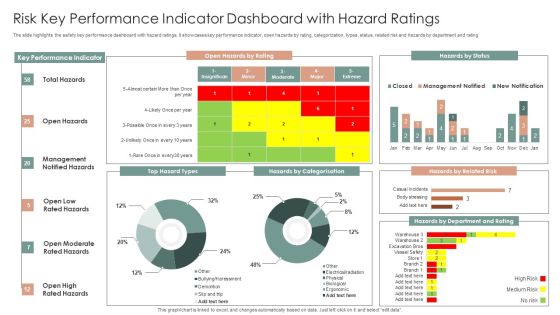
Risk Key Performance Indicator Dashboard With Hazard Ratings Ppt Layouts Slideshow PDF
The slide highlights the safety key performance dashboard with hazard ratings. It showcases key performance indicator, open hazards by rating, categorization, types, status, related risk and hazards by department and rating. Showcasing this set of slides titled Risk Key Performance Indicator Dashboard With Hazard Ratings Ppt Layouts Slideshow PDF. The topics addressed in these templates are Key Performance Indicator, Open Hazards, Hazards By Status. All the content presented in this PPT design is completely editable. Download it and make adjustments in color, background, font etc. as per your unique business setting.

Customer Satisfaction Levels High Medium Low Indicator Dashboard Ppt PowerPoint Presentation Icon Show
This is a customer satisfaction levels high medium low indicator dashboard ppt powerpoint presentation icon show. This is a six stage process. The stages in this process are performance dashboard, performance meter, performance kpi.

Low High Performance Measurement Indicator Dashboard Ppt PowerPoint Presentation Summary Images
This is a low high performance measurement indicator dashboard ppt powerpoint presentation summary images. This is a five stage process. The stages in this process are performance dashboard, performance meter, performance kpi.
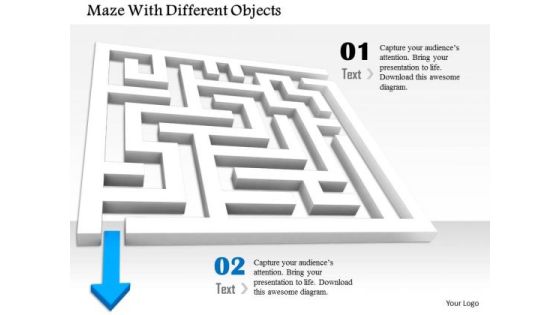
Stock Photo Blue Arrow Indicating Way Out From Maze PowerPoint Slide
This image is designed with blue arrow indication way out of maze. Use this professional image to demonstrate concepts of problem solving and finding solution. Use this theme of maze to give unified look to your presentations.

Business Diagram Yellow Warning Board For Fire Hazard Indication Presentation Template
Display the warning of fire hazard and its indication for safety. These measures may be well explained with this exclusive diagram template. Use this slide to build professional presentations for your audience.
Stock Photo 3d Mouse Cursor For Data Indication Image Graphics For PowerPoint
This Power Point image template has been crafted with graphic of 3d mouse cursor. This image template contains the concept of data indication on computer. Use this image template for your computer technology related presentations.

Reaching Business Goals Performance Indicator Ppt PowerPoint Presentation Pictures Infographic Template
This is a reaching business goals performance indicator ppt powerpoint presentation pictures infographic template. This is a one stage process. The stages in this process are sales objectives, sales goal, achieving sales target.

Key Performance Indicator Analytics Dashboard Ppt PowerPoint Presentation Model Example Topics
This is a key performance indicator analytics dashboard ppt powerpoint presentation model example topics. This is a five stage process. The stages in this process are kpi proposal, kpi plan, kpi scheme.
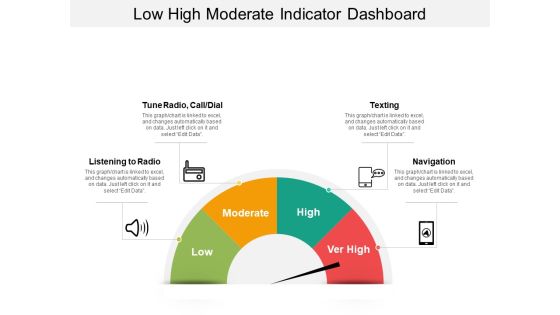
Low High Moderate Indicator Dashboard Ppt Powerpoint Presentation Infographic Template Example 2015
This is a low high moderate indicator dashboard ppt powerpoint presentation infographic template example 2015. This is a four stage process. The stages in this process are disturbance, distraction, interruption, diversion.
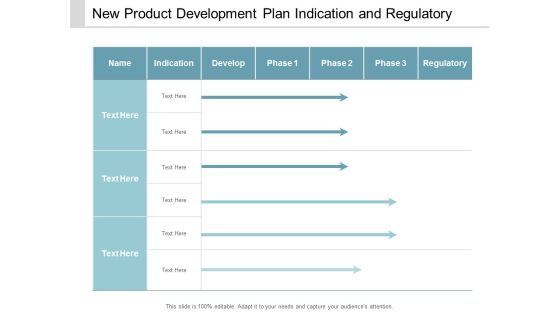
New Product Development Plan Indication And Regulatory Ppt Powerpoint Presentation Ideas Design Ideas
This is a new product development plan indication and regulatory ppt powerpoint presentation ideas design ideas. This is a three stage process. The stages in this process are product development pipeline, product development line, product development channel.

Availability Key Performance Indicator Inventory Turnover Ratio Ppt Powerpoint Presentation Layouts Graphics Download
This is a availability key performance indicator inventory turnover ratio ppt powerpoint presentation layouts graphics download. This is a two stage process. The stages in this process are availability kpi, availability dashboard, availability metrics.

Vector Indicating 14 Steps Business Process Cycle Ppt PowerPoint Presentation Gallery Background Images PDF
Persuade your audience using this vector indicating 14 steps business process cycle ppt powerpoint presentation gallery background images pdf. This PPT design covers three stages, thus making it a great tool to use. It also caters to a variety of topics including vector indicating 14 steps business process cycle. Download this PPT design now to present a convincing pitch that not only emphasizes the topic but also showcases your presentation skills.

Downturn Graph Indicating Growth Rate In Various Countries Ppt PowerPoint Presentation Layouts Design Templates PDF
Pitch your topic with ease and precision using this downturn graph indicating growth rate in various countries ppt powerpoint presentation layouts design templates pdf. This layout presents information on downturn graph indicating growth rate in various countries. It is also available for immediate download and adjustment. So, changes can be made in the color, design, graphics or any other component to create a unique layout.
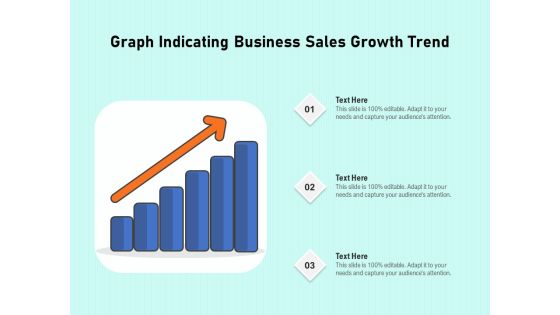
Graph Indicating Business Sales Growth Trend Ppt PowerPoint Presentation File Slide Portrait PDF
Persuade your audience using this graph indicating business sales growth trend ppt powerpoint presentation file slide portrait pdf. This PPT design covers three stages, thus making it a great tool to use. It also caters to a variety of topics including graph indicating business sales growth trend. Download this PPT design now to present a convincing pitch that not only emphasizes the topic but also showcases your presentation skills.

Three Circular Steps Indicating Business Product Lines Ppt PowerPoint Presentation File Shapes PDF
Persuade your audience using this three circular steps indicating business product lines ppt powerpoint presentation file shapes pdf. This PPT design covers three stages, thus making it a great tool to use. It also caters to a variety of topics including three circular steps indicating business product lines. Download this PPT design now to present a convincing pitch that not only emphasizes the topic but also showcases your presentation skills.

Chart Indicating United States Marine Corps Yearly Attrition Rate Ppt PowerPoint Presentation File Background Images PDF
Pitch your topic with ease and precision using this chart indicating united states marine corps yearly attrition rate ppt powerpoint presentation file background images pdf. This layout presents information on hart indicating united states marine corps yearly attrition rate. It is also available for immediate download and adjustment. So, changes can be made in the color, design, graphics or any other component to create a unique layout.
Client Satisfaction Survey With Performance Indicator Icon Ppt PowerPoint Presentation Gallery Backgrounds PDF
Persuade your audience using this client satisfaction survey with performance indicator icon ppt powerpoint presentation gallery backgrounds pdf. This PPT design covers three stages, thus making it a great tool to use. It also caters to a variety of topics including client satisfaction survey with performance indicator icon. Download this PPT design now to present a convincing pitch that not only emphasizes the topic but also showcases your presentation skills.
Financial Risk Indicator With Threat Symbol Vector Icon Ppt PowerPoint Presentation Summary PDF
Persuade your audience using this financial risk indicator with threat symbol vector icon ppt powerpoint presentation summary pdf. This PPT design covers three stages, thus making it a great tool to use. It also caters to a variety of topics including financial risk indicator with threat symbol vector icon. Download this PPT design now to present a convincing pitch that not only emphasizes the topic but also showcases your presentation skills.
Group Presentation Indicating Roles And Responsibilities Ppt PowerPoint Presentation Icon Styles PDF
Persuade your audience using this group presentation indicating roles and responsibilities ppt powerpoint presentation icon styles pdf. This PPT design covers four stages, thus making it a great tool to use. It also caters to a variety of topics including group presentation indicating roles and responsibilities. Download this PPT design now to present a convincing pitch that not only emphasizes the topic but also showcases your presentation skills.

Five Steps Indicating Presentation To International Business Ppt PowerPoint Presentation File Inspiration PDF
Persuade your audience using this five steps indicating presentation to international business ppt powerpoint presentation file inspiration pdf. This PPT design covers five stages, thus making it a great tool to use. It also caters to a variety of topics including five steps indicating presentation to international business. Download this PPT design now to present a convincing pitch that not only emphasizes the topic but also showcases your presentation skills.
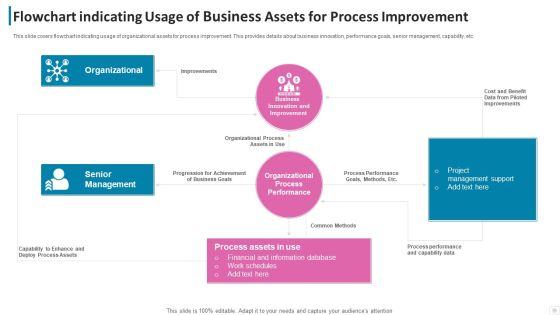
Flowchart Indicating Usage Of Business Assets For Process Improvement Formats PDF
This slide covers flowchart indicating usage of organizational assets for process improvement. This provides details about business innovation, performance goals, senior management, capability, etc. Pitch your topic with ease and precision using this flowchart indicating usage of business assets for process improvement formats pdf. This layout presents information on organizational, senior management, organizational process. It is also available for immediate download and adjustment. So, changes can be made in the color, design, graphics or any other component to create a unique layout.

Supplier Scorecard Supplier Comparison Scorecard With Key Performance Indicator Chart Formats PDF
This is a supplier scorecard supplier comparison scorecard with key performance indicator chart formats pdf template with various stages. Focus and dispense information on one stages using this creative set, that comes with editable features. It contains large content boxes to add your information on topics like supplier comparison scorecard, key performance, indicator chart. You can also showcase facts, figures, and other relevant content using this PPT layout. Grab it now.

Dashboard Indicating Funding Request Capital Raising Stages Ppt Show Infographics PDF
This slide showcases dashboard indicating status of multiple stages in funding ask. It provides information about valuation, discount, investors, seed round, angel, previous funding, etc. Showcasing this set of slides titled dashboard indicating funding request capital raising stages ppt show infographics pdf. The topics addressed in these templates are previous funding, building expenses, resource requirement. All the content presented in this PPT design is completely editable. Download it and make adjustments in color, background, font etc. as per your unique business setting.
Icon Indicating Cloud Platform Migration Service For User Platform Designs PDF
Persuade your audience using this Icon Indicating Cloud Platform Migration Service For User Platform Designs PDF. This PPT design covers four stages, thus making it a great tool to use. It also caters to a variety of topics including Icon Indicating Cloud Platform Migration Service For User Platform. Download this PPT design now to present a convincing pitch that not only emphasizes the topic but also showcases your presentation skills.

Change Management Leadership Icon Indicating Manager Developing Team Skills Infographics PDF
Persuade your audience using this Change Management Leadership Icon Indicating Manager Developing Team Skills Infographics PDF This PPT design covers four stages, thus making it a great tool to use. It also caters to a variety of topics including Change Management, Leadership Icon, Indicating Manager Download this PPT design now to present a convincing pitch that not only emphasizes the topic but also showcases your presentation skills.
Icon Indicating Trainer Conducting Leader Training And Development Program Designs PDF
Persuade your audience using this Icon Indicating Trainer Conducting Leader Training And Development Program Designs PDF. This PPT design covers three stages, thus making it a great tool to use. It also caters to a variety of topics including Icon Indicating Trainer, Conducting Leader ,Training And Development, Program. Download this PPT design now to present a convincing pitch that not only emphasizes the topic but also showcases your presentation skills.
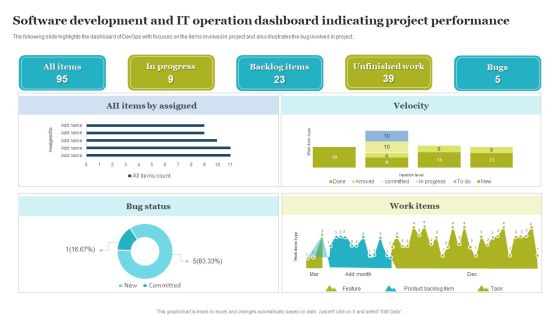
Software Development And IT Operation Dashboard Indicating Project Performance Demonstration PDF
The following slide highlights the dashboard of DevOps with focuses on the items involved in project and also illustrates the bug involved in project. Showcasing this set of slides titled Software Development And IT Operation Dashboard Indicating Project Performance Demonstration PDF. The topics addressed in these templates are Software Development, IT Operation Dashboard, Indicating Project Performance. All the content presented in this PPT design is completely editable. Download it and make adjustments in color, background, font etc. as per your unique business setting.

Market Growth And Development Tactics Icon Indicating Business Opportunity Template PDF
Persuade your audience using this Market Growth And Development Tactics Icon Indicating Business Opportunity Template PDF. This PPT design covers three stages, thus making it a great tool to use. It also caters to a variety of topics including Market Growth, Development Tactics Icon, Indicating Business Opportunity. Download this PPT design now to present a convincing pitch that not only emphasizes the topic but also showcases your presentation skills.

Workplace Risk Key Performance Indicator Dashboard Icon Ppt Inspiration Slides PDF
Persuade your audience using this Workplace Risk Key Performance Indicator Dashboard Icon Ppt Inspiration Slides PDF. This PPT design covers four stages, thus making it a great tool to use. It also caters to a variety of topics including Workplace Risk, Key Performance, Indicator Dashboard, Icon. Download this PPT design now to present a convincing pitch that not only emphasizes the topic but also showcases your presentation skills.

Internal Hiring Icon Indicating Job Promotion Ppt Infographic Template Portfolio PDF
Persuade your audience using this Internal Hiring Icon Indicating Job Promotion Ppt Infographic Template Portfolio PDF. This PPT design covers three stages, thus making it a great tool to use. It also caters to a variety of topics including Internal, Hiring Icon, Indicating Job Promotion. Download this PPT design now to present a convincing pitch that not only emphasizes the topic but also showcases your presentation skills.

Wastewater Treatment Workflow Diagram Indicating Batch Process Model Ppt Icon Example PDF
This slide showcase plant management workflow diagram indicating batch process model. It provides information about procedural model, physical model and process model. Pitch your topic with ease and precision using this Wastewater Treatment Workflow Diagram Indicating Batch Process Model Ppt Icon Example PDF. This layout presents information on Operations, Physical Model, Process Model, Procedural Model. It is also available for immediate download and adjustment. So, changes can be made in the color, design, graphics or any other component to create a unique layout.

Customer NPS Metric Dashboard Indicating Customer Satisfaction And Agent Performance Template PDF
This slide shows net promoter score dashboard indicating customer satisfaction and agent performance which includes medium wise satisfaction, customer satisfaction, consumer loyalty, etc. Showcasing this set of slides titled Customer NPS Metric Dashboard Indicating Customer Satisfaction And Agent Performance Template PDF. The topics addressed in these templates are Net Promoter Score, Consumer Loyalty, Top 5 Agents. All the content presented in this PPT design is completely editable. Download it and make adjustments in color, background, font etc. as per your unique business setting.

Customer Effort Score Indicator Icon To Measure Required Actions Ppt File Sample PDF
Persuade your audience using this Customer Effort Score Indicator Icon To Measure Required Actions Ppt File Sample PDF. This PPT design covers four stages, thus making it a great tool to use. It also caters to a variety of topics including Customer, Effort Score Indicator, Icon To Measure, Required Actions. Download this PPT design now to present a convincing pitch that not only emphasizes the topic but also showcases your presentation skills.

Dashboard Indicating Status Of Change Requests For Effective Leadership Decisions Themes PDF
This slide showcase leadership dashboard indicating status of change requests for effective leadership decisions which can benefit organizations in earning additional revenues and stimulate employee performance. It contains change request due in a week, change request due in month, open changes, waiting for approval, open changes by risk, change requests by status and change requests by due date.Showcasing this set of slides titled Dashboard Indicating Status Of Change Requests For Effective Leadership Decisions Themes PDF The topics addressed in these templates are Dashboard Indicating, Requests Effective, Leadership Decisions All the content presented in this PPT design is completely editable. Download it and make adjustments in color, background, font etc. as per your unique business setting.
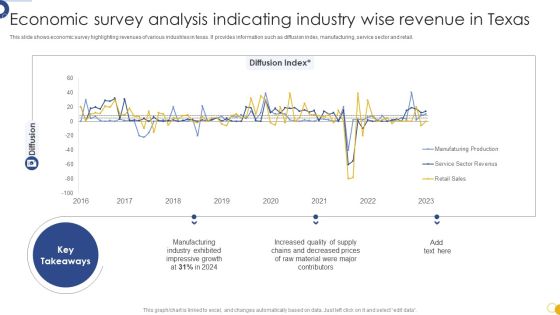
Economic Survey Analysis Indicating Industry Wise Revenue In Texas Portrait PDF
This slide shows economic survey highlighting revenues of various industries in texas. It provides information such as diffusion index, manufacturing, service sector and retail. Showcasing this set of slides titled Economic Survey Analysis Indicating Industry Wise Revenue In Texas Portrait PDF. The topics addressed in these templates are Economic Survey Analysis, Indicating Industry Wise, Revenue In Texas. All the content presented in this PPT design is completely editable. Download it and make adjustments in color, background, font etc. as per your unique business setting.

Statistics Indicating Risk Assessment Approaches Followed In Supply Chain Supplier Designs PDF
This slide. Delineates statistics indicating risk assessment approaches followed in supply chain procurement. It contains details such as initiating, standard processes, site inspection, supplier feedback, etc. Pitch your topic with ease and precision using this statistics indicating risk assessment approaches followed in supply chain supplier designs pdf. This layout presents information on key takeaways, approaches, respondents. It is also available for immediate download and adjustment. So, changes can be made in the color, design, graphics or any other component to create a unique layout.

Customer Texting Platforms Dashboard Indicating Conversation Stats And Sources Details Ideas PDF
This slide showcase customer messaging platform dashboard indicating conversation stats and sources details beneficial for companies to make any changes or improvements in prevailing bulk texts being sent to consumers. It contains information about assigned, unanswered, operators online, average response time, duration of conversation, users, message sources, etc.Showcasing this set of slides titled customer texting platforms dashboard indicating conversation stats and sources details ideas pdf The topics addressed in these templates are total conversations, total assigned, total unanswered All the content presented in this PPT design is completely editable. Download it and make adjustments in color, background, font etc. as per your unique business setting.
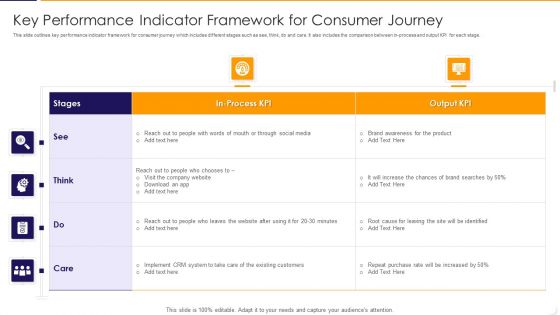
Key Performance Indicator Framework For Consumer Journey Ppt PowerPoint Presentation Gallery Good PDF
This slide outlines key performance indicator framework for consumer journey which includes different stages such as see, think, do and care. It also includes the comparison between in process and output KPI for each stage. Pitch your topic with ease and precision using this key performance indicator framework for consumer journey ppt powerpoint presentation gallery good pdf This layout presents information on social media, system, implement. It is also available for immediate download and adjustment. So, changes can be made in the color, design, graphics or any other component to create a unique layout.

Procedure Dashboard Indicating Integration Of Home Activities With Automation Ppt PowerPoint Presentation File Files PDF
This slide shows process dashboard indicating integration of home activities with automation which contains temperature, average humidity, intensity of light, bedroom, kitchen and dining. It can be beneficial for households who have transformed their homes into smart integrated systems and manage various priorities in one touch.Showcasing this set of slides titled Procedure Dashboard Indicating Integration Of Home Activities With Automation Ppt PowerPoint Presentation File Files PDF. The topics addressed in these templates are Average Humidity, Temperature, Intensity Light. All the content presented in this PPT design is completely editable. Download it and make adjustments in color, background, font etc. as per your unique business setting.
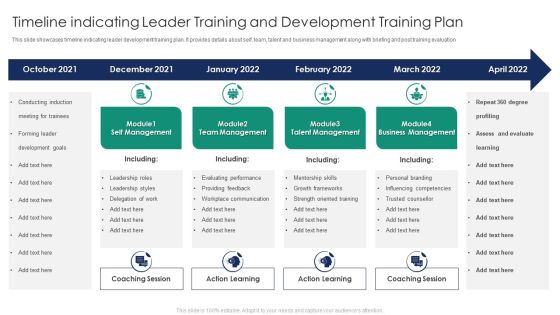
Timeline Indicating Leader Training And Development Training Plan Slides Structure PDF
This slide showcases timeline indicating leader development training plan. It provides details about self, team, talent and business management along with briefing and post training evaluation. Pitch your topic with ease and precision using this Timeline Indicating Leader Training And Development Training Plan Slides Structure PDF. This layout presents information on Self Management, Team Management, Talent Management. It is also available for immediate download and adjustment. So, changes can be made in the color, design, graphics or any other component to create a unique layout.

Comparative Health And Risk Key Performance Indicator Dashboard Ppt Portfolio Slide PDF
The slide highlights the comparative health and safety key performance indicator dashboard. It shows current year and previous events, safety incident classification, safety cases by place, map and safety consequence. Showcasing this set of slides titled Comparative Health And Risk Key Performance Indicator Dashboard Ppt Portfolio Slide PDF. The topics addressed in these templates are Safety Consequence, Safety Incidents Classification, Map. All the content presented in this PPT design is completely editable. Download it and make adjustments in color, background, font etc. as per your unique business setting.

Employee Health And Risk Key Performance Indicator Dashboard Ppt Layouts Brochure PDF
The following slide highlights the employee health and safety key performance indicator dashboard illustrating narrow escapes, potential hazards, improvement opportunity, total incidents, health and safety learning, safety visit by management, ltir and trir, severe injuries and fatalities and safety goals. Showcasing this set of slides titled Employee Health And Risk Key Performance Indicator Dashboard Ppt Layouts Brochure PDF. The topics addressed in these templates are Narrow Escapes, Potential Hazards, Improvement Opportunity. All the content presented in this PPT design is completely editable. Download it and make adjustments in color, background, font etc. as per your unique business setting.

Employee Risk Key Performance Indicator Dashboard With Case Incident Rate Ppt Professional Information PDF
The following slide highlights the employee safety key performance indicator dashboard with case incident rate illustrating total case occurrence rate, last reported case, days without reported, causing items, corrective actions, incident pyramid, incident by month and major causes. Pitch your topic with ease and precision using this Employee Risk Key Performance Indicator Dashboard With Case Incident Rate Ppt Professional Information PDF. This layout presents information on Total Case, Incident Rate, Last Incident Reported, Incident Causing Items. It is also available for immediate download and adjustment. So, changes can be made in the color, design, graphics or any other component to create a unique layout.
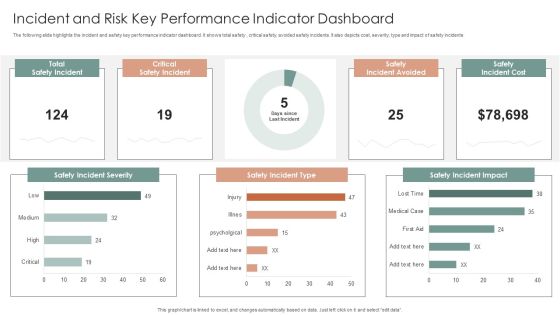
Incident And Risk Key Performance Indicator Dashboard Ppt Gallery Mockup PDF
The following slide highlights the incident and safety key performance indicator dashboard. It shows total safety, critical safety, avoided safety incidents. It also depicts cost, severity, type and impact of safety incidents. Showcasing this set of slides titled Incident And Risk Key Performance Indicator Dashboard Ppt Gallery Mockup PDF. The topics addressed in these templates are Safety Incident Severity, Safety Incident Type, Safety Incident Impact. All the content presented in this PPT design is completely editable. Download it and make adjustments in color, background, font etc. as per your unique business setting.

Patient Health And Risk Key Performance Indicator Dashboard Ppt Infographic Template Summary PDF
The following slide highlights the patient health and safety key performance indicator dashboard illustrating admission by department, admission by cost, patient satisfaction, total patients, operations cost, patient density, total staff, waiting time, treatment satisfaction and treatment confidence. Pitch your topic with ease and precision using this Patient Health And Risk Key Performance Indicator Dashboard Ppt Infographic Template Summary PDF. This layout presents information on Admission By Department, Admission Vs Cost, Patient Satisfaction. It is also available for immediate download and adjustment. So, changes can be made in the color, design, graphics or any other component to create a unique layout.

Risk Awareness And Risk Key Performance Indicator Dashboard Ppt Inspiration Ideas PDF
The following slide highlights the risk awareness and safety key performance indicator dashboard illustrating risk awareness, clear leadership, risk mitigation preparedness, risk incidents last month, safety incidents last months, inspection plan adherence, risk and safety quality training, trained people last month, monitoring, safety tools change on and risk awareness. Showcasing this set of slides titled Risk Awareness And Risk Key Performance Indicator Dashboard Ppt Inspiration Ideas PDF. The topics addressed in these templates are Safety Incident Avoided, Safety Incidents, Safety Incident, Accumulated Total. All the content presented in this PPT design is completely editable. Download it and make adjustments in color, background, font etc. as per your unique business setting.

Risk Key Performance Indicator Dashboard For Manufacturing Company Ppt Gallery Graphics Design PDF
The following slide highlights the safety key performance indicator dashboard for manufacturing company. It showcases safety incident per employee, total number of cases, safety events avoided, accumulated total and safety incidents. Pitch your topic with ease and precision using this Risk Key Performance Indicator Dashboard For Manufacturing Company Ppt Gallery Graphics Design PDF. This layout presents information on Safety Incidents, Safety Incident Avoided, Safety Incident Accumulated. It is also available for immediate download and adjustment. So, changes can be made in the color, design, graphics or any other component to create a unique layout.
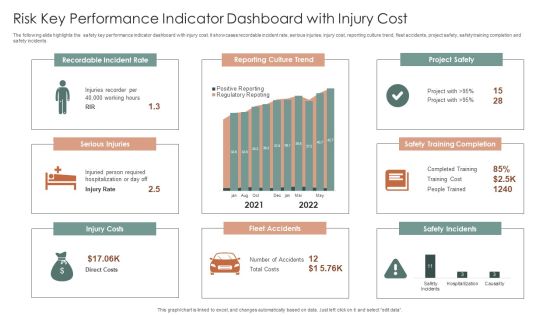
Risk Key Performance Indicator Dashboard With Injury Cost Ppt Summary Brochure PDF
The following slide highlights the safety key performance indicator dashboard with injury cost. It showcases recordable incident rate, serious injuries, injury cost, reporting culture trend, fleet accidents, project safety, safety training completion and safety incidents. Pitch your topic with ease and precision using this Risk Key Performance Indicator Dashboard With Injury Cost Ppt Summary Brochure PDF. This layout presents information on Recordable Incident Rate, Reporting Culture Trend, Project Safety. It is also available for immediate download and adjustment. So, changes can be made in the color, design, graphics or any other component to create a unique layout.
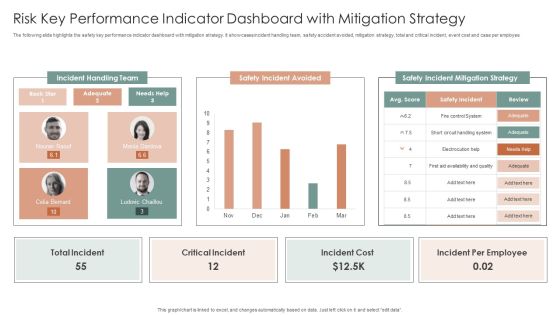
Risk Key Performance Indicator Dashboard With Mitigation Strategy Ppt Inspiration Design Templates PDF
The following slide highlights the safety key performance indicator dashboard with mitigation strategy. It showcases incident handling team, safety accident avoided, mitigation strategy, total and critical incident, event cost and case per employee. Showcasing this set of slides titled Risk Key Performance Indicator Dashboard With Mitigation Strategy Ppt Inspiration Design Templates PDF. The topics addressed in these templates are Incident Handling Team, Safety Incident Avoided, Safety Incident. All the content presented in this PPT design is completely editable. Download it and make adjustments in color, background, font etc. as per your unique business setting.
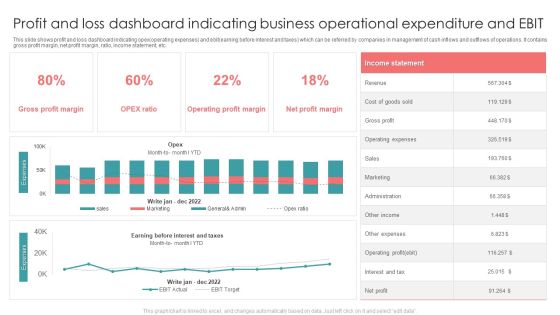
Profit And Loss Dashboard Indicating Business Operational Expenditure And EBIT Formats PDF
This slide shows profit and loss dashboard indicating opex operating expenses and ebit earning before interest and taxes which can be referred by companies in management of cash inflows and outflows of operations. It contains gross profit margin, net profit margin, ratio, income statement, etc. Showcasing this set of slides titled Profit And Loss Dashboard Indicating Business Operational Expenditure And EBIT Formats PDF. The topics addressed in these templates are Revenue, Gross Profit, Sales. All the content presented in this PPT design is completely editable. Download it and make adjustments in color, background, font etc. as per your unique business setting.
Statistics Indicating Recurring Business Operational Expenditure In Telecom Operations Icons PDF
This slide shows statistics indicating recurring operating expenditure OPEX in telecom operations which can benefit their executives in evaluating the current expenses and make cost effective amendments for future operations. It includes information about maintenance, repair, network charging and billing, customer support, marketing and operational planning costs. Pitch your topic with ease and precision using this Statistics Indicating Recurring Business Operational Expenditure In Telecom Operations Icons PDF. This layout presents information on Company, Costs, Marketing Costs. It is also available for immediate download and adjustment. So, changes can be made in the color, design, graphics or any other component to create a unique layout.

Business Operational Expenditure Dashboard Indicating Revenue And Costs Metrics Pictures PDF
This slide shows operating expenses OPEX dashboard indicating revenue and costs metrics which can be referred by companies to manage various operating expenses of various departments. It contains information about cost center, revenue per company, company code, etc. Pitch your topic with ease and precision using this Business Operational Expenditure Dashboard Indicating Revenue And Costs Metrics Pictures PDF. This layout presents information on Business Operational, Costs Metrics, Revenue. It is also available for immediate download and adjustment. So, changes can be made in the color, design, graphics or any other component to create a unique layout.

Statistics Indicating Changing Landscape Of Business Threats Ppt Model Design Templates PDF
This slide showcases statistics indicating changing landscape of business risk which can be referred by executives and managers to make decisions regarding their upcoming strategies and opportunities for risks. It includes information about cybersecurity breaches, business interruption, new technologies, climatic change, Persuade your audience using this Statistics Indicating Changing Landscape Of Business Threats Ppt Model Design Templates PDF. This PPT design covers one stages, thus making it a great tool to use. It also caters to a variety of topics including Cyber Security Breaches, Business Interruption, New Technologies. Download this PPT design now to present a convincing pitch that not only emphasizes the topic but also showcases your presentation skills.

Data Profiling Solutions Dashboard Indicating Row And Column Analysis Summary PDF
This slide illustrates data profiling dashboard indicating row and column analysis which can be referred by IT managers to manager to maintain quality and consistency of data. It contains information about reports, checking, evolution, overview, comparative, etc. Showcasing this set of slides titled Data Profiling Solutions Dashboard Indicating Row And Column Analysis Summary PDF. The topics addressed in these templates are Overview Analysis, Column Evaluation, Comparative Evaluation. All the content presented in this PPT design is completely editable. Download it and make adjustments in color, background, font etc. as per your unique business setting.
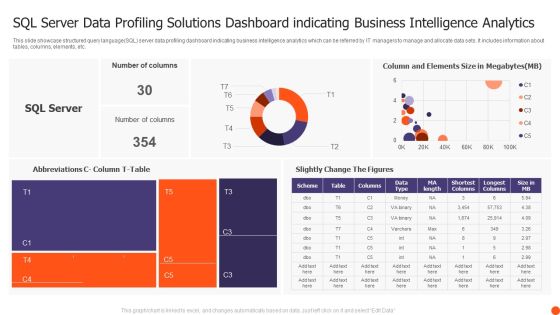
SQL Server Data Profiling Solutions Dashboard Indicating Business Intelligence Analytics Structure PDF
This slide showcase structured query language SQL server data profiling dashboard indicating business intelligence analytics which can be referred by IT managers to manage and allocate data sets. It includes information about tables, columns, elements, etc. Showcasing this set of slides titled SQL Server Data Profiling Solutions Dashboard Indicating Business Intelligence Analytics Structure PDF. The topics addressed in these templates are Number Columns, Slightly Change Figures, SQL Server. All the content presented in this PPT design is completely editable. Download it and make adjustments in color, background, font etc. as per your unique business setting.

Automated Testing Framework Dashboard Indicating Reported Issues And Results Ideas PDF
This slide showcase test automation framework dashboard indicating reported issues and results which can benefit IT firms in quick resolution of these problems. It contains information about weekly total, test results and details. It also includes information about passed, known issue, avoided, ended, queued, etc. Showcasing this set of slides titled Automated Testing Framework Dashboard Indicating Reported Issues And Results Ideas PDF. The topics addressed in these templates are Weekly Total, Test Results, Last 7 Days. All the content presented in this PPT design is completely editable. Download it and make adjustments in color, background, font etc. as per your unique business setting.

Investment Crowdfunding Platforms Data Indicating Equity And Debt Raised For Real Estate Diagrams PDF
This slide exhibits crowdfunding platforms data indicating equity and debt raised for real estate. It includes information about platforms and amount collected which can be referred by investors to choose best platforms to gain maximum ROI.Showcasing this set of slides titled Investment Crowdfunding Platforms Data Indicating Equity And Debt Raised For Real Estate Diagrams PDF. The topics addressed in these templates are Collected Financed, Highest Amount, Estate Industry. All the content presented in this PPT design is completely editable. Download it and make adjustments in color, background, font etc. as per your unique business setting.

Economic Survey Analysis Depicting Performance Of Major US Stock Indices Summary PDF
This slide shows economic survey highlighting performance of US stock exchange. It provides information about NASDAQ, S and P 500, dow jones, closing price, IT companies, stock price, etc. Showcasing this set of slides titled Economic Survey Analysis Depicting Performance Of Major US Stock Indices Summary PDF. The topics addressed in these templates are Economic Survey Analysis, Depicting Performance Major, US Stock Indices. All the content presented in this PPT design is completely editable. Download it and make adjustments in color, background, font etc. as per your unique business setting.
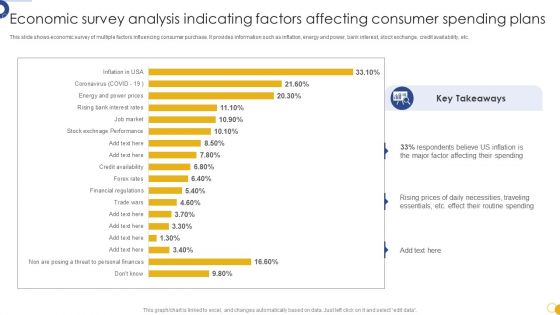
Economic Survey Analysis Indicating Factors Affecting Consumer Spending Plans Download PDF
This slide shows economic survey of multiple factors influencing consumer purchase. It provides information such as inflation, energy and power, bank interest, stock exchange, credit availability, etc. Pitch your topic with ease and precision using this Economic Survey Analysis Indicating Factors Affecting Consumer Spending Plans Download PDF. This layout presents information on Economic Survey Analysis, Indicating Factors Affecting, Consumer Spending Plans. It is also available for immediate download and adjustment. So, changes can be made in the color, design, graphics or any other component to create a unique layout.

Cloud Data Transformation Dashboard Indicating Project And Provision Status Formats PDF
This slide showcase data migration best practices dashboard indicating overall project and provision status. It contains information about contains user, group and resource provision status. Showcasing this set of slides titled Cloud Data Transformation Dashboard Indicating Project And Provision Status Formats PDF. The topics addressed in these templates are Data Migration Status, Overall Project Status, Group Provision Status. All the content presented in this PPT design is completely editable. Download it and make adjustments in color, background, font etc. as per your unique business setting.

Sales By Lead Source Performance Indicator Ppt Show Visual Aids PDF
Create an editable Sales By Lead Source Performance Indicator Ppt Show Visual Aids PDF that communicates your idea and engages your audience. Whether you are presenting a business or an educational presentation, pre designed presentation templates help save time. Sales By Lead Source Performance Indicator Ppt Show Visual Aids PDF is highly customizable and very easy to edit, covering many different styles from creative to business presentations. Slidegeeks has creative team members who have crafted amazing templates. So, go and get them without any delay.
 Home
Home