AI PPT Maker
Templates
PPT Bundles
Design Services
Business PPTs
Business Plan
Management
Strategy
Introduction PPT
Roadmap
Self Introduction
Timelines
Process
Marketing
Agenda
Technology
Medical
Startup Business Plan
Cyber Security
Dashboards
SWOT
Proposals
Education
Pitch Deck
Digital Marketing
KPIs
Project Management
Product Management
Artificial Intelligence
Target Market
Communication
Supply Chain
Google Slides
Research Services
 One Pagers
All Categories
-
Home
- Customer Favorites
- Indicators
Indicators
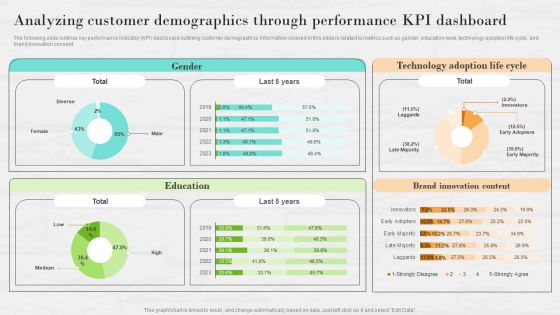
Market Research To Determine Business Opportunities Analyzing Customer Demographics Through Performance Brochure PDF
The following slide outlines key performance indicator KPI dashboard outlining customer demographics. Information covered in this slide is related to metrics such as gender, education level, technology adoption life cycle, and brand innovation consent. Boost your pitch with our creative Market Research To Determine Business Opportunities Analyzing Customer Demographics Through Performance Brochure PDF. Deliver an awe-inspiring pitch that will mesmerize everyone. Using these presentation templates you will surely catch everyones attention. You can browse the ppts collection on our website. We have researchers who are experts at creating the right content for the templates. So you do not have to invest time in any additional work. Just grab the template now and use them.

Strategies For Dynamic Supply Chain Agility Segmenting The Vendors Based On Overall Performance Diagrams PDF
This slide showcases the classification of potential vendors into defined groups based on their performance scores. It also indicates that vendor 1 will get placed into group A and vendor 2 into group B. Do you have to make sure that everyone on your team knows about any specific topic I yes, then you should give Strategies For Dynamic Supply Chain Agility Segmenting The Vendors Based On Overall Performance Diagrams PDF a try. Our experts have put a lot of knowledge and effort into creating this impeccable Strategies For Dynamic Supply Chain Agility Segmenting The Vendors Based On Overall Performance Diagrams PDF. You can use this template for your upcoming presentations, as the slides are perfect to represent even the tiniest detail. You can download these templates from the Slidegeeks website and these are easy to edit. So grab these today.
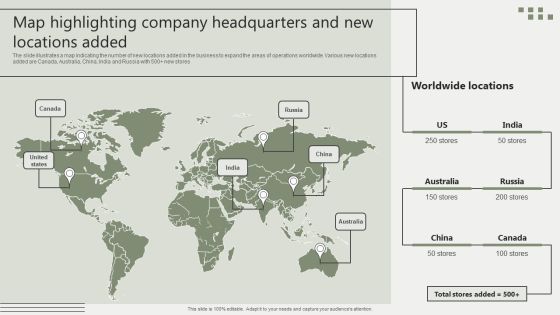
Global Business Market Development Guide Map Highlighting Company Headquarters And New Locations Added Themes PDF
The slide illustrates a map indicating the number of new locations added in the business to expand the areas of operations worldwide. Various new locations added are Canada, Australia, China, India and Russia with 500 plus new stores The Global Business Market Development Guide Map Highlighting Company Headquarters And New Locations Added Themes PDF is a compilation of the most recent design trends as a series of slides. It is suitable for any subject or industry presentation, containing attractive visuals and photo spots for businesses to clearly express their messages. This template contains a variety of slides for the user to input data, such as structures to contrast two elements, bullet points, and slides for written information. Slidegeeks is prepared to create an impression.

Steps To Effectively Conduct Market Research Analyzing Customer Demographics Through Performance Structure PDF
The following slide outlines key performance indicator KPI dashboard outlining customer demographics. Information covered in this slide is related to metrics such as gender, education level, technology adoption life cycle, and brand innovation consent. Slidegeeks is one of the best resources for PowerPoint templates. You can download easily and regulate Steps To Effectively Conduct Market Research Analyzing Customer Demographics Through Performance Structure PDF for your personal presentations from our wonderful collection. A few clicks is all it takes to discover and get the most relevant and appropriate templates. Use our Templates to add a unique zing and appeal to your presentation and meetings. All the slides are easy to edit and you can use them even for advertisement purposes.

Steps To Effectively Conduct Market Research Brand Analytics KPI Dashboard For Organization Template PDF
The following slide outlines key performance indicator KPI dashboard that can assist marketers to evaluate brand performance on social media channels. The metrics covered are age group, gender, brand perception, branding themes, celebrity analysis, etc. Present like a pro with Steps To Effectively Conduct Market Research Brand Analytics KPI Dashboard For Organization Template PDF Create beautiful presentations together with your team, using our easy to use presentation slides. Share your ideas in real time and make changes on the fly by downloading our templates. So whether you are in the office, on the go, or in a remote location, you can stay in sync with your team and present your ideas with confidence. With Slidegeeks presentation got a whole lot easier. Grab these presentations today.
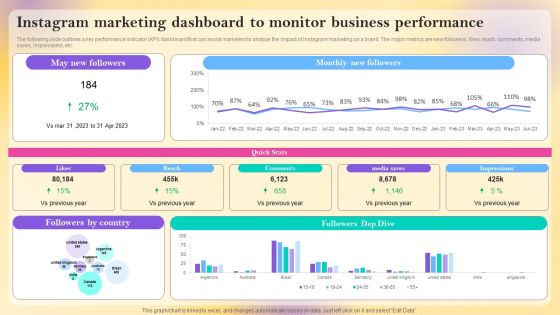
Instagram Marketing Dashboard To Monitor Business Performance Information PDF
The following slide outlines a key performance indicator KPI dashboard that can assist marketers to analyze the impact of Instagram marketing on a brand. The major metrics are new followers, likes, reach, comments, media saves, impressions, etc. This Instagram Marketing Dashboard To Monitor Business Performance Information PDF is perfect for any presentation, be it in front of clients or colleagues. It is a versatile and stylish solution for organizing your meetings. The product features a modern design for your presentation meetings. The adjustable and customizable slides provide unlimited possibilities for acing up your presentation. Slidegeeks has done all the homework before launching the product for you. So, do not wait, grab the presentation templates today
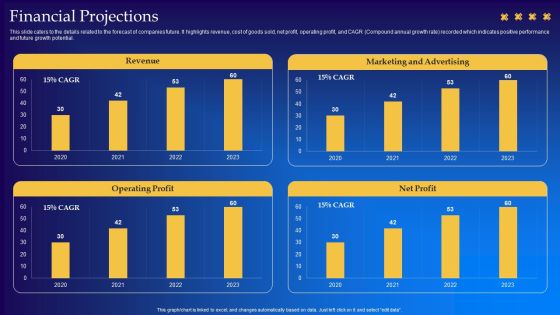
Live Audio Chat Platform Fundraising Pitch Deck Financial Projections Demonstration PDF
This slide caters to the details related to the forecast of companies future. It highlights revenue, cost of goods sold, net profit, operating profit, and CAGR Compound annual growth rate recorded which indicates positive performance and future growth potential. Want to ace your presentation in front of a live audience Our Live Audio Chat Platform Fundraising Pitch Deck Financial Projections Demonstration PDF can help you do that by engaging all the users towards you. Slidegeeks experts have put their efforts and expertise into creating these impeccable powerpoint presentations so that you can communicate your ideas clearly. Moreover, all the templates are customizable, and easy to edit and downloadable. Use these for both personal and commercial use.

Video Promotion Service Investor Funding Elevator Pitch Deck Financial Performance Professional PDF
The slide mentions the revenue, run rate and margin percentage of the company indicating the growth in organizations financial performance Slidegeeks is here to make your presentations a breeze with Video Promotion Service Investor Funding Elevator Pitch Deck Financial Performance Professional PDF With our easy to use and customizable templates, you can focus on delivering your ideas rather than worrying about formatting. With a variety of designs to choose from, you are sure to find one that suits your needs. And with animations and unique photos, illustrations, and fonts, you can make your presentation pop. So whether you are giving a sales pitch or presenting to the board, make sure to check out Slidegeeks first.
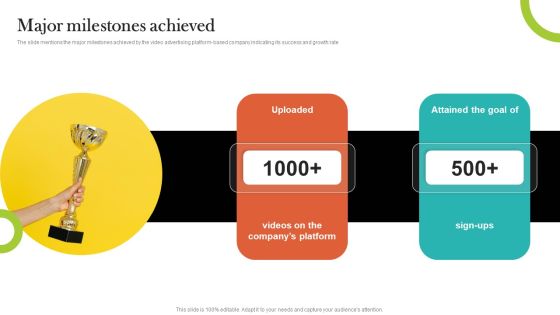
Video Promotion Service Investor Funding Elevator Pitch Deck Major Milestones Achieved Portrait PDF
The slide mentions the major milestones achieved by the video advertising platform-based company indicating its success and growth rate If you are looking for a format to display your unique thoughts, then the professionally designed Video Promotion Service Investor Funding Elevator Pitch Deck Major Milestones Achieved Portrait PDF is the one for you. You can use it as a Google Slides template or a PowerPoint template. Incorporate impressive visuals, symbols, images, and other charts. Modify or reorganize the text boxes as you desire. Experiment with shade schemes and font pairings. Alter, share or cooperate with other people on your work. Download Video Promotion Service Investor Funding Elevator Pitch Deck Major Milestones Achieved Portrait PDF and find out how to give a successful presentation. Present a perfect display to your team and make your presentation unforgettable.
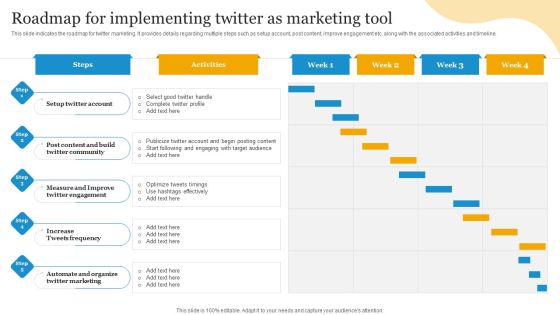
Social Media Advertising Through Twitter Roadmap For Implementing Twitter As Marketing Tool Pictures PDF
This slide indicates the roadmap for twitter marketing. It provides details regarding multiple steps such as setup account, post content, improve engagement etc. along with the associated activities and timeline. Coming up with a presentation necessitates that the majority of the effort goes into the content and the message you intend to convey. The visuals of a PowerPoint presentation can only be effective if it supplements and supports the story that is being told. Keeping this in mind our experts created Social Media Advertising Through Twitter Roadmap For Implementing Twitter As Marketing Tool Pictures PDF to reduce the time that goes into designing the presentation. This way, you can concentrate on the message while our designers take care of providing you with the right template for the situation.
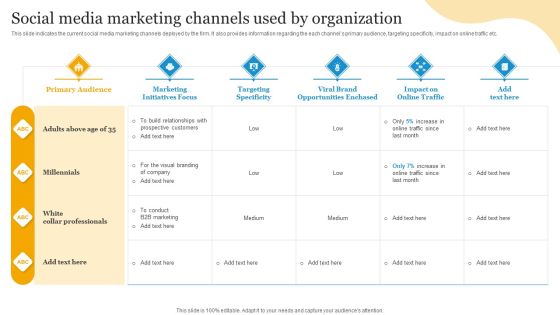
Social Media Advertising Through Twitter Social Media Marketing Channels Used By Organization Ideas PDF
This slide indicates the current social media marketing channels deployed by the firm. It also provides information regarding the each channels primary audience, targeting specificity, impact on online traffic etc. This Social Media Advertising Through Twitter Social Media Marketing Channels Used By Organization Ideas PDF is perfect for any presentation, be it in front of clients or colleagues. It is a versatile and stylish solution for organizing your meetings. The Social Media Advertising Through Twitter Social Media Marketing Channels Used By Organization Ideas PDF features a modern design for your presentation meetings. The adjustable and customizable slides provide unlimited possibilities for acing up your presentation. Slidegeeks has done all the homework before launching the product for you. So, do not wait, grab the presentation templates today
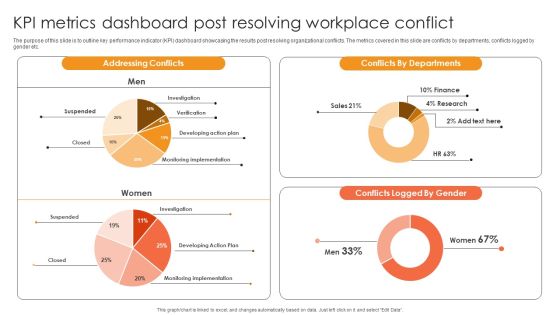
Kpi Metrics Dashboard Post Resolving Workplace Conflict Ppt Inspiration Graphics Download PDF
The purpose of this slide is to outline key performance indicator KPI dashboard showcasing the results post resolving organizational conflicts. The metrics covered in this slide are conflicts by departments, conflicts logged by gender etc. This Kpi Metrics Dashboard Post Resolving Workplace Conflict Ppt Inspiration Graphics Download PDF is perfect for any presentation, be it in front of clients or colleagues. It is a versatile and stylish solution for organizing your meetings. The Kpi Metrics Dashboard Post Resolving Workplace Conflict Ppt Inspiration Graphics Download PDF features a modern design for your presentation meetings. The adjustable and customizable slides provide unlimited possibilities for acing up your presentation. Slidegeeks has done all the homework before launching the product for you. So, do not wait, grab the presentation templates today

Ecommerce Photo Editing Services Fundraising Deck Financial Performance Demonstration PDF
The following slide outlines the yearly revenue of our company. The graphical representation covers information about annual sales from 2019-2022 that indicates upward growth. This Ecommerce Photo Editing Services Fundraising Deck Financial Performance Demonstration PDF from Slidegeeks makes it easy to present information on your topic with precision. It provides customization options, so you can make changes to the colors, design, graphics, or any other component to create a unique layout. It is also available for immediate download, so you can begin using it right away. Slidegeeks has done good research to ensure that you have everything you need to make your presentation stand out. Make a name out there for a brilliant performance.

Crash Couse Platform Investor Funding Presentation Esteemed Clientele Professional PDF
The slide carries the esteemed clientele indicating customers using the services of a company in getting and improving knowledge. Clients served are Nasdaq, Box, Eventbrite, Tata Consultancy Services, etc. Get a simple yet stunning designed Crash Couse Platform Investor Funding Presentation Esteemed Clientele Professional PDF. It is the best one to establish the tone in your meetings. It is an excellent way to make your presentations highly effective. So, download this PPT today from Slidegeeks and see the positive impacts. Our easy to edit Crash Couse Platform Investor Funding Presentation Esteemed Clientele Professional PDF can be your go to option for all upcoming conferences and meetings. So, what are you waiting for Grab this template today.
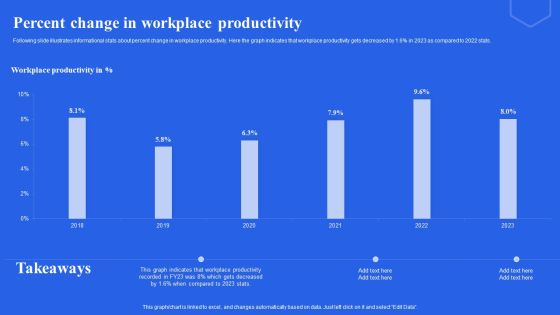
Percent Change In Workplace Productivity Ppt Pictures Slideshow PDF
Following slide illustrates informational stats about percent change in workplace productivity. Here the graph indicates that workplace productivity gets decreased by 1.6 percent in 2023 as compared to 2022 stats. Formulating a presentation can take up a lot of effort and time, so the content and message should always be the primary focus. The visuals of the PowerPoint can enhance the presenters message, so our Percent Change In Workplace Productivity Ppt Pictures Slideshow PDF was created to help save time. Instead of worrying about the design, the presenter can concentrate on the message while our designers work on creating the ideal templates for whatever situation is needed. Slidegeeks has experts for everything from amazing designs to valuable content, we have put everything into Percent Change In Workplace Productivity Ppt Pictures Slideshow PDF

Marketing Campaign Dashboard For B2B Marketers Ppt PowerPoint Presentation File Diagrams PDF
The following slide showcases key performance indicator KPI dashboard that can assist managers to evaluate digital marketing campaign performance. The key metrics mentioned in the slide are click-through-rate CTR, conversion rate, cost per click CPC, etc. Present like a pro with Marketing Campaign Dashboard For B2B Marketers Ppt PowerPoint Presentation File Diagrams PDF Create beautiful presentations together with your team, using our easy to use presentation slides. Share your ideas in real time and make changes on the fly by downloading our templates. So whether you are in the office, on the go, or in a remote location, you can stay in sync with your team and present your ideas with confidence. With Slidegeeks presentation got a whole lot easier. Grab these presentations today.
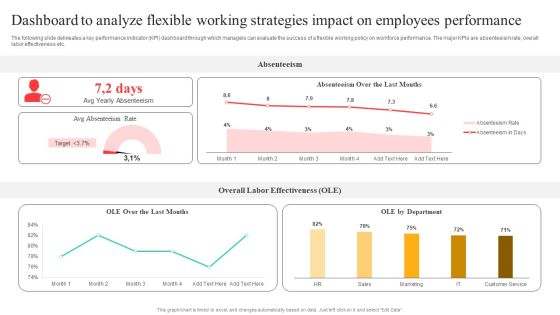
Flexible Working Policies And Guidelines Dashboard To Analyze Flexible Working Strategies Information PDF
The following slide delineates a key performance indicator KPI dashboard through which managers can evaluate the success of a flexible working policy on workforce performance. The major KPIs are absenteeism rate, overall labor effectiveness etc. Create an editable Flexible Working Policies And Guidelines Dashboard To Analyze Flexible Working Strategies Information PDF that communicates your idea and engages your audience. Whether youre presenting a business or an educational presentation, pre designed presentation templates help save time. Flexible Working Policies And Guidelines Dashboard To Analyze Flexible Working Strategies Information PDF is highly customizable and very easy to edit, covering many different styles from creative to business presentations. Slidegeeks has creative team members who have crafted amazing templates. So, go and get them without any delay.
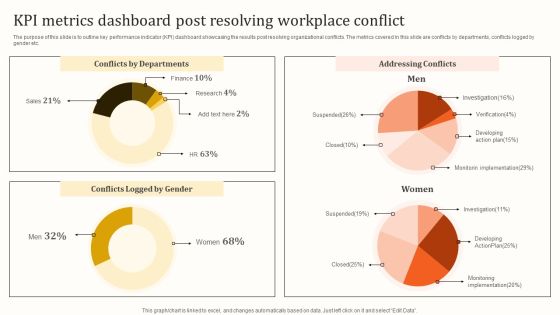
KPI Metrics Dashboard Post Resolving Workplace Conflict Template PDF
The purpose of this slide is to outline key performance indicator KPI dashboard showcasing the results post resolving organizational conflicts. The metrics covered in this slide are conflicts by departments, conflicts logged by gender etc. Presenting this PowerPoint presentation, titled KPI Metrics Dashboard Post Resolving Workplace Conflict Template PDF, with topics curated by our researchers after extensive research. This editable presentation is available for immediate download and provides attractive features when used. Download now and captivate your audience. Presenting this KPI Metrics Dashboard Post Resolving Workplace Conflict Template PDF. Our researchers have carefully researched and created these slides with all aspects taken into consideration. This is a completely customizable KPI Metrics Dashboard Post Resolving Workplace Conflict Template PDF that is available for immediate downloading. Download now and make an impact on your audience. Highlight the attractive features available with our PPTs.

Tactics For Establishing Sustainable Hybrid Work Environment Dashboard To Analyze Flexible Working Strategies Topics PDF
The following slide delineates a key performance indicator KPI dashboard through which managers can evaluate the success of a flexible working policy on workforce performance. The major KPIs are absenteeism rate, overall labor effectiveness etc. Boost your pitch with our creative Tactics For Establishing Sustainable Hybrid Work Environment Dashboard To Analyze Flexible Working Strategies Topics PDF. Deliver an awe-inspiring pitch that will mesmerize everyone. Using these presentation templates you will surely catch everyones attention. You can browse the ppts collection on our website. We have researchers who are experts at creating the right content for the templates. So you do not have to invest time in any additional work. Just grab the template now and use them.

Tactics For Establishing Sustainable Hybrid Work Environment Work From Home Performance Management Dashboard Information PDF
The following slide outlines a comprehensive key performance indicator KPI dashboard that can be used to showcase employees performance during work-from-home WFH. Information covered in this slide is related to average result area scores etc. Want to ace your presentation in front of a live audience Our Tactics For Establishing Sustainable Hybrid Work Environment Work From Home Performance Management Dashboard Information PDF can help you do that by engaging all the users towards you. Slidegeeks experts have put their efforts and expertise into creating these impeccable powerpoint presentations so that you can communicate your ideas clearly. Moreover, all the templates are customizable, and easy to edit and downloadable. Use these for both personal and commercial use.

Dashboard To Analyze Flexible Working Strategies Impact On Employees Performance Infographics PDF
The following slide delineates a key performance indicator KPI dashboard through which managers can evaluate the success of a flexible working policy on workforce performance. The major KPIs are absenteeism rate, overall labor effectiveness etc. Presenting this PowerPoint presentation, titled Dashboard To Analyze Flexible Working Strategies Impact On Employees Performance Infographics PDF, with topics curated by our researchers after extensive research. This editable presentation is available for immediate download and provides attractive features when used. Download now and captivate your audience. Presenting this Dashboard To Analyze Flexible Working Strategies Impact On Employees Performance Infographics PDF. Our researchers have carefully researched and created these slides with all aspects taken into consideration. This is a completely customizable Dashboard To Analyze Flexible Working Strategies Impact On Employees Performance Infographics PDF that is available for immediate downloading. Download now and make an impact on your audience. Highlight the attractive features available with our PPTs.

CYBER Security Breache Response Strategy Best Practices For Cybersecurity Incident Management Ideas PDF
This slide represents the impact of events which indicates that organizations data has been compromised for unlawful activities. It includes impact of cyber security events such as increased costs, operational disruption, reputational damage etc. Boost your pitch with our creative CYBER Security Breache Response Strategy Best Practices For Cybersecurity Incident Management Ideas PDF. Deliver an awe-inspiring pitch that will mesmerize everyone. Using these presentation templates you will surely catch everyones attention. You can browse the ppts collection on our website. We have researchers who are experts at creating the right content for the templates. So you do not have to invest time in any additional work. Just grab the template now and use them.

CYBER Security Breache Response Strategy Impact Of Cybersecurity Incidents On Organization Template PDF
This slide represents the impact of events which indicates that organizations data has been compromised for unlawful activities. It includes impact of cyber security events such as increased costs, operational disruption, reputational damage etc. Presenting this PowerPoint presentation, titled CYBER Security Breache Response Strategy Impact Of Cybersecurity Incidents On Organization Template PDF, with topics curated by our researchers after extensive research. This editable presentation is available for immediate download and provides attractive features when used. Download now and captivate your audience. Presenting this CYBER Security Breache Response Strategy Impact Of Cybersecurity Incidents On Organization Template PDF. Our researchers have carefully researched and created these slides with all aspects taken into consideration. This is a completely customizable CYBER Security Breache Response Strategy Impact Of Cybersecurity Incidents On Organization Template PDF that is available for immediate downloading. Download now and make an impact on your audience. Highlight the attractive features available with our PPTs.
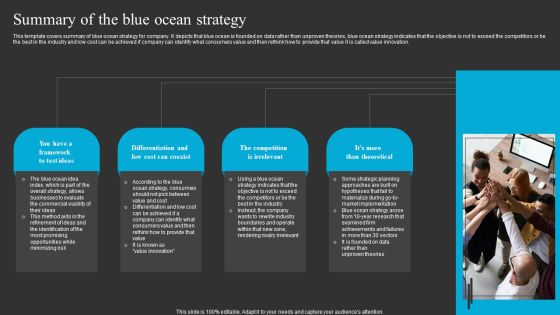
Summary Of The Blue Ocean Strategy Ppt Layouts Master Slide PDF
This template covers summary of blue ocean strategy for company. It depicts that blue ocean is founded on data rather than unproven theories, blue ocean strategy indicates that the objective is not to exceed the competitors or be the best in the industry and low cost can be achieved if company can identify what consumers value and then rethink how to provide that value it is called value innovation. Welcome to our selection of the Summary Of The Blue Ocean Strategy Ppt Layouts Master Slide PDF. These are designed to help you showcase your creativity and bring your sphere to life. Planning and Innovation are essential for any business that is just starting out. This collection contains the designs that you need for your everyday presentations. All of our PowerPoints are 100 percent editable, so you can customize them to suit your needs. This multi purpose template can be used in various situations. Grab these presentation templates today.

Blue Ocean Plan Of Tesla Summary Of The Blue Ocean Strategy Diagrams PDF
This template covers summary of blue ocean strategy for company. It depicts that blue ocean is founded on data rather than unproven theories, blue ocean strategy indicates that the objective is not to exceed the competitors or be the best in the industry and low cost can be achieved if company can identify what consumers value and then rethink how to provide that value it is called value innovation. Present like a pro with Blue Ocean Plan Of Tesla Summary Of The Blue Ocean Strategy Diagrams PDF Create beautiful presentations together with your team, using our easy to use presentation slides. Share your ideas in real time and make changes on the fly by downloading our templates. So whether you are in the office, on the go, or in a remote location, you can stay in sync with your team and present your ideas with confidence. With Slidegeeks presentation got a whole lot easier. Grab these presentations today.

Formulating Branding Strategy To Enhance Revenue And Sales Dashboard Showing Performance Of Various Graphics PDF
The following slide outlines the key performance indicator dashboard used by the organization to evaluate the effectiveness of multiple marketing campaigns. It provides information about total spending, impressions, acquisitions, cost per acquisition, clicks, etc. Create an editable Formulating Branding Strategy To Enhance Revenue And Sales Dashboard Showing Performance Of Various Graphics PDF that communicates your idea and engages your audience. Whether youre presenting a business or an educational presentation, pre designed presentation templates help save time. Formulating Branding Strategy To Enhance Revenue And Sales Dashboard Showing Performance Of Various Graphics PDF is highly customizable and very easy to edit, covering many different styles from creative to business presentations. Slidegeeks has creative team members who have crafted amazing templates. So, go and get them without any delay.
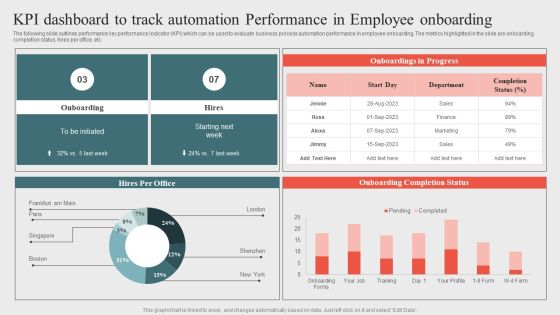
Kpi Dashboard To Track Automation Performanceoptimizing Business Processes Through Automation Summary PDF
The following slide outlines performance key performance indicator KPI which can be used to evaluate business process automation performance in employee onboarding. The metrics highlighted in the slide are onboarding completion status, hires per office, etc. Do you have to make sure that everyone on your team knows about any specific topic I yes, then you should give Kpi Dashboard To Track Automation Performanceoptimizing Business Processes Through Automation Summary PDF a try. Our experts have put a lot of knowledge and effort into creating this impeccable Kpi Dashboard To Track Automation Performanceoptimizing Business Processes Through Automation Summary PDF. You can use this template for your upcoming presentations, as the slides are perfect to represent even the tiniest detail. You can download these templates from the Slidegeeks website and these are easy to edit. So grab these today.

Performance Kpi Dashboard To Evaluate Social Mediaoptimizing Business Processes Through Automation Slides PDF
The following slide outlines key performance indicator KPI dashboard which can be used to track the social media marketing campaign performance, post implementing automation. It covers information about the social media followers, page impressions, Instagram overview, etc.Present like a pro with Performance Kpi Dashboard To Evaluate Social Mediaoptimizing Business Processes Through Automation Slides PDF Create beautiful presentations together with your team, using our easy to use presentation slides. Share your ideas in real time and make changes on the fly by downloading our templates. So whether you are in the office, on the go, or in a remote location, you can stay in sync with your team and present your ideas with confidence. With Slidegeeks presentation got a whole lot easier. Grab these presentations today.

Retail Ecommerce Merchandising Tactics For Boosting Revenue KPI Dashboard To Analyze In Store Merchandising Rules PDF
The following slide outlines a performance key performance indicator KPI dashboard used to evaluate the effectiveness of in-store merchandising strategy. The KPIs covered in the slide are total sales, average inventory, active stores, distinct products sold, etc. Crafting an eye catching presentation has never been more straightforward. Let your presentation shine with this tasteful yet straightforward Retail Ecommerce Merchandising Tactics For Boosting Revenue KPI Dashboard To Analyze In Store Merchandising Rules PDF template. It offers a minimalistic and classy look that is great for making a statement. The colors have been employed intelligently to add a bit of playfulness while still remaining professional. Construct the ideal Retail Ecommerce Merchandising Tactics For Boosting Revenue KPI Dashboard To Analyze In Store Merchandising Rules PDF that effortlessly grabs the attention of your audience. Begin now and be certain to wow your customers.

Brand Analytics Kpi Dashboard For Organization Ppt Portfolio Graphics Design PDF
The following slide outlines key performance indicator KPI dashboard that can assist marketers to evaluate brand performance on social media channels. The metrics covered are age group, gender, brand perception, branding themes, celebrity analysis, etc. Boost your pitch with our creative Brand Analytics Kpi Dashboard For Organization Ppt Portfolio Graphics Design PDF. Deliver an awe inspiring pitch that will mesmerize everyone. Using these presentation templates you will surely catch everyones attention. You can browse the ppts collection on our website. We have researchers who are experts at creating the right content for the templates. So you do not have to invest time in any additional work. Just grab the template now and use them.

KPI Dashboard To Analyze Performance Of Healthcare Financial Department Guidelines PDF
The following slide showcases key performance indicator KPI dashboard which can be used to analyze the financial performance of hospital. The metrics covered in the slide are net profit margin, income and expenses, etc. Retrieve professionally designed KPI Dashboard To Analyze Performance Of Healthcare Financial Department Guidelines PDF to effectively convey your message and captivate your listeners. Save time by selecting pre made slideshows that are appropriate for various topics, from business to educational purposes. These themes come in many different styles, from creative to corporate, and all of them are easily adjustable and can be edited quickly. Access them as PowerPoint templates or as Google Slides themes. You do not have to go on a hunt for the perfect presentation because Slidegeeks got you covered from everywhere.

KPI Metrics Dashboard To Measure Effectiveness Of Healthcare Recruitment Demonstration PDF
The following slide showcases key performance indicator KPI metrics dashboard which can be used to evaluate the success rate of healthcare recruitment. It covers information about technical and non-technical hiring, recruitment costs, current hiring pipeline etc. Slidegeeks has constructed KPI Metrics Dashboard To Measure Effectiveness Of Healthcare Recruitment Demonstration PDF after conducting extensive research and examination. These presentation templates are constantly being generated and modified based on user preferences and critiques from editors. Here, you will find the most attractive templates for a range of purposes while taking into account ratings and remarks from users regarding the content. This is an excellent jumping off point to explore our content and will give new users an insight into our top notch PowerPoint Templates.

Guide To Healthcare Services Administration KPI Dashboard To Analyze Performance Healthcare Financial Demonstration PDF
The following slide showcases key performance indicator KPI dashboard which can be used to analyze the financial performance of hospital. The metrics covered in the slide are net profit margin, income and expenses, etc. Here you can discover an assortment of the finest PowerPoint and Google Slides templates. With these templates, you can create presentations for a variety of purposes while simultaneously providing your audience with an eye catching visual experience. Download Guide To Healthcare Services Administration KPI Dashboard To Analyze Performance Healthcare Financial Demonstration PDF to deliver an impeccable presentation. These templates will make your job of preparing presentations much quicker, yet still, maintain a high level of quality. Slidegeeks has experienced researchers who prepare these templates and write high quality content for you. Later on, you can personalize the content by editing the Guide To Healthcare Services Administration KPI Dashboard To Analyze Performance Healthcare Financial Demonstration PDF.

Guide To Healthcare Services Administration KPI Metrics Dashboard To Measure Effectiveness Healthcare Information PDF
The following slide showcases key performance indicator KPI metrics dashboard which can be used to evaluate the success rate of healthcare recruitment. It covers information about technical and non-technical hiring, recruitment costs, current hiring pipeline etc. This Guide To Healthcare Services Administration KPI Metrics Dashboard To Measure Effectiveness Healthcare Information PDF from Slidegeeks makes it easy to present information on your topic with precision. It provides customization options, so you can make changes to the colors, design, graphics, or any other component to create a unique layout. It is also available for immediate download, so you can begin using it right away. Slidegeeks has done good research to ensure that you have everything you need to make your presentation stand out. Make a name out there for a brilliant performance.

KPI Metrics Dashboard Highlighting Employee Retention Rate Structure PDF
The purpose of this slide is to exhibit a key performance indicator KPI dashboard through which managers can analyze the monthly employee retention rate. The metrics covered in the slide are active employees, new candidates hired, internal, exit, employee turnover rate, etc. Do you have to make sure that everyone on your team knows about any specific topic I yes, then you should give KPI Metrics Dashboard Highlighting Employee Retention Rate Structure PDF a try. Our experts have put a lot of knowledge and effort into creating this impeccable KPI Metrics Dashboard Highlighting Employee Retention Rate Structure PDF. You can use this template for your upcoming presentations, as the slides are perfect to represent even the tiniest detail. You can download these templates from the Slidegeeks website and these are easy to edit. So grab these today.

Implementing Cyber Security Incident Impact Of Cybersecurity Incidents On Organization Graphics PDF
This slide represents the impact of events which indicates that organizations data has been compromised for unlawful activities. It includes impact of cyber security events such as increased costs, operational disruption, reputational damage etc. Get a simple yet stunning designed Implementing Cyber Security Incident Impact Of Cybersecurity Incidents On Organization Graphics PDF. It is the best one to establish the tone in your meetings. It is an excellent way to make your presentations highly effective. So, download this PPT today from Slidegeeks and see the positive impacts. Our easy to edit Implementing Cyber Security Incident Impact Of Cybersecurity Incidents On Organization Graphics PDF can be your go to option for all upcoming conferences and meetings. So, what are you waiting for Grab this template today.

5 Step Guide For Transitioning To Blue Ocean Strategy Summary Of The Blue Ocean Strategy Designs PDF
This template covers summary of blue ocean strategy for company. It depicts that blue ocean is founded on data rather than unproven theories, blue ocean strategy indicates that the objective is not to exceed the competitors or be the best in the industry and low cost can be achieved if company can identify what consumers value and then rethink how to provide that value it is called value innovation. There are so many reasons you need a 5 Step Guide For Transitioning To Blue Ocean Strategy Summary Of The Blue Ocean Strategy Designs PDF. The first reason is you can not spend time making everything from scratch, Thus, Slidegeeks has made presentation templates for you too. You can easily download these templates from our website easily.
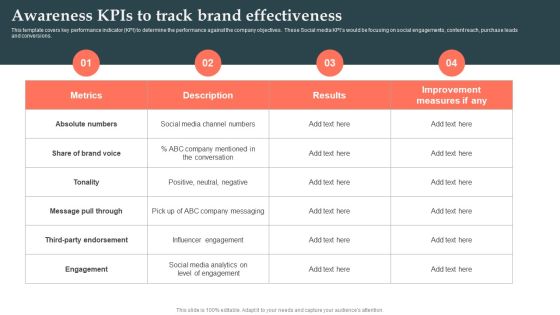
Product Launch Strategy Awareness Kpis To Track Brand Effectiveness Ppt Styles Inspiration PDF
This template covers key performance indicator KPI to determine the performance against the company objectives. These Social media KPIs would be focusing on social engagements, content reach, purchase leads and conversions. Here you can discover an assortment of the finest PowerPoint and Google Slides templates. With these templates, you can create presentations for a variety of purposes while simultaneously providing your audience with an eye catching visual experience. Download Product Launch Strategy Awareness Kpis To Track Brand Effectiveness Ppt Styles Inspiration PDF to deliver an impeccable presentation. These templates will make your job of preparing presentations much quicker, yet still, maintain a high level of quality. Slidegeeks has experienced researchers who prepare these templates and write high quality content for you. Later on, you can personalize the content by editing the Product Launch Strategy Awareness Kpis To Track Brand Effectiveness Ppt Styles Inspiration PDF.
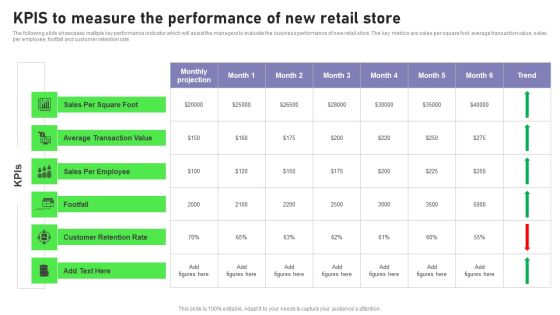
Retail Outlet Opening To Enhance Product Sale Kpis To Measure The Performance Infographics PDF
The following slide showcases multiple key performance indicator which will assist the managers to evaluate the business performance of new retail store. The key metrics are sales per square foot, average transaction value, sales per employee, footfall and customer retention rate. Slidegeeks is here to make your presentations a breeze with Retail Outlet Opening To Enhance Product Sale Kpis To Measure The Performance Infographics PDF With our easy to use and customizable templates, you can focus on delivering your ideas rather than worrying about formatting. With a variety of designs to choose from, you are sure to find one that suits your needs. And with animations and unique photos, illustrations, and fonts, you can make your presentation pop. So whether you are giving a sales pitch or presenting to the board, make sure to check out Slidegeeks first.

KPI Dashboard To Evaluate Sales Performance Template PDF
The following slide outlines key performance indicator KPI dashboard to monitor sales performance of company. The key metrics covered in slide are total sales by location, monthly sales trend, average revenue AR by clients, etc. Welcome to our selection of the KPI Dashboard To Evaluate Sales Performance Template PDF. These are designed to help you showcase your creativity and bring your sphere to life. Planning and Innovation are essential for any business that is just starting out. This collection contains the designs that you need for your everyday presentations. All of our PowerPoints are 100 percent editable, so you can customize them to suit your needs. This multi-purpose template can be used in various situations. Grab these presentation templates today

Performance Dashboard To Measure Marketing Campaign Performance Brochure PDF
The following slide outlines key performance indicator KPI dashboard that can assist digital marketers to evaluate marketing campaign performance. The success metrics outlined in slide are total spend on advertisement, cost per thousand CPM, cost per click CPC, click-through rate CTR, etc. Want to ace your presentation in front of a live audience Our Performance Dashboard To Measure Marketing Campaign Performance Brochure PDF can help you do that by engaging all the users towards you.. Slidegeeks experts have put their efforts and expertise into creating these impeccable powerpoint presentations so that you can communicate your ideas clearly. Moreover, all the templates are customizable, and easy-to-edit and downloadable. Use these for both personal and commercial use.
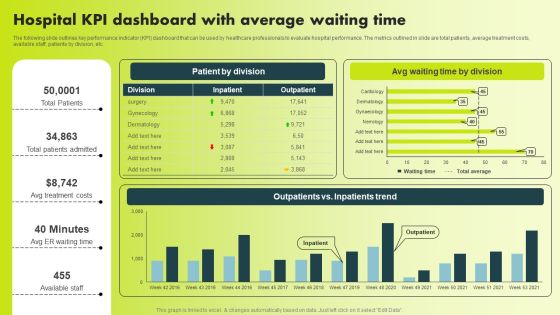
Hospital KPI Dashboard With Average Waiting Time Background PDF
The following slide outlines key performance indicator KPI dashboard that can be used by healthcare professionals to evaluate hospital performance. The metrics outlined in slide are total patients, average treatment costs, available staff, patients by division, etc. Slidegeeks is one of the best resources for PowerPoint templates. You can download easily and regulate Hospital KPI Dashboard With Average Waiting Time Background PDF for your personal presentations from our wonderful collection. A few clicks is all it takes to discover and get the most relevant and appropriate templates. Use our Templates to add a unique zing and appeal to your presentation and meetings. All the slides are easy to edit and you can use them even for advertisement purposes.

KPI Dashboard To Monitor Facebook Marketing Strategy Performance Demonstration PDF
The following slide outlines key performance indicator KPI dashboard which can be used to evaluate Facebook advertisement performance. The metrics mentioned in slide are total fans, page views, total actions, post likes, audience growth, fans by language, etc. Slidegeeks is here to make your presentations a breeze with KPI Dashboard To Monitor Facebook Marketing Strategy Performance Demonstration PDF With our easy to use and customizable templates, you can focus on delivering your ideas rather than worrying about formatting. With a variety of designs to choose from, you are sure to find one that suits your needs. And with animations and unique photos, illustrations, and fonts, you can make your presentation pop. So whether you are giving a sales pitch or presenting to the board, make sure to check out Slidegeeks first.

11 Diverging Arrows Multilple Concepts Diagram Circular Network PowerPoint Slides
We present our 11 diverging arrows multilple concepts diagram Circular Network PowerPoint Slides.Download and present our Signs PowerPoint Templates because our template will help pinpoint their viability. Download and present our Future PowerPoint Templates because the Venn graphic comprising interlinking circles geometrically demonstate how various functions operating independantly, to a large extent, are essentially interdependant. Download our Ring Charts PowerPoint Templates because they are Designed to attract the attention of your audience. Download our Business PowerPoint Templates because you are sure you have the right people for your plans. Download and present our Marketing PowerPoint Templates because customer satisfaction is a mantra of the marketplace. Building a loyal client base is an essential element of your business.Use these PowerPoint slides for presentations relating to Direction, flow, gradient, green,illustration, indicator, isolated, link, loop,mix, motion, movement, multicolored,orange, paint, pattern, pointer, purple,rainbow, range, recycling, rob, ring, rotation, round, sign, six, spectrum, spin, symbol,. The prominent colors used in the PowerPoint template are Green lime , Gray, Black. You can be sure our 11 diverging arrows multilple concepts diagram Circular Network PowerPoint Slides are Second to none. Professionals tell us our isolated PowerPoint templates and PPT Slides are Endearing. PowerPoint presentation experts tell us our 11 diverging arrows multilple concepts diagram Circular Network PowerPoint Slides are Beautiful. You can be sure our indicator PowerPoint templates and PPT Slides are Bold. You can be sure our 11 diverging arrows multilple concepts diagram Circular Network PowerPoint Slides are Appealing. The feedback we get is that our link PowerPoint templates and PPT Slides are Colorful.
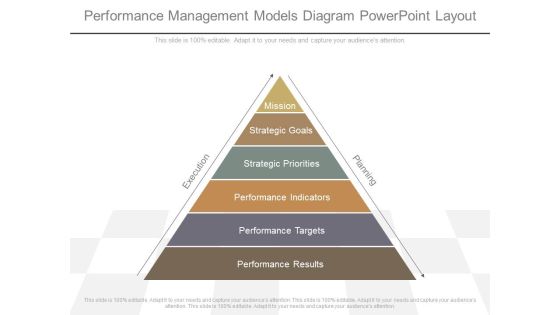
Performance Management Models Diagram Powerpoint Layout
This is a performance management models diagram powerpoint layout. This is a six stage process. The stages in this process are mission, strategic goals, strategic priorities, performance indicators, performance targets, performance results, execution, planning.
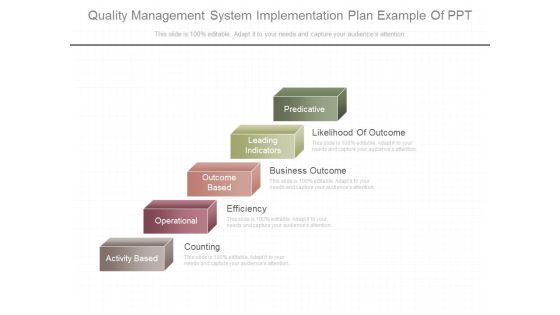
Quality Management System Implementation Plan Example Of Ppt
This is a quality management system implementation plan example of ppt. This is a four stage process. The stages in this process are predicative, leading indicators, outcome based, operational, activity based, likelihood of outcome, business outcome, efficiency, counting.

Strategies To Conduct Business Smoothly Ppt Slide Examples
This is a strategies to conduct business smoothly ppt slide examples. This is a five stage process. The stages in this process are activity based, operational, outcome based, leading indicators, predictive, counting, efficiency, business outcome, likelihood of outcome.
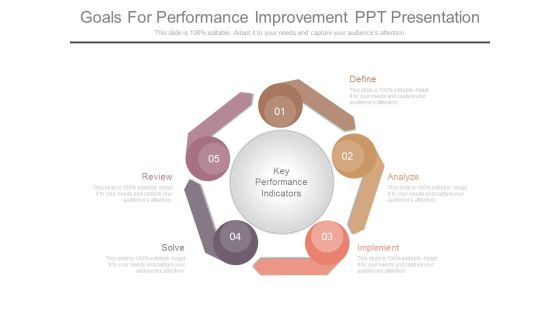
Goals For Performance Improvement Ppt Presentation
This is a goals for performance improvement ppt presentation. This is a five stage process. The stages in this process are key performance indicators, define, analyze, implement, solve, review.
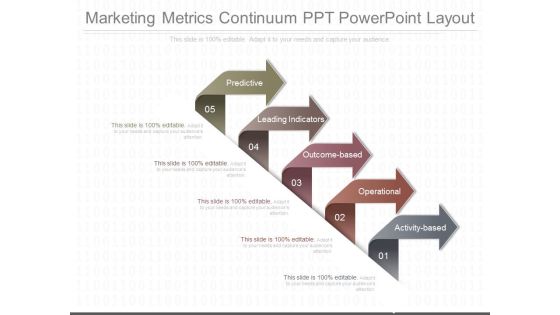
Marketing Metrics Continuum Ppt Powerpoint Layout
This is a marketing metrics continuum ppt powerpoint layout. This is a five stage process. The stages in this process are predictive, leading indicators, outcome based, operational, activity based.

Improvement Tips For Email Marketing Sample Diagram Ppt Slide
This is a improvement tips for email marketing sample diagram ppt slide. This is a five stage process. The stages in this process are activity based, operational, outcome based, leading indicators, predictive.

B2b Email Marketing Tips Diagram Ppt Sample
This is a b2b email marketing tips diagram ppt sample. This is a five stage process. The stages in this process are predictive, leading indicators, outcome based, operational, activity based.

Capital Markets Dashboard Ppt Powerpoint Slide Background
This is a capital markets dashboard ppt powerpoint slide background. This is a three stage process. The stages in this process are weekly sales, product inventory, key performance indicators.

Master Plan Strategy Development Diagram Ppt Background Images
This is a master plan strategy development diagram ppt background images. This is a six stage process. The stages in this process are define, explore, create, research the driving forces, monitor indicators, create scenarios.
Vendor Project Scorecard Chart Ppt Images Gallery
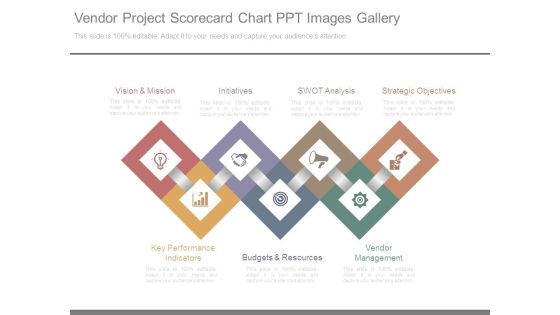
This is a vendor project scorecard chart ppt images gallery. This is a seven stage process. The stages in this process are vision and mission, initiatives, swot analysis, strategic objectives, vendor management, budgets and resources, key performance indicators.
Plot Strategic Model Ppt Diagram Powerpoint Slide Deck Samples
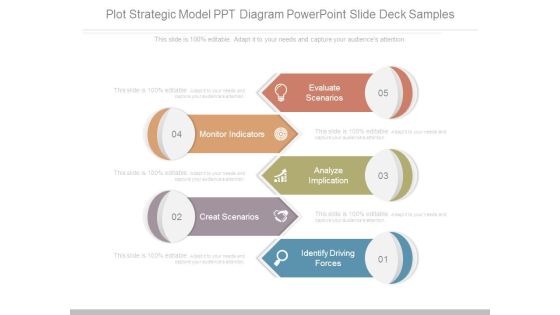
This is a plot strategic model ppt diagram powerpoint slide deck samples. This is a five stage process. The stages in this process are evaluate scenarios, monitor indicators, analyze implication, create scenarios, identify driving forces.
Global Marketing Trends Diagram Ppt Presentation Examples
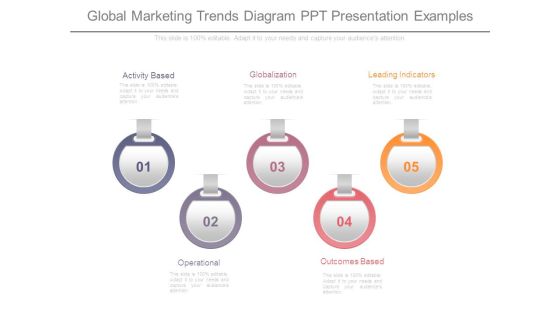
This is a global marketing trends diagram ppt presentation examples. This is a five stage process. The stages in this process are activity based, globalization, leading indicators, outcomes based, operational.

Business Development Planning Template Ppt Slide
This is a business development planning template ppt slide. This is a six stage process. The stages in this process are data profiles, workshop, phased plan, key indicators, concept model, business priorities.
Performance Management Through Diagram Balanced Scorecard
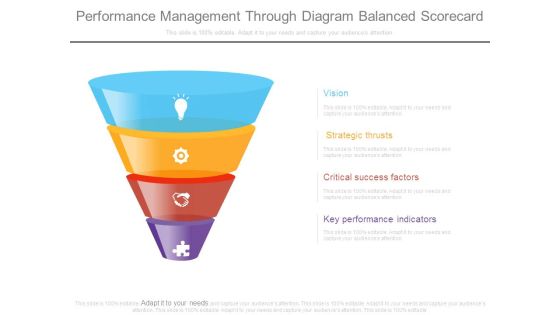
This is a performance management through diagram balanced scorecard. This is a four stage process. The stages in this process are vision, strategic thrusts, critical success factors, key performance indicators.
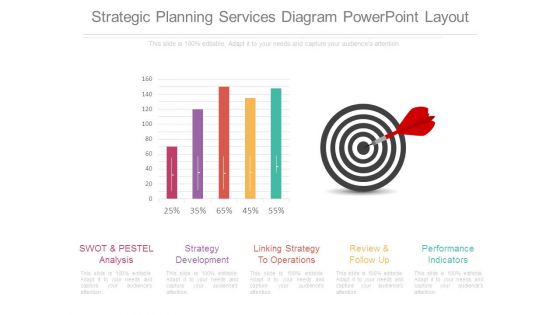
Strategic Planning Services Diagram Powerpoint Layout
This is a strategic planning services diagram powerpoint layout. This is a five stage process. The stages in this process are swot and pestel analysis, strategy development, linking strategy to operations, review and follow up, performance indicators.

Evaluating The Rough Research Ppt PowerPoint Presentation Show
This is a evaluating the rough research ppt powerpoint presentation show. This is a two stage process. The stages in this process are overall project performance, product need, threat from competitors, feasibility, key performance indicators.
