Increased Profits
Financial Projections Income Statement Ppt PowerPoint Presentation Infographic Template Icon
This is a financial projections income statement ppt powerpoint presentation infographic template icon. This is a eleven stage process. The stages in this process are expenses, total sales, other expenses, profit after tax, net sales.

Business Model Canvas Template 1 Ppt PowerPoint Presentation Summary Example
This is a business model canvas template 1 ppt powerpoint presentation summary example. This is a three stage process. The stages in this process are business model, unique value proposition, profit models, graceful exit.

Business Model Example Slide Ppt PowerPoint Presentation Styles Slides
This is a business model example slide ppt powerpoint presentation styles slides. This is a four stage process. The stages in this process are large expected user base, high quality user data, premium targeted ads, high profit potential.

Matrix Showing Business Sales Analysis Ppt PowerPoint Presentation Introduction
This is a matrix showing business sales analysis ppt powerpoint presentation introduction. This is a four stage process. The stages in this process are profit impact, low, supply risk, high, high.

Business Model Template Ppt PowerPoint Presentation Infographic Template Graphics Design
This is a business model template ppt powerpoint presentation infographic template graphics design. This is a four stage process. The stages in this process are offering, monetization, sustainability, market attractiveness, profit model.

Business Model Template 1 Ppt PowerPoint Presentation Ideas Objects
This is a business model template 1 ppt powerpoint presentation ideas objects. This is a three stage process. The stages in this process are offering, monetization, sustainability market attractiveness, profit model.

Market And Customer Segmentation Ppt Images
This is a market and customer segmentation ppt images. This is a four stage process. The stages in this process are market and customer segmentation, identification of profit pools, brand positioning and development, customer solution pricing.

Business Model Ppt PowerPoint Presentation Portfolio File Formats
This is a business model ppt powerpoint presentation portfolio file formats. This is a four stage process. The stages in this process are future potential, high quality user data, premium targeted ads, high profit potential.

Circle Diagram For Business Marketing Mix Powerpoint Slides
This PowerPoint template has been designed with nine steps circle chart. This PPT slide can be used to prepare presentations for profit growth report and also for financial data analysis. You can download finance PowerPoint template to prepare awesome presentations.

Sales Revenue Product Ppt PowerPoint Presentation Infographic Template Backgrounds
This is a sales revenue product ppt powerpoint presentation infographic template backgrounds. This is a three stage process. The stages in this process are product wise revenue, profit percent of total revenue, total income product.
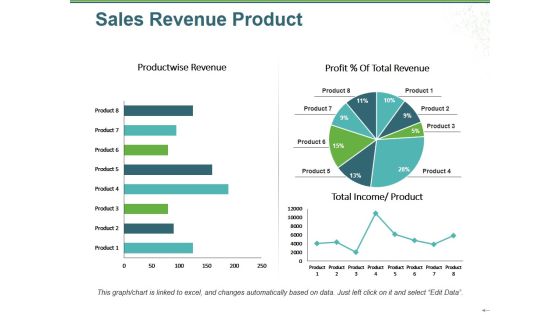
Sales Revenue Product Ppt PowerPoint Presentation Infographic Template Infographic Template
This is a sales revenue product ppt powerpoint presentation infographic template infographic template. This is a three stage process. The stages in this process are product wise revenue, total income, product, profit total revenue, pie.

Technological Advantage Ppt Slides Examples
This is a technological advantage ppt slides examples. This is a four stage process. The stages in this process are exclusive information, profit advantage, technological advantage, unique product, exclusive information.
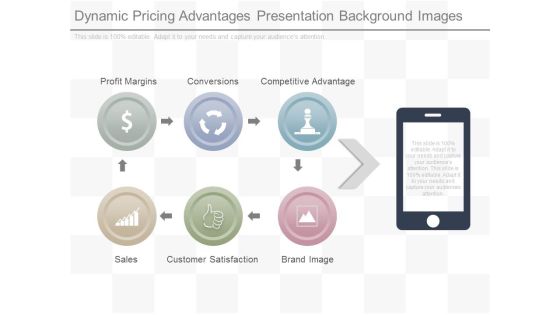
Dynamic Pricing Advantages Presentation Background Images
This is a dynamic pricing advantages presentation background images. This is a six stage process. The stages in this process are profit margins, conversions, competitive advantage, sales, customer satisfaction, brand image.
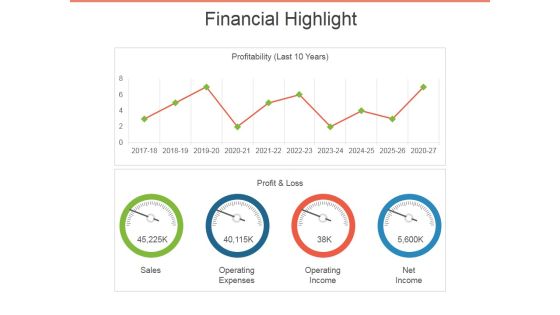
Financial Highlight Template 2 Ppt PowerPoint Presentation Outline Visuals
This is a financial highlight template 2 ppt powerpoint presentation outline visuals. This is a two stage process. The stages in this process are sales, profit and loss, operating expenses, operating income, net income.

Monetary Benefits Ppt PowerPoint Presentation Clipart
This is a monetary benefits ppt powerpoint presentation clipart. This is a six stage process. The stages in this process are salary, bonuses, stock options, profit sharing plans, pension schemes.
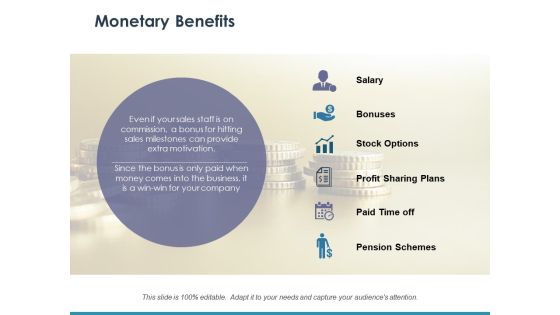
Monetary Benefits Ppt PowerPoint Presentation Slides Information
This is a monetary benefits ppt powerpoint presentation slides information. This is a six stage process. The stages in this process are salary, bonuses, stock options, profit sharing plans, paid time off.
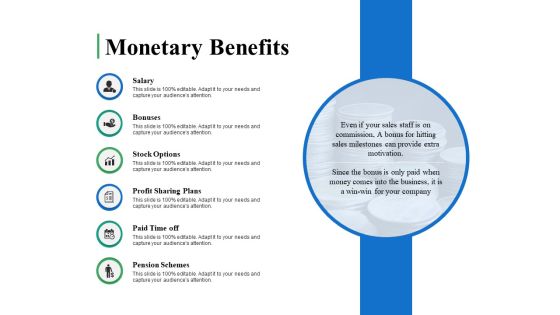
Monetary Benefits Ppt PowerPoint Presentation Summary Ideas
This is a monetary benefits ppt powerpoint presentation summary ideas. This is a six stage process. The stages in this process are salary, bonuses, stock options, profit sharing plans, pension schemes.
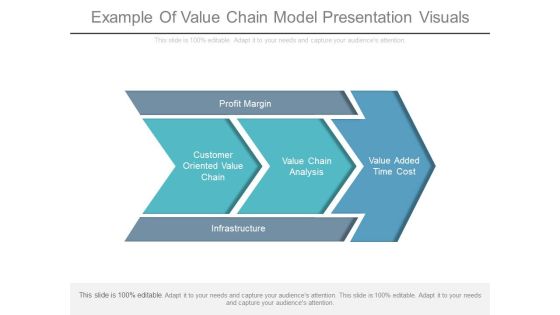
Example Of Value Chain Model Presentation Visuals
This is a example of value chain model presentation visuals. This is a five stage process. The stages in this process are profit margin, customer oriented value chain, value chain analysis, value added time cost, infrastructure.

Monetary Benefits Ppt PowerPoint Presentation Ideas Design Inspiration
This is a monetary benefits ppt powerpoint presentation ideas design inspiration. This is a six stage process. The stages in this process are salary, bonuses, stoke options, profit sharing plans, paid time off.
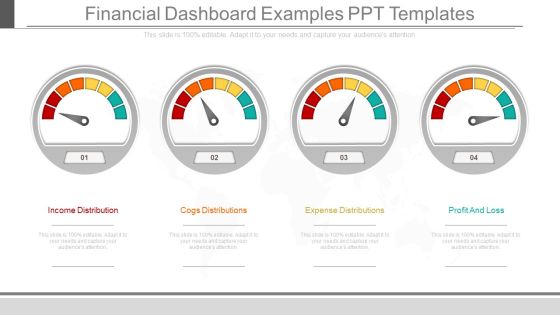
Financial Dashboard Examples Ppt Templates
This is a financial dashboard examples ppt templates. This is a four stage process. The stages in this process are income distribution, cogs distributions, expense distributions, profit and loss.
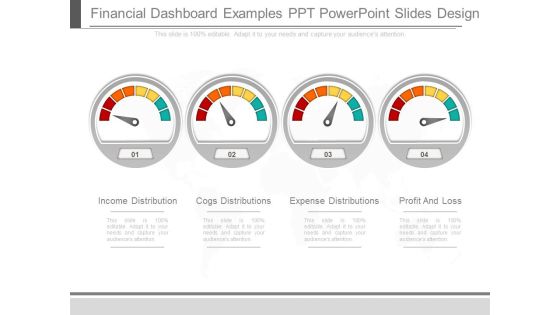
Financial Dashboard Examples Ppt Powerpoint Slides Design
This is a financial dashboard examples ppt powerpoint slides design. This is a four stage process. The stages in this process are income distribution, cogs distributions, expense distributions, profit and loss.

Pandl Kpis Ppt PowerPoint Presentation Gallery Display
This is a pandl kpis ppt powerpoint presentation gallery display. This is a four stage process. The stages in this process are net sales, total income, expenses, ebitda, profit after tax.
P And L Kpis Template 1 Ppt PowerPoint Presentation Icon Graphics Download
This is a p and l kpis template 1 ppt powerpoint presentation icon graphics download. This is a four stage process. The stages in this process are net sales, total income, expenses, financing cost, profit after tax.
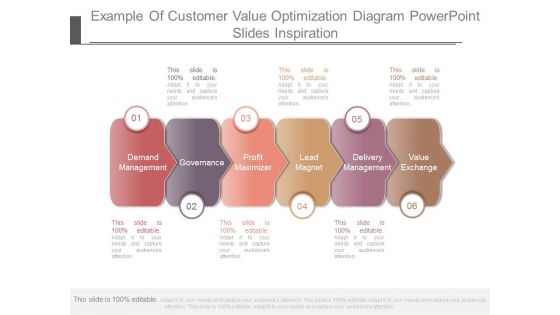
Example Of Customer Value Optimization Diagram Powerpoint Slides Inspiration
This is a example of customer value optimization diagram powerpoint slides inspiration. This is a six stage process. The stages in this process are demand management, governance, profit maximizer, lead magnet, delivery management, value exchange.
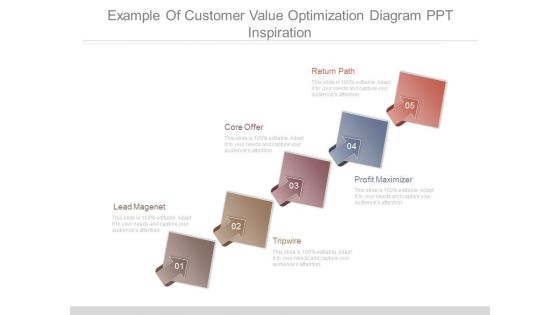
Example Of Customer Value Optimization Diagram Ppt Inspiration
This is a example of customer value optimization diagram ppt inspiration. This is a five stage process. The stages in this process are lead magnet, core offer, return path, tripwire, profit maximizer.

Value Based Pricing Example Example Of Ppt Presentation
This is a value based pricing example example of ppt presentation. This is a five stage process. The stages in this process are demand, sales, brand image, profit margins, conversions.
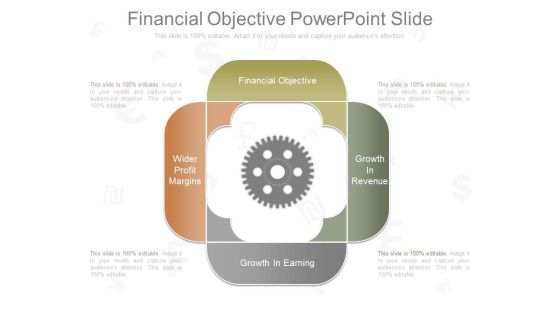
Financial Objective Powerpoint Slide
This is a financial objective powerpoint slide. This is a four stage process. The stages in this process are financial objective, growth in revenue, growth in earning, wider profit margins.

Revenue Of ADC Cosmetics Company For Past 5 Years Structure PDF
This slide shows decline in Revenue of ADC Cosmetics Company. This decline is due to Fall in Profit Margin, Lack of Personalized Customer Experience, Use of Outdated Trends etc. Deliver an awe-inspiring pitch with this creative revenue of adc cosmetics company for past 5 years structure pdf bundle. Topics like revenue, profit margin, customer experience can be discussed with this completely editable template. It is available for immediate download depending on the needs and requirements of the user.

Internet Marketing Objectives Ppt PowerPoint Presentation Summary Portrait
This is a internet marketing objectives ppt powerpoint presentation summary portrait. This is a six stage process. The stages in this process are sales revenue, profit margins, product types, repeat sales, sales leads, web visitors.

Revolut Capital Funding Projections For Future And Our Ask For Revolut Pitch Deck Ppt Pictures PDF
Purpose of the following slide is to show the investment ask for Revolut pitch deck as it displays the key financials projections for the next 5 years, as it displays key metrics such as key summary data, gross revenues, Gross profit and net profit. Purpose of the following slide is to show the investment ask for Revolut pitch deck as it displays the key financials projections for the next 5 years, as it displays key metrics such as key summary data, gross revenues, Gross profit and net profit. Deliver and pitch your topic in the best possible manner with this Revolut Capital Funding Projections For Future And Our Ask For Revolut Pitch Deck Ppt Pictures PDF. Use them to share invaluable insights on Key Summary Data, Gross Revenue, Transaction Costs and impress your audience. This template can be altered and modified as per your expectations. So, grab it now.

Line Chart Ppt PowerPoint Presentation Summary Information
This is a line chart ppt powerpoint presentation summary information. This is a two stage process. The stages in this process are business, strategy, marketing, analysis, profit million dollars.

Scatter With Smooth Lines And Markers Ppt PowerPoint Presentation Show Template
This is a scatter with smooth lines and markers ppt powerpoint presentation show template. This is a nine stage process. The stages in this process are business, strategy, marketing, success, dollar in billions, profit in thousands.

Financial Projections Pandl Ppt PowerPoint Presentation File Example File
This is a financial projections pandl ppt powerpoint presentation file example file. This is a four stage process. The stages in this process are net sales, expenses, ebitda, profit after tax, business.
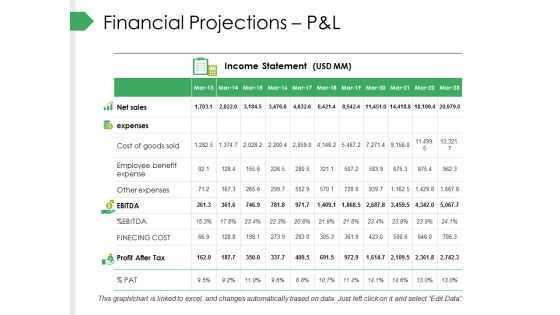
Financial Projections Pandl Ppt PowerPoint Presentation Visual Aids Professional
This is a financial projections pandl ppt powerpoint presentation visual aids professional. This is a four stage process. The stages in this process are net sales, expenses, ebitda, profit after tax, business.

Stock Photo 3d Blue Glossy Dices Strategy PowerPoint Slide
Our above image slide has been designed with 3d blue glossy dices. This slide contains the concept of gaming and gambling. This PowerPoint slide can be used for various topics business strategy, success. Profit etc.

Cost Per Employee Ppt PowerPoint Presentation Model Graphics Download
This is a cost per employee ppt powerpoint presentation model graphics download. This is a six stage process. The stages in this process are average profit per employee, line chart, business, marketing, management.
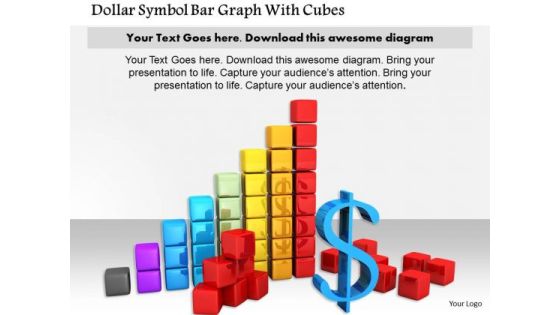
Stock Photo Dollar Symbol Bar Graph With Cubes PowerPoint Slide
This image slide contains bar graph of cubes with dollar symbol. This image is designed with dollar growth graph. Use this slide to display growth of profit in business presentations. Make an impressive presentation by using this image.

Sample Marketing Consumer Goods Ppt Presentation
This is a sample marketing consumer goods ppt presentation. This is a six stage process. The stages in this process are industrial goods, service goods, international marketing, business marketing, non profit marketing, consumer goods.

Unalive Bonus Powerpoint Slide Background Designs
This is a unalive bonus powerpoint slide background designs. This is a four stage process. The stages in this process are unalive bonus, profit sharing, business builder bonus, achiever incentives.

Competitor Analysis Template Ppt PowerPoint Presentation Pictures Graphics Template
This is a competitor analysis template ppt powerpoint presentation pictures graphics template. This is a four stage process. The stages in this process are business, strategy, marketing, planning, net profit margin.
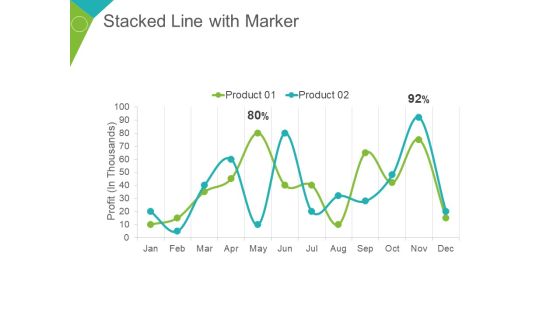
Stacked Line With Marker Ppt PowerPoint Presentation Summary Demonstration
This is a stacked line with marker ppt powerpoint presentation summary demonstration. This is a two stage process. The stages in this process are profit in thousands, product, percentage, finance, business.

Combo Chart Ppt PowerPoint Presentation Infographics Introduction
This is a combo chart ppt powerpoint presentation infographics introduction. This is a three stage process. The stages in this process are profit in percentage, business, graph, strategy, product.

Clustered Column Ppt PowerPoint Presentation Professional Graphic Tips
This is a clustered column ppt powerpoint presentation professional graphic tips. This is a two stage process. The stages in this process are product, profit in percentage, graph, business, marketing.
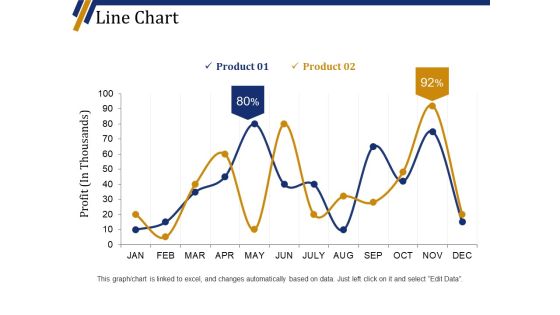
Line Chart Ppt PowerPoint Presentation Portfolio Background Designs
This is a line chart ppt powerpoint presentation portfolio background designs. This is a two stage process. The stages in this process are product, business, finance, marketing, profit in thousands.

Scatter Chart Ppt PowerPoint Presentation Summary Visuals
This is a scatter chart ppt powerpoint presentation summary visuals. This is a eight stage process. The stages in this process are product, profit in sales, in percentage, finance, business.

Stacked Column Ppt PowerPoint Presentation Professional Template
This is a stacked column ppt powerpoint presentation professional template. This is a nine stage process. The stages in this process are product, profit million dollars, business, marketing, graph.

Stacked Line With Marker Ppt PowerPoint Presentation Professional Pictures
This is a stacked line with marker ppt powerpoint presentation professional pictures. This is a twelve stage process. The stages in this process are product, profit in thousands, business, graph, marketing.

Area Chart Ppt PowerPoint Presentation Model Examples
This is a area chart ppt powerpoint presentation model examples. This is a two stage process. The stages in this process are year profit in dollars, business, strategy, growth.

Clustered Column Ppt PowerPoint Presentation Inspiration Shapes
This is a clustered column ppt powerpoint presentation inspiration shapes. This is a two stage process. The stages in this process are profit in percentage, business, marketing, graph, finance.
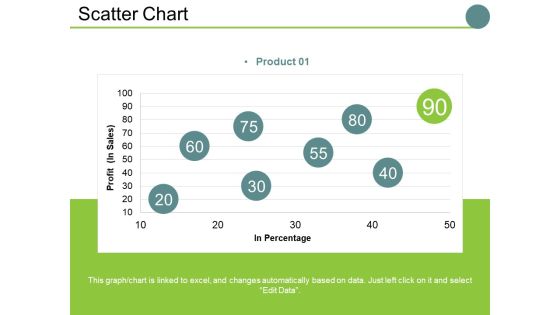
Scatter Chart Ppt PowerPoint Presentation Slides Examples
This is a scatter chart ppt powerpoint presentation slides examples. This is a one stage process. The stages in this process are profit , in percentage, business, marketing, finance, graph.

Competitor Analysis Template 4 Ppt PowerPoint Presentation Gallery Design Templates
This is a competitor analysis template 4 ppt powerpoint presentation gallery design templates. This is a four stage process. The stages in this process are business, marketing, analysis, graph, net profit margin.
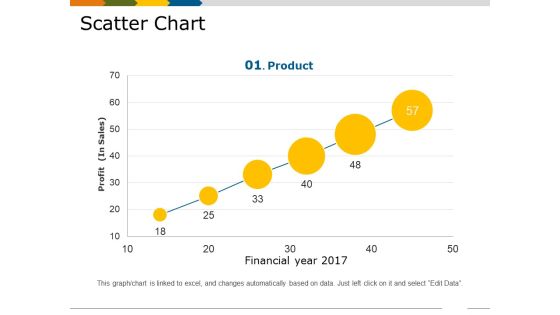
Scatter Chart Template 1 Ppt PowerPoint Presentation Show Slides
This is a scatter chart template 1 ppt powerpoint presentation show slides. This is a six stage process. The stages in this process are financial year, profit in sales, growth, business, marketing, product.
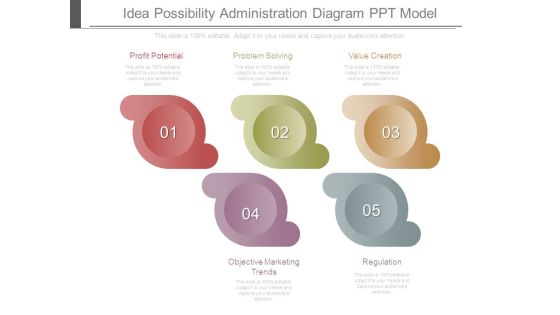
Idea Possibility Administration Diagram Ppt Model
This is a idea possibility administration diagram ppt model. This is a five stage process. The stages in this process are profit potential, problem solving, value creation, objective marketing trends, regulation.

Annual Planning Calendar Diagram Powerpoint Guide
This is a annual planning calendar diagram powerpoint guide. This is a six stage process. The stages in this process are strategic management model, managing profit and performance, product service, values mission vision, external environment, financial objectives.

Pricing Objectives Diagram Sample Of Ppt Presentation
This is a pricing objectives diagram sample of ppt presentation. This is a seven stage process. The stages in this process are pricing objectives, revenue maximization, profit maximization, partial cost recovery, survival, status quo, quantity leader, maximize quantity.
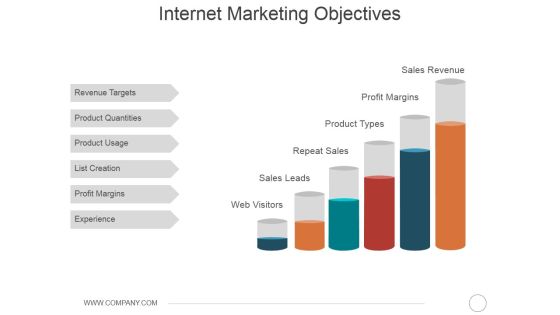
Internet Marketing Objectives Ppt PowerPoint Presentation Portfolio Summary
This is a internet marketing objectives ppt powerpoint presentation portfolio summary. This is a six stage process. The stages in this process are revenue targets, product quantities, product usage, list creation, profit margins, experience.

Internet Marketing Objectives Ppt PowerPoint Presentation Layouts Smartart
This is a internet marketing objectives ppt powerpoint presentation layouts smartart. This is a six stage process. The stages in this process are sales leads, product types, sales revenue, profit margins, repeat sales, web visitors.

Organization Strategy Diagram Ppt Slides Download
This is a organization strategy diagram ppt slides download. This is a six stage process. The stages in this process are profit formula, customer value proposition, situation analysis, deriving strategies, monitor and control, problem identification.

Competitor Analysis Template 3 Ppt PowerPoint Presentation Ideas Graphic Tips
This is a competitor analysis template 3 ppt powerpoint presentation ideas graphic tips. This is a four stage process. The stages in this process are net profit margin, your company, competitor.

Balance Sheet Kpis Tabular Form Template 2 Ppt PowerPoint Presentation Summary Structure
This is a balance sheet kpis tabular form template 2 ppt powerpoint presentation summary structure. This is a four stage process. The stages in this process are net sales, expenses, ebitda, profit after tax, finecing cost.

Stock Photo Stacks Of Dollar Coins PowerPoint Slide
This image contains stack of dollar coins. Use this image in finance and money related topics. Pass your ideas through this image slide in relation to profit growth. It will amplify your brilliance.

Bar Graph For Marketing Research Data Powerpoint Slides
This PowerPoint template has been designed with diagram of bar graph. This PPT slide can be used to prepare presentations for profit growth report and also for financial data analysis. You can download finance PowerPoint template to prepare awesome presentations.

Bar Graph For Marketing Research Process Powerpoint Slides
This PowerPoint template has been designed with diagram of bar graph. This PPT slide can be used to prepare presentations for profit growth report and also for financial data analysis. You can download finance PowerPoint template to prepare awesome presentations.

Pie Charts For Financial Ratio Analysis Powerpoint Slides
This PowerPoint template has been designed with diagram of pie charts. This PPT slide can be used to prepare presentations for profit growth report and also for financial data analysis. You can download finance PowerPoint template to prepare awesome presentations.
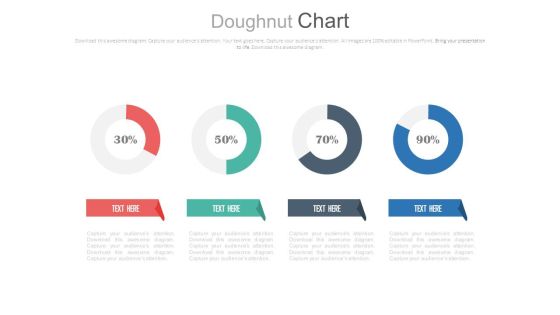
Four Circle Chart With Percentage Ratios Powerpoint Slides
This PowerPoint template has been designed with graphics of four circles and percentage ratios. You may use this dashboard slide design for topics like profit growth and financial planning. This PPT slide is powerful tool to describe your ideas.

Linear Circles Percentage Analysis Charts Powerpoint Slides
This PowerPoint template has been designed with graphics of three circles and percentage ratios. You may use this dashboard slide design for topics like profit growth and financial planning. This PPT slide is powerful tool to describe your ideas.
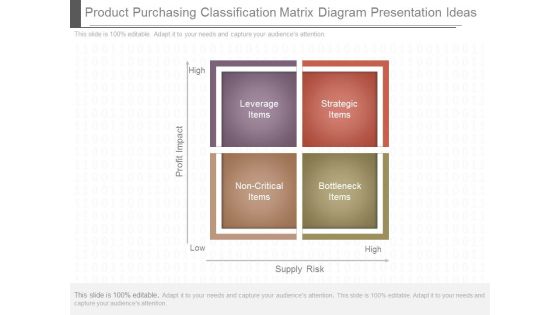
Product Purchasing Classification Matrix Diagram Presentation Ideas
This is a product purchasing classification matrix diagram presentation ideas. This is a four stage process. The stages in this process are leverage items, strategic items, bottleneck items, non critical items, high, low, profit impact, supply risk.

Product Purchasing Classification Matrix Diagram Ppt Example
This is a product purchasing classification matrix diagram ppt example. This is a four stage process. The stages in this process are profit impact, supply risk, leverage items, non critical items, bottleneck items, strategic items.
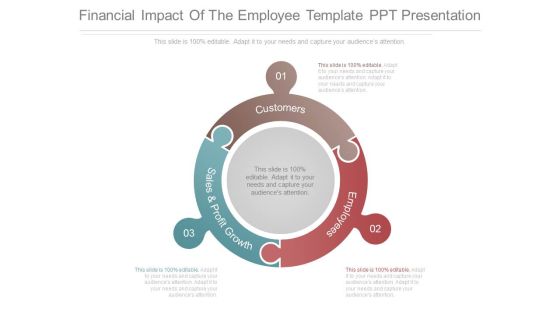
Financial Impact Of The Employee Template Ppt Presentation
This is a financial impact of the employee template ppt presentation. This is a three stage process. The stages in this process are customers, employees, sales and profit growth.

Decision Making For Risk Management Diagram Ppt Sample
This is a decision making for risk management diagram ppt sample. This is a four stage process. The stages in this process are uncertainty, return on capital shareholder focus, profit volatility shareholder focus, required capital policyholder focus.

Financial Plan Powerpoint Presentation Templates
This is a financial plan powerpoint presentation templates. This is a four stage process. The stages in this process are financial plan, profit and loss forecast, action plan, enterprise mobility.

Sales Metrics And Kpi Examples Presentation Slides
This is a sales metrics and kpi examples presentation slides. This is a five stage process. The stages in this process are sales growth, sales opportunities, product performance, average profit margin, sales target.
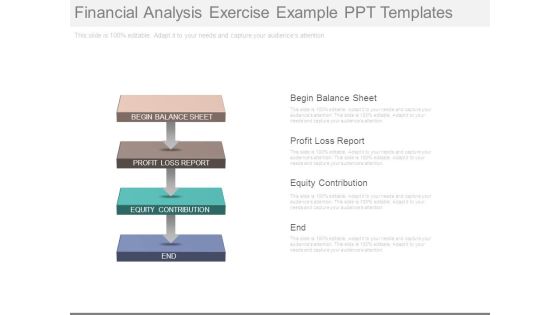
Financial Analysis Exercise Example Ppt Templates
This is a financial analysis exercise example ppt templates. This is a four stage process. The stages in this process are begin balance sheet, profit loss report, equity contribution, end.
Industry Cost Structure Template 1 Ppt PowerPoint Presentation Icon Layout
This is a industry cost structure template 1 ppt powerpoint presentation icon layout. This is a two stage process. The stages in this process are power and fuel cost, material cost, employee cost, interest and finance costs, operating profit margins.

Pyramid For Financial Accounting Information Powerpoint Slides
This PowerPoint template has been designed with graphics of pyramid chart. This PPT slide can be used to prepare presentations for profit growth report and also for financial data analysis. You can download finance PowerPoint template to prepare awesome presentations.

Cycle Of Management Accounting Tools Ppt Example Of Ppt
This is a cycle of management accounting tools ppt example of ppt. This is a four stage process. The stages in this process are balance sheet, profit and loss account, cash flow statement, fund flow statement.\n\n\n\n\n\n\n\n\n\n\n\n\n\n\n\n\n\n

Product Portfolio Analysis Ppt Powerpoint Templates
This is a product portfolio analysis ppt powerpoint templates. This is a four stage process. The stages in this process are green product portfolio analysis, profit contribution, low, high, problematic, productive, prohibitive, promising, environmental impact.
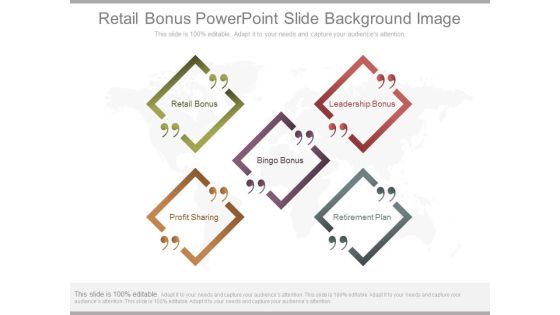
Retail Bonus Powerpoint Slide Background Image
This is a retail bonus powerpoint slide background image. This is a five stage process. The stages in this process are retail bonus, bingo bonus, profit sharing, leadership bonus, retirement plan.
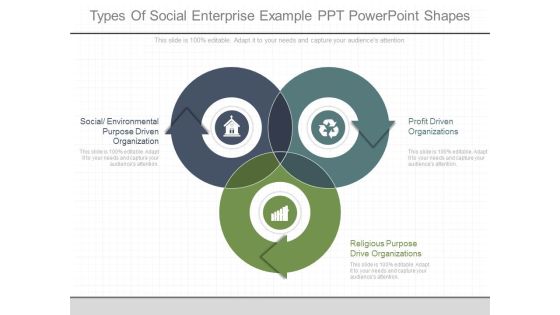
Types Of Social Enterprise Example Ppt Powerpoint Shapes
This is a types of social enterprise example ppt powerpoint shapes. This is a three stage process. The stages in this process are social environmental purpose driven organization, profit driven organizations, religious purpose drive organizations.

Sales Oriented Pricing Example Layout Powerpoint Slides
This is a sales oriented pricing example layout powerpoint slides. This is a five stage process. The stages in this process are price setting, profit oriented, sales oriented, price flexibility, discounts and allowances, sales maximization.

Segmentation Analysis Of Supply Chain Ppt Powerpoint Slide Show
This is a segmentation analysis of supply chain ppt powerpoint slide show. This is a four stage process. The stages in this process are very interested target, possible, likely no interest, possible, profit margin, size volume.

Kpis And Operations Metrics Presentation Powerpoint Example
This is a kpis and operations metrics presentation powerpoint example. This is a five stage process. The stages in this process are customer class, affiliate, sales by warehouse, warehouse, profit by affiliate.
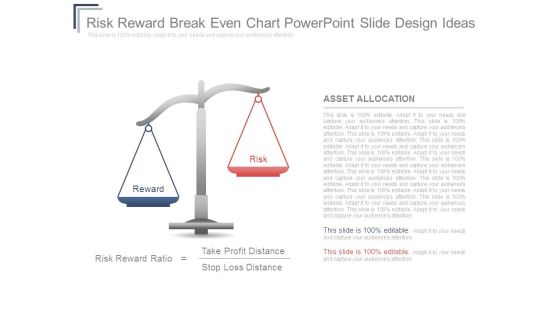
Risk Reward Breakeven Chart Powerpoint Slide Design Ideas
This is a risk reward breakeven chart powerpoint slide design ideas. This is a two stage process. The stages in this process are reward, risk, asset allocation, risk reward ratio, take profit distance, stop loss distance.

Balance Risk And Reward Example Powerpoint Slide Backgrounds
This is a balance risk and reward example powerpoint slide backgrounds. This is a two stage process. The stages in this process are reward, risk, risk reward ratio, take profit distance, stop loss distance.

Asset Allocation Decision Diagram Powerpoint Slide Influencers
This is a asset allocation decision diagram powerpoint slide influencers. This is a two stage process. The stages in this process are risk reward ratio, take profit distance, stop loss distance, reward, risk.
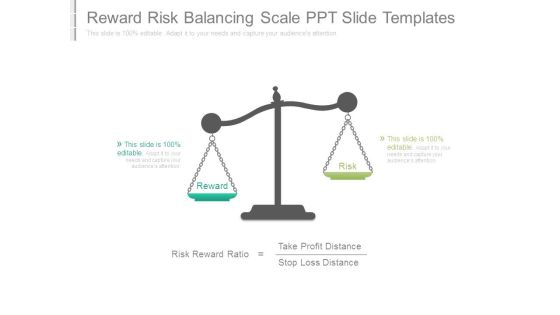
Reward Risk Balancing Scale Ppt Slide Templates
This is a reward risk balancing scale ppt slide templates. This is a two stage process. The stages in this process are risk reward ratio, reward, risk, take profit distance, stop loss distance.
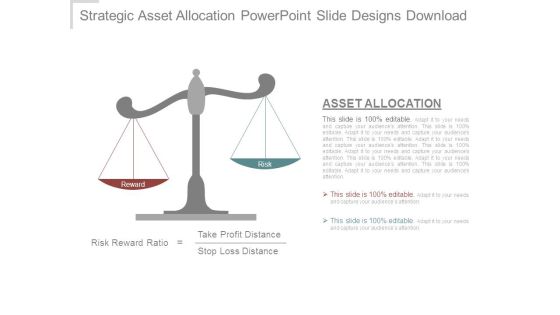
Strategic Asset Allocation Powerpoint Slide Designs Download
This is a strategic asset allocation powerpoint slide designs download. This is a two stage process. The stages in this process are reward, risk, risk reward ratio, take profit distance, stop loss distance, asset allocation.

Asset Allocation Ppt PowerPoint Presentation Show
This is a asset allocation ppt powerpoint presentation show. This is a two stage process. The stages in this process are reward, risk, take profit distance, stop loss distance.

Asset Allocation Ppt PowerPoint Presentation Backgrounds
This is a asset allocation ppt powerpoint presentation backgrounds. This is a two stage process. The stages in this process are reward, risk, risk reward ratio, take profit distance, stop loss distance.

Asset Allocation Ppt PowerPoint Presentation Design Templates
This is a asset allocation ppt powerpoint presentation design templates. This is a two stage process. The stages in this process are risk reward ratio, take profit distance, stop loss distance.

Asset Allocation Ppt PowerPoint Presentation Sample
This is a asset allocation ppt powerpoint presentation sample. This is a two stage process. The stages in this process are risk, reward, risk reward ratio, take profit distance.

Stacked Line Chart Ppt PowerPoint Presentation Shapes
This is a stacked line chart ppt powerpoint presentation shapes. This is a two stage process. The stages in this process are product, profit in thousands, finance, analysis, growth.

Competitors Analysis Template Ppt PowerPoint Presentation Infographic Template Rules
This is a competitors analysis template ppt powerpoint presentation infographic template rules. This is a four stage process. The stages in this process are net profit margin, finance, marketing, bar, success.
Financial Summary Ppt PowerPoint Presentation Icon Pictures
This is a financial summary ppt powerpoint presentation icon pictures. This is a seven stage process. The stages in this process are net sales, expenses, ebitda, profit after tax.
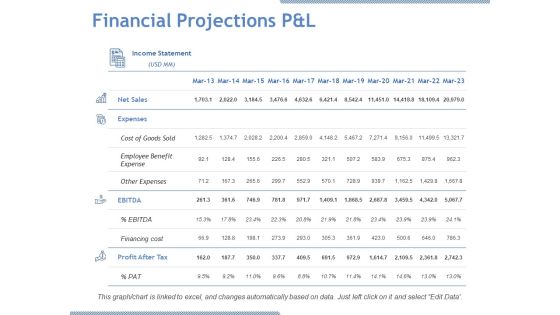
Financial Projections P And L Ppt PowerPoint Presentation Model Design Inspiration
This is a financial projections p and l ppt powerpoint presentation model design inspiration. This is a four stage process. The stages in this process are net sales, expenses, ebitda, profit after tax, cost of goods sold.

Financial Projections P And L Ppt PowerPoint Presentation Summary Backgrounds
This is a financial projections p and l ppt powerpoint presentation summary backgrounds. This is a four stage process. The stages in this process are net sales, expenses, other expenses, profit after tax, pat.

Business Strategy Development Process Business Management Kpis Metrics Margin Pictures PDF
Presenting business strategy development process business management kpis metrics margin pictures pdf to provide visual cues and insights. Share and navigate important information on five stages that need your due attention. This template can be used to pitch topics like active customers, sold units, total revenues, profit margin, net profit. In addtion, this PPT design contains high resolution images, graphics, etc, that are easily editable and available for immediate download.

Brand Development Manual Year Over Year Growth Comparison Ideas PDF
Following slide displays yearly growth comparison informational statistics. It includes details about revenues, operating profit and net profit. Deliver and pitch your topic in the best possible manner with this Brand Development Manual Year Over Year Growth Comparison Ideas PDF Use them to share invaluable insights on Year Over Year Growth Comparison and impress your audience. This template can be altered and modified as per your expectations. So, grab it now.
Manual To Develop Strawman Proposal Financial Performance Tracking Dashboard Pictures PDF
This slide presents the dashboard which will help firm in tracking the financial performance. This dashboard displays number of customers, vendors and revenues generated, expenses and profit incurred. Deliver and pitch your topic in the best possible manner with this Manual To Develop Strawman Proposal Financial Performance Tracking Dashboard Pictures PDF. Use them to share invaluable insights on Profit, Revenue, Expense and impress your audience. This template can be altered and modified as per your expectations. So, grab it now.

Company Quarterly Financial Highlights With Key Insights Information PDF
This slide shows the graph related to quarterly decreasing trend of the net sales and operating profit margin for the year 2021, along with the key insights. Deliver and pitch your topic in the best possible manner with this company quarterly financial highlights with key insights information pdf. Use them to share invaluable insights on strategies, sales, marketing, revenue, operating profit, methods and impress your audience. This template can be altered and modified as per your expectations. So, grab it now.

Successful Brand Development Plan Year Over Year Growth Comparison Clipart PDF
Following slide displays yearly growth comparison informational statistics. It includes details about revenues, operating profit and net profit. Deliver and pitch your topic in the best possible manner with this successful brand development plan year over year growth comparison clipart pdf. Use them to share invaluable insights on year over year growth comparison and impress your audience. This template can be altered and modified as per your expectations. So, grab it now.
Real Estate Developers Funding Alternatives Company Specific Competitor Landscape Icons PDF
Mentioned slide shows detailed competitive landscape analysis based on different parameters such as number of employees, founded year, projects completed and net profit margin. Deliver an awe inspiring pitch with this creative Real Estate Developers Funding Alternatives Company Specific Competitor Landscape Icons PDF bundle. Topics like Projects Completed, Net Profit Margin, Opportunities can be discussed with this completely editable template. It is available for immediate download depending on the needs and requirements of the user.
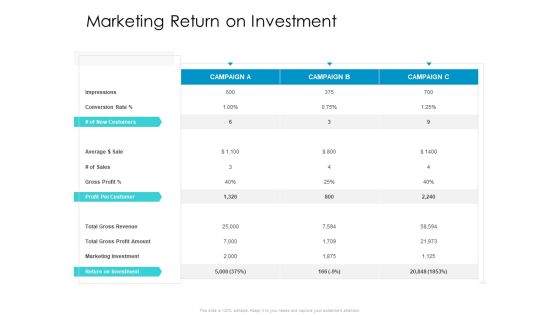
Developing New Sales And Marketing Strategic Approach Marketing Return On Investment Ppt PowerPoint Presentation Inspiration Pictures PDF
Presenting this set of slides with name developing new sales and marketing strategic approach marketing return on investment ppt powerpoint presentation inspiration pictures pdf. The topics discussed in these slides are new customers, profit per customer, return on investment, impressions, conversion rate, average and sale, gross profit, marketing investment. This is a completely editable PowerPoint presentation and is available for immediate download. Download now and impress your audience.

Constructing Insurance Company Strategic Business Approach Projected Income Statement Ideas PDF
The purpose of this slide is to provide glimpse about the projected profit and loss of the firm to visualize firms financial performance for upcoming three years. Deliver an awe inspiring pitch with this creative Constructing Insurance Company Strategic Business Approach Projected Income Statement Ideas PDF bundle. Topics like Gross Profit, Miscellaneous, Total Expenses can be discussed with this completely editable template. It is available for immediate download depending on the needs and requirements of the user.

How To Promote Business Using Youtube Marketing Current Sales Earned By The Company Diagrams PDF
This slide provides the glimpse about the current revenues and profit margin earned by the company for past 8 years. Deliver and pitch your topic in the best possible manner with this how to promote business using youtube marketing current sales earned by the company diagrams pdf. Use them to share invaluable insights on revenues, profit margin and impress your audience. This template can be altered and modified as per your expectations. So, grab it now.

Company Income Statement Historic Vs Forecasted Ppt Summary Format PDF
This slide shows The Income Statement of the company with forecasted values including Revenue, Gross Profit, Operating Expenses, Operating Profit etc.Deliver an awe-inspiring pitch with this creative company income statement historic vs forecasted ppt summary format pdf. bundle. Topics like revenue, cost of goods sold, operating expenses can be discussed with this completely editable template. It is available for immediate download depending on the needs and requirements of the user.

Business Performance After Introducing Offshoring Revenue Microsoft PDF
The purpose of this slide is to provide a glimpse of the business performance geographically along with total profit, profit margin, average order quantity etc. Deliver an awe inspiring pitch with this creative business performance after introducing offshoring revenue microsoft pdf bundle. Topics like planned, revenue, quantity, average can be discussed with this completely editable template. It is available for immediate download depending on the needs and requirements of the user.

Financial Statements Consolidated Statement Of Income Ppt Portfolio Picture PDF
This slide shows the consolidated statement of income which includes net revenue, operating profit, net income for the three years, etc. Deliver and pitch your topic in the best possible manner with this financial statements consolidated statement of income ppt portfolio picture pdf. Use them to share invaluable insights on net revenue, cost of sales, gross profit and impress your audience. This template can be altered and modified as per your expectations. So, grab it now.
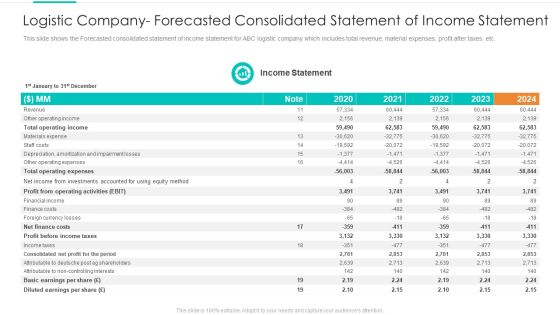
Logistic Company Forecasted Consolidated Statement Of Income Statement Template PDF
This slide shows the Forecasted consolidated statement of income statement for ABC logistic company which includes total revenue, material expenses, profit after taxes, etc. Deliver and pitch your topic in the best possible manner with this logistic company forecasted consolidated statement of income statement template pdf. Use them to share invaluable insights on income statement, revenue, material expenses, profit after taxes and impress your audience. This template can be altered and modified as per your expectations. So, grab it now.

Product Earning Potential And Revenue By Region Themes PDF
This slide illustrates growth and profit potential of a product in Asia, Oceania and Sub- Saharan Africa. It includes total sales, real internal growth, pricing, organic growth etc. Showcasing this set of slides titled Product Earning Potential And Revenue By Region Themes PDF. The topics addressed in these templates are Profit Growth, System, Product. All the content presented in this PPT design is completely editable. Download it and make adjustments in color, background, font etc. as per your unique business setting.
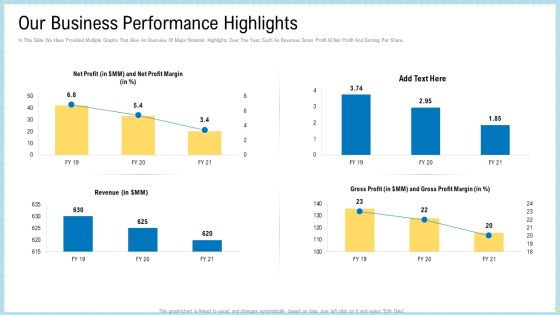
Marketing Technology Stack Our Business Performance Highlights Slides PDF
In This Slide We Have Provided Multiple Graphs That Give An Overview Of Major Financial Highlights Over The Year. Such As Revenue, Gross Profit M Net Profit And Earning Per Share.Deliver and pitch your topic in the best possible manner with this marketing technology stack our business performance highlights slides pdf. Use them to share invaluable insights on our business performance highlights and impress your audience. This template can be altered and modified as per your expectations. So, grab it now.

Business Operations Assessment Business Management Kpis Metrics Customers Ppt Infographics Elements PDF
This is a business operations assessment business management kpis metrics customers ppt infographics elements pdf template with various stages. Focus and dispense information on five stages using this creative set, that comes with editable features. It contains large content boxes to add your information on topics like active customers, sold units, total revenues, net profit, profit margin. You can also showcase facts, figures, and other relevant content using this PPT layout. Grab it now.

In Depth Business Assessment Business Management KPIS Metrics Customers Ppt PowerPoint Presentation Gallery Infographics PDF
This is a in depth business assessment business management kpis metrics customers ppt powerpoint presentation gallery infographics pdf template with various stages. Focus and dispense information on five stages using this creative set, that comes with editable features. It contains large content boxes to add your information on topics like active customers, sold units, total revenues, net profit, profit margin. You can also showcase facts, figures, and other relevant content using this PPT layout. Grab it now.

Business Model Opening Restaurant Coffee Shop Financial Summary Projections Clipart PDF
This slide shows the coffee shop financial projections which includes EBITDA, net income, and net profit along with key notes. Deliver and pitch your topic in the best possible manner with this business model opening restaurant coffee shop financial summary projections clipart pdf. Use them to share invaluable insights on net income, net profit, working capital and impress your audience. This template can be altered and modified as per your expectations. So, grab it now.

Business Model Opening Restaurant Coffee Shop Business Dashboard Plan Icons PDF
This slide shows the coffee shop business dashboard which includes sales month, gross margin by category, sales and profit details, etc. Deliver an awe inspiring pitch with this creative business model opening restaurant coffee shop business dashboard plan icons pdf bundle. Topics like gross margin, plan sales, sales and profit can be discussed with this completely editable template. It is available for immediate download depending on the needs and requirements of the user.

Coffee Shop Business Dashboard Executive Business Plan For Opening A Coffeehouse Ppt Ideas Format PDF
This slide shows the coffee shop business dashboard which includes profit by state, average sales by month, profit, sales by product type, etc. Deliver an awe inspiring pitch with this creative coffee shop business dashboard executive business plan for opening a coffeehouse ppt ideas format pdf bundle. Topics like executive, dashboard, sales, budgeted can be discussed with this completely editable template. It is available for immediate download depending on the needs and requirements of the user.

Business Performance Dashboard Brand Techniques Structure Introduction PDF
Following slide covers business performance dashboard of the firm. It include KPIs such as average weekly sales revenue, above sales target, sales revenue and profit generated. Deliver an awe inspiring pitch with this creative business performance dashboard brand techniques structure introduction pdf bundle. Topics like average, revenue, sales, profit, cost can be discussed with this completely editable template. It is available for immediate download depending on the needs and requirements of the user.

Business Assessment Outline Business Management KPIS Metrics Ratio Ppt Model Layout Ideas PDF
Deliver and pitch your topic in the best possible manner with this business assessment outline business management kpis metrics ratio ppt model layout ideas pdf. Use them to share invaluable insights on gross profit margin, opex ratio, ebit margin, net profit, new orders, delayed projects, new clients and impress your audience. This template can be altered and modified as per your expectations. So, grab it now.

Business Operations Assessment Business Management Kpis Metrics Projects Ppt File Background PDF
Deliver and pitch your topic in the best possible manner with this business operations assessment business management kpis metrics projects ppt file background pdf. Use them to share invaluable insights on gross profit margin, opex ratio, ebit margin, net profit, new orders, delayed projects, new clients and impress your audience. This template can be altered and modified as per your expectations. So, grab it now.

Business To Business Market Segmentation Criteria Competitive Landscape Analysis Company Specific Portrait PDF
Following slide shows detailed competitive landscape analysis based on different parameters such as number of employees, founded year, investor funding operating profit and net profit margin. Deliver an awe inspiring pitch with this creative business to business market segmentation criteria competitive landscape analysis company specific portrait pdf bundle. Topics like opportunities, weakness, threat, strength can be discussed with this completely editable template. It is available for immediate download depending on the needs and requirements of the user.
 Home
Home