Increased Profits

Benefits Of Strategic Kips Ppt Powerpoint Show
This is a benefits of strategic kips ppt powerpoint show. This is a two stage process. The stages in this process are sales, plan, ideas, business, team, profit, venture.
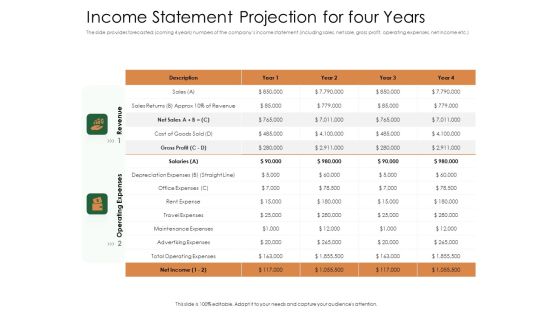
Substitute Financing Pitch Deck Income Statement Projection For Four Years Background PDF
The slide provides forecasted coming four years numbers of the companys income statement including sales, net sale, gross profit, operating expenses, net income etc. Deliver an awe inspiring pitch with this creative substitute financing pitch deck income statement projection for four years background pdf bundle. Topics like sales, gross profit, expense, advertising, revenue can be discussed with this completely editable template. It is available for immediate download depending on the needs and requirements of the user.

Business Performance After Introducing Offshoring Sales Background PDF
The purpose of this slide is to provide a glimpse of the business performance which includes revenue, gross profit, new customers, and satisfaction level etc. Deliver and pitch your topic in the best possible manner with this business performance after introducing offshoring sales background pdf. Use them to share invaluable insights on sales, gross profit, customers, revenue and impress your audience. This template can be altered and modified as per your expectations. So, grab it now.

Monthly Wise Income Statement Projection For Coming Year Ppt Summary Example PDF
This slide shows the monthly financials of the company which covers net revenue, profit, expenses, EBIT etc. Deliver an awe-inspiring pitch with this creative monthly wise income statement projection for coming year ppt summary example pdf bundle. Topics like revenue, expenses, gross profit, cost goods sold, interest can be discussed with this completely editable template. It is available for immediate download depending on the needs and requirements of the user.

Customer Lifetime Value Calculations Powerpoint Layout
This is a customer lifetime value calculations powerpoint layout. This is a six stage process. The stages in this process are average acquisition cost, average customer revenue, average customer profit, customer retention rate, discount rate.
Fundraising From Corporate Investment Historical And Forecasted Income Statement Icons PDF
This slide shows the historical and predicted income statement of the company which contains total revenue, costs, gross profit, operating expenses etc. Deliver an awe inspiring pitch with this creative fundraising from corporate investment historical and forecasted income statement icons pdf bundle. Topics like operating expenses, gross profit, income tax can be discussed with this completely editable template. It is available for immediate download depending on the needs and requirements of the user.

Customer Acquisition Cost For New Business Estimating Client Lifetime Value Topics PDF
This slide shows how to calculate and estimate the client lifetime value when variables such as each year profit, time period and cost to acquire clients are provided. Deliver an awe-inspiring pitch with this creative customer acquisition cost for new business estimating client lifetime value topics pdf bundle. Topics like profit, acquire clients, client lifetime value can be discussed with this completely editable template. It is available for immediate download depending on the needs and requirements of the user.
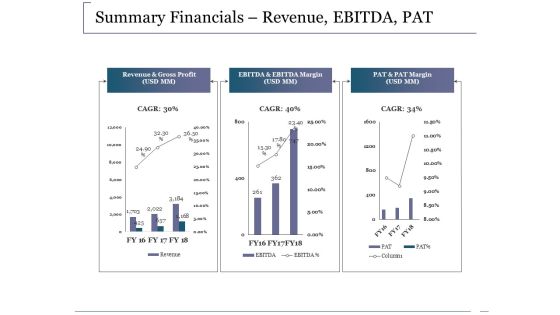
Summary Financials Revenue Ebitda Pat Ppt PowerPoint Presentation Outline Infographics
This is a summary financials revenue ebitda pat ppt powerpoint presentation outline infographics. This is a three stage process. The stages in this process are revenue and gross profit, ebitda and ebitda margin, pat and pat margin, business, marketing.
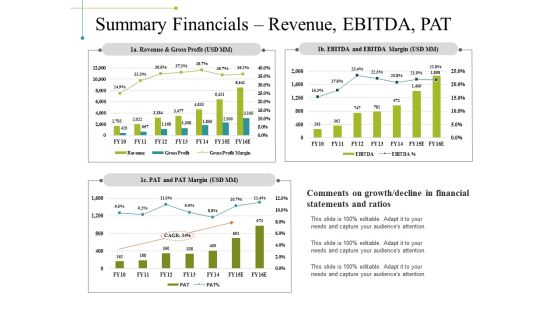
Summary Financials Revenue Ebitda Pat Ppt PowerPoint Presentation Inspiration Templates
This is a summary financials revenue ebitda pat ppt powerpoint presentation inspiration templates. This is a three stage process. The stages in this process are revenue and gross profit, pat and pat margin, ebitda and ebitda margin, business, marketing.
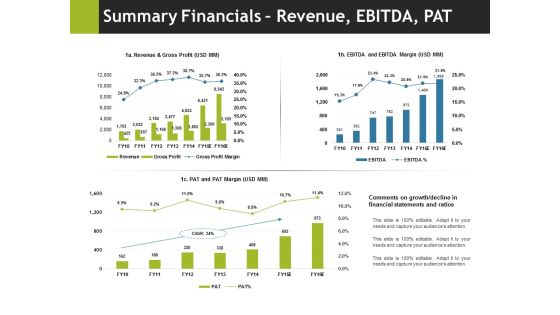
Summary Financials Revenue Ebitda Pat Ppt PowerPoint Presentation Pictures Outline
This is a summary financials revenue ebitda pat ppt powerpoint presentation pictures outline. This is a three stage process. The stages in this process are business, marketing, pat and pat margin, ebitda and ebitda margin, revenue and gross profit.
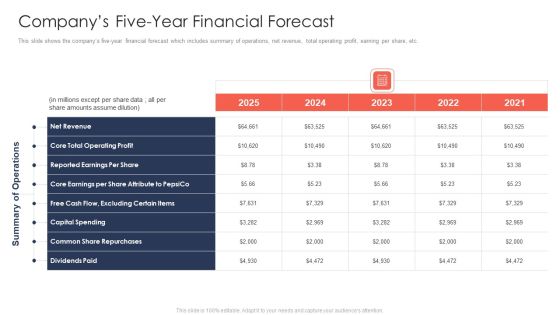
Trading Current Franchise Business Companys Five Year Financial Forecast Graphics PDF
This slide shows the companys five-year financial forecast which includes summary of operations, net revenue, total operating profit, earning per share, etc. Deliver an awe inspiring pitch with this creative trading current franchise business companys five year financial forecast graphics pdf bundle. Topics like net revenue, capital spending, operating profit, dividends paid can be discussed with this completely editable template. It is available for immediate download depending on the needs and requirements of the user.
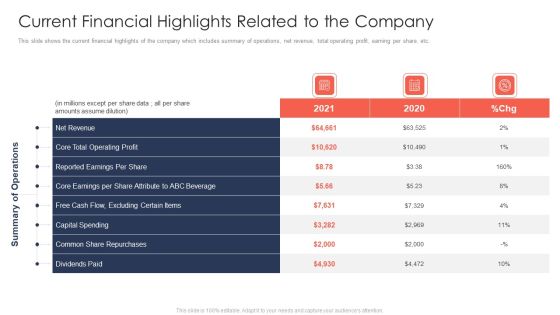
Trading Current Franchise Business Current Financial Highlights Related To The Company Structure PDF
This slide shows the current financial highlights of the company which includes summary of operations, net revenue, total operating profit, earning per share, etc. Deliver and pitch your topic in the best possible manner with this trading current franchise business current financial highlights related to the company structure pdf. Use them to share invaluable insights on net revenue, capital spending, operating profit, dividends paid and impress your audience. This template can be altered and modified as per your expectations. So, grab it now.

Benefits Of Logistics Management Training Plan For Organization Ppt Gallery Files PDF
The following slide displays key advantages of logistics and supply chain management training to company. It includes information about improved profitability, informed decision making and technical advancement. Presenting Benefits Of Logistics Management Training Plan For Organization Ppt Gallery Files PDF to dispense important information. This template comprises four stages. It also presents valuable insights into the topics including Improved Profitability, Technical Advancement, Informed Decision Making . This is a completely customizable PowerPoint theme that can be put to use immediately. So, download it and address the topic impactfully.

Three Dashboard With Percentage Value Growth Powerpoint Slides
This PowerPoint template has been designed with three dashboards. Use this PPT slide to depict rise in business profit. This professional diagram slide will help you express your views to target audience.

Survey With Factors To Business Corporate Success Measurement Themes PDF
The following slide illustrates customer questionnaire for measuring business success. It provides information about service quality, recognition, profitability, market share, etc. Pitch your topic with ease and precision using this Survey With Factors To Business Corporate Success Measurement Themes PDF. This layout presents information on Business And Brand, Profitability, Stock Market Performance. It is also available for immediate download and adjustment. So, changes can be made in the color, design, graphics or any other component to create a unique layout.

Calculating Customer Lifetime Value Ppt PowerPoint Presentation Introduction
This is a calculating customer lifetime value ppt powerpoint presentation introduction. This is a five stage process. The stages in this process are average acquisition cost, average customer revenue, likely customer profit.

Calculating Customer Lifetime Value Ppt PowerPoint Presentation Templates
This is a calculating customer lifetime value ppt powerpoint presentation templates. This is a five stage process. The stages in this process are average acquisition cost, average customer revenue, average customer costs, average customer profit, customer retention rate.

Calculating Customer Lifetime Value Clv Ppt PowerPoint Presentation Show Icon
This is a calculating customer lifetime value clv ppt powerpoint presentation show icon. This is a five stage process. The stages in this process are average acquisition cost, average customer revenue, average customer costs, average customer profit, customer retention rate.

Break Even Analysis Ppt PowerPoint Presentation Layouts Portrait
This is a break even analysis ppt powerpoint presentation layouts portrait. This is a six stage process. The stages in this process are key comments on the table, units of output, total cost, sales revenue, profit.

Cash Flow Analysis Template Powerpoint Slides Images
This is a cash flow analysis template powerpoint slides images. This is a six stage process. The stages in this process are expenses, loan emis, taxes, discretionary expenses, income, profit.

Customer Value Assessment Ppt Sample Presentations
This is a customer value assessment ppt sample presentations. This is a seven stage process. The stages in this process are customer profile, customer needs, customer trigger, proposition pull, processes, future builder, profit.

Banking Performance Management Diagram Good Ppt Example
This is a banking performance management diagram good ppt example. This is a four stage process. The stages in this process are management information system, profitability, performance management, commercial net income forecast.
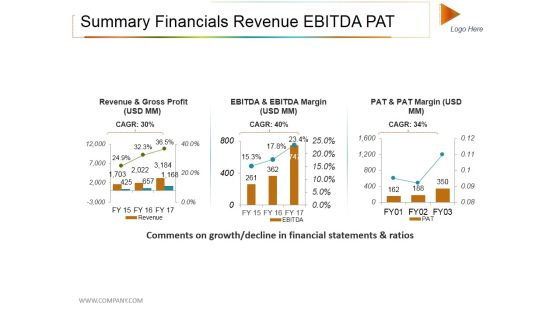
Summary Financials Revenue Ebitda Pat Ppt PowerPoint Presentation File Rules
This is a summary financials revenue ebitda pat ppt powerpoint presentation file rules. This is a three stage process. The stages in this process are revenue and gross profit, revenue, growth, success.

Business Advisory Solutions Company Profile Competitive Comparison By Financials Rules PDF
This slide shows the comparison with competitors on the basis of financials which includes revenue, net profit, market share, employee count and service coverage. Deliver an awe inspiring pitch with this creative Business Advisory Solutions Company Profile Competitive Comparison By Financials Rules PDF bundle. Topics like Highest Revenue, Net Profit, Market Share can be discussed with this completely editable template. It is available for immediate download depending on the needs and requirements of the user.

Summary Financials Revenue Ebitda Pat Ppt PowerPoint Presentation Visuals
This is a summary financials revenue ebitda pat ppt powerpoint presentation visuals. This is a three stage process. The stages in this process are revenue and gross profit, pat and pat margin, ebitda and ebitda margin.

Break Even Analysis Ppt PowerPoint Presentation Portfolio Clipart
This is a break even analysis ppt powerpoint presentation portfolio clipart. This is a five stage process. The stages in this process are fixed cost, variable cost, sales revenue, profit, key comments on the table, units of output.

Decision Making Matrix For Organizational Initiatives Formats PDF
This slide shows decision making matrix for business activities. It provides information about impact, effort, profitability, vision, employee training, resource allocation, upgrade existing infrastructure, etc. Showcasing this set of slides titled Decision Making Matrix For Organizational Initiatives Formats PDF. The topics addressed in these templates are Profitability, Development, Resource. All the content presented in this PPT design is completely editable. Download it and make adjustments in color, background, font etc. as per your unique business setting.

Break Even Analysis Ppt PowerPoint Presentation Inspiration Templates
This is a break even analysis ppt powerpoint presentation inspiration templates. This is a five stage process. The stages in this process are units of output, fixed cost, variable cost, total cost, sales revenue, profit.

Ppt Circular Interpretation Of 9 Steps Involved Procedure PowerPoint Templates
PPT circular interpretation of 9 steps involved procedure PowerPoint Templates-Use this Circular flow diagram to describe key strategic issues and information flows and internal communication.-PPT circular interpretation of 9 steps involved procedure PowerPoint Templates-Affiliate, Affiliation, Arrow, Business, Chart, Circular, Commerce, Concept, Contribution, Cycle, Development, Diagram, Idea, Informative, Internet, Join, Making, Manage, Management, Market, Marketing, Member, Money, Network, Partner, Partnership, Pay, Paying, Performance, Plans, Process, Productive, Productivity, Profit, Profitable, Project, Recruit, Recruiting, Recruitment, Refer, Referral, Referring, Revenue, Sales, Socialize, Steps, Strategy

Ppt Circular Interpretation Of 12 Steps Involved Procedure PowerPoint Templates
PPT circular interpretation of 12 steps involved procedure PowerPoint Templates-Use this Circular flow diagram to describe key strategic issues and information flows and internal communication.-PPT circular interpretation of 12 steps involved procedure PowerPoint Templates-Affiliate, Affiliation, Arrow, Business, Chart, Circular, Commerce, Concept, Contribution, Cycle, Development, Diagram, Idea, Informative, Internet, Join, Making, Manage, Management, Market, Marketing, Member, Money, Network, Partner, Partnership, Pay, Paying, Performance, Plans, Process, Productive, Productivity, Profit, Profitable, Project, Recruit, Recruiting, Recruitment, Refer, Referral, Referring, Revenue, Sales, Socialize, Steps, Strategy
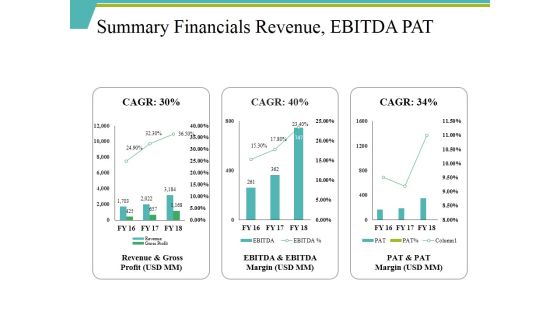
Summary Financials Revenue Ebitda Pat Ppt PowerPoint Presentation Infographic Template Smartart
This is a summary financials revenue ebitda pat ppt powerpoint presentation infographic template smartart. This is a three stage process. The stages in this process are revenue and gross profit, ebitda and ebitda, pat and pat, revenue.
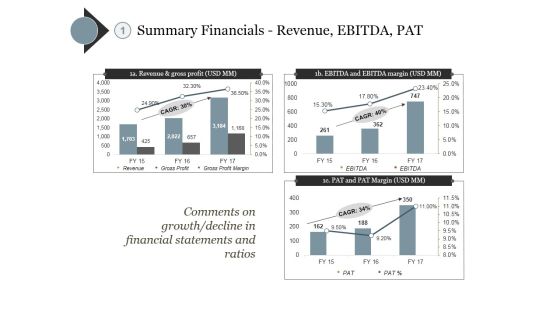
Summary Financials Revenue Ebitda Pat Ppt PowerPoint Presentation Model Clipart Images
This is a summary financials revenue ebitda pat ppt powerpoint presentation model clipart images. This is a three stage process. The stages in this process are revenue and gross profit, ebitda and ebitda margin, pat and pat margin.
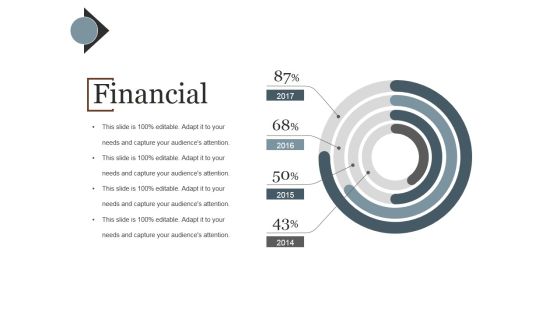
Financial Ppt PowerPoint Presentation File Slide
This is a financial ppt powerpoint presentation file slide. This is a two stage process. The stages in this process are summary financials, revenue split, revenue and gross profit, quarterly revenue split, revenue spilt by geography.
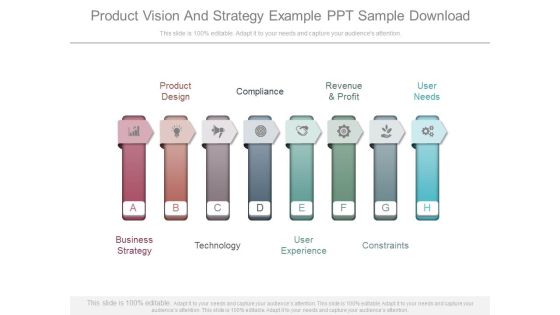
Product Vision And Strategy Example Ppt Sample Download
This is a product vision and strategy example ppt sample download. This is a eight stage process. The stages in this process are product design, compliance, revenue and profit, user needs, constraints, user experience, technology, business strategy.

Advertising Online Example Ppt Presentation
This is a advertising online example ppt presentation. This is a six stage process. The stages in this process are business strategy, constraints, revenue and profit, product design, user experience, technology.
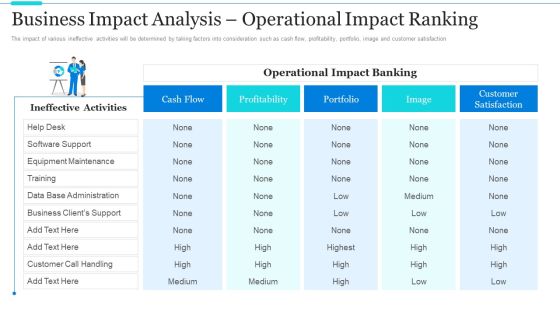
Strategic Methods Of Stakeholder Prioritization Business Impact Analysis Operational Impact Ranking Professional PDF
The impact of various ineffective activities will be determined by taking factors into consideration such as cash flow, profitability, portfolio, image and customer satisfaction. Deliver an awe inspiring pitch with this creative strategic methods of stakeholder prioritization business impact analysis operational impact ranking professional pdf bundle. Topics like cash flow, profitability, portfolio, maintenance, business can be discussed with this completely editable template. It is available for immediate download depending on the needs and requirements of the user.

Work Prioritization Procedure Business Impact Analysis Operational Impact Ranking Microsoft PDF
The impact of various ineffective activities will be determined by taking factors into consideration such as cash flow, profitability, portfolio, image and customer satisfaction. Deliver an awe inspiring pitch with this creative work prioritization procedure business impact analysis operational impact ranking microsoft pdf bundle. Topics like cash flow, profitability, portfolio, maintenance, business can be discussed with this completely editable template. It is available for immediate download depending on the needs and requirements of the user.

Industry Overview Template 1 Ppt PowerPoint Presentation Deck
This is a industry overview template 1 ppt powerpoint presentation deck. This is a six stage process. The stages in this process are revenue, profit, annual growth, wages, annual growth, businesses.

Industry Overview Template 1 Ppt PowerPoint Presentation Show
This is a industry overview template 1 ppt powerpoint presentation show. This is a six stage process. The stages in this process are revenue, profit, annual growth, wages, businesses.
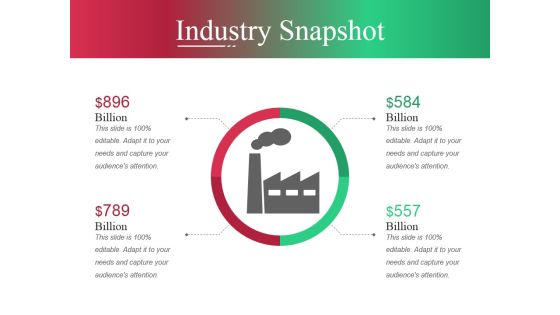
Industry Snapshot Template Ppt PowerPoint Presentation Slides Shapes
This is a industry snapshot template ppt powerpoint presentation slides shapes. This is a two stage process. The stages in this process are revenue, profit, annual growth, wages, annual growth, business.

Comparison Based On Criteria Ppt PowerPoint Presentation Gallery Information
This is a comparison based on criteria ppt powerpoint presentation gallery information. This is a six stage process. The stages in this process are criteria, revenue, profit, business, competitor.
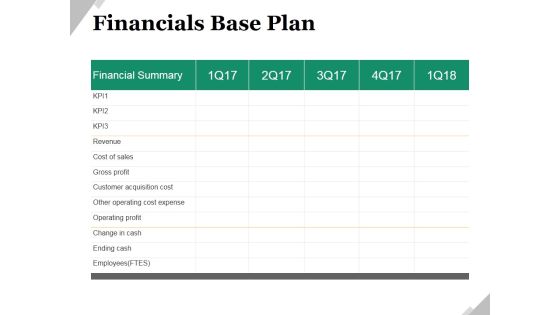
Financials Base Plan Ppt PowerPoint Presentation Model Shapes
This is a financials base plan ppt powerpoint presentation model shapes. This is a five stage process. The stages in this process are financial summary, business, marketing, revenue, cost of sales, gross profit.

Industry Snapshot Template 2 Ppt PowerPoint Presentation Layouts Examples
This is a industry snapshot template 2 ppt powerpoint presentation layouts examples. This is a three stage process. The stages in this process are revenue, profit, annual growth, wages, annual growth, business.

Industry Snapshot Template 1 Ppt PowerPoint Presentation Gallery Design Ideas
This is a industry snapshot template 1 ppt powerpoint presentation gallery design ideas. This is a three stage process. The stages in this process are revenue, profit, annual growth, wages, business.

Brand Loyalty Measurement And Management Ppt Slides
This is a brand loyalty measurement and management ppt slides. This is a six stage process. The stages in this process are financial performance, brand value, brand strategy, benefits, profitability, imagery, attributes, attitudes.

Components Of Brand Strength Assessment Diagram Presentation Ideas
This is a components of brand strength assessment diagram presentation ideas. This is a seven stage process. The stages in this process are benefits, experience, attitudes, strategy, positioning, brand value, profitability.

Financial Summary Ppt PowerPoint Presentation Outline Information
This is a financial summary ppt powerpoint presentation outline information. This is a two stage process. The stages in this process are summary financials, revenue split, revenue and gross profit.
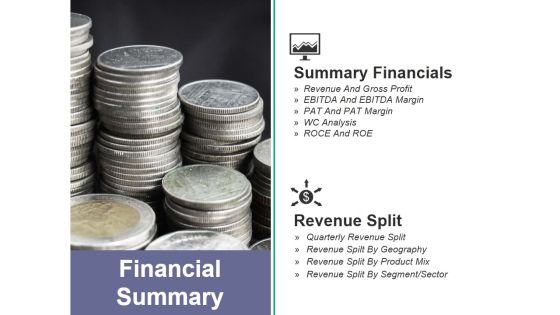
Financial Summary Ppt PowerPoint Presentation Infographic Template Design Inspiration
This is a financial summary ppt powerpoint presentation infographic template design inspiration. This is a two stage process. The stages in this process are summary financials, revenue split, financial summary, revenue and gross profit, wc analysis.

Strategic Investment Options Diagram Powerpoint Slide Design Templates
This is a strategic investment options diagram powerpoint slide design templates. This is a eight stage process. The stages in this process are value and risk modeling, asset aware investments, values, performance, investment lifecycle management, profit, growth, result.

Competitors Analysis Report Ppt PowerPoint Presentation Introduction
This is a competitors analysis report ppt powerpoint presentation introduction. This is a seven stage process. The stages in this process are criteria, revenue, profit, market share, main activity, number of employee.

Last 90 Days Results Ppt PowerPoint Presentation Microsoft
This is a last 90 days results ppt powerpoint presentation microsoft. This is a four stage process. The stages in this process are revenue, new customers, gross profit, customer satisfaction.

Financials Base Plan Ppt PowerPoint Presentation Portfolio
This is a financials base plan ppt powerpoint presentation portfolio. This is a five stage process. The stages in this process are revenue, cost of sales, gross profit, customer acquisition cost, other operating cost expense.
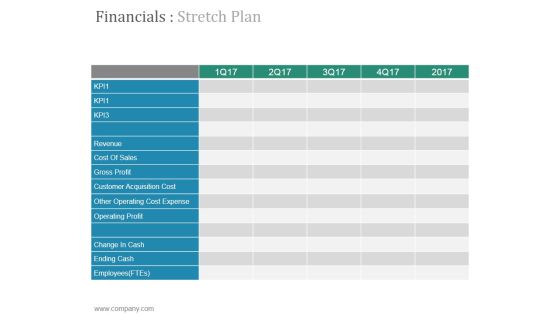
Financials Stretch Plan Ppt PowerPoint Presentation Designs
This is a financials stretch plan ppt powerpoint presentation designs. This is a five stage process. The stages in this process are revenue, cost of sales, gross profit, customer acquisition cost, other operating cost expense.

Analyse Competition Ppt PowerPoint Presentation Themes
This is a analyse competition ppt powerpoint presentation themes. This is a seven stage process. The stages in this process are profit, revenue, market share, main activity, number of employee.

Break Even Analysis Ppt PowerPoint Presentation Design Templates
This is a break even analysis ppt powerpoint presentation design templates. This is a two stage process. The stages in this process are sales, break even volume, total revenue, loss, profit.

Last 30 Days Results Ppt PowerPoint Presentation Summary Brochure
This is a last 30 days results ppt powerpoint presentation summary brochure. This is a four stage process. The stages in this process are revenue, new customers, gross profit, customer satisfaction.

competition comparison table ppt powerpoint presentation infographics design inspiration
This is a competition comparison table ppt powerpoint presentation infographics design inspiration. This is a seven stage process. The stages in this process are revenue, profit, market share, main activity, number of employee.

Competitor Analysis Ppt PowerPoint Presentation Ideas Icons
This is a competitor analysis ppt powerpoint presentation ideas icons. This is a seven stage process. The stages in this process are revenue, profit, market share, main activity, number of employee.

Competitor Analysis Template Ppt PowerPoint Presentation Pictures Diagrams
This is a competitor analysis template ppt powerpoint presentation pictures diagrams. This is a seven stage process. The stages in this process are revenue, profit, market share, number of employee, product quality, main activity.

Comparison Based On Criteria Ppt PowerPoint Presentation Show Icon
This is a comparison based on criteria ppt powerpoint presentation show icon. This is a six stage process. The stages in this process are revenue, profit, market share, main activity, number of employee.

Comparison Based On Criteria Ppt PowerPoint Presentation Gallery Themes
This is a comparison based on criteria ppt powerpoint presentation gallery themes. This is a seven stage process. The stages in this process are revenue, profit, market share, main activity, product quality.

Comparison Based On Criteria Ppt PowerPoint Presentation Gallery Sample
This is a comparison based on criteria ppt powerpoint presentation gallery sample. This is a six stage process. The stages in this process are revenue, profit, market share, main activity, number of employee.

Comparison Based On Criteria Ppt PowerPoint Presentation Show File Formats
This is a comparison based on criteria ppt powerpoint presentation show file formats. This is a six stage process. The stages in this process are revenue, profit, market share, main activity, number of employee.
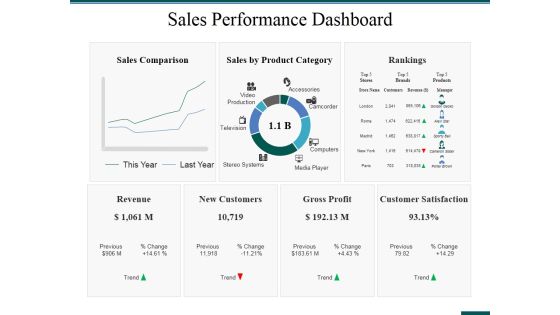
Sales Performance Dashboard Ppt PowerPoint Presentation Ideas Format Ideas
This is a sales performance dashboard ppt powerpoint presentation ideas format ideas. This is a three stage process. The stages in this process are rankings, revenue, new customers, gross profit, customer satisfaction.
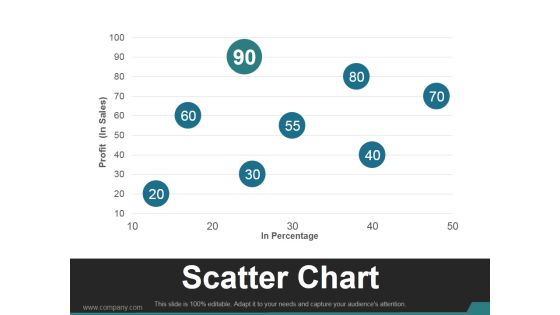
Scatter Chart Template 2 Ppt PowerPoint Presentation Slides
This is a scatter chart template 2 ppt powerpoint presentation slides. This is a eight stage process. The stages in this process are business, marketing, scatter chart, profit, management.

Bubble Chart Ppt PowerPoint Presentation Layouts Design Ideas
This is a bubble chart ppt powerpoint presentation layouts design ideas. This is a eight stage process. The stages in this process are in percentage, profit, bubble chart, business, marketing.
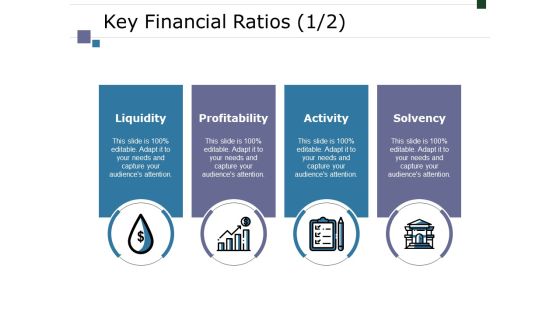
Key Financial Ratios Template 2 Ppt PowerPoint Presentation Ideas Mockup
This is a key financial ratios template 2 ppt powerpoint presentation ideas mockup. This is a four stage process. The stages in this process are liquidity, profitability, activity, solvency, business.
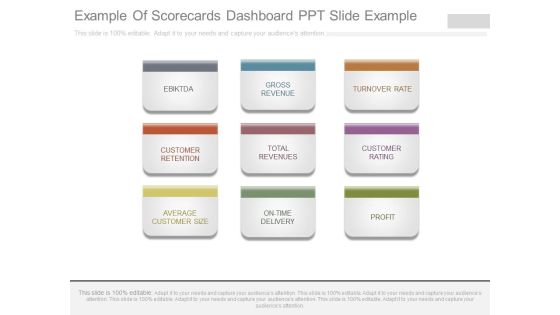
Example Of Scorecards Dashboard Ppt Slide Example
This is a example of scorecards dashboard ppt slide example. This is a nine stage process. The stages in this process are ebiktda, gross revenue, turnover rate, customer retention, total revenues, customer rating, average customer size, on time delivery, profit.

Competitor Analysis Template Ppt PowerPoint Presentation Ideas
This is a competitor analysis template ppt powerpoint presentation ideas. This is a five stage process. The stages in this process are revenue, profit, market share, number of employee, product quality, main activity, revenue.
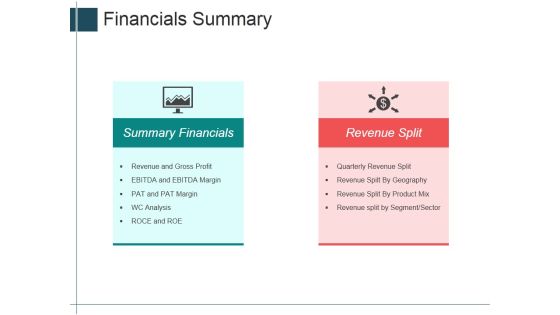
Financials Summary Ppt Powerpoint Presentation Inspiration Slides
This is a financials summary ppt powerpoint presentation inspiration slides. This is a two stage process. The stages in this process are summary financials, revenue split, icons, revenue and gross profit.

Social Enterprise Management Skills Template Sample Presentation Ppt
This is a social enterprise management skills template sample presentation ppt. This is a eight stage process. The stages in this process are employees, business operations, customer relations, people, governance, marketing, profit, leadership.

Stacked Line Chart Ppt PowerPoint Presentation Pictures Elements
This is a stacked line chart ppt powerpoint presentation pictures elements. This is a two stage process. The stages in this process are product, profit, stacked line chart, year, business.
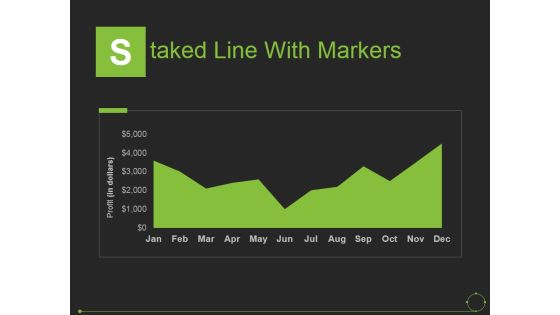
Staked Line With Markers Ppt PowerPoint Presentation Pictures Examples
This is a staked line with markers ppt powerpoint presentation pictures examples. This is a one stage process. The stages in this process are years, profit, product, business, marketing.

Stacked Line Chart Ppt PowerPoint Presentation Outline Examples
This is a stacked line chart ppt powerpoint presentation outline examples. This is a two stage process. The stages in this process are product, stacked line chart, business, marketing, profit.

Clustered Bar Ppt PowerPoint Presentation Summary Design Inspiration
This is a clustered bar ppt powerpoint presentation summary design inspiration. This is a two stage process. The stages in this process are product, clustered bar, profit, business, marketing.
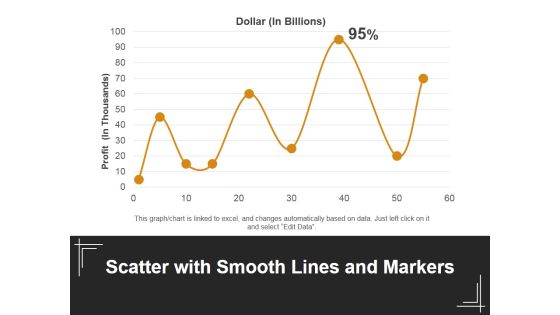
Scatter With Smooth Lines And Markers Ppt PowerPoint Presentation Outline Design Ideas
This is a scatter with smooth lines and markers ppt powerpoint presentation outline design ideas. This is a one stage process. The stages in this process are dollar, profit, line chart, business, marketing.

Stacked Line With Marker Ppt PowerPoint Presentation Ideas Themes
This is a stacked line with marker ppt powerpoint presentation ideas themes. This is a two stage process. The stages in this process are profit, stacked bar, product, business, marketing.
Market Segmentation Evaluation Ppt PowerPoint Presentation Icon Pictures
This is a market segmentation evaluation ppt powerpoint presentation icon pictures. This is a two stage process. The stages in this process are net profit, in usd millions, market sales, business, marketing.

Market Segmentation Evaluation Template 1 Ppt PowerPoint Presentation Templates
This is a market segmentation evaluation template 1 ppt powerpoint presentation templates. This is a two stage process. The stages in this process are market sale, net profit, evaluation, business, marketing.
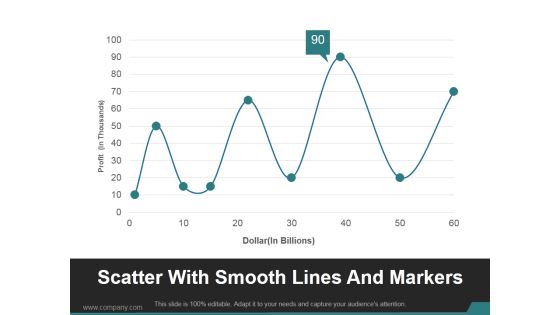
Scatter With Smooth Lines And Markers Ppt PowerPoint Presentation Show
This is a scatter with smooth lines and markers ppt powerpoint presentation show. This is a nine stage process. The stages in this process are business, marketing, line chart, profit, management.

Scatter Bubble Chart Ppt PowerPoint Presentation Professional Model
This is a scatter bubble chart ppt powerpoint presentation professional model. This is a six stage process. The stages in this process are sales in profit, financial year, growth, business, marketing, strategy.

Market Segmentation Evaluation Ppt PowerPoint Presentation Infographics Background
This is a market segmentation evaluation ppt powerpoint presentation infographics background. This is a two stage process. The stages in this process are market sales, net profit, icons, finance, business, marketing.
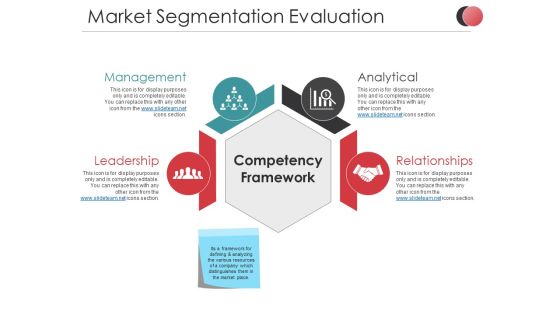
Market Segmentation Evaluation Ppt PowerPoint Presentation Summary Slideshow
This is a market segmentation evaluation ppt powerpoint presentation summary slideshow. This is a two stage process. The stages in this process are net profit, market sales, business, marketing, finance, icons.

Scatter With Smooth Lines And Markers Ppt PowerPoint Presentation Visual Aids Ideas
This is a scatter with smooth lines and markers ppt powerpoint presentation visual aids ideas. This is a nine stage process. The stages in this process are product, profit, dollar, business, finance.
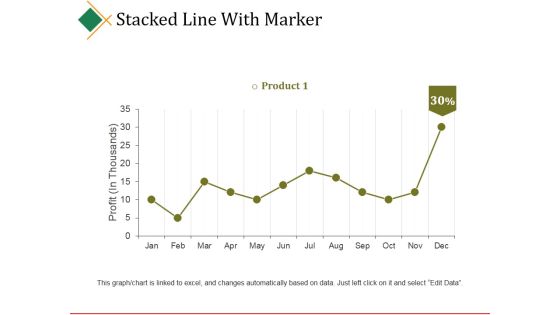
Stacked Line With Marker Ppt PowerPoint Presentation Model Graphics Download
This is a stacked line with marker ppt powerpoint presentation model graphics download. This is a twelve stage process. The stages in this process are product, profit, business, marketing, success.
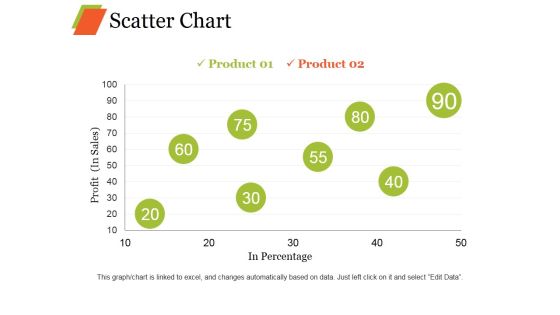
Scatter Chart Ppt PowerPoint Presentation Professional Graphic Images
This is a scatter chart ppt powerpoint presentation professional graphic images. This is a eight stage process. The stages in this process are product, profit, in percentage growth, business.
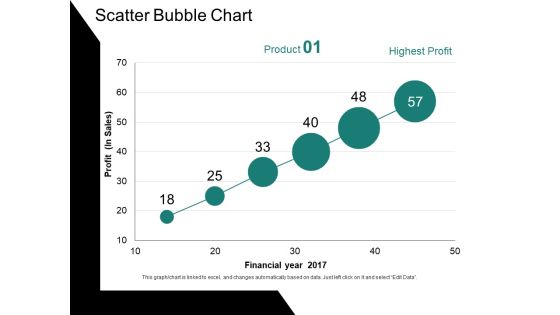
Scatter Bubble Chart Ppt PowerPoint Presentation Ideas Gallery
This is a scatter bubble chart ppt powerpoint presentation ideas gallery. This is a six stage process. The stages in this process are profit, financial year, chart, business, growth.
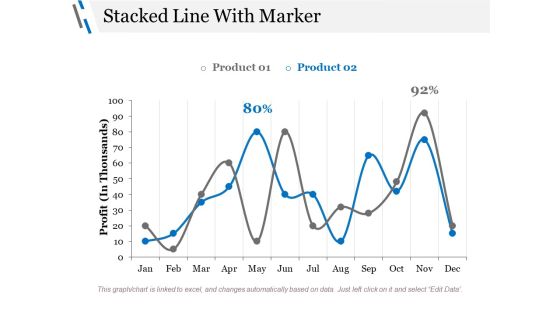
Stacked Line With Marker Ppt PowerPoint Presentation Styles Graphics Design
This is a stacked line with marker ppt powerpoint presentation styles graphics design. This is a three stage process. The stages in this process are profit, business, marketing, finance, percentage.

Scatter With Smooth Lines And Markers Ppt PowerPoint Presentation Ideas Deck
This is a scatter with smooth lines and markers ppt powerpoint presentation ideas deck. This is a one stage process. The stages in this process are profit, dollar, percentage, business, growth.
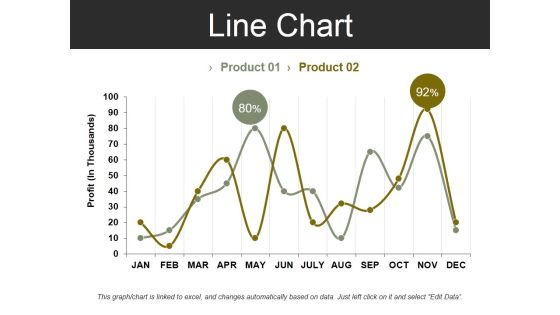
Line Chart Template 2 Ppt PowerPoint Presentation Summary Design Inspiration
This is a line chart template 2 ppt powerpoint presentation summary design inspiration. This is a two stage process. The stages in this process are profit, business, marketing, finance, chart.
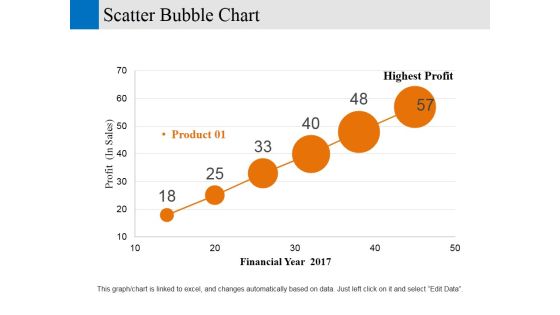
Scatter Bubble Chart Ppt PowerPoint Presentation Gallery Designs Download
This is a scatter bubble chart ppt powerpoint presentation gallery designs download. This is a six stage process. The stages in this process are financial year, profit, business, marketing, strategy.
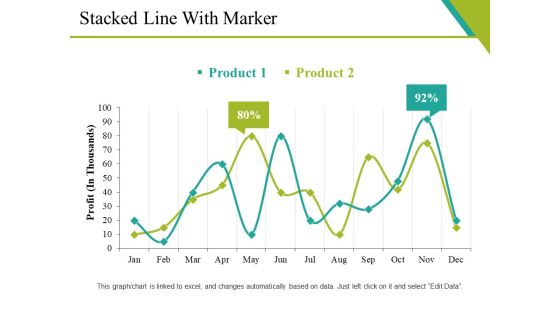
Stacked Line With Marker Ppt PowerPoint Presentation Gallery Diagrams
This is a stacked line with marker ppt powerpoint presentation gallery diagrams. This is a two stage process. The stages in this process are graph, business, marketing, strategy, profit.

Clustered Column Ppt PowerPoint Presentation Visual Aids Show
This is a clustered column ppt powerpoint presentation visual aids show. This is a two stage process. The stages in this process are product, profit, business, bar graph, finance.

Scatter Bubble Chart Ppt PowerPoint Presentation Gallery Show
This is a scatter bubble chart ppt powerpoint presentation gallery show. This is a two stage process. The stages in this process are profit, in percentage, finance, marketing, business.

Line Chart Ppt PowerPoint Presentation Professional Portfolio
This is a line chart ppt powerpoint presentation professional portfolio. This is a two stage process. The stages in this process are business, marketing, profit, percentage, graph, strategy, finance.

Bubble Chart Ppt PowerPoint Presentation Outline Deck
This is a bubble chart ppt powerpoint presentation outline deck. This is a two stage process. The stages in this process are in percentage, profit, bubble chart, business, marketing.
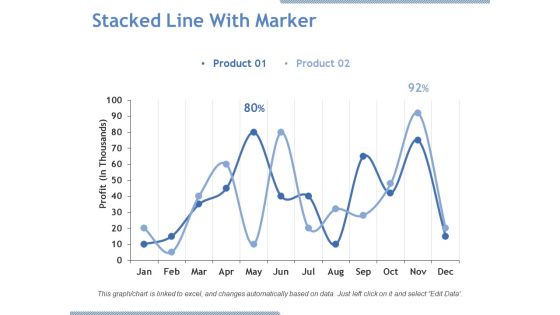
Stacked Line With Marker Ppt PowerPoint Presentation Pictures Graphics Download
This is a stacked line with marker ppt powerpoint presentation pictures graphics download. This is a two stage process. The stages in this process are product, profit, line chart, business, growth.

Line Chart Ppt PowerPoint Presentation File Designs Download
This is a line chart ppt powerpoint presentation file designs download. This is a two stage process. The stages in this process are business, marketing, profit, line chart, percentage.

Balance Sheet Kpis Ppt PowerPoint Presentation Summary Designs Download
This is a balance sheet kpis ppt powerpoint presentation summary designs download. This is a four stage process. The stages in this process are current assets, current liabilities, total liabilities, operating profit, business.

Cash Flow Statement Kpis Ppt PowerPoint Presentation Styles Themes
This is a cash flow statement kpis ppt powerpoint presentation styles themes. This is a four stage process. The stages in this process are business, operations, operating profit, total liabilities, current liabilities.
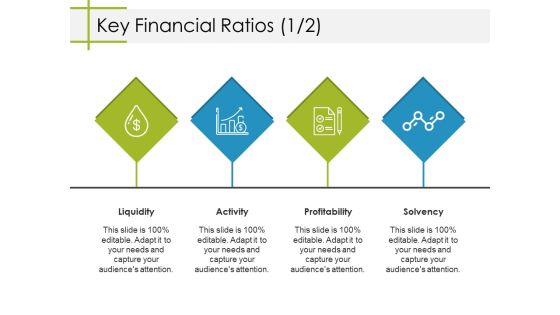
Key Financial Ratios Template 2 Ppt PowerPoint Presentation Summary Samples
This is a key financial ratios template 2 ppt powerpoint presentation summary samples. This is a four stage process. The stages in this process are liquidity, activity, profitability, solvency, business.
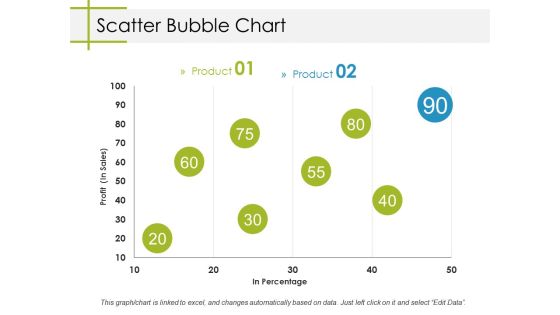
Scatter Bubble Chart Ppt PowerPoint Presentation Model Designs
This is a scatter bubble chart ppt powerpoint presentation model designs. This is a two stage process. The stages in this process are business, profit, in percentage, bubble chart, marketing.
Stacked Line Chart Ppt PowerPoint Presentation Show Icon
This is a stacked line chart ppt powerpoint presentation show icon. This is a two stage process. The stages in this process are profit, chart, years, business, marketing, years.

Bubble Chart Ppt PowerPoint Presentation Layouts Clipart Images
This is a bubble chart ppt powerpoint presentation layouts clipart images. This is a two stage process. The stages in this process are business, marketing, profit, innovation, technology, idea bulb.

Clustered Bar Ppt PowerPoint Presentation Icon Professional
This is a clustered bar ppt powerpoint presentation icon professional. This is a two stage process. The stages in this process are business, marketing, profit, clustered bar, finance, strategy.
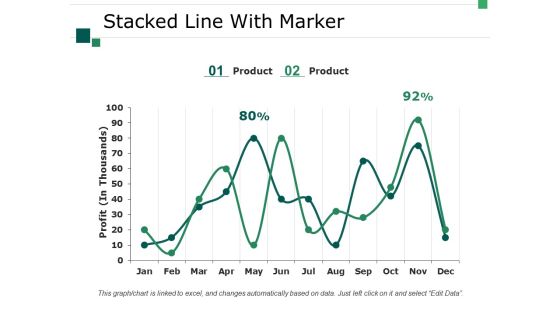
Stacked Line With Marker Ppt PowerPoint Presentation Professional Designs Download
This is a stacked line with marker ppt powerpoint presentation professional designs download. This is a two stage process. The stages in this process are business, marketing, strategy, graph, profit.
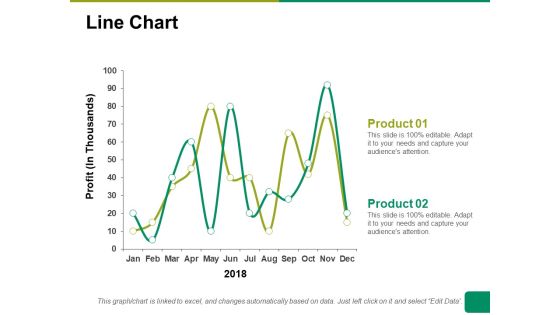
Line Chart Ppt PowerPoint Presentation Summary Ideas
This is a line chart ppt powerpoint presentation summary ideas. This is a two stage process. The stages in this process are line chart, profit, product, financial years, business.

Clustered Column Chart Ppt PowerPoint Presentation Model Deck
This is a clustered column chart ppt powerpoint presentation model deck. This is a three stage process. The stages in this process are clustered column chart, product, finance, profit, business.

Bubble Chart Process Analysis Ppt PowerPoint Presentation Ideas Files
This is a bubble chart process analysis ppt powerpoint presentation ideas files. This is a two stage process. The stages in this process are bubble chart, product, profit, finance, business.

Clustered Bar Process Analysis Ppt PowerPoint Presentation Icon Influencers
This is a clustered bar process analysis ppt powerpoint presentation icon influencers. This is a two stage process. The stages in this process are clustered bar, profit, product, finance, business.
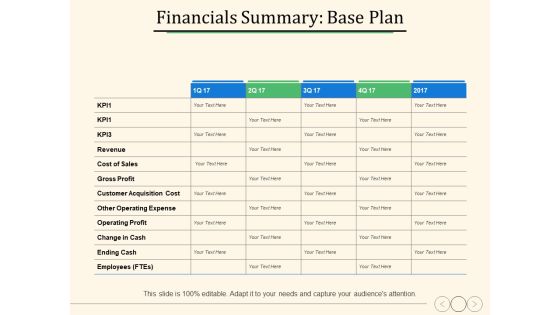
Financials Summary Base Plan Ppt PowerPoint Presentation Ideas Professional
This is a financials summary base plan ppt powerpoint presentation ideas professional. This is a five stage process. The stages in this process are operating profit, customer acquisition cost, business, marketing.
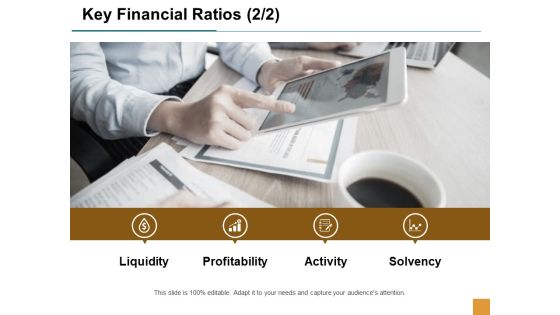
Key Financial Ratios Activity Ppt Powerpoint Presentation Ideas Example Introduction
This is a key financial ratios activity ppt powerpoint presentation ideas example introduction. This is a four stage process. The stages in this process are liquidity, profitability, activity, solvency, business.

Clustered Bar Ppt PowerPoint Presentation Gallery Inspiration
This is a clustered bar ppt powerpoint presentation gallery inspiration. This is a four stage process. The stages in this process are clustered bar, product, profit, business, bar graph.
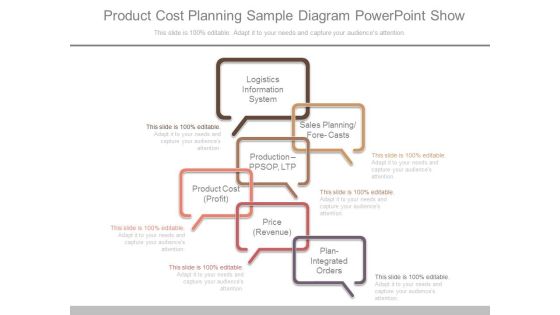
Product Cost Planning Sample Diagram Powerpoint Show
This is a product cost planning sample diagram powerpoint show. This is a six stage process. The stages in this process are logistics information system, sales planning, forecasts, production ppsop, ltp, product cost profit, price revenue, plan integrated orders.
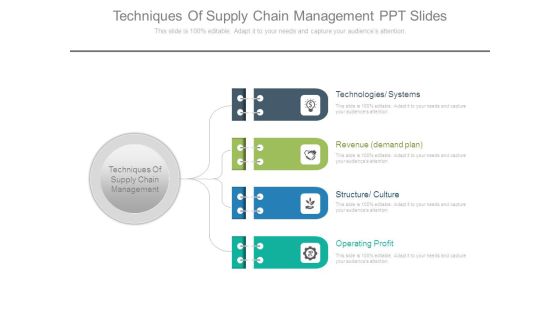
Techniques Of Supply Chain Management Ppt Slides
This is a techniques of supply chain management ppt slides. This is a four stage process. The stages in this process are techniques of supply chain management, technologies systems, revenue demand plan, structure culture, operating profit.
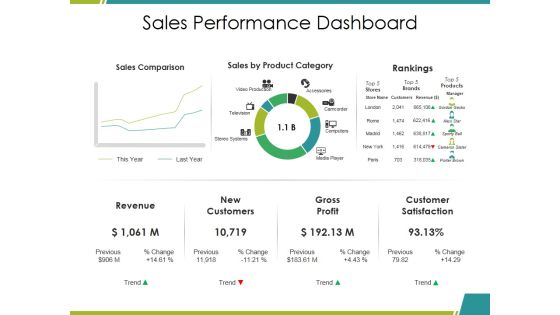
Sales Performance Dashboard Ppt PowerPoint Presentation Infographics Mockup
This is a sales performance dashboard ppt powerpoint presentation infographics mockup. This is a three stage process. The stages in this process are sales comparison, sales by product category, rankings, revenue, gross profit.

Sales Performance Dashboard Ppt PowerPoint Presentation Outline File Formats
This is a sales performance dashboard ppt powerpoint presentation outline file formats. This is a three stage process. The stages in this process are revenue, new customers, gross profit, customer satisfaction, rankings.

Last 90 Days Results Ppt PowerPoint Presentation Introduction
This is a last 90 days results ppt powerpoint presentation introduction. This is a six stage process. The stages in this process are revenue, new customers, gross profit, sales comparison.
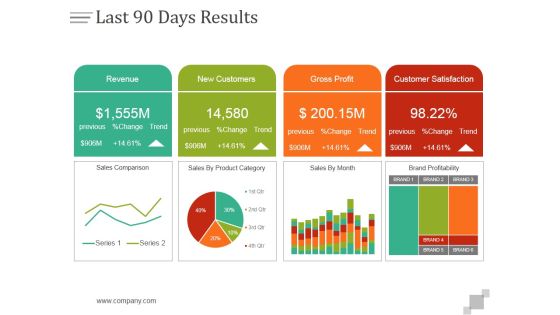
Last 90 Days Results Ppt PowerPoint Presentation Design Templates
This is a last 90 days results ppt powerpoint presentation design templates. This is a four stage process. The stages in this process are revenue, new customers, gross profit, customer satisfaction.

Competitor Analysis Comparison Table Ppt PowerPoint Presentation Show Grid
This is a competitor analysis comparison table ppt powerpoint presentation show grid. This is a seven stage process. The stages in this process are revenue, profit, market share, main activity, number of employee.
 Home
Home