Increased Profits

Customer Lifetime Value Table Ppt Samples
This is a customer lifetime value table ppt samples. This is a five stage process. The stages in this process are complete clv year, average acquisition cost, average customer revenue, average customer costs, average customer profit, customer retention rate, likely customer profit, discount rate, clv per year, cumulative clv, cumulative retention rate.

Calculating Customer Lifetime Value Clv Ppt PowerPoint Presentation Summary
This is a calculating customer lifetime value clv ppt powerpoint presentation summary. This is a five stage process. The stages in this process are complete clv, average acquisition cost, average customer revenue, average customer costs, average customer profit, customer retention rate, likely customer profit.

Calculating Customer Lifetime Value Clv Chart Powerpoint Templates
This is a calculating customer lifetime value clv chart powerpoint templates. This is a five stage process. The stages in this process are complete clv year, average acquisition cost, average customer revenue, average customer costs, average customer profit, customer retention rate, cumulative retention rate, likely customer profit, discount rate, clv per year, cumulative clv.
Average Calculating Customer Lifetime Value Clv Table Ppt Icon
This is a average calculating customer lifetime value clv table ppt icon. This is a five stage process. The stages in this process are complete clv year, average acquisition cost, average customer revenue, average customer costs, average customer profit, customer retention rate, cumulative retention rate, likely customer profit, discount rate, clv per year, cumulative clv.
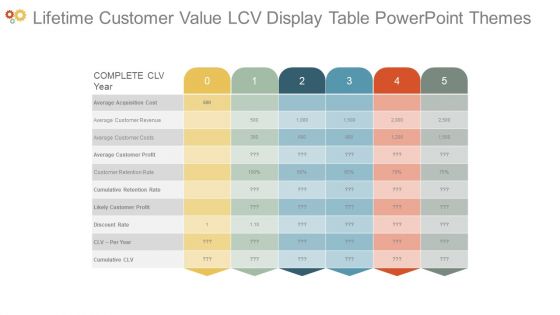
Lifetime Customer Value Lcv Display Table Powerpoint Themes
This is a lifetime customer value lcv display table powerpoint themes. This is a five stage process. The stages in this process are complete clv year, average acquisition cost, average customer revenue, average customer costs, average customer profit, customer retention rate, cumulative retention rate, likely customer profit, discount rate, clv per year, cumulative clv.

Customer Lifetime Value Clv Calculation Table Sample Ppt Presentation
This is a customer lifetime value clv calculation table sample ppt presentation. This is a five stage process. The stages in this process are complete clv year, average acquisition cost, average customer revenue, average customer costs, average customer profit, customer retention rate, cumulative retention rate, likely customer profit, discount rate, clv per year, cumulative clv.

Calculating Customer Lifetime Value Clv Analysis Table Example Of Ppt
This is a calculating customer lifetime value clv analysis table example of ppt. This is a five stage process. The stages in this process are complete clv year, average acquisition cost, average customer revenue, average customer costs, average customer profit, customer retention rate, likely customer profit, discount rate.

Calculating Customer Lifetime Value Clv Ppt PowerPoint Presentation Styles Good
This is a calculating customer lifetime value clv ppt powerpoint presentation styles good. This is a five stage process. The stages in this process are average acquisition cost, average customer revenue, average customer costs, average customer profit, customer retention rate, cumulative retention rate, likely customer profit.

Enterprise Management Markup Pricing Download PDF
Deliver and pitch your topic in the best possible manner with this enterprise management markup pricing download pdf. Use them to share invaluable insights on income, gross profit, overhead, profit, cost of goods sold and impress your audience. This template can be altered and modified as per your expectations. So, grab it now.

Administrative Regulation Markup Pricing Ppt PowerPoint Presentation Outline Ideas PDF
Deliver and pitch your topic in the best possible manner with this administrative regulation markup pricing ppt powerpoint presentation outline ideas pdf. Use them to share invaluable insights on income, profit, cost goods sold, gross profit, gross margin and impress your audience. This template can be altered and modified as per your expectations. So, grab it now.
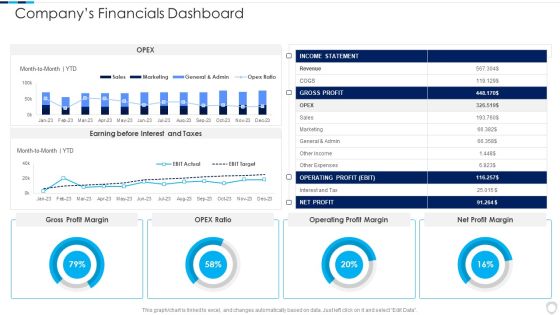
Financial Report Of An IT Firm Companys Financials Dashboard Infographics PDF
Deliver an awe inspiring pitch with this creative Financial Report Of An IT Firm Companys Financials Dashboard Infographics PDF bundle. Topics like Operating Profit, Gross Profit, Income Statement can be discussed with this completely editable template. It is available for immediate download depending on the needs and requirements of the user.
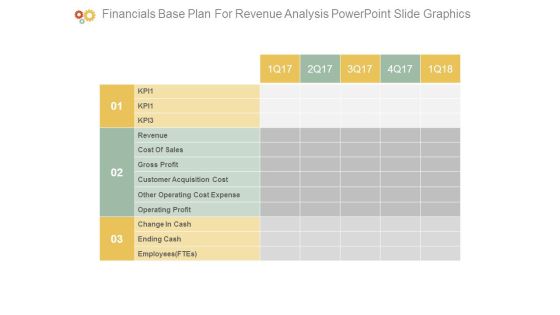
Financials Base Plan For Revenue Analysis Powerpoint Slide Graphics
This is a financials base plan for revenue analysis powerpoint slide graphics. This is a three stage process. The stages in this process are kp, revenue, cost of sales, gross profit, customer acquisition cost, other operating cost expense, operating profit, change in cash, ending cash, employees ftes.
Gross And Net Revenue Comparison Shown By Graph Ppt PowerPoint Presentation File Icons PDF
Presenting this set of slides with name gross and net revenue comparison shown by graph ppt powerpoint presentation file icons pdf. The topics discussed in these slides are gross profit, net profit. This is a completely editable PowerPoint presentation and is available for immediate download. Download now and impress your audience.

Costing And Monitoring Of Activities Ppt PowerPoint Presentation Professional Elements PDF
Presenting this set of slides with name costing and monitoring of activities ppt powerpoint presentation professional elements pdf. The topics discussed in these slides are selling price, indirect costs, net profit, indirect costs, gross profit, revenue. This is a completely editable PowerPoint presentation and is available for immediate download. Download now and impress your audience.
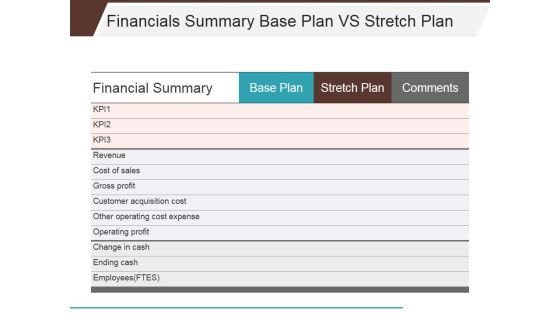
Financials Summary Base Plan Vs Stretch Plan Ppt PowerPoint Presentation Infographics Themes
This is a financials summary base plan vs stretch plan ppt powerpoint presentation infographics themes. This is a three stage process. The stages in this process are revenue, cost of sales, gross profit, customer acquisition cost, other operating cost expense, operating profit.

API Management For Building Software Applications Financial Highlights After API Implementation Brochure PDF
Presenting this set of slides with name api management for building software applications financial highlights after api implementation brochure pdf. The topics discussed in these slides are net profit, key takeaways, revenue, gross profit. This is a completely editable PowerPoint presentation and is available for immediate download. Download now and impress your audience.

API Management For Building Software Applications Financial Highlights Before API Implementation Summary PDF
Presenting this set of slides with name api management for building software applications financial highlights before api implementation summary pdf. The topics discussed in these slides are net profit, key takeaways, revenue, gross profit. This is a completely editable PowerPoint presentation and is available for immediate download. Download now and impress your audience.

Firm Capability Assessment Pandl Kpis Tabular Form Ppt Infographic Template Inspiration PDF
Presenting this set of slides with name firm capability assessment pandl kpis tabular form ppt infographic template inspiration pdf. The topics discussed in these slides are revenue, net profit, operating profit, cogs. This is a completely editable PowerPoint presentation and is available for immediate download. Download now and impress your audience.

Deal Assessment Audit Process P And L Kpis Download PDF
Deliver and pitch your topic in the best possible manner with this deal assessment audit process p and l kpis download pdf. Use them to share invaluable insights on operating profit, net profit, revenue, cogs and impress your audience. This template can be altered and modified as per your expectations. So, grab it now.

Administrative Regulation Financial Planning Template Ppt PowerPoint Presentation Layouts Information PDF
Deliver an awe-inspiring pitch with this creative administrative regulation financial planning template ppt powerpoint presentation layouts information pdf bundle. Topics like revenues, gross profit, planning, gross profit, products and services can be discussed with this completely editable template. It is available for immediate download depending on the needs and requirements of the user.
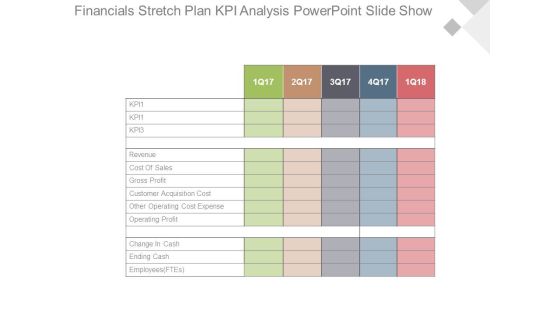
Financials Stretch Plan Kpi Analysis Powerpoint Slide Show
This is a financials stretch plan kpi analysis powerpoint slide show. This is a five stage process. The stages in this process are kpi1, kpi1, kpi3, revenue, cost of sales, gross profit, customer acquisition cost, other operating cost expense, operating profit, change in cash, ending cash, employees ftes.

Financials Summary With Kpi Base Plan Vs Stretch Plan Powerpoint Slides
This is a financials summary with kpi base plan vs stretch plan powerpoint slides. This is a four stage process. The stages in this process are financials summary, base plan, stretch plan, comments, kpi 1, kpi 3, revenue, cost of sales, gross profit, customer acquisition cost, other operating expense, operating profit, change in cash, ending cash, employees ftes.
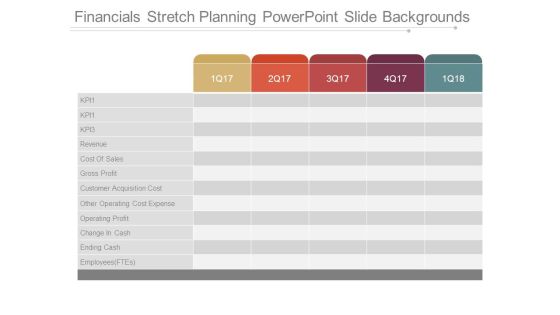
Financials Stretch Planning Powerpoint Slide Backgrounds
This is a financials stretch planning powerpoint slide backgrounds. This is a five stage process. The stages in this process are kp, revenue, cost of sales, gross profit, customer acquisition cost, other operating cost expense, operating profit, change in cash, ending cash, employees ftes.

Financials Summary Base Plan Vs Stretch Plan Powerpoint Slide Information
This is a financials summary base plan vs stretch plan powerpoint slide information. This is a three stage process. The stages in this process are base plan, stretch plan, comments, kp, revenue, cost of sales, gross profit, customer acquisition cost, other operating expense, operating profit, change in cash, ending cash, employees ftes.

Financials Base Plan Table Chart Ppt Slide Templates
This is a financials base plan table chart ppt slide templates. This is a five stage process. The stages in this process are kpi, revenue, cost of sales, gross profit, customer acquisition cost, other operating cost expense, operating profit, change in cash, ending cash, employees ftes.
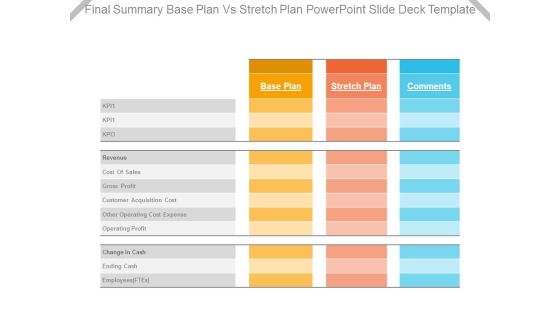
Final Summary Base Plan Vs Stretch Plan Powerpoint Slide Deck Template
This is a final summary base plan vs stretch plan powerpoint slide deck template. This is a three stage process. The stages in this process are kpi, revenue, cost of sales, gross profit, customer acquisition cost, other operating cost expense, operating profit, change in cash, ending cash, employees ftes.
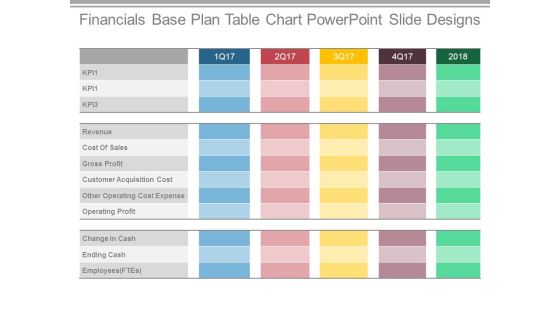
Financials Base Plan Table Chart Powerpoint Slide Designs
This is a financials base plan table chart powerpoint slide designs. This is a five stage process. The stages in this process are revenue, cost of sales, gross profit, customer acquisition cost, other operating cost expense, operating profit, change in cash, ending cash.
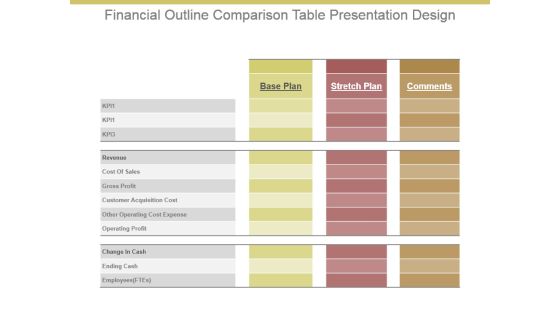
Financial Outline Comparison Table Presentation Design
This is a financial outline comparison table presentation design. This is a three stage process. The stages in this process are base plan, stretch plan, comments, kp, revenue, cost of sales, gross profit, customer acquisition cost, other operating cost expense, operating profit, change in cash, ending cash, employees ftes.
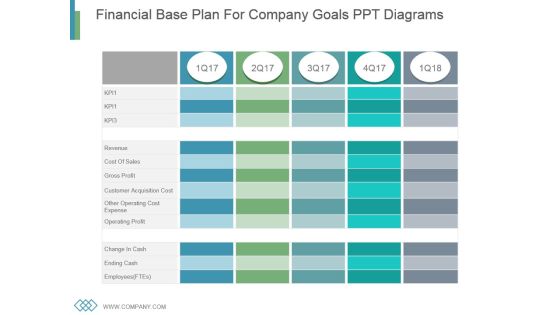
Financial Base Plan For Company Goals Ppt Diagrams
This is a financial base plan for company goals ppt diagrams. This is a five stage process. The stages in this process are revenue, cost of sales, gross profit, customer acquisition cost, other operating cost expense, operating profit, change in cash, ending cash, employees.
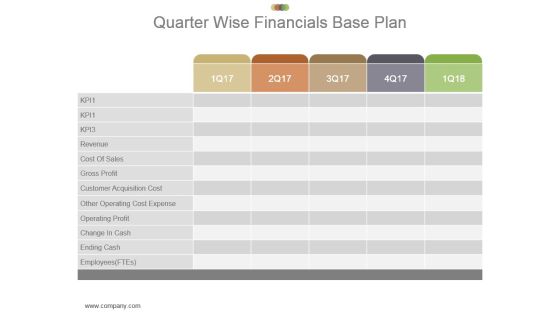
Quarter Wise Financials Base Plan Powerpoint Slide Show
This is a quarter wise financials base plan powerpoint slide show. This is a five stage process. The stages in this process are employees, ending cash, change in cash, operating profit, other operating cost expense, customer acquisition cost, gross profit, cost of sales, revenue.

Financials Stretch Plan Data Powerpoint Slide Backgrounds
This is a financials stretch plan data powerpoint slide backgrounds. This is a three stage process. The stages in this process are employees, ending cash, change in cash, operating profit, other operating cost expense, customer acquisition cost, gross profit, cost of sales, revenue.
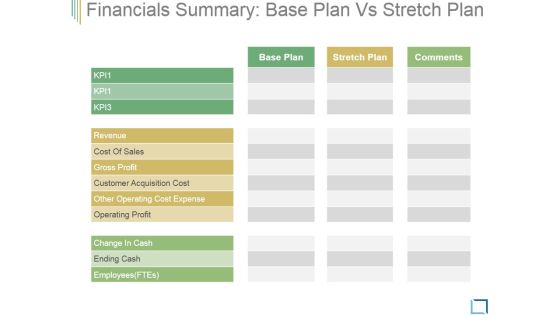
Financials Summary Base Plan Vs Stretch Plan Ppt PowerPoint Presentation Visuals
This is a financials summary base plan vs stretch plan ppt powerpoint presentation visuals. This is a three stage process. The stages in this process are revenue, cost of sales, gross profit, customer acquisition cost, other operating cost expense, operating profit, change in cash.
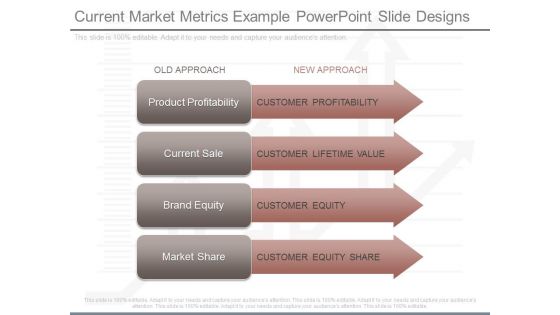
Current Market Metrics Example Powerpoint Slide Designs
This is a current market metrics example powerpoint slide designs. This is a four stage process. The stages in this process are old approach, new approach, product profitability, customer profitability, current sale, customer lifetime value, brand equity, customer equity, market share, customer equity share.
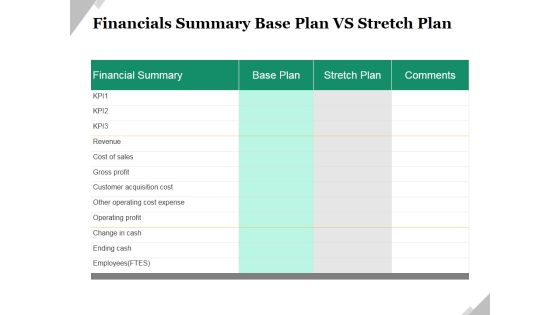
Financials Summary Base Plan Vs Stretch Plan Ppt PowerPoint Presentation Slides Information
This is a financials summary base plan vs stretch plan ppt powerpoint presentation slides information. This is a two stage process. The stages in this process are revenue, cost of sales, gross profit, customer acquisition cost, other operating cost expense, operating profit.

Quarter Based Finance Review Kpi Ppt PowerPoint Presentation Background Designs
This is a quarter based finance review kpi ppt powerpoint presentation background designs. This is a five stage process. The stages in this process are cost of sales, gross profit, customer acquisition cost, other operating cost expense, operating profit, change in cash, ending cash.

Consumer Strategy Pyramid With Icons Ppt PowerPoint Presentation Background Designs
Presenting this set of slides with name consumer strategy pyramid with icons ppt powerpoint presentation background designs. This is a four stage process. The stages in this process are customers are most profitable, customers are least profitable. This is a completely editable PowerPoint presentation and is available for immediate download. Download now and impress your audience.
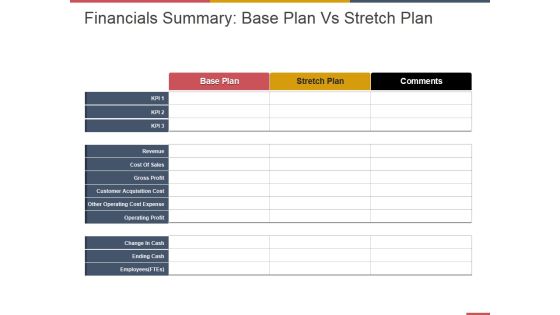
Financials Summary Base Plan Vs Stretch Plan Ppt PowerPoint Presentation Layouts Graphic Tips
This is a financials summary base plan vs stretch plan ppt powerpoint presentation layouts graphic tips. This is a three stage process. The stages in this process are cost of sales, gross profit, customer acquisition cost, other operating cost expense, operating profit.

Competitor Analysis Comparison Table Ppt PowerPoint Presentation Outline Slides
This is a competitor analysis comparison table ppt powerpoint presentation outline slides. This is a two stage process. The stages in this process are revenue, profit, market share, main activity, number of employee, product quality.

Business Software Development Company Profile Executive Summary Introduction PDF
The slide showcases the brief company highlights illustrating company details, key financials for current year revenue, gross profit, operating profit, EBITDA and Net Profit. It also depicts satisfaction rate, and global market share. Deliver an awe inspiring pitch with this creative Business Software Development Company Profile Executive Summary Introduction PDF bundle. Topics like Key Financials US Dollar, Market Leader, Inception Year 2000 can be discussed with this completely editable template. It is available for immediate download depending on the needs and requirements of the user.

Industry Cost Structure Template 1 Ppt PowerPoint Presentation Guidelines
This is a industry cost structure template 1 ppt powerpoint presentation guidelines. This is a seven stage process. The stages in this process are profit, marketing, rent and utilities, purchases, wages, other, depreciation.
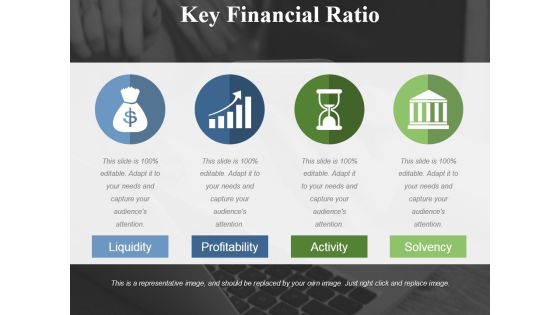
Key Financial Ratio Template 3 Ppt PowerPoint Presentation Outline Clipart Images
This is a key financial ratio template 3 ppt powerpoint presentation outline clipart images. This is a four stage process. The stages in this process are liquidity, profitability, activity, solvency.

Executive Sponsorship Ppt Powerpoint Guide
This is a executive sponsorship ppt powerpoint guide. This is a six stage process. The stages in this process are corporate culture, collaborative profit, continuous improvement, behaviors and reputation, business processes, executive sponsorship.

Marketing Objectives Diagram Presentation Portfolio
This is a marketing objectives diagram presentation portfolio. This is a six stage process. The stages in this process are diversification, human resource, finance, improving profitability, corporate objectives, market share.

Purchasing Policy Ppt Layout Ppt Background Graphics
This is a purchasing policy ppt layout ppt background graphics. This is a seven stage process. The stages in this process are purchase requisition, order placement, shipment tracking, quality products, profitability, rebates, improved pricing.

Employee Leasing Services Template Presentation Graphics
This is a employee leasing services template presentation graphics. This is a six stage process. The stages in this process are improve profitability, better productivity, reduced liabilities, relief from employment, personnel management solution, better employment practices.
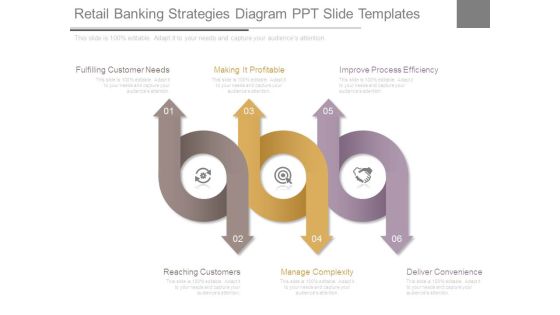
Retail Banking Strategies Diagram Ppt Slide Templates
This is a retail banking strategies diagram ppt slide templates. This is a six stage process. The stages in this process are fulfilling customer needs, making it profitable, improve process efficiency, reaching customers, manage complexity, deliver convenience.
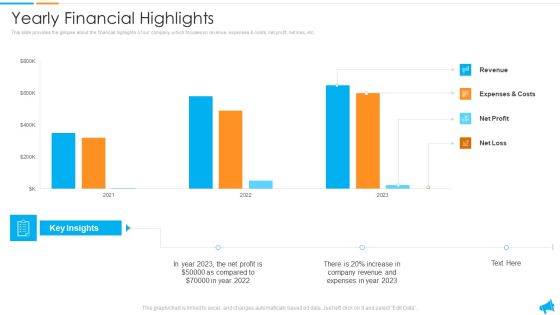
Strategy For Regional Economic Progress Outlining Yearly Financial Highlights Professional PDF
This slide provides the glimpse about the financial highlights of our company which focuses on revenue, expenses and costs, net profit, net loss, etc. Deliver an awe inspiring pitch with this creative strategy for regional economic progress outlining yearly financial highlights professional pdf bundle. Topics like revenue, expenses, net profit, costs can be discussed with this completely editable template. It is available for immediate download depending on the needs and requirements of the user.

Quarterly Overall Business Performance Assessment With Kpi Dashboard Microsoft PDF
The given below slide showcases the overall business performance to evaluate the trends and KPAs. It includes quarterly insights of elements such as revenue, new customers, net profit, customer satisfaction, sales profitability, growth etc. Pitch your topic with ease and precision using this Quarterly Overall Business Performance Assessment With Kpi Dashboard Microsoft PDF. This layout presents information on Revenue, Customer Satisfaction, Net Profit. It is also available for immediate download and adjustment. So, changes can be made in the color, design, graphics or any other component to create a unique layout.

Three Level Technique To Financial Management Guidelines PDF
The slide shows various approaches to financial management that will benefit financial managers to create a balance. It includes liquidity and profitability, traditional and modern view. Presenting Three Level Technique To Financial Management Guidelines PDF to dispense important information. This template comprises three stages. It also presents valuable insights into the topics including Traditional View, Modern View, Liquidity And Profitability. This is a completely customizable PowerPoint theme that can be put to use immediately. So, download it and address the topic impactfully.

Example Of Optimized Investment Sample Diagram Powerpoint Graphics
This is a example of optimized investment sample diagram powerpoint graphics. This is a eight stage process. The stages in this process are customer, performance, profit, capital protection, leverage, yield enhancement, sales, brand growth.
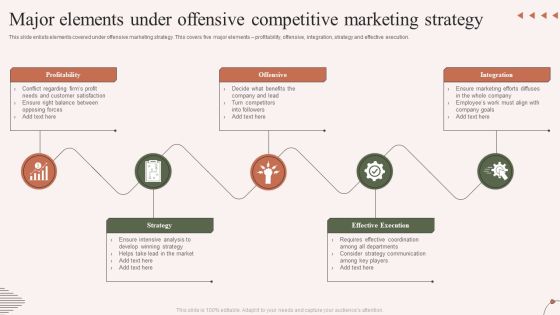
Major Elements Under Offensive Competitive Marketing Strategy Demonstration PDF
This slide enlists elements covered under offensive marketing strategy. This covers five major elements profitability, offensive, integration, strategy and effective execution. Presenting Major Elements Under Offensive Competitive Marketing Strategy Demonstration PDF to dispense important information. This template comprises five stages. It also presents valuable insights into the topics including Profitability, Strategy, Offensive. This is a completely customizable PowerPoint theme that can be put to use immediately. So, download it and address the topic impactfully.
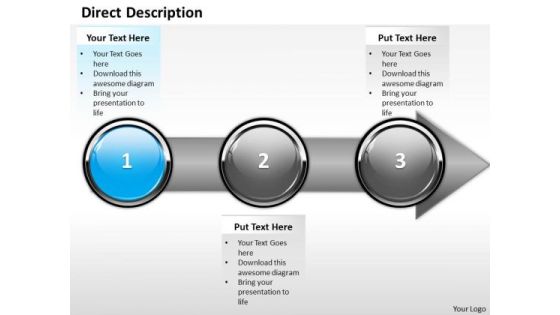
Ppt Consecutive Demonstration Of Arrow Process Using Stage 1 PowerPoint Templates
PPT consecutive demonstration of arrow process using stage 1 PowerPoint Templates-With this pre-designed process arrows diagram you can visualize almost any type of concept, chronological process or steps of your strategies.-PPT consecutive demonstration of arrow process using stage 1 PowerPoint Templates-Arrow, Bank, Benefit, Business, Calculate, Calculation, Capitalist, Communication, Company, Concern, Connection, Data, Diagram, Digital, Drawing, Earnings, Economic, Finance, Financial, Flow, Forecast, Gain, Goal, Graph, Growth, Illustration, Increase, Information, Interest, Investing, Management, Market, Money, Move, Network, Objective, Plan, Process, Profit, Progress, Report, Rise, Risk, Shares, Statistics, Stock, System, Technology

Ppt Direct Description Of Arrow Process Using Stage 3 PowerPoint Templates
PPT direct description of arrow process using stage 3 PowerPoint Templates-With this pre-designed process arrows diagram you can visualize almost any type of concept, chronological process or steps of your strategies.-PPT direct description of arrow process using stage 3 PowerPoint Templates-Arrow, Bank, Benefit, Business, Calculate, Calculation, Capitalist, Communication, Company, Concern, Connection, Data, Diagram, Digital, Drawing, Earnings, Economic, Finance, Financial, Flow, Forecast, Gain, Goal, Graph, Growth, Illustration, Increase, Information, Interest, Investing, Management, Market, Money, Move, Network, Objective, Plan, Process, Profit, Progress, Report, Rise, Risk, Shares, Statistics, Stock, System, Technology

Ppt Homogenous Way To Avoid Development Losses Four Steps PowerPoint Templates
PPT homogenous way to avoid development losses four steps PowerPoint Templates-The theme of this PowerPoint template is linear arrows. Use them to illustrate a stepwise process or a phase structure. You can easily change its colors-PPT homogenous way to avoid development losses four steps PowerPoint Templates-Arrow, Bank, Benefit, Business, Calculate, Calculation, Capitalist, Communication, Company, Concern, Connection, Data, Diagram, Digital, Drawing, Earnings, Economic, Finance, Financial, Flow, Forecast, Gain, Goal, Graph, Growth, Illustration, Increase, Information, Interest, Investing, Management, Market, Money, Move, Network, Objective, Plan, Process, Profit, Progress, Report, Rise, Risk, Shares, Statistics, Stock, System, Technology

Ppt Homogenous Way To Prevent Banking Losses Four PowerPoint Slide Numbers Templates
PPT homogenous way to prevent banking losses four powerpoint slide numbers Templates-This PowerPoint Diagram shows you the Homogenous way to prevent Banking losses or losses in Business related Activities. It is shown by different shades of Brown color. It consists of four Stages.-PPT homogenous way to prevent banking losses four powerpoint slide numbers Templates-Arrow, Bank, Benefit, Business, Calculate, Calculation, Capitalist, Communication, Company, Concern, Connection, Data, Diagram, Digital, Drawing, Earnings, Economic, Finance, Financial, Flow, Forecast, Gain, Goal, Graph, Growth, Illustration, Increase, Information, Interest, Investing, Management, Market, Money, Move, Network, Objective, Plan, Process, Profit, Progress, Report, Rise, Risk, Shares, Statistics, Stock, System, Technology

Ppt Direct Description Of Banking Process Using 3 Stages PowerPoint Templates
PPT direct description of banking process using 3 stages PowerPoint Templates-This PowerPoint Diagram shows three circular boxes on the arrow pointing towards east direction signifying he completion of the process and leading towards success.-PPT direct description of banking process using 3 stages PowerPoint Templates-Arrow, Bank, Benefit, Business, Calculate, Calculation, Capitalist, Communication, Company, Concern, Connection, Data, Diagram, Digital, Drawing, Earnings, Economic, Finance, Financial, Flow, Forecast, Gain, Goal, Graph, Growth, Illustration, Increase, Information, Interest, Investing, Management, Market, Money, Move, Network, Objective, Plan, Process, Profit, Progress, Report, Rise, Risk, Shares, Statistics, Stock, System, Technology
Internet Marketing Objectives Ppt PowerPoint Presentation Icon Images
This is a internet marketing objectives ppt powerpoint presentation icon images. This is a six stage process. The stages in this process are sales, profit, product, repeat, sales, web.
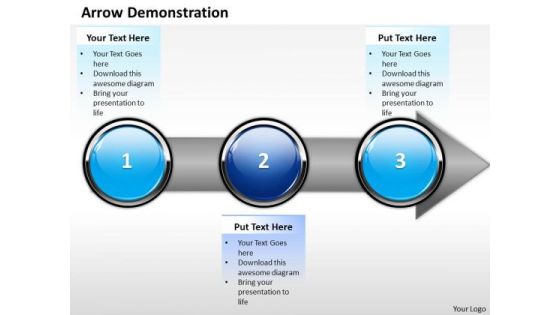
Ppt Consecutive Description Of Banking Process Using 3 State Diagram PowerPoint Templates
PPT consecutive description of banking process using 3 state diagram PowerPoint Templates-With this pre-designed process arrows diagram you can visualize almost any type of concept, chronological process or steps of your strategies.-PPT consecutive description of banking process using 3 state diagram PowerPoint Templates-Arrow, Bank, Benefit, Business, Calculate, Calculation, Capitalist, Communication, Company, Concern, Connection, Data, Diagram, Digital, Drawing, Earnings, Economic, Finance, Financial, Flow, Forecast, Gain, Goal, Graph, Growth, Illustration, Increase, Information, Interest, Investing, Management, Market, Money, Move, Network, Objective, Plan, Process, Profit, Progress, Report, Rise, Risk, Shares, Statistics, Stock, System, Technology

Ppt Direct Illustration Of Banking Process Using Stage 2 PowerPoint Templates
PPT direct illustration of banking process using stage 2 PowerPoint Templates-With this pre-designed process arrows diagram you can visualize almost any type of concept, chronological process or steps of your strategies.-PPT direct illustration of banking process using stage 2 PowerPoint Templates-Arrow, Bank, Benefit, Business, Calculate, Calculation, Capitalist, Communication, Company, Concern, Connection, Data, Diagram, Digital, Drawing, Earnings, Economic, Finance, Financial, Flow, Forecast, Gain, Goal, Graph, Growth, Illustration, Increase, Information, Interest, Investing, Management, Market, Money, Move, Network, Objective, Plan, Process, Profit, Progress, Report, Rise, Risk, Shares, Statistics, Stock, System, Technology
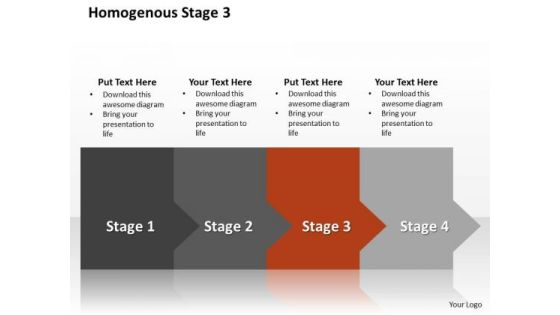
Ppt Homogenous Way To Prevent Banking Losses Stage 3 PowerPoint Templates
PPT homogenous way to prevent banking losses stage 3 PowerPoint Templates-The theme of this PowerPoint template is linear arrows. Use them to illustrate a stepwise process or a phase structure. You can easily change its colors-PPT homogenous way to prevent banking losses stage 3 PowerPoint Templates-Arrow, Bank, Benefit, Business, Calculate, Calculation, Capitalist, Communication, Company, Concern, Connection, Data, Diagram, Digital, Drawing, Earnings, Economic, Finance, Financial, Flow, Forecast, Gain, Goal, Graph, Growth, Illustration, Increase, Information, Interest, Investing, Management, Market, Money, Move, Network, Objective, Plan, Process, Profit, Progress, Report, Rise, Risk, Shares, Statistics, Stock, System, Technology
 Home
Home