AI PPT Maker
Templates
PPT Bundles
Design Services
Business PPTs
Business Plan
Management
Strategy
Introduction PPT
Roadmap
Self Introduction
Timelines
Process
Marketing
Agenda
Technology
Medical
Startup Business Plan
Cyber Security
Dashboards
SWOT
Proposals
Education
Pitch Deck
Digital Marketing
KPIs
Project Management
Product Management
Artificial Intelligence
Target Market
Communication
Supply Chain
Google Slides
Research Services
 One Pagers
All Categories
-
Home
- Customer Favorites
- Increased Profits
Increased Profits
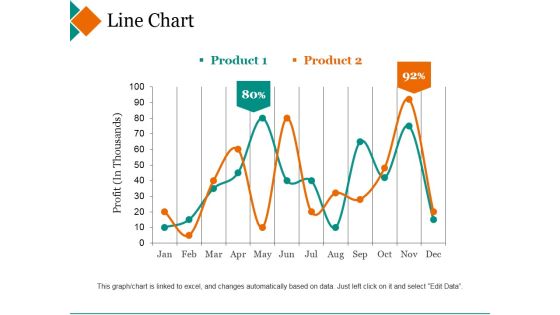
Line Chart Ppt PowerPoint Presentation Inspiration Deck
This is a line chart ppt powerpoint presentation inspiration deck. This is a two stage process. The stages in this process are product, profit, percentage, finance, line graph.

Scatter Chart Ppt PowerPoint Presentation File Visuals
This is a scatter chart ppt powerpoint presentation file visuals. This is a two stage process. The stages in this process are product, profit, in percentage, growth, success.
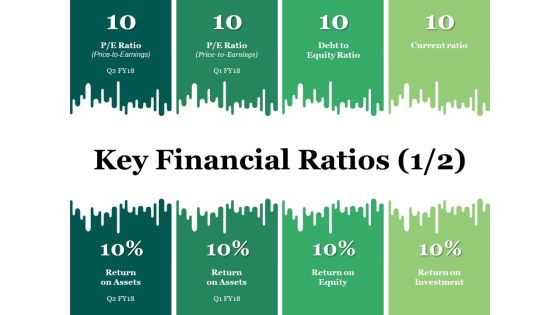
Key Financial Ratios Ppt PowerPoint Presentation Gallery Designs Download
This is a key financial ratios ppt powerpoint presentation gallery designs download. This is a four stage process. The stages in this process are liquidity, profitability, activity, solvency.

Bubble Chart Ppt PowerPoint Presentation Portfolio Files
This is a bubble chart ppt powerpoint presentation portfolio files. This is a five stage process. The stages in this process are profit, bubble chart, in percentage.

Internal Analysis Template 2 Ppt PowerPoint Presentation Infographics Graphics
This is a internal analysis template 2 ppt powerpoint presentation infographics graphics. This is a three stage process. The stages in this process are productivity, profitability, turnover.

Customer Attribution Ppt Slides Template
This is a customer attribution ppt slides template. This is a four stage process. The stages in this process are customer profitability, customer attribution, fraud detection, channel optimization.
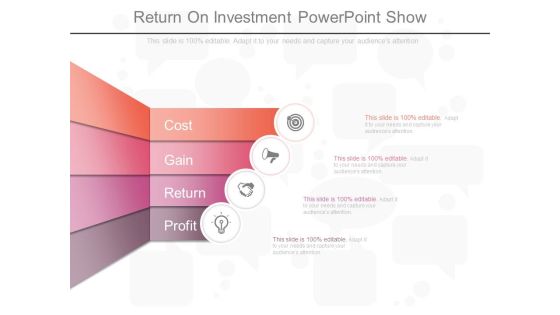
Return On Investment Powerpoint Show
This is a return on investment powerpoint show. This is a four stage process. The stages in this process are cost, gain, return, profit.

Word Of Mouth Marketing Presentation Images
This is a word of mouth marketing presentation images. This is a four stage process. The stages in this process are credibility, profitability, offline, online, service, experience.
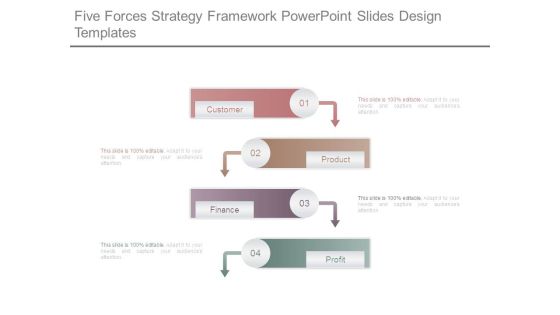
Five Forces Strategy Framework Powerpoint Slides Design Templates
This is a five forces strategy framework powerpoint slides design templates. This is a four stage process. The stages in this process are customer, product, finance, profit.
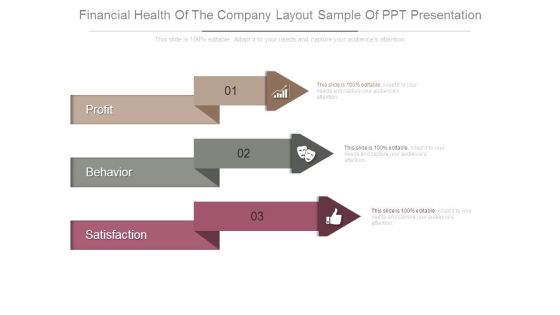
Financial Health Of The Company Layout Sample Of Ppt Presentation
This is a financial health of the company layout sample of ppt presentation. This is a three stage process. The stages in this process are profit, behavior, satisfaction.

Break Even Analysis Ppt PowerPoint Presentation Clipart
This is a break even analysis ppt powerpoint presentation clipart. This is a two stage process. The stages in this process are profit, loss, sales, units, total costs.

Key Financial Ratios Template 1 Ppt PowerPoint Presentation Backgrounds
This is a key financial ratios template 1 ppt powerpoint presentation backgrounds. This is a four stage process. The stages in this process are liquidity, profitability, activity, solvency.
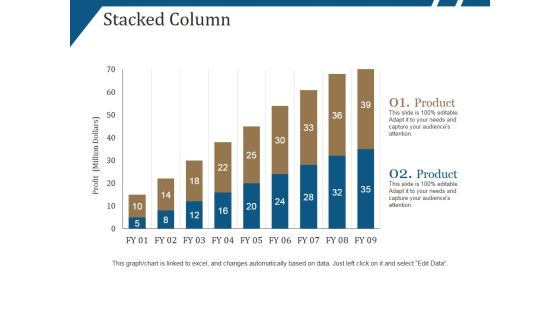
Stacked Column Ppt PowerPoint Presentation Outline Sample
This is a stacked column ppt powerpoint presentation outline sample. This is a nine stage process. The stages in this process are product, profit, growth, success.

Clustered Bar Ppt PowerPoint Presentation File Inspiration
This is a clustered bar ppt powerpoint presentation file inspiration. This is a two stage process. The stages in this process are product, profit, growth, success, graph.

Line Chart Ppt PowerPoint Presentation Visual Aids Inspiration
This is a line chart ppt powerpoint presentation visual aids inspiration. This is a two stage process. The stages in this process are product, profit, growth, decline, success.

Internal Analysis Employee Morale Ppt PowerPoint Presentation Model Template
This is a internal analysis employee morale ppt powerpoint presentation model template. This is a three stage process. The stages in this process are decrease, profitability, turnover, productivity.

Stacked Column Ppt PowerPoint Presentation Pictures Outfit
This is a stacked column ppt powerpoint presentation pictures outfit. This is a two stage process. The stages in this process are product, profit, growth, bar graph, success.

Clustered Column Ppt PowerPoint Presentation Professional Styles
This is a clustered column ppt powerpoint presentation professional styles. This is a two stage process. The stages in this process are product, profit, bar graph, growth, success.
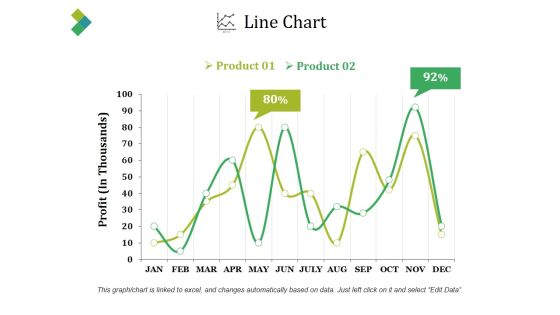
Line Chart Ppt PowerPoint Presentation Slides
This is a line chart ppt powerpoint presentation slides. This is a two stage process. The stages in this process are product, profit, percentage, finance, line chart.
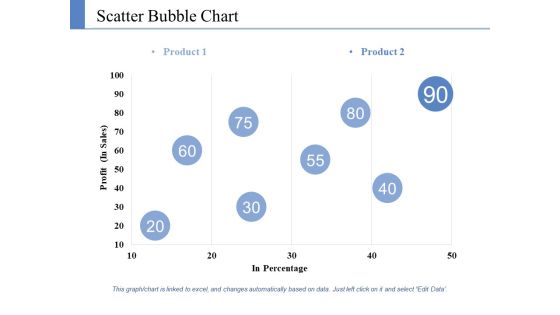
Scatter Bubble Chart Ppt PowerPoint Presentation Styles Information
This is a scatter bubble chart ppt powerpoint presentation styles information. This is a two stage process. The stages in this process are product, profit, in percentage.

Stacked Line Chart Ppt PowerPoint Presentation Styles Graphics
This is a stacked line chart ppt powerpoint presentation styles graphics. This is a two stage process. The stages in this process are product, year, profit, percentage, growth.

Clustered Bar Ppt PowerPoint Presentation Slides Deck
This is a clustered bar ppt powerpoint presentation slides deck. This is a two stage process. The stages in this process are product, profit, bar graph.

Scatter Bubble Chart Ppt PowerPoint Presentation Summary Slides
This is a scatter bubble chart ppt powerpoint presentation summary slides. This is a one stage process. The stages in this process are product, profit, in percentage.

Line Chart Ppt PowerPoint Presentation Portfolio File Formats
This is a line chart ppt powerpoint presentation portfolio file formats. This is a two stage process. The stages in this process are product, profit, line chart.

Clustered Column Ppt PowerPoint Presentation Styles Templates
This is a clustered column ppt powerpoint presentation styles templates. This is a two stage process. The stages in this process are product, profit, bar graph.

Clustered Bar Ppt PowerPoint Presentation Slides Graphic Tips
This is a clustered bar ppt powerpoint presentation slides graphic tips. This is a two stage process. The stages in this process are profit, product, clustered bar.
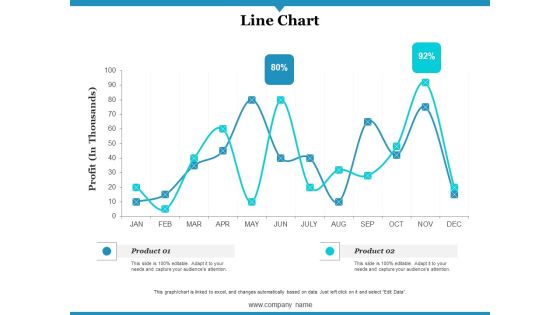
Line Chart Ppt PowerPoint Presentation Gallery Infographics
This is a line chart ppt powerpoint presentation gallery infographics. This is a two stage process. The stages in this process are profit, product, line chart.

Clustered Bar Ppt PowerPoint Presentation Styles Portfolio
This is a clustered bar ppt powerpoint presentation styles portfolio. This is a two stage process. The stages in this process are product, profit, bar graph, growth, success.

Clustered Column Ppt PowerPoint Presentation Layouts Ideas
This is a clustered column ppt powerpoint presentation layouts ideas. This is a two stage process. The stages in this process are product, profit, bar graph, growth, finance.

Clustered Column Ppt PowerPoint Presentation Show Introduction
This is a clustered column ppt powerpoint presentation show introduction. This is a two stage process. The stages in this process are product, profit, bar graph.

Clustered Bar Ppt PowerPoint Presentation Layouts Professional
This is a clustered bar ppt powerpoint presentation layouts professional. This is a two stage process. The stages in this process are clustered bar, product, profit, percentage.
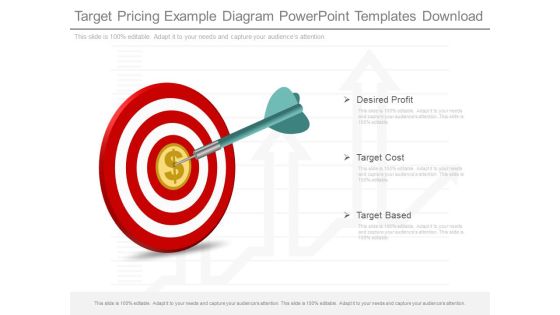
Target Pricing Example Diagram Powerpoint Templates Download
This is a target pricing example diagram powerpoint templates download. This is a three stage process. The stages in this process are desired profit, target cost, target based.

Images Of Business People 3d Men With Bar Graph Making Effort PowerPoint Templates
We present our images of business people 3d men with bar graph making effort PowerPoint templates.Use our People PowerPoint Templates because You canTake a leap off the starting blocks with our PowerPoint Templates and Slides. They will put you ahead of the competition in quick time. Present our Business PowerPoint Templates because our PowerPoint Templates and Slides are the string of your bow. Fire of your ideas and conquer the podium. Use our Marketing PowerPoint Templates because They will Put the wind in your sails. Skim smoothly over the choppy waters of the market. Use our Teamwork PowerPoint Templates because Our PowerPoint Templates and Slides will steer your racing mind. Hit the right buttons and spur on your audience. Download and present our Shapes PowerPoint Templates because Our PowerPoint Templates and Slides will let you Hit the target. Go the full distance with ease and elan.Use these PowerPoint slides for presentations relating to 3d, abstract, accounting, achievement, bar graph, business, cartoon, concept, financial, goal, gold, golden, graph, growth, help, icon, lifting, bar, market, meeting, men, partnership, people, presentation, profits, progress, report, strength, team, teamwork. The prominent colors used in the PowerPoint template are Green, Blue, White.

Advances In Strategic Management Ppt Presentation
This is an advances in strategic management ppt presentation. This is a four stage process. The stages in this process are future source of profit, business environment, technology, demands of society.
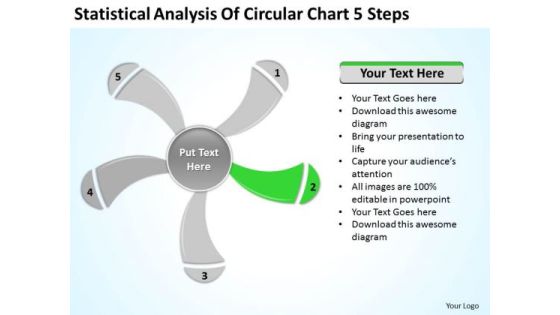
Statistical Analysis Of Circular Chart 5 Steps Ppt Business Plan PowerPoint Slide
We present our statistical analysis of circular chart 5 steps ppt business plan PowerPoint Slide.Download and present our Business PowerPoint Templates because Our PowerPoint Templates and Slides will definately Enhance the stature of your presentation. Adorn the beauty of your thoughts with their colourful backgrounds. Use our Signs PowerPoint Templates because Our PowerPoint Templates and Slides will give good value for money. They also have respect for the value of your time. Download our Shapes PowerPoint Templates because Our PowerPoint Templates and Slides team portray an attitude of elegance. Personify this quality by using them regularly. Use our Metaphors-Visual Concepts PowerPoint Templates because Our PowerPoint Templates and Slides will effectively help you save your valuable time. They are readymade to fit into any presentation structure. Use our Process and Flows PowerPoint Templates because our PowerPoint Templates and Slides are the string of your bow. Fire of your ideas and conquer the podium.Use these PowerPoint slides for presentations relating to graphically, graphic, vector, layout, business, computation, sign, infochart, visual, symbol, template, diagram, calculations, sector, data, revenue, schedule, element, analysis, drawing, report, technology, contour, classification, graph, modern, illustration, icon, comparison, object, chart, collection, science, color, growth, composition, professional, set, education, math, profits, information, symmetry, statistic, structure, infographics, button. The prominent colors used in the PowerPoint template are Green, Gray, White.
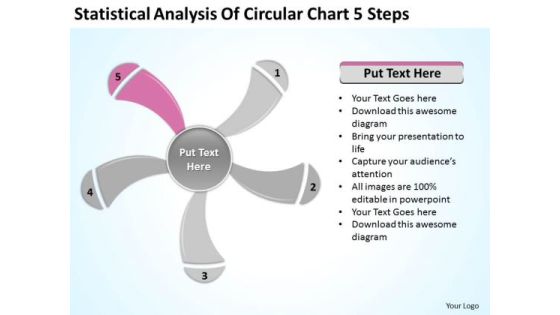
Statistical Analysis Of Circular Chart 5 Steps Ppt Outline For Business Plan PowerPoint Slides
We present our statistical analysis of circular chart 5 steps ppt outline for business plan PowerPoint Slides.Present our Business PowerPoint Templates because Our PowerPoint Templates and Slides will definately Enhance the stature of your presentation. Adorn the beauty of your thoughts with their colourful backgrounds. Download our Signs PowerPoint Templates because They will Put the wind in your sails. Skim smoothly over the choppy waters of the market. Download our Shapes PowerPoint Templates because Our PowerPoint Templates and Slides come in all colours, shades and hues. They help highlight every nuance of your views. Download and present our Metaphors-Visual Concepts PowerPoint Templates because Our PowerPoint Templates and Slides will let your words and thoughts hit bullseye everytime. Download and present our Process and Flows PowerPoint Templates because Our PowerPoint Templates and Slides will help you be quick off the draw. Just enter your specific text and see your points hit home.Use these PowerPoint slides for presentations relating to graphically, graphic, vector, layout, business, computation, sign, infochart, visual, symbol, template, diagram, calculations, sector, data, revenue, schedule, element, analysis, drawing, report, technology, contour, classification, graph, modern, illustration, icon, comparison, object, chart, collection, science, color, growth, composition, professional, set, education, math, profits, information, symmetry, statistic, structure, infographics, button. The prominent colors used in the PowerPoint template are Pink, Gray, White.

API Integration Software Development Financial Highlights After API Implementation Structure PDF
Presenting this set of slides with name api integration software development financial highlights after api implementation structure pdf. The topics discussed in these slides are revenue, gross profit, net profit. This is a completely editable PowerPoint presentation and is available for immediate download. Download now and impress your audience.

API Integration Software Development Financial Highlights Before API Implementation Template PDF
Presenting this set of slides with name api integration software development financial highlights before api implementation template pdf. The topics discussed in these slides are revenue, gross profit, net profit. This is a completely editable PowerPoint presentation and is available for immediate download. Download now and impress your audience.
Growth Trend Analysis With Upward Arrow Icon Icons PDF
Presenting Growth Trend Analysis With Upward Arrow Icon Icons PDF to dispense important information. This template comprises Four stages. It also presents valuable insights into the topics including Growth Trend, Analysis Upward, Arrow Icon This is a completely customizable PowerPoint theme that can be put to use immediately. So, download it and address the topic impactfully.

Statistical Analysis Of Circular Chart 5 Steps Ppt Business Plan PowerPoint Slides
We present our statistical analysis of circular chart 5 steps ppt business plan PowerPoint Slides.Download and present our Business PowerPoint Templates because Timeline crunches are a fact of life. Meet all deadlines using our PowerPoint Templates and Slides. Present our Signs PowerPoint Templates because You can Zap them with our PowerPoint Templates and Slides. See them reel under the impact. Use our Shapes PowerPoint Templates because It can Bubble and burst with your ideas. Download our Metaphors-Visual Concepts PowerPoint Templates because You can Create a matrix with our PowerPoint Templates and Slides. Feel the strength of your ideas click into place. Present our Process and Flows PowerPoint Templates because Our PowerPoint Templates and Slides has conjured up a web of all you need with the help of our great team. Use them to string together your glistening ideas.Use these PowerPoint slides for presentations relating to graphically, graphic, vector, layout, business, computation, sign, infochart, visual, symbol, template, diagram, calculations, sector, data, revenue, schedule, element, analysis, drawing, report, technology, contour, classification, graph, modern, illustration, icon, comparison, object, chart, collection, science, color, growth, composition, professional, set, education, math, profits, information, symmetry, statistic, structure, infographics, button. The prominent colors used in the PowerPoint template are Yellow, Gray, White.
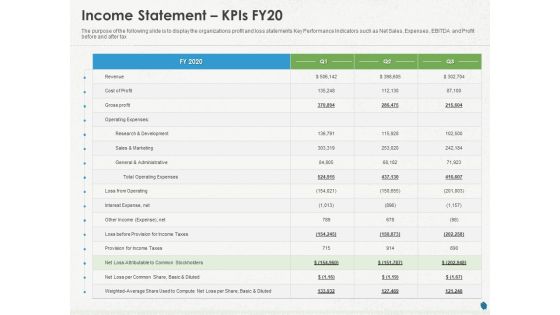
Distressed Debt Refinancing For Organizaton Income Statement Kpis FY20 Ppt PowerPoint Presentation File Images PDF
Presenting this set of slides with name distressed debt refinancing for organizaton income statement kpis fy20 ppt powerpoint presentation file images pdf. The topics discussed in these slides are revenue, cost profit, gross profit, research and development, sales, marketing. This is a completely editable PowerPoint presentation and is available for immediate download. Download now and impress your audience.
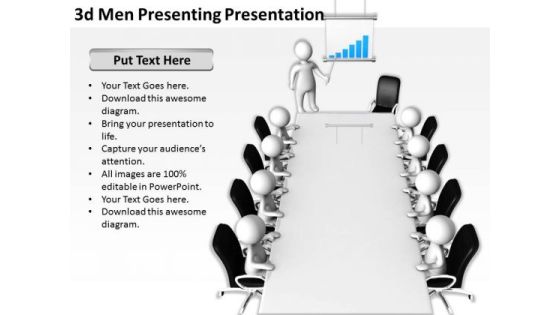
Business People Walking 3d Men Presenting Pressentation PowerPoint Templates
We present our business people walking 3d men presenting pressentation PowerPoint templates.Present our People PowerPoint Templates because Our PowerPoint Templates and Slides are created by a hardworking bunch of busybees. Always flitting around with solutions gauranteed to please. Download our Business PowerPoint Templates because Our PowerPoint Templates and Slides will provide you the cutting edge. Slice through the doubts in the minds of your listeners. Present our Education PowerPoint Templates because Our PowerPoint Templates and Slides are created by a hardworking bunch of busybees. Always flitting around with solutions gauranteed to please. Use our Future PowerPoint Templates because It will let you Set new benchmarks with our PowerPoint Templates and Slides. They will keep your prospects well above par. Use our Success PowerPoint Templates because Our PowerPoint Templates and Slides will let you Hit the right notes. Watch your audience start singing to your tune.Use these PowerPoint slides for presentations relating to 3d, arrow, background, blank, business, businessman, cartoon, character, chart,communication, computer, consultant, cute, discussion, easel, expertise, figure,figurine, flipchart, graph, man, growing, ideas, illustration, laptop,leadership, man, manager, meeting, notebook, notepad, pad, paper, pen, person,plan, pointer, pointing, presentation, profitable, profits, render, rendering, speaker,speech, table, white, whiteboard. The prominent colors used in the PowerPoint template are White, Blue, Gray. We assure you our business people walking 3d men presenting pressentation PowerPoint templates are visually appealing. You can be sure our background PowerPoint templates and PPT Slides will make you look like a winner. Use our business people walking 3d men presenting pressentation PowerPoint templates will make the presenter look like a pro even if they are not computer savvy. We assure you our chart PowerPoint templates and PPT Slides are the best it can get when it comes to presenting. Use our business people walking 3d men presenting pressentation PowerPoint templates provide you with a vast range of viable options. Select the appropriate ones and just fill in your text. Professionals tell us our businessman PowerPoint templates and PPT Slides are incredible easy to use.

Business Growth Bar Graph PowerPoint Templates Ppt Backgrounds For Slides 0313
We present our Business Growth Bar Graph PowerPoint Templates PPT Backgrounds For Slides 0313.Download our Process and Flows PowerPoint Templates because You can Double your output with our PowerPoint Templates and Slides. They make beating deadlines a piece of cake. Download and present our Success PowerPoint Templates because Our PowerPoint Templates and Slides will give good value for money. They also have respect for the value of your time. Download our Business PowerPoint Templates because Our PowerPoint Templates and Slides will generate and maintain the level of interest you desire. They will create the impression you want to imprint on your audience. Download our Shapes PowerPoint Templates because Our PowerPoint Templates and Slides provide you with a vast range of viable options. Select the appropriate ones and just fill in your text. Use our Future PowerPoint Templates because Timeline crunches are a fact of life. Meet all deadlines using our PowerPoint Templates and Slides.Use these PowerPoint slides for presentations relating to Business graph showing profits, business, process and flows, success, future, shapes. The prominent colors used in the PowerPoint template are Pink, Green, Yellow.

Business Assessment Outline Markup Pricing Ppt Icon Model PDF
Deliver and pitch your topic in the best possible manner with this business assessment outline markup pricing ppt icon model pdf. Use them to share invaluable insights on income, cost goods sold, gross profit, overhead, sum overhead profit, gross margin, markup and impress your audience. This template can be altered and modified as per your expectations. So, grab it now.

Business Framework Key Metrics Required For Different Company Situations PowerPoint Presentation
This diagram has been designed with framework of key metrics required for different company situations. This diagram contains rectangle of operating value drivers with four sections inside it representing terms like growth of net Income, multiyear DCF of economic profit, net income, return on sales, ROIC-WACC, and economic profit. Use this as a major element in streamlining any business process.

Business Operations Assessment Financial Planning Template Ppt Summary Show PDF
Deliver an awe-inspiring pitch with this creative business operations assessment financial planning template ppt summary show pdf bundle. Topics like revenues, gross profit, planning, gross profit, products and services can be discussed with this completely editable template. It is available for immediate download depending on the needs and requirements of the user.
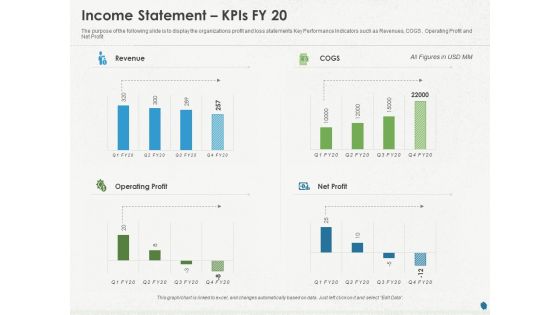
Distressed Debt Refinancing For Organizaton Income Statement Kpis FY 20 Ppt PowerPoint Presentation Model Guide PDF
Presenting this set of slides with name distressed debt refinancing for organizaton income statement kpis fy 20 ppt powerpoint presentation model guide pdf. The topics discussed in these slides are revenue, cogs, operating profit, net profit. This is a completely editable PowerPoint presentation and is available for immediate download. Download now and impress your audience.

Ways To Bounce Back From Insolvency Income Statement Graphical Presentation Slides PDF
Presenting this set of slides with name ways to bounce back from insolvency income statement graphical presentation slides pdf. The topics discussed in these slides are revenue, operating profit, net profit. This is a completely editable PowerPoint presentation and is available for immediate download. Download now and impress your audience.

Issues Which Leads To Insolvency Income Statement Graphical Presentation Download PDF
Presenting this set of slides with name issues which leads to insolvency income statement graphical presentation download pdf. The topics discussed in these slides are revenue, operating profit, net profit. This is a completely editable PowerPoint presentation and is available for immediate download. Download now and impress your audience.

Corporate Debt Refinancing And Restructuring Income Statement Kpis FY 20 Pictures PDF
Presenting this set of slides with name corporate debt refinancing and restructuring income statement kpis fy 20 pictures pdf. The topics discussed in these slides are revenue, cogs, operating profit, net profit. This is a completely editable PowerPoint presentation and is available for immediate download. Download now and impress your audience.

Income Statement Graphical Representation Company Profile Ppt Infographic Template Guidelines PDF
Deliver an awe inspiring pitch with this creative income statement graphical representation company profile ppt infographic template guidelines pdf bundle. Topics like operating profit, net profit, revenue, cogs can be discussed with this completely editable template. It is available for immediate download depending on the needs and requirements of the user.

Business Evacuation Plan Firm Financial Performance Ppt PowerPoint Presentation Professional Inspiration PDF
Presenting this set of slides with name business evacuation plan firm financial performance ppt powerpoint presentation professional inspiration pdf. The topics discussed in these slides are revenues, gross profit, net profit, earnings per share. This is a completely editable PowerPoint presentation and is available for immediate download. Download now and impress your audience.

Accounting Bookkeeping Services Income Statement Analysis With Comparison For Two Years Rules PDF
Presenting this set of slides with name accounting bookkeeping services income statement analysis with comparison for two years rules pdf. The topics discussed in these slides are cost, expenses, administrative, gross profit, operating profit. This is a completely editable PowerPoint presentation and is available for immediate download. Download now and impress your audience.

BPO Managing Enterprise Financial Transactions Income Statement Analysis With Comparison For Two Years Ideas PDF
Presenting this set of slides with name bpo managing enterprise financial transactions income statement analysis with comparison for two years ideas pdf. The topics discussed in these slides are cost, expenses, administrative, gross profit, operating profit. This is a completely editable PowerPoint presentation and is available for immediate download. Download now and impress your audience.
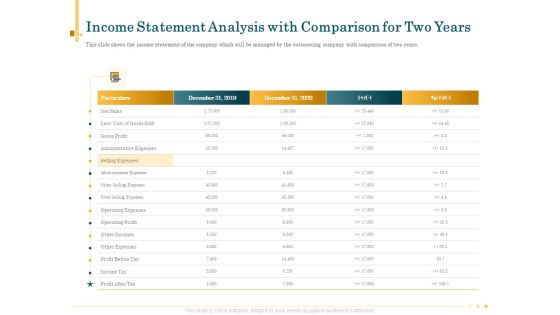
Outsource Bookkeeping Service Manage Financial Transactions Income Statement Analysis Comparison Two Years Mockup PDF
Presenting this set of slides with name outsource bookkeeping service manage financial transactions income statement analysis comparison two years mockup pdf. The topics discussed in these slides are cost, expenses, administrative, gross profit, operating profit. This is a completely editable PowerPoint presentation and is available for immediate download. Download now and impress your audience.

Outsourcing Finance Accounting Processes Income Statement Analysis With Comparison For Two Years Template PDF
Presenting this set of slides with name outsourcing finance accounting processes income statement analysis with comparison for two years template pdf. The topics discussed in these slides are cost, expenses, administrative, gross profit, operating profit. This is a completely editable PowerPoint presentation and is available for immediate download. Download now and impress your audience.

Quarterly And Annual Business Review Ppt PowerPoint Presentation Graphics
This is a quarterly and annual business review ppt powerpoint presentation graphics. This is a five stage process. The stages in this process are cost of sales, gross profit, customer acquisition cost, other operating cost expense, operating profit, change in cash, ending cash.
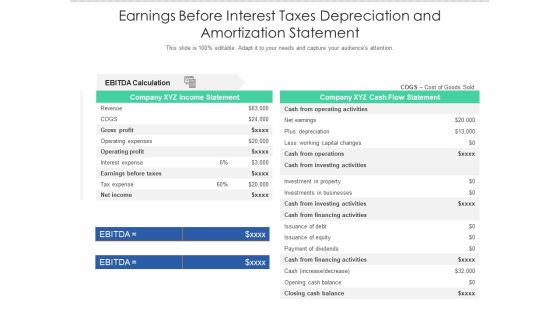
Earnings Before Interest Taxes Depreciation And Amortization Statement Ppt PowerPoint Presentation Pictures Introduction PDF
Showcasing this set of slides titled earnings before interest taxes depreciation and amortization statement ppt powerpoint presentation pictures introduction pdf. The topics addressed in these templates are revenue, gross profit, operating profit. All the content presented in this PPT design is completely editable. Download it and make adjustments in color, background, font etc. as per your unique business setting.

In Depth Business Assessment Financial Planning Template Ppt Portfolio Slide PDF
Deliver an awe-inspiring pitch with this creative in depth business assessment financial planning template ppt portfolio slide pdf bundle. Topics like revenues, gross profit, planning, gross profit, products and services can be discussed with this completely editable template. It is available for immediate download depending on the needs and requirements of the user.
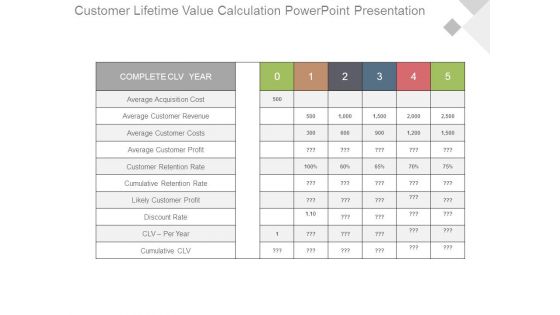
Customer Lifetime Value Calculation Powerpoint Presentation
This is a customer lifetime value calculation powerpoint presentation. This is a five stage process. The stages in this process are complete clv year, average acquisition cost, average customer revenue, average customer costs, average customer profit, customer retention rate, cumulative retention rate, likely customer profit, discount rate, clv per year, cumulative clv.

Customer Lifetime Value Table Ppt Samples
This is a customer lifetime value table ppt samples. This is a five stage process. The stages in this process are complete clv year, average acquisition cost, average customer revenue, average customer costs, average customer profit, customer retention rate, likely customer profit, discount rate, clv per year, cumulative clv, cumulative retention rate.

Calculating Customer Lifetime Value Clv Ppt PowerPoint Presentation Summary
This is a calculating customer lifetime value clv ppt powerpoint presentation summary. This is a five stage process. The stages in this process are complete clv, average acquisition cost, average customer revenue, average customer costs, average customer profit, customer retention rate, likely customer profit.

Calculating Customer Lifetime Value Clv Chart Powerpoint Templates
This is a calculating customer lifetime value clv chart powerpoint templates. This is a five stage process. The stages in this process are complete clv year, average acquisition cost, average customer revenue, average customer costs, average customer profit, customer retention rate, cumulative retention rate, likely customer profit, discount rate, clv per year, cumulative clv.
Average Calculating Customer Lifetime Value Clv Table Ppt Icon
This is a average calculating customer lifetime value clv table ppt icon. This is a five stage process. The stages in this process are complete clv year, average acquisition cost, average customer revenue, average customer costs, average customer profit, customer retention rate, cumulative retention rate, likely customer profit, discount rate, clv per year, cumulative clv.
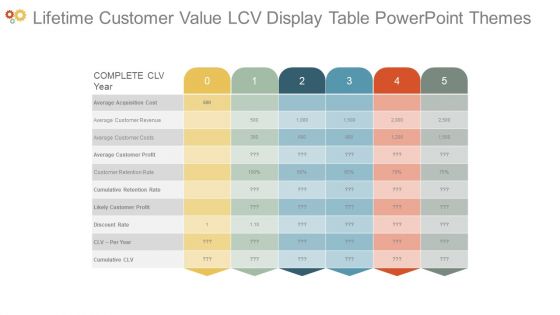
Lifetime Customer Value Lcv Display Table Powerpoint Themes
This is a lifetime customer value lcv display table powerpoint themes. This is a five stage process. The stages in this process are complete clv year, average acquisition cost, average customer revenue, average customer costs, average customer profit, customer retention rate, cumulative retention rate, likely customer profit, discount rate, clv per year, cumulative clv.

Customer Lifetime Value Clv Calculation Table Sample Ppt Presentation
This is a customer lifetime value clv calculation table sample ppt presentation. This is a five stage process. The stages in this process are complete clv year, average acquisition cost, average customer revenue, average customer costs, average customer profit, customer retention rate, cumulative retention rate, likely customer profit, discount rate, clv per year, cumulative clv.

Calculating Customer Lifetime Value Clv Analysis Table Example Of Ppt
This is a calculating customer lifetime value clv analysis table example of ppt. This is a five stage process. The stages in this process are complete clv year, average acquisition cost, average customer revenue, average customer costs, average customer profit, customer retention rate, likely customer profit, discount rate.

Calculating Customer Lifetime Value Clv Ppt PowerPoint Presentation Styles Good
This is a calculating customer lifetime value clv ppt powerpoint presentation styles good. This is a five stage process. The stages in this process are average acquisition cost, average customer revenue, average customer costs, average customer profit, customer retention rate, cumulative retention rate, likely customer profit.

Enterprise Management Markup Pricing Download PDF
Deliver and pitch your topic in the best possible manner with this enterprise management markup pricing download pdf. Use them to share invaluable insights on income, gross profit, overhead, profit, cost of goods sold and impress your audience. This template can be altered and modified as per your expectations. So, grab it now.

Administrative Regulation Markup Pricing Ppt PowerPoint Presentation Outline Ideas PDF
Deliver and pitch your topic in the best possible manner with this administrative regulation markup pricing ppt powerpoint presentation outline ideas pdf. Use them to share invaluable insights on income, profit, cost goods sold, gross profit, gross margin and impress your audience. This template can be altered and modified as per your expectations. So, grab it now.
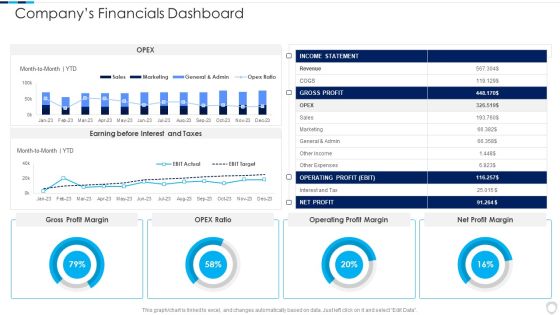
Financial Report Of An IT Firm Companys Financials Dashboard Infographics PDF
Deliver an awe inspiring pitch with this creative Financial Report Of An IT Firm Companys Financials Dashboard Infographics PDF bundle. Topics like Operating Profit, Gross Profit, Income Statement can be discussed with this completely editable template. It is available for immediate download depending on the needs and requirements of the user.
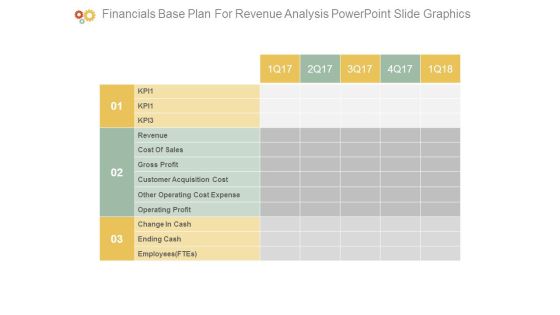
Financials Base Plan For Revenue Analysis Powerpoint Slide Graphics
This is a financials base plan for revenue analysis powerpoint slide graphics. This is a three stage process. The stages in this process are kp, revenue, cost of sales, gross profit, customer acquisition cost, other operating cost expense, operating profit, change in cash, ending cash, employees ftes.
Gross And Net Revenue Comparison Shown By Graph Ppt PowerPoint Presentation File Icons PDF
Presenting this set of slides with name gross and net revenue comparison shown by graph ppt powerpoint presentation file icons pdf. The topics discussed in these slides are gross profit, net profit. This is a completely editable PowerPoint presentation and is available for immediate download. Download now and impress your audience.

Costing And Monitoring Of Activities Ppt PowerPoint Presentation Professional Elements PDF
Presenting this set of slides with name costing and monitoring of activities ppt powerpoint presentation professional elements pdf. The topics discussed in these slides are selling price, indirect costs, net profit, indirect costs, gross profit, revenue. This is a completely editable PowerPoint presentation and is available for immediate download. Download now and impress your audience.
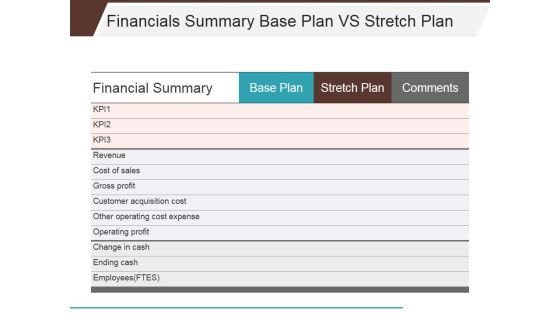
Financials Summary Base Plan Vs Stretch Plan Ppt PowerPoint Presentation Infographics Themes
This is a financials summary base plan vs stretch plan ppt powerpoint presentation infographics themes. This is a three stage process. The stages in this process are revenue, cost of sales, gross profit, customer acquisition cost, other operating cost expense, operating profit.

API Management For Building Software Applications Financial Highlights After API Implementation Brochure PDF
Presenting this set of slides with name api management for building software applications financial highlights after api implementation brochure pdf. The topics discussed in these slides are net profit, key takeaways, revenue, gross profit. This is a completely editable PowerPoint presentation and is available for immediate download. Download now and impress your audience.

API Management For Building Software Applications Financial Highlights Before API Implementation Summary PDF
Presenting this set of slides with name api management for building software applications financial highlights before api implementation summary pdf. The topics discussed in these slides are net profit, key takeaways, revenue, gross profit. This is a completely editable PowerPoint presentation and is available for immediate download. Download now and impress your audience.

Firm Capability Assessment Pandl Kpis Tabular Form Ppt Infographic Template Inspiration PDF
Presenting this set of slides with name firm capability assessment pandl kpis tabular form ppt infographic template inspiration pdf. The topics discussed in these slides are revenue, net profit, operating profit, cogs. This is a completely editable PowerPoint presentation and is available for immediate download. Download now and impress your audience.

Deal Assessment Audit Process P And L Kpis Download PDF
Deliver and pitch your topic in the best possible manner with this deal assessment audit process p and l kpis download pdf. Use them to share invaluable insights on operating profit, net profit, revenue, cogs and impress your audience. This template can be altered and modified as per your expectations. So, grab it now.

Administrative Regulation Financial Planning Template Ppt PowerPoint Presentation Layouts Information PDF
Deliver an awe-inspiring pitch with this creative administrative regulation financial planning template ppt powerpoint presentation layouts information pdf bundle. Topics like revenues, gross profit, planning, gross profit, products and services can be discussed with this completely editable template. It is available for immediate download depending on the needs and requirements of the user.
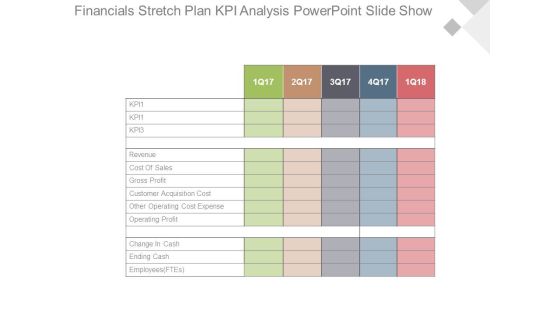
Financials Stretch Plan Kpi Analysis Powerpoint Slide Show
This is a financials stretch plan kpi analysis powerpoint slide show. This is a five stage process. The stages in this process are kpi1, kpi1, kpi3, revenue, cost of sales, gross profit, customer acquisition cost, other operating cost expense, operating profit, change in cash, ending cash, employees ftes.

Financials Summary With Kpi Base Plan Vs Stretch Plan Powerpoint Slides
This is a financials summary with kpi base plan vs stretch plan powerpoint slides. This is a four stage process. The stages in this process are financials summary, base plan, stretch plan, comments, kpi 1, kpi 3, revenue, cost of sales, gross profit, customer acquisition cost, other operating expense, operating profit, change in cash, ending cash, employees ftes.
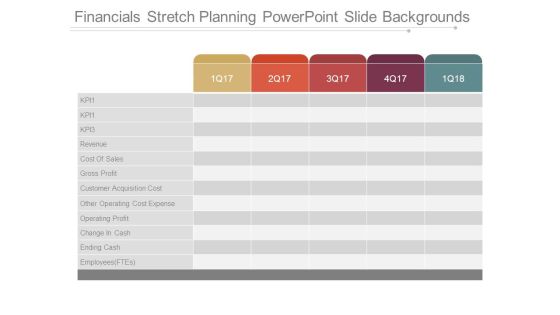
Financials Stretch Planning Powerpoint Slide Backgrounds
This is a financials stretch planning powerpoint slide backgrounds. This is a five stage process. The stages in this process are kp, revenue, cost of sales, gross profit, customer acquisition cost, other operating cost expense, operating profit, change in cash, ending cash, employees ftes.

Financials Summary Base Plan Vs Stretch Plan Powerpoint Slide Information
This is a financials summary base plan vs stretch plan powerpoint slide information. This is a three stage process. The stages in this process are base plan, stretch plan, comments, kp, revenue, cost of sales, gross profit, customer acquisition cost, other operating expense, operating profit, change in cash, ending cash, employees ftes.

Financials Base Plan Table Chart Ppt Slide Templates
This is a financials base plan table chart ppt slide templates. This is a five stage process. The stages in this process are kpi, revenue, cost of sales, gross profit, customer acquisition cost, other operating cost expense, operating profit, change in cash, ending cash, employees ftes.
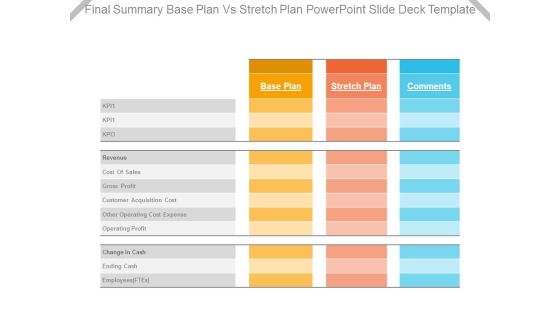
Final Summary Base Plan Vs Stretch Plan Powerpoint Slide Deck Template
This is a final summary base plan vs stretch plan powerpoint slide deck template. This is a three stage process. The stages in this process are kpi, revenue, cost of sales, gross profit, customer acquisition cost, other operating cost expense, operating profit, change in cash, ending cash, employees ftes.
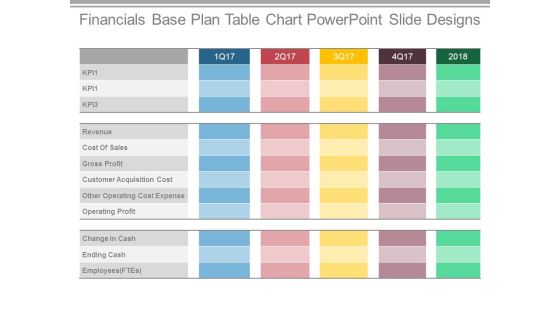
Financials Base Plan Table Chart Powerpoint Slide Designs
This is a financials base plan table chart powerpoint slide designs. This is a five stage process. The stages in this process are revenue, cost of sales, gross profit, customer acquisition cost, other operating cost expense, operating profit, change in cash, ending cash.
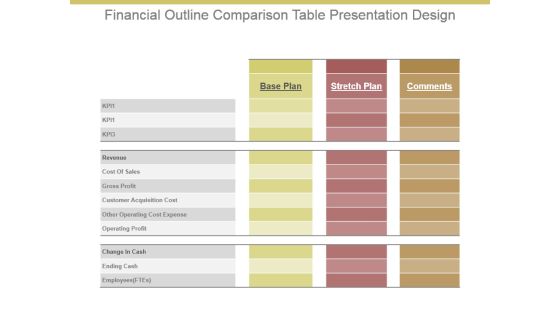
Financial Outline Comparison Table Presentation Design
This is a financial outline comparison table presentation design. This is a three stage process. The stages in this process are base plan, stretch plan, comments, kp, revenue, cost of sales, gross profit, customer acquisition cost, other operating cost expense, operating profit, change in cash, ending cash, employees ftes.
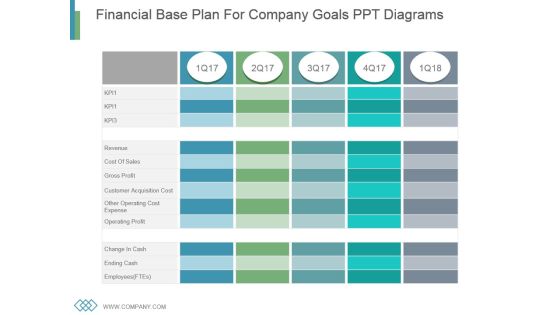
Financial Base Plan For Company Goals Ppt Diagrams
This is a financial base plan for company goals ppt diagrams. This is a five stage process. The stages in this process are revenue, cost of sales, gross profit, customer acquisition cost, other operating cost expense, operating profit, change in cash, ending cash, employees.
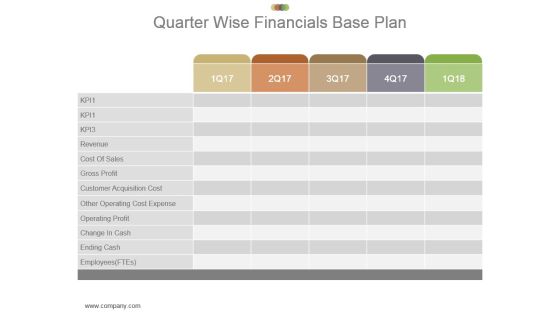
Quarter Wise Financials Base Plan Powerpoint Slide Show
This is a quarter wise financials base plan powerpoint slide show. This is a five stage process. The stages in this process are employees, ending cash, change in cash, operating profit, other operating cost expense, customer acquisition cost, gross profit, cost of sales, revenue.

Financials Stretch Plan Data Powerpoint Slide Backgrounds
This is a financials stretch plan data powerpoint slide backgrounds. This is a three stage process. The stages in this process are employees, ending cash, change in cash, operating profit, other operating cost expense, customer acquisition cost, gross profit, cost of sales, revenue.
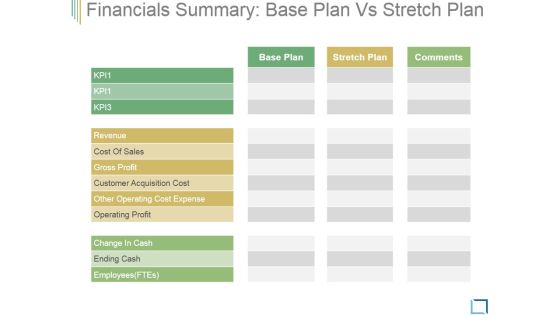
Financials Summary Base Plan Vs Stretch Plan Ppt PowerPoint Presentation Visuals
This is a financials summary base plan vs stretch plan ppt powerpoint presentation visuals. This is a three stage process. The stages in this process are revenue, cost of sales, gross profit, customer acquisition cost, other operating cost expense, operating profit, change in cash.
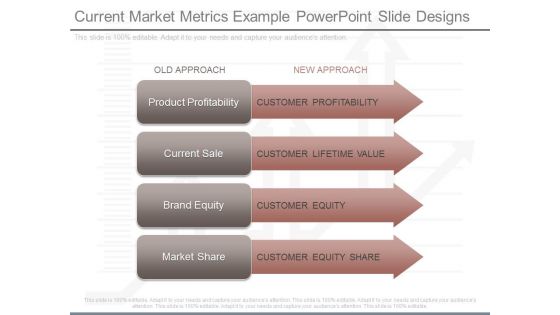
Current Market Metrics Example Powerpoint Slide Designs
This is a current market metrics example powerpoint slide designs. This is a four stage process. The stages in this process are old approach, new approach, product profitability, customer profitability, current sale, customer lifetime value, brand equity, customer equity, market share, customer equity share.
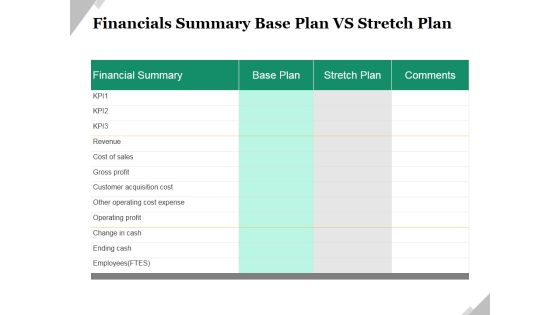
Financials Summary Base Plan Vs Stretch Plan Ppt PowerPoint Presentation Slides Information
This is a financials summary base plan vs stretch plan ppt powerpoint presentation slides information. This is a two stage process. The stages in this process are revenue, cost of sales, gross profit, customer acquisition cost, other operating cost expense, operating profit.

Quarter Based Finance Review Kpi Ppt PowerPoint Presentation Background Designs
This is a quarter based finance review kpi ppt powerpoint presentation background designs. This is a five stage process. The stages in this process are cost of sales, gross profit, customer acquisition cost, other operating cost expense, operating profit, change in cash, ending cash.

Consumer Strategy Pyramid With Icons Ppt PowerPoint Presentation Background Designs
Presenting this set of slides with name consumer strategy pyramid with icons ppt powerpoint presentation background designs. This is a four stage process. The stages in this process are customers are most profitable, customers are least profitable. This is a completely editable PowerPoint presentation and is available for immediate download. Download now and impress your audience.
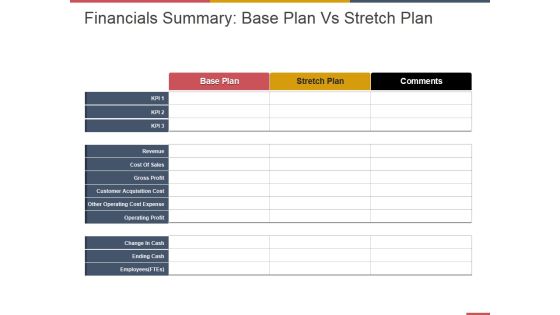
Financials Summary Base Plan Vs Stretch Plan Ppt PowerPoint Presentation Layouts Graphic Tips
This is a financials summary base plan vs stretch plan ppt powerpoint presentation layouts graphic tips. This is a three stage process. The stages in this process are cost of sales, gross profit, customer acquisition cost, other operating cost expense, operating profit.

Competitor Analysis Comparison Table Ppt PowerPoint Presentation Outline Slides
This is a competitor analysis comparison table ppt powerpoint presentation outline slides. This is a two stage process. The stages in this process are revenue, profit, market share, main activity, number of employee, product quality.

Business Software Development Company Profile Executive Summary Introduction PDF
The slide showcases the brief company highlights illustrating company details, key financials for current year revenue, gross profit, operating profit, EBITDA and Net Profit. It also depicts satisfaction rate, and global market share. Deliver an awe inspiring pitch with this creative Business Software Development Company Profile Executive Summary Introduction PDF bundle. Topics like Key Financials US Dollar, Market Leader, Inception Year 2000 can be discussed with this completely editable template. It is available for immediate download depending on the needs and requirements of the user.

Industry Cost Structure Template 1 Ppt PowerPoint Presentation Guidelines
This is a industry cost structure template 1 ppt powerpoint presentation guidelines. This is a seven stage process. The stages in this process are profit, marketing, rent and utilities, purchases, wages, other, depreciation.
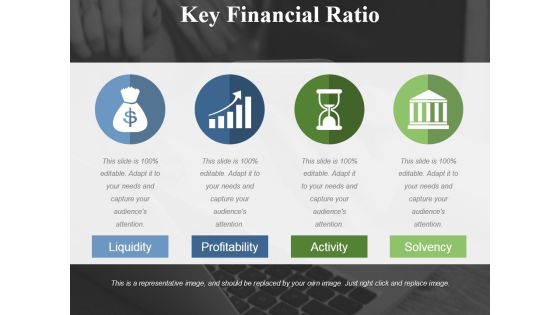
Key Financial Ratio Template 3 Ppt PowerPoint Presentation Outline Clipart Images
This is a key financial ratio template 3 ppt powerpoint presentation outline clipart images. This is a four stage process. The stages in this process are liquidity, profitability, activity, solvency.

Executive Sponsorship Ppt Powerpoint Guide
This is a executive sponsorship ppt powerpoint guide. This is a six stage process. The stages in this process are corporate culture, collaborative profit, continuous improvement, behaviors and reputation, business processes, executive sponsorship.

Marketing Objectives Diagram Presentation Portfolio
This is a marketing objectives diagram presentation portfolio. This is a six stage process. The stages in this process are diversification, human resource, finance, improving profitability, corporate objectives, market share.

Purchasing Policy Ppt Layout Ppt Background Graphics
This is a purchasing policy ppt layout ppt background graphics. This is a seven stage process. The stages in this process are purchase requisition, order placement, shipment tracking, quality products, profitability, rebates, improved pricing.

Employee Leasing Services Template Presentation Graphics
This is a employee leasing services template presentation graphics. This is a six stage process. The stages in this process are improve profitability, better productivity, reduced liabilities, relief from employment, personnel management solution, better employment practices.
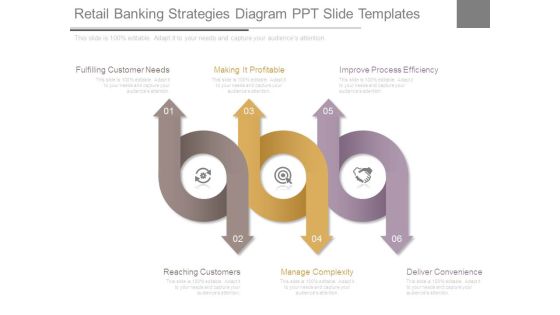
Retail Banking Strategies Diagram Ppt Slide Templates
This is a retail banking strategies diagram ppt slide templates. This is a six stage process. The stages in this process are fulfilling customer needs, making it profitable, improve process efficiency, reaching customers, manage complexity, deliver convenience.
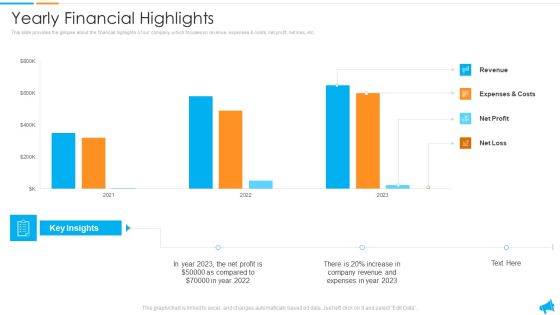
Strategy For Regional Economic Progress Outlining Yearly Financial Highlights Professional PDF
This slide provides the glimpse about the financial highlights of our company which focuses on revenue, expenses and costs, net profit, net loss, etc. Deliver an awe inspiring pitch with this creative strategy for regional economic progress outlining yearly financial highlights professional pdf bundle. Topics like revenue, expenses, net profit, costs can be discussed with this completely editable template. It is available for immediate download depending on the needs and requirements of the user.

Quarterly Overall Business Performance Assessment With Kpi Dashboard Microsoft PDF
The given below slide showcases the overall business performance to evaluate the trends and KPAs. It includes quarterly insights of elements such as revenue, new customers, net profit, customer satisfaction, sales profitability, growth etc. Pitch your topic with ease and precision using this Quarterly Overall Business Performance Assessment With Kpi Dashboard Microsoft PDF. This layout presents information on Revenue, Customer Satisfaction, Net Profit. It is also available for immediate download and adjustment. So, changes can be made in the color, design, graphics or any other component to create a unique layout.

Three Level Technique To Financial Management Guidelines PDF
The slide shows various approaches to financial management that will benefit financial managers to create a balance. It includes liquidity and profitability, traditional and modern view. Presenting Three Level Technique To Financial Management Guidelines PDF to dispense important information. This template comprises three stages. It also presents valuable insights into the topics including Traditional View, Modern View, Liquidity And Profitability. This is a completely customizable PowerPoint theme that can be put to use immediately. So, download it and address the topic impactfully.

Example Of Optimized Investment Sample Diagram Powerpoint Graphics
This is a example of optimized investment sample diagram powerpoint graphics. This is a eight stage process. The stages in this process are customer, performance, profit, capital protection, leverage, yield enhancement, sales, brand growth.
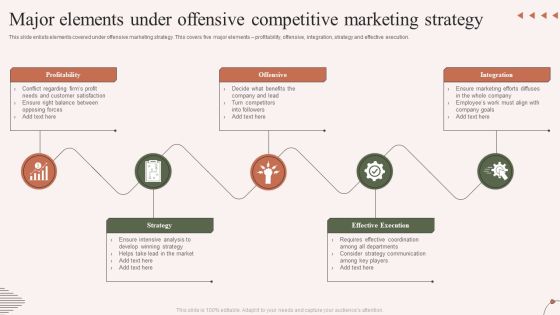
Major Elements Under Offensive Competitive Marketing Strategy Demonstration PDF
This slide enlists elements covered under offensive marketing strategy. This covers five major elements profitability, offensive, integration, strategy and effective execution. Presenting Major Elements Under Offensive Competitive Marketing Strategy Demonstration PDF to dispense important information. This template comprises five stages. It also presents valuable insights into the topics including Profitability, Strategy, Offensive. This is a completely customizable PowerPoint theme that can be put to use immediately. So, download it and address the topic impactfully.
Ppt Consecutive Demonstration Of Arrow Process Using Stage 1 PowerPoint Templates
PPT consecutive demonstration of arrow process using stage 1 PowerPoint Templates-With this pre-designed process arrows diagram you can visualize almost any type of concept, chronological process or steps of your strategies.-PPT consecutive demonstration of arrow process using stage 1 PowerPoint Templates-Arrow, Bank, Benefit, Business, Calculate, Calculation, Capitalist, Communication, Company, Concern, Connection, Data, Diagram, Digital, Drawing, Earnings, Economic, Finance, Financial, Flow, Forecast, Gain, Goal, Graph, Growth, Illustration, Increase, Information, Interest, Investing, Management, Market, Money, Move, Network, Objective, Plan, Process, Profit, Progress, Report, Rise, Risk, Shares, Statistics, Stock, System, Technology

Ppt Direct Description Of Arrow Process Using Stage 3 PowerPoint Templates
PPT direct description of arrow process using stage 3 PowerPoint Templates-With this pre-designed process arrows diagram you can visualize almost any type of concept, chronological process or steps of your strategies.-PPT direct description of arrow process using stage 3 PowerPoint Templates-Arrow, Bank, Benefit, Business, Calculate, Calculation, Capitalist, Communication, Company, Concern, Connection, Data, Diagram, Digital, Drawing, Earnings, Economic, Finance, Financial, Flow, Forecast, Gain, Goal, Graph, Growth, Illustration, Increase, Information, Interest, Investing, Management, Market, Money, Move, Network, Objective, Plan, Process, Profit, Progress, Report, Rise, Risk, Shares, Statistics, Stock, System, Technology

Ppt Homogenous Way To Avoid Development Losses Four Steps PowerPoint Templates
PPT homogenous way to avoid development losses four steps PowerPoint Templates-The theme of this PowerPoint template is linear arrows. Use them to illustrate a stepwise process or a phase structure. You can easily change its colors-PPT homogenous way to avoid development losses four steps PowerPoint Templates-Arrow, Bank, Benefit, Business, Calculate, Calculation, Capitalist, Communication, Company, Concern, Connection, Data, Diagram, Digital, Drawing, Earnings, Economic, Finance, Financial, Flow, Forecast, Gain, Goal, Graph, Growth, Illustration, Increase, Information, Interest, Investing, Management, Market, Money, Move, Network, Objective, Plan, Process, Profit, Progress, Report, Rise, Risk, Shares, Statistics, Stock, System, Technology

Ppt Homogenous Way To Prevent Banking Losses Four PowerPoint Slide Numbers Templates
PPT homogenous way to prevent banking losses four powerpoint slide numbers Templates-This PowerPoint Diagram shows you the Homogenous way to prevent Banking losses or losses in Business related Activities. It is shown by different shades of Brown color. It consists of four Stages.-PPT homogenous way to prevent banking losses four powerpoint slide numbers Templates-Arrow, Bank, Benefit, Business, Calculate, Calculation, Capitalist, Communication, Company, Concern, Connection, Data, Diagram, Digital, Drawing, Earnings, Economic, Finance, Financial, Flow, Forecast, Gain, Goal, Graph, Growth, Illustration, Increase, Information, Interest, Investing, Management, Market, Money, Move, Network, Objective, Plan, Process, Profit, Progress, Report, Rise, Risk, Shares, Statistics, Stock, System, Technology

Ppt Direct Description Of Banking Process Using 3 Stages PowerPoint Templates
PPT direct description of banking process using 3 stages PowerPoint Templates-This PowerPoint Diagram shows three circular boxes on the arrow pointing towards east direction signifying he completion of the process and leading towards success.-PPT direct description of banking process using 3 stages PowerPoint Templates-Arrow, Bank, Benefit, Business, Calculate, Calculation, Capitalist, Communication, Company, Concern, Connection, Data, Diagram, Digital, Drawing, Earnings, Economic, Finance, Financial, Flow, Forecast, Gain, Goal, Graph, Growth, Illustration, Increase, Information, Interest, Investing, Management, Market, Money, Move, Network, Objective, Plan, Process, Profit, Progress, Report, Rise, Risk, Shares, Statistics, Stock, System, Technology
Internet Marketing Objectives Ppt PowerPoint Presentation Icon Images
This is a internet marketing objectives ppt powerpoint presentation icon images. This is a six stage process. The stages in this process are sales, profit, product, repeat, sales, web.
Ppt Consecutive Description Of Banking Process Using 3 State Diagram PowerPoint Templates
PPT consecutive description of banking process using 3 state diagram PowerPoint Templates-With this pre-designed process arrows diagram you can visualize almost any type of concept, chronological process or steps of your strategies.-PPT consecutive description of banking process using 3 state diagram PowerPoint Templates-Arrow, Bank, Benefit, Business, Calculate, Calculation, Capitalist, Communication, Company, Concern, Connection, Data, Diagram, Digital, Drawing, Earnings, Economic, Finance, Financial, Flow, Forecast, Gain, Goal, Graph, Growth, Illustration, Increase, Information, Interest, Investing, Management, Market, Money, Move, Network, Objective, Plan, Process, Profit, Progress, Report, Rise, Risk, Shares, Statistics, Stock, System, Technology

Ppt Direct Illustration Of Banking Process Using Stage 2 PowerPoint Templates
PPT direct illustration of banking process using stage 2 PowerPoint Templates-With this pre-designed process arrows diagram you can visualize almost any type of concept, chronological process or steps of your strategies.-PPT direct illustration of banking process using stage 2 PowerPoint Templates-Arrow, Bank, Benefit, Business, Calculate, Calculation, Capitalist, Communication, Company, Concern, Connection, Data, Diagram, Digital, Drawing, Earnings, Economic, Finance, Financial, Flow, Forecast, Gain, Goal, Graph, Growth, Illustration, Increase, Information, Interest, Investing, Management, Market, Money, Move, Network, Objective, Plan, Process, Profit, Progress, Report, Rise, Risk, Shares, Statistics, Stock, System, Technology
Ppt Homogenous Way To Prevent Banking Losses Stage 3 PowerPoint Templates
PPT homogenous way to prevent banking losses stage 3 PowerPoint Templates-The theme of this PowerPoint template is linear arrows. Use them to illustrate a stepwise process or a phase structure. You can easily change its colors-PPT homogenous way to prevent banking losses stage 3 PowerPoint Templates-Arrow, Bank, Benefit, Business, Calculate, Calculation, Capitalist, Communication, Company, Concern, Connection, Data, Diagram, Digital, Drawing, Earnings, Economic, Finance, Financial, Flow, Forecast, Gain, Goal, Graph, Growth, Illustration, Increase, Information, Interest, Investing, Management, Market, Money, Move, Network, Objective, Plan, Process, Profit, Progress, Report, Rise, Risk, Shares, Statistics, Stock, System, Technology
Key Financial Ratios Template 2 Ppt PowerPoint Presentation Icon Graphics Design
This is a key financial ratios template 2 ppt powerpoint presentation icon graphics design. This is a four stage process. The stages in this process are liquidity, profitability, activity, solvency, business.

Stock Market Upward Trends Graph With Dollar Sign And Arrow Up Ppt PowerPoint Presentation Professional Graphics Download
This is a stock market upward trends graph with dollar sign and arrow up ppt powerpoint presentation professional graphics download. This is a four stage process. The stages in this process are stock market, financial markets, bull market.

Competitor Analysis Template Ppt PowerPoint Presentation Outline Format Ideas
This is a competitor analysis template ppt powerpoint presentation outline format ideas. This is a four stage process. The stages in this process are revenue, profit, market share, number of employee, product quality, main activity, revenue.
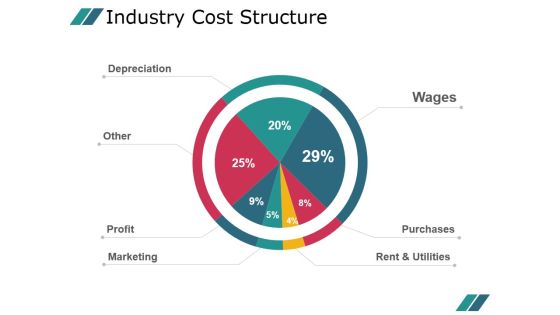
Industry Cost Structure Template 1 Ppt PowerPoint Presentation Example 2015
This is a industry cost structure template 1 ppt powerpoint presentation example 2015. This is a seven stage process. The stages in this process are wages, purchases, rent and utilities, depreciation, other, profit, marketing.

Effects Of Low Output On Business Growth Diagrams PDF
This slide mentions the impact of having low productivity on organizational growth impact overall profitability. It includes reduced profitability, employee disengagement, delays in project timelines and workplace toxicity. Presenting Effects Of Low Output On Business Growth Diagrams PDF to dispense important information. This template comprises four stages. It also presents valuable insights into the topics including Reduced Profitability, Employee Disengagement, Workplace Toxicity. This is a completely customizable PowerPoint theme that can be put to use immediately. So, download it and address the topic impactfully.

Competition Comparison Table Ppt PowerPoint Presentation Slide
This is a competition comparison table ppt powerpoint presentation slide. This is a six stage process. The stages in this process are revenue, profit, market share, main activity, number of employee, product quality.
Market Penetration Strategy Development And Diversification Ppt Powerpoint Presentation Outline Icons
This is a market penetration strategy development and diversification ppt powerpoint presentation outline icons. This is a four stage process. The stages in this process are market growth, market opportunity, market profitability.

Benefits Of Seo Services Ppt Powerpoint Templates
This is a benefits of seo services ppt powerpoint templates. This is a four stage process. The stages in this process are increase, improved, reduce, branding.

Information Technology Solutions Business Profile Financial Comparison With Competitors Topics PDF
This slide focuses on comparison of key financials with competitors on the basis of annual revenues, net profit, operating profit, employee count, research development expenses of one financial year.This is a Information Technology Solutions Business Profile Financial Comparison With Competitors Topics PDF template with various stages. Focus and dispense information on one stage using this creative set, that comes with editable features. It contains large content boxes to add your information on topics like Annual Revenues, Employee Count, Expenses Profit. You can also showcase facts, figures, and other relevant content using this PPT layout. Grab it now.

Leadership Development Process Diagram Ppt Images
This is a leadership development process diagram ppt images. This is a seven stage process. The stages in this process are individual coaching, evaluation, greater profit, team training, assess needs, build rapport, set context.
Scatter Chart Ppt PowerPoint Presentation Icon Example Introduction
This is a scatter chart ppt powerpoint presentation icon example introduction. This is a two stage process. The stages in this process are product, profit, in percentage, growth, scattered chart.

Reputation Management Strategy Diagram Presentation Backgrounds
This is a reputation management strategy diagram presentation backgrounds. This is a twelve stage process. The stages in this process are create massage, market, execution of strategy, customer, service, reputation, design, sales, loyalty, profit, growth, brand positioning.

Innovative Business Model Of Pharmaceutical Company Financial Performance For Last Five Years Icons PDF
This slide shows the financial performance of the pharmaceutical company from last five years 2022 to 2026. It includes net sales, sales growth, operating profit, net profit, etc.Deliver an awe inspiring pitch with this creative Innovative Business Model Of Pharmaceutical Company Financial Performance For Last Five Years Icons PDF bundle. Topics like Constant Exchange, Purchase Property, Growth Reported can be discussed with this completely editable template. It is available for immediate download depending on the needs and requirements of the user.

Business Diversification Plan Product And Market Development Ppt Powerpoint Presentation Gallery Example Topics
This is a business diversification plan product and market development ppt powerpoint presentation gallery example topics. This is a four stage process. The stages in this process are market growth, market opportunity, market profitability.

Technologies Initiatives To Improve Customer Relationship Rules PDF
Deliver and pitch your topic in the best possible manner with this technologies initiatives to improve customer relationship rules pdf Use them to share invaluable insights on improvement, material, profitable, targeting and impress your audience. This template can be altered and modified as per your expectations. So, grab it now.
Dollar Raise Money Investment Vector Icon Ppt Powerpoint Presentation Inspiration Outline
This is a dollar raise money investment vector icon ppt powerpoint presentation inspiration outline. This is a four stage process. The stages in this process are market growth, market opportunity, market profitability.
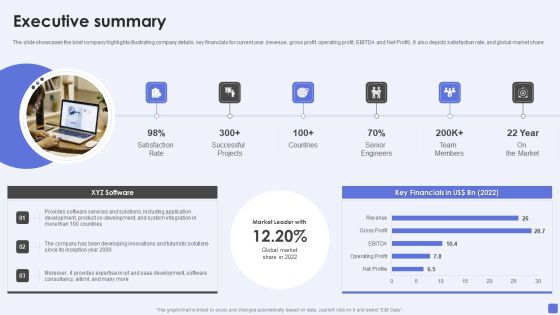
Software Services Business Profile Executive Summary Ppt PowerPoint Presentation File Elements PDF
The slide showcases the brief company highlights illustrating company details, key financials for current year revenue, gross profit, operating profit, EBITDA and Net Profit. It also depicts satisfaction rate, and global market share. Deliver an awe inspiring pitch with this creative Software Services Business Profile Executive Summary Ppt PowerPoint Presentation File Elements PDF bundle. Topics like Satisfaction Rate, Successful Projects, Senior Engineers can be discussed with this completely editable template. It is available for immediate download depending on the needs and requirements of the user.
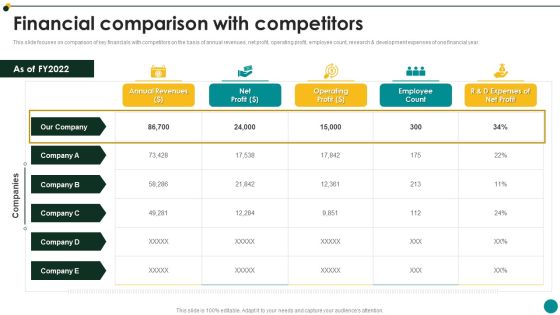
IT Services And Consulting Company Profile Financial Comparison With Competitors Guidelines PDF
This slide focuses on comparison of key financials with competitors on the basis of annual revenues, net profit, operating profit, employee count, research and development expenses of one financial year.Deliver and pitch your topic in the best possible manner with this IT Services And Consulting Company Profile Financial Comparison With Competitors Guidelines PDF Use them to share invaluable insights on Annual Revenues, Operating Profit, Employee Count and impress your audience. This template can be altered and modified as per your expectations. So, grab it now.

Ppt Circular Flow Of 5 Steps Involved Development PowerPoint Templates
PPT circular flow of 5 steps involved development PowerPoint Templates-Use this Circular flow diagram to describe key strategic issues and information flows and internal communication.-PPT circular flow of 5 steps involved development PowerPoint Templates-Affiliate, Affiliation, Arrow, Business, Chart, Circular, Commerce, Concept, Contribution, Cycle, Development, Diagram, Idea, Informative, Internet, Join, Making, Manage, Management, Market, Marketing, Member, Money, Network, Partner, Partnership, Pay, Paying, Performance, Plans, Process, Productive, Productivity, Profit, Profitable, Project, Recruit, Recruiting, Recruitment, Refer, Referral, Referring, Revenue, Sales, Socialize, Steps, Strategy

Customer Retention Benefits Ppt PowerPoint Presentation Layouts Backgrounds
This is a customer retention benefits ppt powerpoint presentation layouts backgrounds. This is a three stage process. The stages in this process are increases, decreasing, business, marketing, strategy.
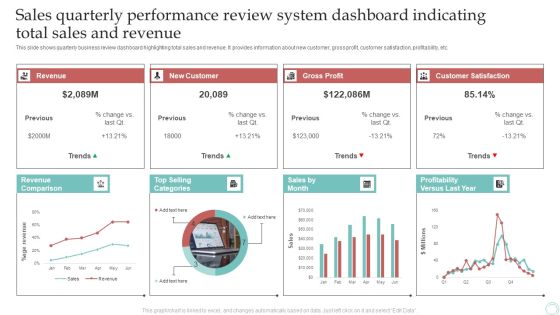
Sales Quarterly Performance Review System Dashboard Indicating Total Sales And Revenue Download PDF
This slide shows quarterly business review dashboard highlighting total sales and revenue. It provides information about new customer, gross profit, customer satisfaction, profitability, etc. Pitch your topic with ease and precision using this Sales Quarterly Performance Review System Dashboard Indicating Total Sales And Revenue Download PDF. This layout presents information on Revenue, New Customer, Gross Profit. It is also available for immediate download and adjustment. So, changes can be made in the color, design, graphics or any other component to create a unique layout.

Investing In Value And Growth Example Powerpoint Slide Presentation Examples
This is a investing in value and growth example powerpoint slide presentation examples. This is a three stage process. The stages in this process are improve, increase, expand.
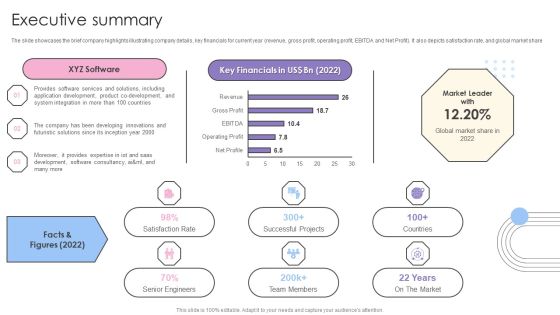
Software Products And Solutions Firm Details Executive Summary Clipart PDF
The slide showcases the brief company highlights illustrating company details, key financials for current year revenue, gross profit, operating profit, EBITDA and Net Profit. It also depicts satisfaction rate, and global market share. Deliver and pitch your topic in the best possible manner with this Software Products And Solutions Firm Details Executive Summary Clipart PDF. Use them to share invaluable insights on XYZ Software, Key Financials, Market Leader and impress your audience. This template can be altered and modified as per your expectations. So, grab it now.

Promoting Selling Franchise Development Companys Five Year Financial Forecast Sample PDF
This slide shows the companys five-year financial forecast which includes summary of operations, net revenue, total operating profit, earning per share, etc. Deliver an awe inspiring pitch with this creative promoting selling franchise development companys five year financial forecast sample pdf bundle. Topics like net revenue, operating profit, capital spending can be discussed with this completely editable template. It is available for immediate download depending on the needs and requirements of the user.

six hexagons for business progress drivers ppt powerpoint presentation model demonstration pdf
Presenting this set of slides with name six hexagons for business progress drivers ppt powerpoint presentation model demonstration pdf. This is a six stage process. The stages in this process are market, investment, profitability, employees, strategy, brand. This is a completely editable PowerPoint presentation and is available for immediate download. Download now and impress your audience.

Improving Restaurant Operations Projected Income Statement Ppt PowerPoint Presentation Pictures Layout Ideas PDF
Presenting this set of slides with name improving restaurant operations projected income statement ppt powerpoint presentation pictures layout ideas pdf. The topics discussed in these slides are income, sales, expenses, gross profit, miscellaneous, insurance. This is a completely editable PowerPoint presentation and is available for immediate download. Download now and impress your audience.

Business Diagram Roulette Wheel For Business Risk Presentation Template
Our above slide displays graphics of roulette wheel. Download our above diagram to express views on gambling, business risk and profit. Use this diagram to get good comments from viewers.
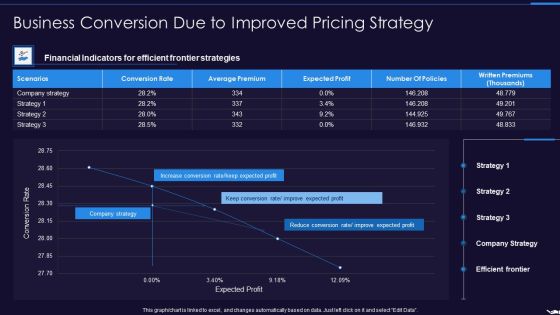
Optimize Marketing Pricing Business Conversion Due To Improved Pricing Strategy Background PDF
Deliver an awe inspiring pitch with this creative optimize marketing pricing business conversion due to improved pricing strategy background pdf bundle. Topics like scenarios, conversion rate, average premium, expected profit, strategy can be discussed with this completely editable template. It is available for immediate download depending on the needs and requirements of the user.

Estimating The Price Business Conversion Due To Improved Pricing Strategy Pictures PDF
Deliver an awe inspiring pitch with this creative Estimating The Price Business Conversion Due To Improved Pricing Strategy Pictures PDF bundle. Topics like Average Premium, Expected Profit, Strategies, Financial can be discussed with this completely editable template. It is available for immediate download depending on the needs and requirements of the user.
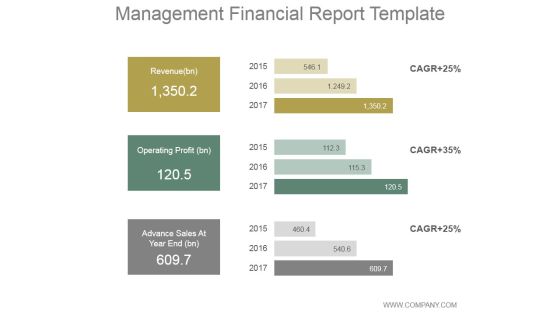
Management Financial Report Ppt PowerPoint Presentation Diagrams
This is a management financial report ppt powerpoint presentation diagrams. This is a three stage process. The stages in this process are revenue, operating profit, advance sales at year end.

Business Round Investment Deck Historical And Forecasted Income Statement Topics PDF
This slide shows the historical and predicted income statement of the company which contains total revenue, costs, gross profit, operating expenses etc. Deliver an awe-inspiring pitch with this creative business round investment deck historical and forecasted income statement topics pdf. bundle. Topics like total revenue, operating expenses, gross profit, interest expense, net income can be discussed with this completely editable template. It is available for immediate download depending on the needs and requirements of the user.

Business Comparison Table Sample Ppt Presentation
This is a business comparison table sample ppt presentation. This is a seven stage process. The stages in this process are criteria, revenue, profit, market, share, main activity, number of employee, product quality, insert your text, competitor.

Business Competition Comparison Table Ppt Icon
This is a business competition comparison table ppt icon. This is a seven stage process. The stages in this process are criteria, revenue, profit, market share, main activity, number of employee, product quality, insert your text, competitor.

Crm For Business Objectives Ppt Powerpoint Images
This is a crm for business objectives ppt powerpoint images. This is a three stage process. The stages in this process are business market, business objectives, business resources, customer centric, diversify, profitability.

Franchising And Business Opportunities Ppt Slides Styles
This is a franchising and business opportunities ppt slides styles. This is a seven stage process. The stages in this process are granting of rights, same business format, profitable, replicable, stable or growing market, trade secrets, marketing expertise.
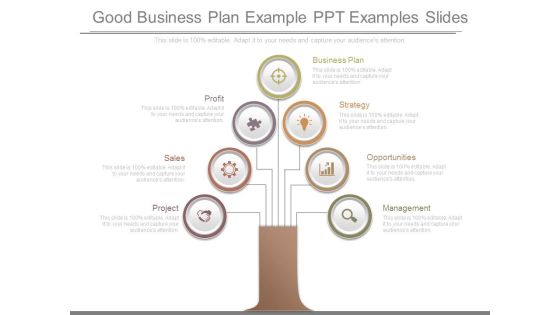
Good Business Plan Example Ppt Examples Slides
This is a good business plan example ppt examples slides. This is a seven stage process. The stages in this process are profit, sales, project, management, opportunities, strategy, business plan.

Customer Retention Business Plan Ppt Sample
This is a customer retention business plan ppt sample. This is a four stage process. The stages in this process are teamwork, internal services standards, customer services standards, customer satisfaction, profit, customer retention, cross sell.
Market Statistical Analysis Vector Icon Ppt Powerpoint Presentation File Design Inspiration
This is a market statistical analysis vector icon ppt powerpoint presentation file design inspiration. The topics discussed in this diagram are market growth, market opportunity, market profitability. This is a completely editable PowerPoint presentation, and is available for immediate download.

Business Competition Comparison And Analysis Table Powerpoint Slides
This is a business competition comparison and analysis table powerpoint slides. This is a six stage process. The stages in this process are criteria, revenue, profit, market share, main activity, number of employee, product quality, competitor.

Competition Comparison Table For New Business Presentation Powerpoint Templates
This is a competition comparison table for new business presentation powerpoint templates. This is a seven stage process. The stages in this process are criteria, revenue, profit, market share, main activity, number of employee, product quality, insert your text.

Competition Comparison Table For New Business Ppt PowerPoint Presentation Slides
This is a competition comparison table for new business ppt powerpoint presentation slides. This is a seven stage process. The stages in this process are criteria, revenue, profit, market share, main activity, number of employee, product quality, competitor.
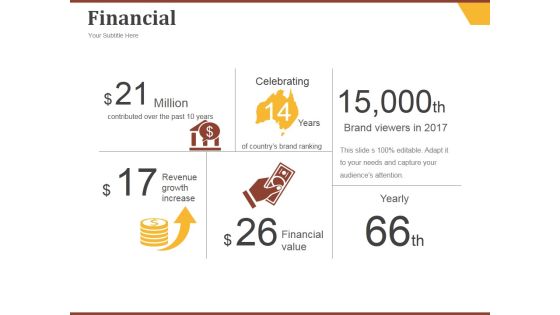
Financial Ppt PowerPoint Presentation Pictures Summary
This is a financial ppt powerpoint presentation pictures summary. This is a three stage process. The stages in this process are financial value, million, yearly, revenue growth increase.

Addressing Financial Projections Of Consumer Electronics Firm Structure PDF
This slide caters details about financial projections of consumer electronics firm progress for next 5 years with operating profit, total revenue and Opex. Deliver an awe inspiring pitch with this creative addressing financial projections of consumer electronics firm structure pdf bundle. Topics like gross sale or total revenue, gross profit, growth assumption can be discussed with this completely editable template. It is available for immediate download depending on the needs and requirements of the user.

Addressing Financial Projections Of Consumer Electronics Firm Infographics PDF
This slide caters details about financial projections of consumer electronics firm progress for next 5 years with operating profit, total revenue and Opex. Deliver an awe inspiring pitch with this creative addressing financial projections of consumer electronics firm infographics pdf bundle. Topics like revenue growth rate, gross profit, advertising, equipment, growth assumption can be discussed with this completely editable template. It is available for immediate download depending on the needs and requirements of the user.
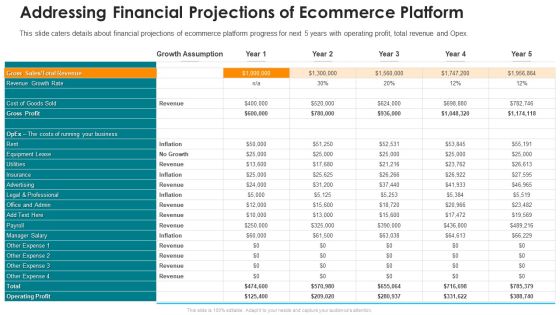
Online Marketing Platform Addressing Financial Projections Of Ecommerce Platform Summary PDF
This slide caters details about financial projections of ecommerce platform progress for next 5 years with operating profit, total revenue and Opex. Deliver an awe inspiring pitch with this creative online marketing platform addressing financial projections of ecommerce platform summary pdf bundle. Topics like gross profit, advertising, business can be discussed with this completely editable template. It is available for immediate download depending on the needs and requirements of the user.

Consolidated Statement Of Income Graphics PDF
This slide shows the consolidated statement of income which includes total revenue, cost of goods sold, gross profit, sales, etc. Presenting consolidated statement of income graphics pdf to provide visual cues and insights. Share and navigate important information on one stages that need your due attention. This template can be used to pitch topics like expenses, sales, income, revenue, gross profit. In addtion, this PPT design contains high resolution images, graphics, etc, that are easily editable and available for immediate download.
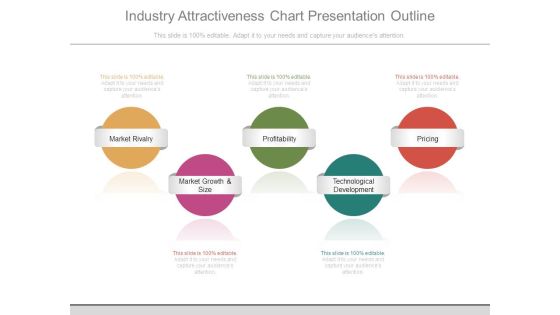
Industry Attractiveness Chart Presentation Outline
This is a industry attractiveness chart presentation outline. This is a five stage process. The stages in this process are market rivalry, market growth and size, profitability, technological development, pricing.
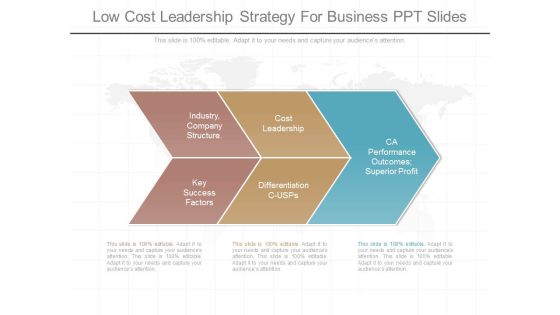
Low Cost Leadership Strategy For Business Ppt Slides
This is a low cost leadership strategy for business ppt slides. This is a three stage process. The stages in this process are industry, company structure, key success factors, cost leadership, differentiation cusps, ca performance outcomes superior profit.

Cash Flow Problems Business Diagram Ppt Sample Presentations
This is a cash flow problems business diagram ppt sample presentations. This is a five stage process. The stages in this process are overdraft at limit, taxation arrears, no working capital, creditor arrears, lack of profitability.

Business Management Information Systems Diagram Powerpoint Slide Ideas
This is a business management information systems diagram powerpoint slide ideas. This is a seven stage process. The stages in this process are corporations, non profit, healthcare, technology entrepreneurship, consulting with affirm or as a freelancer, government, education.
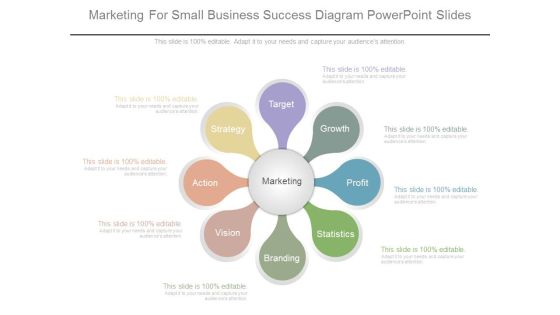
Marketing For Small Business Success Diagram Powerpoint Slides
This is a marketing for small business success diagram powerpoint slides. This is a eight stage process. The stages in this process are target, growth, profit, statistics, branding, vision, action, strategy, marketing.

Expected Benefits Of IT OT Convergence Managing Organizational Transformation Information PDF
This slide covers expected benefits of IT OT convergence such as profitability, digital continuity, security control, business development, attractiveness etc. Deliver an awe inspiring pitch with this creative Expected Benefits Of IT OT Convergence Managing Organizational Transformation Information PDF bundle. Topics like Profitability, Digital Continuity, Business Development can be discussed with this completely editable template. It is available for immediate download depending on the needs and requirements of the user.

Smart Venture Digitial Transformation Expected Benefits Of IT OT Convergence Topics PDF
This slide covers expected benefits of IT or OT convergence such as profitability, digital continuity, security control, business development, attractiveness etc. This is a four template with various stages. Focus and dispense information on four stages using this creative set, that comes with editable features. It contains large content boxes to add your information on topics like Profitability, Digital Continuity, Security Control, Business Development. You can also showcase facts, figures, and other relevant content using this PPT layout. Grab it now.
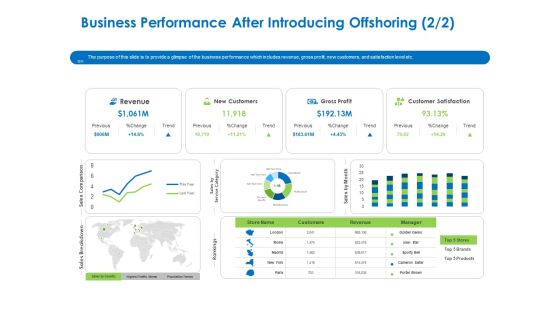
Relocation Of Business Process Offshoring Business Performance After Introducing Offshoring Revenue Download PDF
The purpose of this slide is to provide a glimpse of the business performance which includes revenue, gross profit, new customers, and satisfaction level etc. Deliver an awe-inspiring pitch with this creative relocation of business process offshoring business performance after introducing offshoring revenue download pdf bundle. Topics like revenue, new customers, gross profit, customer satisfaction can be discussed with this completely editable template. It is available for immediate download depending on the needs and requirements of the user.
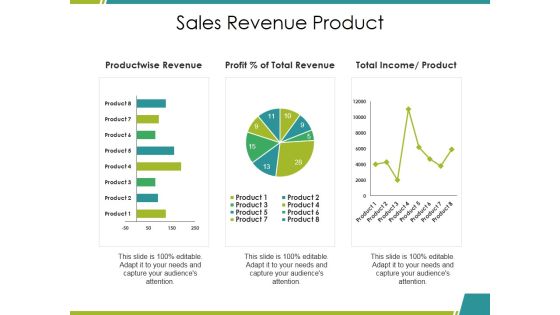
Sales Revenue Product Ppt PowerPoint Presentation Slides Visuals
This is a sales revenue product ppt powerpoint presentation slides visuals. This is a three stage process. The stages in this process are product wise revenue, total income, profit, product, business.

Bar Graph For Four Years Business Result Analysis Ppt PowerPoint Presentation Icon Show
Presenting this set of slides with name bar graph for four years business result analysis ppt powerpoint presentation icon show. The topics discussed in these slides are financial targets, financial goals, growth profitability. This is a completely editable PowerPoint presentation and is available for immediate download. Download now and impress your audience.

Investor Gap Financing Monthly Wise Income Statement Projection For Coming Year Template PDF
This slide shows the monthly financials of the company which covers net revenue, profit, expenses , EBIT etc. Deliver an awe inspiring pitch with this creative investor gap financing monthly wise income statement projection for coming year template pdf bundle. Topics like revenue, gross profit, earnings before interest can be discussed with this completely editable template. It is available for immediate download depending on the needs and requirements of the user.

Arrows Pointing Upward For Business Growth Ppt Powerpoint Presentation Outline Files
This is a arrows pointing upward for business growth ppt powerpoint presentation outline files. This is a five stage process. The stages in this process are increase, improvement, enhancement.

Business Planning Conference Room With Three Growth Arrows Ppt Powerpoint Presentation Infographic Template Background
This is a business planning conference room with three growth arrows ppt powerpoint presentation infographic template background. This is a three stage process. The stages in this process are increase, improvement, enhancement.
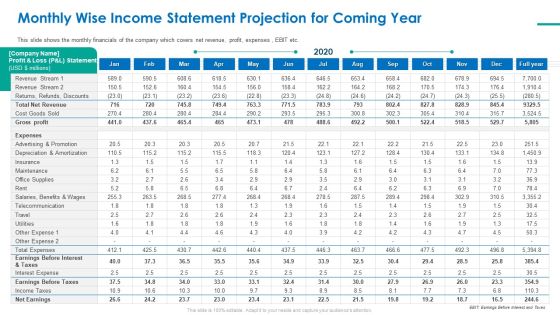
Investor Pitch Deck For Short Term Bridge Loan Monthly Wise Income Statement Projection For Coming Year Sample PDF
This slide shows the monthly financials of the company which covers net revenue, profit, expenses , EBIT etc.Deliver an awe-inspiring pitch with this creative investor pitch deck for short term bridge loan monthly wise income statement projection for coming year sample pdf bundle. Topics like total net revenue, gross profit, expenses, earnings before interest can be discussed with this completely editable template. It is available for immediate download depending on the needs and requirements of the user.
