In Progress Icon/icons/appstore.png
Profit Graph Success PowerPoint Templates And PowerPoint Backgrounds 0711
Microsoft PowerPoint Template and Background with graph showing rise in profits or earnings

Profit Graph Success PowerPoint Themes And PowerPoint Slides 0711
Microsoft PowerPoint Theme and Slide with graph showing rise in profits or earnings
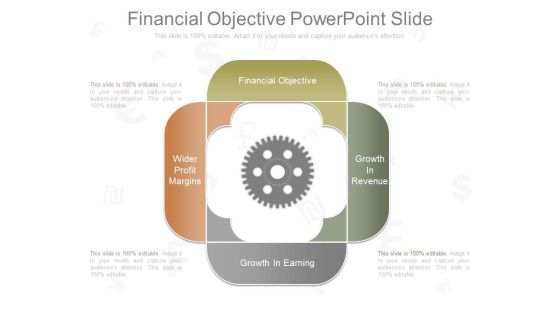
Financial Objective Powerpoint Slide
This is a financial objective powerpoint slide. This is a four stage process. The stages in this process are financial objective, growth in revenue, growth in earning, wider profit margins.
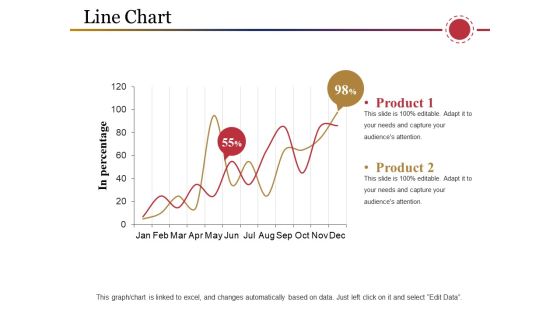
Line Chart Ppt PowerPoint Presentation Inspiration Samples
This is a line chart ppt powerpoint presentation inspiration samples. This is a two stage process. The stages in this process are product, in percentage, business, marketing, graph.

Combo Chart Ppt PowerPoint Presentation Information
This is a combo chart ppt powerpoint presentation information. This is a four stage process. The stages in this process are growth, product, in percentage.

Area Chart Ppt PowerPoint Presentation Designs
This is a area chart ppt powerpoint presentation designs. This is a two stage process. The stages in this process are product, graph, in percentage, growth, business.

Bar Chart Ppt PowerPoint Presentation Ideas
This is a bar chart ppt powerpoint presentation ideas. This is a nine stage process. The stages in this process are graph, in percentage, growth, business, marketing.

Column Chart Ppt Powerpoint Presentation Professional Model
This is a column chart ppt powerpoint presentation professional model. This is a two stage process. The stages in this process are product, dollars in thousands, graph, growth.

Scatter Chart Ppt PowerPoint Presentation Gallery Guide
This is a scatter chart ppt powerpoint presentation gallery guide. This is a one stage process. The stages in this process are profit, product, in percentage, growth, success.

Financial Growth Examples Flow Chart Diagram Powerpoint Slide Graphics
This is a financial growth examples flow chart diagram powerpoint slide graphics. This is a six stage process. The stages in this process are increase in productivity, economic growth and development, increase in flow of goods and services in economy, consumption rises, size of market increase, inducement to invest for firms.

Business Diagram Comparison Of Physical And Virtual World Explaining Virtualization Ppt Slide
Concept of comparison in between virtual and physical world has been displayed in this diagram. To display this concept we have used graphic of servers in sequential order. Download this editable diagram slide to create an impact on your viewers.
Business Diagram Eco Energy Icons Green Sustainable Recyclable Concepts Ppt Slide
Concept of eco energy has been displayed in this diagram slide with suitable graphics. To display this concept we have used graphic of energy icons in green color. Display eco energy related topics in any presentation with this unique diagram
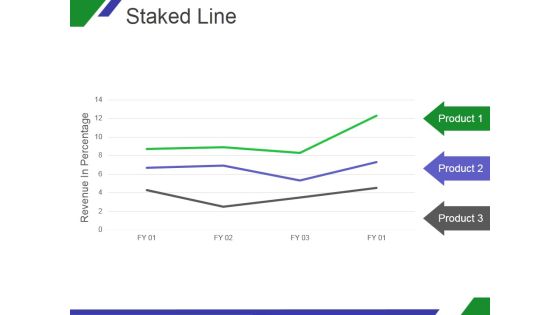
Staked Line Ppt PowerPoint Presentation Slide
This is a staked line ppt powerpoint presentation slide. This is a three stage process. The stages in this process are revenue in percentage, product, business.

Line Chart Ppt PowerPoint Presentation Model
This is a line chart ppt powerpoint presentation model. This is a two stage process. The stages in this process are in percentage, product, business.
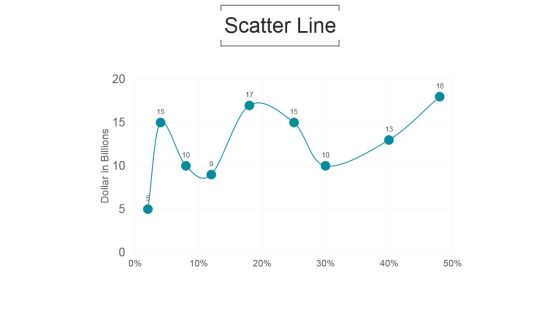
Scatter Line Ppt PowerPoint Presentation Good
This is a scatter line ppt powerpoint presentation good. This is a nine stage process. The stages in this process are dollar in billions, marketing, business.

Stacked Line Ppt PowerPoint Presentation Guide
This is a stacked line ppt powerpoint presentation guide. This is a three stage process. The stages in this process are revenue in percentage, product.

Line Chart Ppt PowerPoint Presentation Ideas
This is a line chart ppt powerpoint presentation ideas. This is a two stage process. The stages in this process are marketing, in percentage, sun, mon, tue, wed.
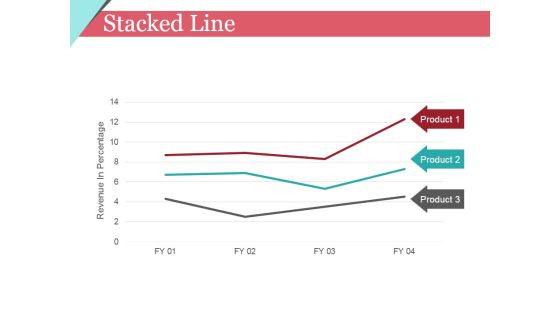
Stacked Line Ppt PowerPoint Presentation Gallery Display
This is a stacked line ppt powerpoint presentation gallery display. This is a three stage process. The stages in this process are revenue in percentage, product, graph, finance.

Area Chart Ppt PowerPoint Presentation Summary Deck
This is a area chart ppt powerpoint presentation summary deck. This is a two stage process. The stages in this process are sales in percentage, financial year.

Area Chart Ppt PowerPoint Presentation Inspiration Slides
This is a area chart ppt powerpoint presentation inspiration slides. This is a two stage process. The stages in this process are area chart, product, in percentage.

Area Chart Ppt PowerPoint Presentation Icon Gallery
This is a area chart ppt powerpoint presentation icon gallery. This is a two stage process. The stages in this process are sales in percentage, product, bar graph.

Column Chart Ppt PowerPoint Presentation Professional Aids
This is a column chart ppt powerpoint presentation professional aids. This is a two stage process. The stages in this process are product, sales in percentage, financial years.

Line Chart Ppt PowerPoint Presentation Pictures Layout
This is a line chart ppt powerpoint presentation pictures layout. This is a two stage process. The stages in this process are product, financial years, sales in percentage.

Column Chart Ppt PowerPoint Presentation Gallery Layout
This is a column chart ppt powerpoint presentation gallery layout. This is a two stage process. The stages in this process are product, sales in percentage, year.
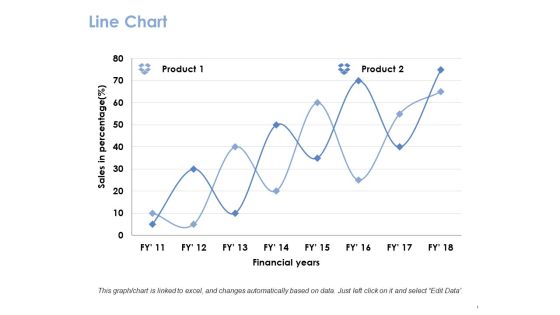
Line Chart Ppt PowerPoint Presentation Gallery Guide
This is a line chart ppt powerpoint presentation gallery guide. This is a two stage process. The stages in this process are product, financial years, sales in percentage.

Scatter Chart Ppt PowerPoint Presentation Show Sample
This is a scatter chart ppt powerpoint presentation show sample. This is a one stage process. The stages in this process are product, dollar, in percentage.

Column Chart Ppt PowerPoint Presentation Model Graphics Example
This is a column chart ppt powerpoint presentation model graphics example. This is a two stage process. The stages in this process are expenditure in, product, years.

Bar Graph Ppt PowerPoint Presentation Ideas Display
This is a bar graph ppt powerpoint presentation ideas display. This is a two stage process. The stages in this process are product, sales in percentage, bar graph.

Area Chart Ppt PowerPoint Presentation Styles Brochure
This is a area chart ppt powerpoint presentation styles brochure. This is a two stage process. The stages in this process are product, financial years, in percentage.

Bubble Chart Ppt PowerPoint Presentation Layouts Demonstration
This is a bubble chart ppt powerpoint presentation icon structure. This is a three stage process. The stages in this process are product, sales in percentage, bubble chart.

Line Chart Ppt PowerPoint Presentation Inspiration Slide Download
This is a line chart ppt powerpoint presentation inspiration slide download. This is a two stage process. The stages in this process are product, in millions, business, marketing.

Area Graph Ppt PowerPoint Presentation Slides Ideas
This is a area graph ppt powerpoint presentation slides ideas. This is a two stage process. The stages in this process are sales in percentage, financial year, product.

Scatter Bubble Chart Ppt PowerPoint Presentation Summary Slides
This is a scatter bubble chart ppt powerpoint presentation summary slides. This is a one stage process. The stages in this process are product, profit, in percentage.

Area Chart Ppt PowerPoint Presentation Styles Professional
This is a area chart ppt powerpoint presentation styles professional. This is a two stage process. The stages in this process are sales in percentage, product, area chart.

Bubble Chart Ppt PowerPoint Presentation Outline Demonstration
This is a bubble chart ppt powerpoint presentation outline demonstration. This is a two stage process. The stages in this process are bubble chart, product, in percentage.

Column Chart Ppt PowerPoint Presentation Ideas Clipart
This is a column chart ppt powerpoint presentation ideas clipart. This is a two stage process. The stages in this process are product, expenditure in, years.
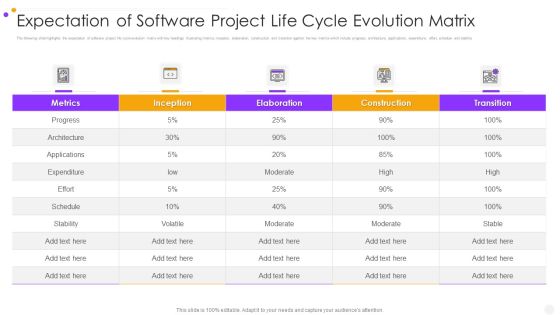
Expectation Of Software Project Life Cycle Evolution Matrix Professional PDF
The following slide highlights the expectation of software project life cycle evolution matrix with key headings illustrating metrics, inception, elaboration, construction and transition against the key metrics which include progress, architecture, applications, expenditure, effort, schedule and stability. Showcasing this set of slides titled expectation of software project life cycle evolution matrix professional pdf. The topics addressed in these templates are construction, transition, metrics. All the content presented in this PPT design is completely editable. Download it and make adjustments in color, background, font etc. as per your unique business setting.

Business Diagram Five Staged Circular Process For Text Representation Presentation Template
Five staged circular process diagram in used in this business slide. Download our above diagram to express information in a visual way. This diagram offers a way for your audience to visually conceptualize the process.

Some Quick Facts Ppt PowerPoint Presentation File Templates
This is a some quick facts ppt powerpoint presentation file templates. This is a three stage process. The stages in this process are staff work weekly, sales growth in, customers in .
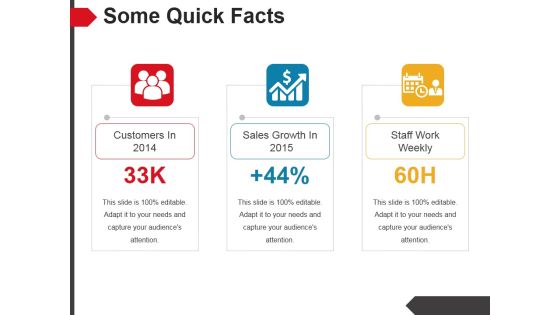
Some Quick Facts Ppt PowerPoint Presentation Example 2015
This is a some quick facts ppt powerpoint presentation example 2015. This is a two stage process. The stages in this process are staff work weekly, sales growth in, customers in .

Some Quick Facts Ppt PowerPoint Presentation Styles Diagrams
This is a some quick facts ppt powerpoint presentation styles diagrams. This is a three stage process. The stages in this process are customers in 2014, sales growth in 2015, staff work weekly.
Stock Photo Red Logo Design Of Premium Quality PowerPoint Slide
Define your ideas in inspiring manner with this image of red logo design of premium quality. Use this image in your business presentations to explain the concept in visual manner.
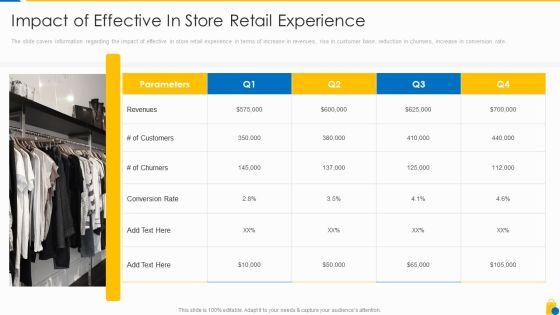
Retailing Approaches For Excellent End User Engagement And Experiences Impact Of Effective Introduction PDF
The slide covers information regarding the impact of effective in store retail experience in terms of increase in revenues, rise in customer base, reduction in churners, increase in conversion rate. Deliver and pitch your topic in the best possible manner with this retailing approaches for excellent end user engagement and experiences impact of effective introduction pdf Use them to share invaluable insights on impact of effective in store retail experience and impress your audience. This template can be altered and modified as per your expectations. So, grab it now.

Scatter Bubble Chart Ppt PowerPoint Presentation Slides
This is a scatter bubble chart ppt powerpoint presentation slides. This is a eight stage process. The stages in this process are in price, highest sale, business, management.
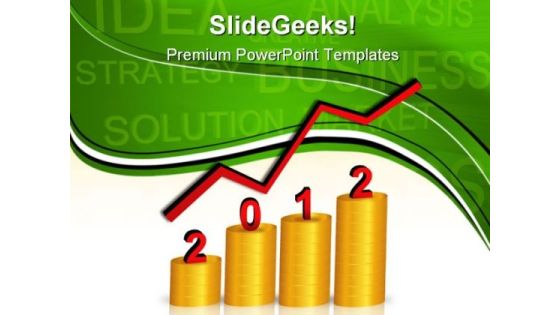
Dollar Growth Success PowerPoint Templates And PowerPoint Backgrounds 1211
Microsoft PowerPoint Template and Background with stacks of gold coins represents growth in 2012

Stock Photo Red Yen Symbol On Puzzle Piece PowerPoint Slide
Use this image in money and finance related topics. To define this concept we have used graphic of yen symbol on puzzle piece. Use this image in your business related presentations to explain the concept in visual manner.

Stock Photo Rupee Symbol On Missing Puzzle Piece PowerPoint Slide
Use this image in money and finance related topics. To define this concept we have used graphic of rupee symbol on missing puzzle piece. Use this image in your business related presentations to explain the concept in visual manner.

Money Growth Success PowerPoint Templates And PowerPoint Themes 0212
Microsoft Powerpoint Templates and Background with businessteam standing on coins in front of successful chart
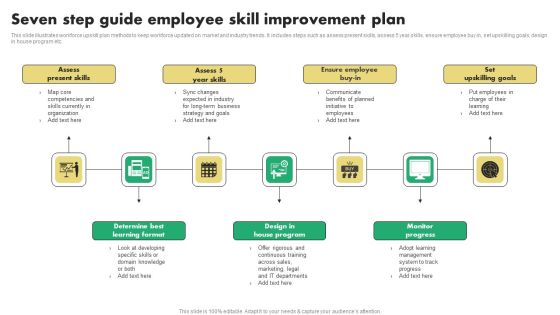
Seven Step Guide Employee Skill Improvement Plan Pictures PDF
This slide illustrates workforce upskill plan methods to keep workforce updated on market and industry trends. It includes steps such as assess present skills, assess 5 year skills, ensure employee buy in, set upskilling goals, design in house program etc. Persuade your audience using this Seven Step Guide Employee Skill Improvement Plan Pictures PDF. This PPT design covers seven stages, thus making it a great tool to use. It also caters to a variety of topics including Design In House Program, Monitor Progress, Upskilling Goals. Download this PPT design now to present a convincing pitch that not only emphasizes the topic but also showcases your presentation skills.

Continuous Process Improvement KPI Dashboard For IT Industry Clipart PDF
Following slide depicts the IT industry KPI dashboard which will assist in generating more of profit by improving strategic plan according to changing environment with clients preferences .The KPI mentioned in a slide are such as risk analysis, outstanding task , upcoming task, budget analysis, etc. Pitch your topic with ease and precision using this Continuous Process Improvement KPI Dashboard For IT Industry Clipart PDF. This layout presents information on Overall Progress, Risk Analysis, Budget Analysis. It is also available for immediate download and adjustment. So, changes can be made in the color, design, graphics or any other component to create a unique layout.

Strategic Issue Management Checklist To Improve Project Effectiveness Infographics PDF
The following slide showcases checklist identify and control issues in project. It further includes key tasks and status complete, in progress, and incomplete related to them. Pitch your topic with ease and precision using this Strategic Issue Management Checklist To Improve Project Effectiveness Infographics PDF. This layout presents information on Issue Overcoming, Issue Identification, Issue Determination. It is also available for immediate download and adjustment. So, changes can be made in the color, design, graphics or any other component to create a unique layout.

Quarterly Comparison Of Staff Productivity Enhancement Ppt PowerPoint Presentation Ideas Aids PDF
This slide shows the employees average productivity graph working in the organization. A sudden decline has been observed in employee productivity in Q3. Showcasing this set of slides titled Quarterly Comparison Of Staff Productivity Enhancement Ppt PowerPoint Presentation Ideas Aids PDF. The topics addressed in these templates are Employee Productivity, Sudden Decline, Workplace Stress. All the content presented in this PPT design is completely editable. Download it and make adjustments in color, background, font etc. as per your unique business setting.

Business Achievements Example Ppt Presentation
This is a business achievements example ppt presentation. This is a three stage process. The stages in this process are partners in 25 countries, 200 stores, product ready.
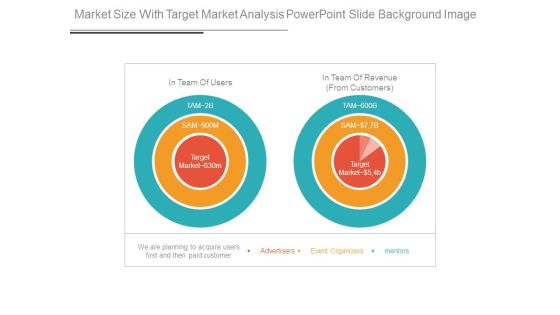
Market Size With Target Market Analysis Powerpoint Slide Background Image
This is a market size with target market analysis powerpoint slide background image. This is a three stage process. The stages in this process are in team of users, in team of revenue from customer, advertisers, event organizers, mentors.

Web Traffic Insights Ppt PowerPoint Presentation Visual Aids
This is a web traffic insights ppt powerpoint presentation visual aids. This is a five stage process. The stages in this process are traffic sources, traffic share in last 3months, weekly traffic reach in last 12months, website ranks, global rank.

Infrastructure Expansion KPI Dashboard For Investment Project Management Inspiration PDF
This slide covers management dashboard for analyzing the project performance and progress. It include KPIs such as total claims to date, total costs to date, project status, profits, number of days left, etc. Showcasing this set of slides titled Infrastructure Expansion KPI Dashboard For Investment Project Management Inspiration PDF. The topics addressed in these templates are Claims And Costs, Project Status, Profits. All the content presented in this PPT design is completely editable. Download it and make adjustments in color, background, font etc. as per your unique business setting.

Circle Chart With Increasing Percentage Values PowerPoint Slides
Circle Chart with Increasing Percentage Values power point Slides: - Show your achievements and targets with the ideal background. Above is the diagram to display how your business has been growing or your achievements. The slide is of the three circles having water at different levels in them. Therefore it becomes easy to show that in the first circle, the growth is at this much percent, then the second one and in the last circle, completed 85% of the targets. This PowerPoint template is easy to use to show the progress, and comparisons. All icons are editable. Choose them as per your need.

Timeline Showcasing Stages For Successful Workplace Graphic Communication Brochure PDF
This slide showcases timeline illustrating steps to use visual communication at workplace which helps to improve process efficiency. It provides information regarding staff onboarding, capture ideas, record conversations, give feedback and measure progress. Showcasing this set of slides titled Timeline Showcasing Stages For Successful Workplace Graphic Communication Brochure PDF. The topics addressed in these templates are Description, Communication, Timeline. All the content presented in this PPT design is completely editable. Download it and make adjustments in color, background, font etc. as per your unique business setting.
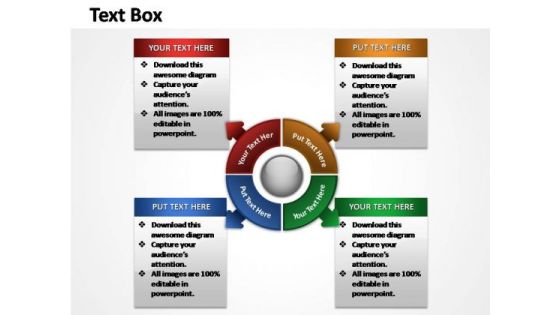
PowerPoint Slide Layout Success Steps Ppt Slides
Use this layout to define the outcome and the multiple possibilities in a way that is used in calculation of probabilities, genetics and strategic reasoning.

Agile Practices Improves Business Customer Relationships Information PDF
Deliver and pitch your topic in the best possible manner with this agile practices improves business customer relationships information pdf. Use them to share invaluable insights on team, product, progress, metrics, software and impress your audience. This template can be altered and modified as per your expectations. So, grab it now.


 Continue with Email

 Home
Home


