Improvement Plan

Area Chart Ppt PowerPoint Presentation Infographic Template Clipart Images
This is a area chart ppt powerpoint presentation infographic template clipart images. This is a two stage process. The stages in this process are finance, marketing, management, investment, analysis.

Donut Pie Chart Ppt PowerPoint Presentation Show Graphics Download
This is a donut pie chart ppt powerpoint presentation show graphics download. This is a three stage process. The stages in this process are percentage, finance, donut, business, marketing.
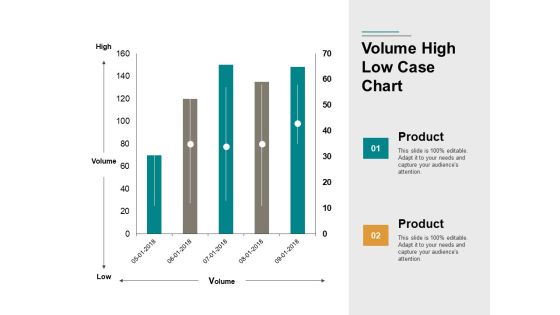
Volume High Low Case Chart Ppt PowerPoint Presentation Portfolio Images
This is a volume high low case chart ppt powerpoint presentation portfolio images. This is a two stage process. The stages in this process are finance, business, marketing, management.
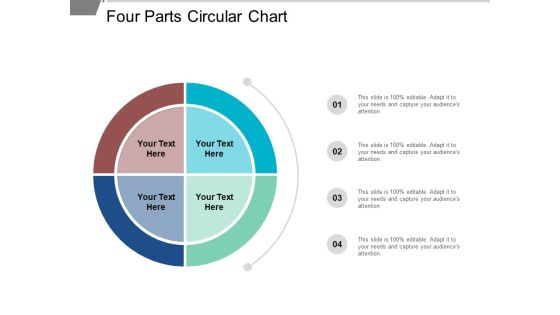
Four Parts Circular Chart Ppt PowerPoint Presentation Styles Skills
This is a four parts circular chart ppt powerpoint presentation styles skills. This is a four stage process. The stages in this process are sectioned circle, segmented circle, partitioned circle.
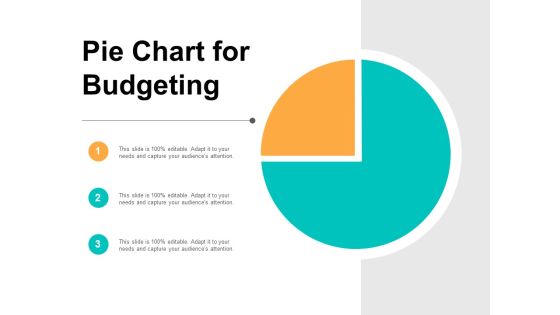
Pie Chart For Budgeting Ppt PowerPoint Presentation Pictures Vector
This is a pie chart for budgeting ppt powerpoint presentation pictures vector. This is a three stage process. The stages in this process are sectioned circle, segmented circle, partitioned circle.

Pie Chart For Data Comparison Ppt PowerPoint Presentation Portfolio Layouts
This is a pie chart for data comparison ppt powerpoint presentation portfolio layouts. This is a four stage process. The stages in this process are sectioned circle, segmented circle, partitioned circle.
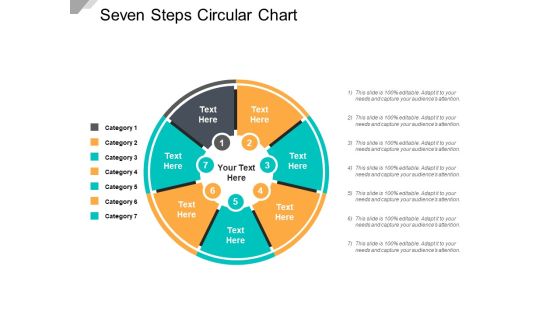
Seven Steps Circular Chart Ppt PowerPoint Presentation Infographics Designs
This is a seven steps circular chart ppt powerpoint presentation infographics designs. This is a seven stage process. The stages in this process are sectioned circle, segmented circle, partitioned circle.

Bar Chart Ppt PowerPoint Presentation Infographic Template Graphics Design
This is a bar chart ppt powerpoint presentation infographic template graphics design. This is a five stage process. The stages in this process are management, marketing, business, percentage, product.
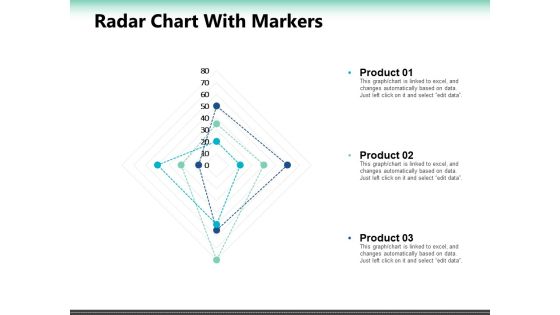
Radar Chart With Markers Ppt PowerPoint Presentation Summary Slide Portrait
This is a radar chart with markers ppt powerpoint presentation summary slide portrait. This is a seven stage process. The stages in this process are percentage, product, business, marketing.

Bubble Chart Finance Ppt PowerPoint Presentation File Master Slide
This is a bubble chart finance ppt powerpoint presentation file master slide. This is a three stage process. The stages in this process are finance, marketing, management, investment, analysis.

Pie Chart Finance Ppt PowerPoint Presentation Styles Graphics Template
This is a pie chart finance ppt powerpoint presentation styles graphics template. This is a three stage process. The stages in this process are financial, minimum, medium, maximum, marketing.

Volume High Low Close Chart Ppt PowerPoint Presentation Pictures Objects
This is a volume high low close chart ppt powerpoint presentation pictures objects. This is a one stage process. The stages in this process are finance, marketing, management, investment, analysis.
Five Steps Chart With Icons Ppt PowerPoint Presentation Infographics Guidelines
This is a five steps chart with icons ppt powerpoint presentation infographics guidelines. This is a five stage process. The stages in this process are boxes and arrows, cartoon and arrows, text boxes with arrows.
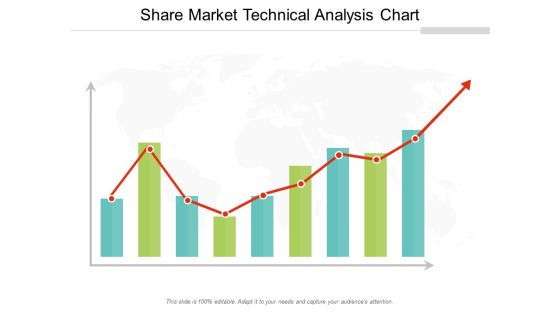
Share Market Technical Analysis Chart Ppt Powerpoint Presentation Professional Rules
This is a share market technical analysis chart ppt powerpoint presentation professional rules. This is a three stage process. The stages in this process are stock market, financial market, bull market.

Mobile With Analytics Chart Ppt PowerPoint Presentation Layouts Graphics
This is a mobile with analytics chart ppt powerpoint presentation layouts graphics. This is a four stage process. The stages in this process are mobile analytics, mobile tracking, mobile web analytics.
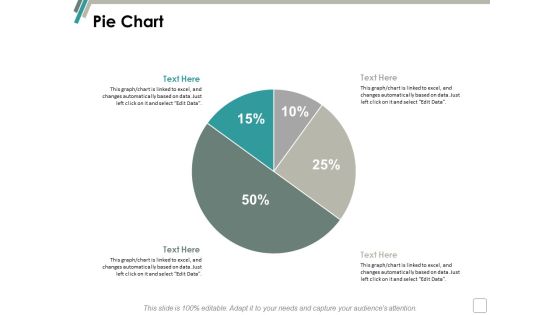
Pie Chart Finance Marketing Ppt Powerpoint Presentation Infographics Background
This is a pie chart finance marketing ppt powerpoint presentation infographics background. This is a two stage process. The stages in this process are finance, marketing, management, investment, analysis.

Volume High Low Close Chart Ppt Powerpoint Presentation Slides Images
This is a volume high low close chart ppt powerpoint presentation slides images. This is a five stage process. The stages in this process are finance, marketing, management, investment, analysis.

Project Management Gantt Chart Marketing Ppt PowerPoint Presentation Show Guide
This is a project management gantt chart marketing ppt powerpoint presentation show guide. This is a three stage process. The stages in this process are business, management, marketing, compare.
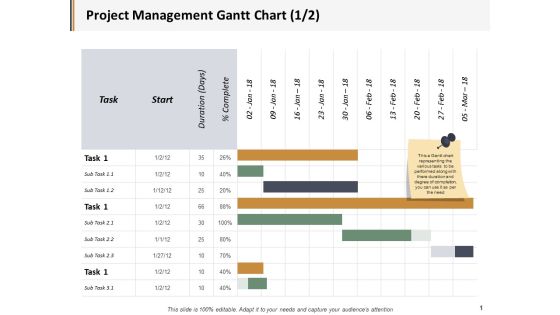
Project Management Gantt Chart Ppt PowerPoint Presentation File Graphic Images
This is a project management gantt chart ppt powerpoint presentation file graphic images. This is a three stage process. The stages in this process are business, management, marketing, compare.

Area Chart Finance Marketing Ppt Powerpoint Presentation Gallery Slides
This is a area chart finance marketing ppt powerpoint presentation gallery slides. This is a three stage process. The stages in this process are finance, marketing, management, investment, analysis.
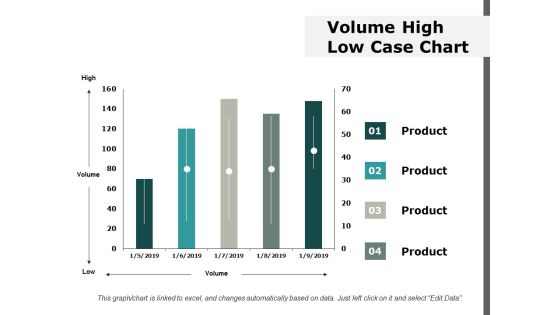
Volume High Low Case Chart Ppt Powerpoint Presentation Ideas Information
This is a volume high low case chart ppt powerpoint presentation ideas information. This is a four stage process. The stages in this process are finance, marketing, management, investment, analysis.

Commodities Exchange Basics Ppt Powerpoint Presentation Diagram Graph Charts
This is a commodities exchange basics ppt powerpoint presentation diagram graph charts. This is a four stage process. The stages in this process are finance, marketing, management, investment, analysis.

Cash Payment Management Flow Chart Ppt PowerPoint Presentation Styles Professional
This is a cash payment management flow chart ppt powerpoint presentation styles professional. This is a seven stage process. The stages in this process are liquidity, cash assets, solvency.

Combo Chart Marketing Analysis Ppt Powerpoint Presentation Pictures Icons
This is a combo chart marketing analysis ppt powerpoint presentation pictures icons. This is a three stage process. The stages in this process are finance, marketing, management, investment, analysis.

Scatter Chart Analysis Marketing Ppt Powerpoint Presentation Summary Infographic Template
This is a scatter chart analysis marketing ppt powerpoint presentation summary infographic template. This is a two stage process. The stages in this process are finance, marketing, management, investment, analysis.

Stacked Column Chart Analysis Ppt PowerPoint Presentation Slides Graphics Design
This is a stacked column chart analysis ppt powerpoint presentation slides graphics design. This is a three stage process. The stages in this process are finance, marketing, management, investment, analysis.

Bar Chart Finance Marketing Ppt Powerpoint Presentation Gallery Grid
This is a bar chart finance marketing ppt powerpoint presentation gallery grid. This is a three stage process. The stages in this process are finance, marketing, management, investment, analysis.

area chart finance ppt powerpoint presentation portfolio graphics download
This is a area chart finance ppt powerpoint presentation portfolio graphics download. This is a two stage process. The stages in this process are finance, marketing, management, investment, analysis.

Pie Chart Finance Ppt Powerpoint Presentation Layouts Design Ideas
This is a pie chart finance ppt powerpoint presentation layouts design ideas. This is a four stage process. The stages in this process are finance, marketing, management, investment, analysis.

Area Chart Finance Ppt PowerPoint Presentation Infographic Template Model
This is a area chart finance ppt powerpoint presentation infographic template model. This is a two stage process. The stages in this process are finance, marketing, management, investment, analysis.

Bar Chart Business Management Ppt PowerPoint Presentation Ideas Example Introduction
This is a bar chart business management ppt powerpoint presentation ideas example introduction. This is a three stage process. The stages in this process are finance, marketing, management, investment, analysis.

Column Chart And Graph Ppt PowerPoint Presentation File Introduction
This is a column chart and graph ppt powerpoint presentation file introduction. This is a three stage process. The stages in this process are finance, marketing, management, investment, analysis.

Area Chart Finance Marketing Ppt Powerpoint Presentation Show Grid
This is a area chart finance marketing ppt powerpoint presentation show grid. This is a three stage process. The stages in this process are finance, marketing, management, investment, analysis.

Area Chart Finance Ppt PowerPoint Presentation Infographic Template Graphics Template
This is a area chart finance ppt powerpoint presentation infographic template graphics template. This is a two stage process. The stages in this process are finance, marketing, management, investment, analysis.

Pie Chart Finance Ppt PowerPoint Presentation Infographics Mockup
This is a pie chart finance ppt powerpoint presentation infographics mockup . This is a four stage process. The stages in this process are finance, marketing, management, investment, analysis.

Combo Chart Finance Ppt PowerPoint Presentation Summary Design Ideas
This is a combo chart finance ppt powerpoint presentation summary design ideas. This is a three stage process. The stages in this process are finance, marketing, management, investment, analysis.

Scatter Bubble Chart Graph Ppt PowerPoint Presentation Infographic Template Maker
This is a scatter bubble chart graph ppt powerpoint presentation infographic template maker. This is a two stage process. The stages in this process are finance, marketing, management, investment, analysis.

Donut Pie Chart Graph Ppt PowerPoint Presentation File Styles
This is a donut pie chart graph ppt powerpoint presentation file styles. This is a three stage process. The stages in this process are finance, marketing, management, investment, analysis.

Donut Pie Chart Graph Ppt PowerPoint Presentation Ideas Guidelines
This is a donut pie chart graph ppt powerpoint presentation ideas guidelines. This is a three stage process. The stages in this process are finance, marketing, management, investment, analysis.
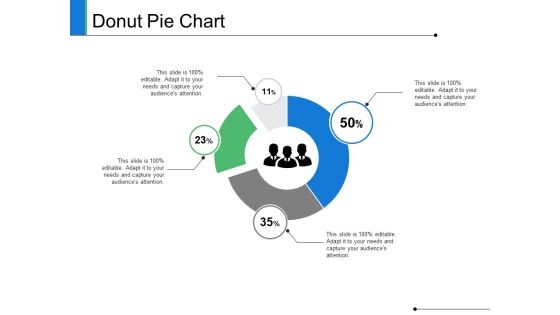
Donut Pie Chart Finance Ppt PowerPoint Presentation Styles Deck
This is a donut pie chart finance ppt powerpoint presentation styles deck. This is a four stage process. The stages in this process are finance, marketing, management, investment, analysis.
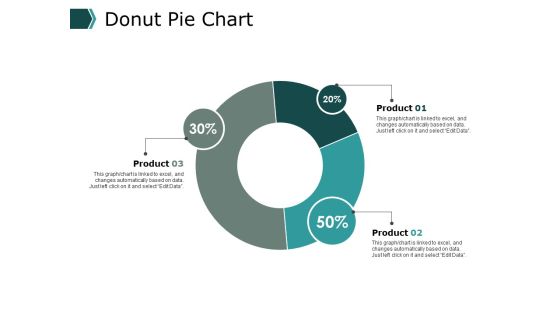
Donut Pie Chart Finance Ppt PowerPoint Presentation File Slide Download
This is a donut pie chart finance ppt powerpoint presentation file slide download. This is a three stage process. The stages in this process are finance, marketing, management, investment, analysis.

Combo Chart Graph Ppt PowerPoint Presentation Infographic Template Layout Ideas
This is a combo chart graph ppt powerpoint presentation infographic template layout ideas. This is a three stage process. The stages in this process are finance, marketing, analysis, investment, million.

Combo Chart Graph Ppt PowerPoint Presentation Gallery Designs Download
This is a combo chart graph ppt powerpoint presentation gallery designs download. This is a three stage process. The stages in this process are finance, marketing, analysis, investment, million.
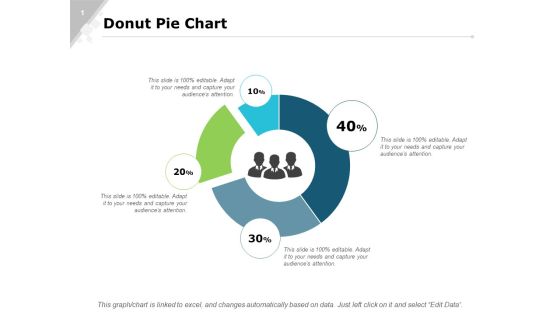
Donut Pie Chart Bar Ppt PowerPoint Presentation Infographics Slide Portrait
This is a donut pie chart bar ppt powerpoint presentation infographics slide portrait. This is a four stage process. The stages in this process are finance, marketing, analysis, investment, million.

Area Chart Graph Ppt PowerPoint Presentation Professional Format Ideas
This is a column chart graph ppt powerpoint presentation slides file formats. This is a stage three process. The stages in this process are finance, marketing, analysis, investment, million.

Clustered Bar Chart Finance Ppt Powerpoint Presentation Icon Graphics Template
This is a clustered bar chart finance ppt powerpoint presentation icon graphics template. This is a four stage process. The stages in this process are finance, marketing, management, investment, analysis.

Combo Chart Marketing Ppt Powerpoint Presentation Ideas Format Ideas Cpb
This is a combo chart marketing ppt powerpoint presentation ideas format ideas cpb. This is a three stage process. The stages in this process are finance, marketing, management, investment, analysis.

Donut Pie Chart Finance Ppt PowerPoint Presentation Styles Summary
This is a donut pie chart finance ppt powerpoint presentation styles summary. This is a three stage process. The stages in this process are finance, marketing, management, investment, analysis.

Business Sales PowerPoint Templates Business Arrows Pointing Inwards Chart Ppt Slides
Business Sales PowerPoint Templates Business arrows pointing inwards chart PPT Slides-Use this arrow pointing inward chart to determine your targets and sequence them as per your priorities. Unravel each one for your audience while setting key timelines as you go along. -Business Sales PowerPoint Templates Business arrows pointing inwards chart PPT Slides-This ppt can be used for concepts relating to-3d, Accounting, Arrow, Blue, Button, Chart, Corporate, Crystal, Data, Design, Diagram, Graphic,, Illustration etc.
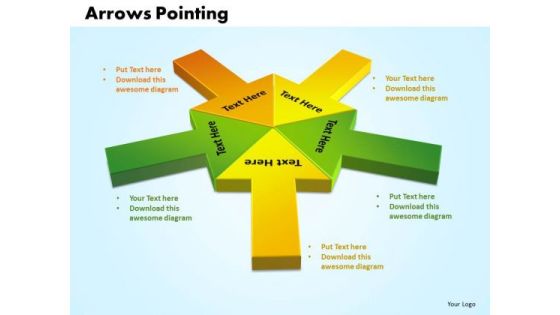
Business Teamwork PowerPoint Templates Business Arrows Pointing Inwards Chart Ppt Slides
Business Teamwork PowerPoint Templates Business arrows pointing inwards chart PPT Slides-Use this arrow pointing inward chart to determine your targets and sequence them as per your priorities. Unravel each one for your audience while setting key timelines as you go along. -Business Teamwork PowerPoint Templates Business arrows pointing inwards chart PPT Slides-This ppt can be used for concepts relating to-3d, Accounting, Arrow, Blue, Button, Chart, Corporate, Crystal, Data, Design, Diagram Etc.

Supply Chain Web With E Commerce Retail Trade Chart Ppt Example
This is a supply chain web with e commerce retail trade chart ppt example. This is a five stage process. The stages in this process are imports, manufacturing, wholesale, retail, consumer.
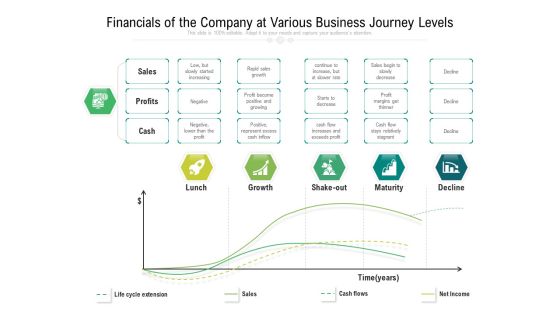
Financials Of The Company At Various Business Journey Levels Ppt PowerPoint Presentation File Portrait PDF
Presenting financials of the company at various business journey levels ppt powerpoint presentation file portrait pdf to dispense important information. This template comprises five stages. It also presents valuable insights into the topics including growth, maturity, decline. This is a completely customizable PowerPoint theme that can be put to use immediately. So, download it and address the topic impactfully.
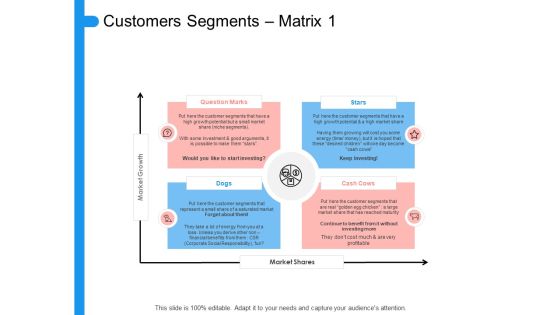
Target Persona Customers Segments Matrix Ppt Slides Example Topics PDF
Presenting target persona customers segments matrix ppt slides example topics pdf to provide visual cues and insights. Share and navigate important information on four stages that need your due attention. This template can be used to pitch topics like market shares, market growth. In addition, this PPT design contains high-resolution images, graphics, etc, that are easily editable and available for immediate download.

Reach Your Target Audience Customers Segments Matrix Marks Guidelines PDF
Presenting reach your target audience customers segments matrix marks guidelines pdf to provide visual cues and insights. Share and navigate important information on four stages that need your due attention. This template can be used to pitch topics like market growth, market shares. In addition, this PPT design contains high-resolution images, graphics, etc, that are easily editable and available for immediate download.
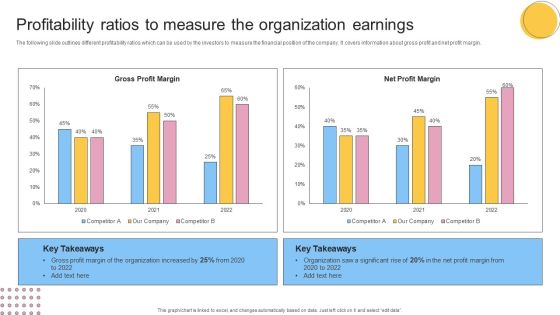
Profitability Ratios To Measure The Organization Earnings Ideas PDF
The following slide outlines different profitability ratios which can be used by the investors to measure the financial position of the company. It covers information about gross profit and net profit margin. Do you have an important presentation coming up Are you looking for something that will make your presentation stand out from the rest Look no further than Profitability Ratios To Measure The Organization Earnings Ideas PDF. With our professional designs, you can trust that your presentation will pop and make delivering it a smooth process. And with Slidegeeks, you can trust that your presentation will be unique and memorable. So why wait Grab Profitability Ratios To Measure The Organization Earnings Ideas PDF today and make your presentation stand out from the rest.
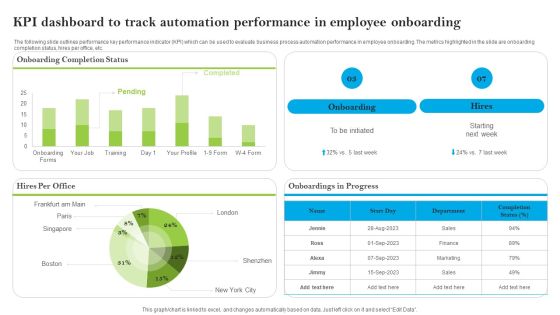
Introducing AI Tools KPI Dashboard To Track Automation Performance In Employee Formats PDF
The following slide outlines performance key performance indicator KPI which can be used to evaluate business process automation performance in employee onboarding. The metrics highlighted in the slide are onboarding completion status, hires per office, etc. This modern and well-arranged Introducing AI Tools KPI Dashboard To Track Automation Performance In Employee Formats PDF provides lots of creative possibilities. It is very simple to customize and edit with the Powerpoint Software. Just drag and drop your pictures into the shapes. All facets of this template can be edited with Powerpoint, no extra software is necessary. Add your own material, put your images in the places assigned for them, adjust the colors, and then you can show your slides to the world, with an animated slide included.

Kpi Dashboard To Measure Effectiveness Of Youtube Marketing Slides PDF
The following slide outlines key performance indicator KPI dashboard which will assist the marketer to track YouTube marketing campaign performance. The key metrics covered in the slide are subscribers gained and lost, likes, dislikes, comments, shares etc. Do you have an important presentation coming up Are you looking for something that will make your presentation stand out from the rest Look no further than Kpi Dashboard To Measure Effectiveness Of Youtube Marketing Slides PDF. With our professional designs, you can trust that your presentation will pop and make delivering it a smooth process. And with Slidegeeks, you can trust that your presentation will be unique and memorable. So why wait Grab Kpi Dashboard To Measure Effectiveness Of Youtube Marketing Slides PDF today and make your presentation stand out from the rest.
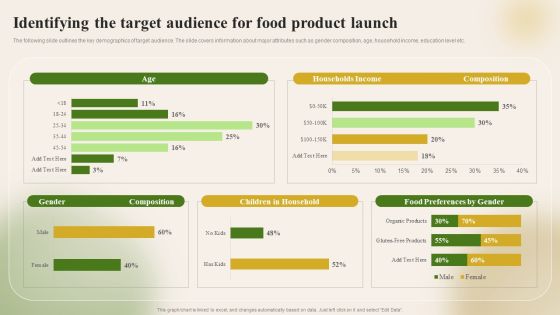
Introducing New Food Commodity Identifying The Target Audience For Food Product Guidelines PDF
The following slide outlines the key demographics of target audience. The slide covers information about major attributes such as gender composition, age, household income, education level etc. Do you have an important presentation coming up Are you looking for something that will make your presentation stand out from the rest Look no further than Introducing New Food Commodity Identifying The Target Audience For Food Product Guidelines PDF. With our professional designs, you can trust that your presentation will pop and make delivering it a smooth process. And with Slidegeeks, you can trust that your presentation will be unique and memorable. So why wait Grab Introducing New Food Commodity Identifying The Target Audience For Food Product Guidelines PDF today and make your presentation stand out from the rest.

Market Evaluation Of IT Industry Financial Dashboard To Track Organization Expenses Clipart PDF
The following slide showcases KPI dashboard which can be used by finance managers to evaluate financial health of company. Revenue, expenses, net profit, bills receivable, bills payable, quick ratio, current ratio are some of the major metrics which are outlined in the slide. Do you have an important presentation coming up Are you looking for something that will make your presentation stand out from the rest Look no further than Market Evaluation Of IT Industry Financial Dashboard To Track Organization Expenses Clipart PDF. With our professional designs, you can trust that your presentation will pop and make delivering it a smooth process. And with Slidegeeks, you can trust that your presentation will be unique and memorable. So why wait Grab Market Evaluation Of IT Industry Financial Dashboard To Track Organization Expenses Clipart PDF today and make your presentation stand out from the rest.
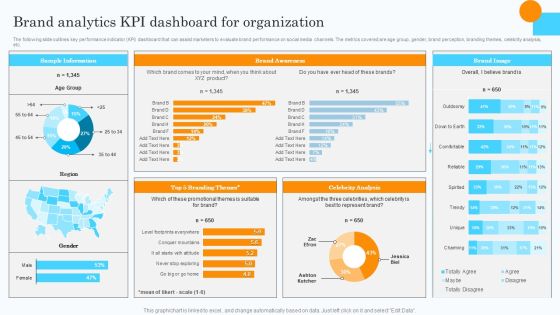
Market Research Assessment Of Target Market Requirements Brand Analytics Kpi Dashboard For Organization Clipart PDF
The following slide outlines key performance indicator KPI dashboard that can assist marketers to evaluate brand performance on social media channels. The metrics covered are age group, gender, brand perception, branding themes, celebrity analysis, etc. Do you have an important presentation coming up Are you looking for something that will make your presentation stand out from the rest Look no further than Market Research Assessment Of Target Market Requirements Brand Analytics Kpi Dashboard For Organization Clipart PDF. With our professional designs, you can trust that your presentation will pop and make delivering it a smooth process. And with Slidegeeks, you can trust that your presentation will be unique and memorable. So why wait Grab Market Research Assessment Of Target Market Requirements Brand Analytics Kpi Dashboard For Organization Clipart PDF today and make your presentation stand out from the rest.


 Continue with Email
 Sign up for an account
 Home
Home