Improvement Chart
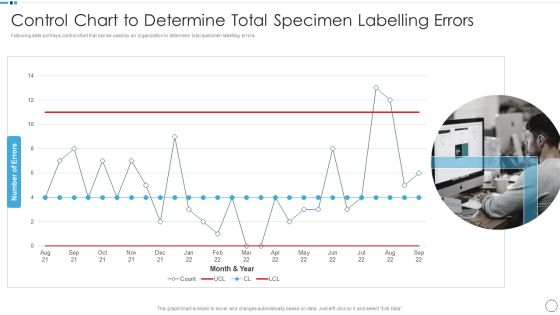
QA Plan Set 1 Control Chart To Determine Total Specimen Labelling Errors Sample PDF
Deliver an awe inspiring pitch with this creative QA Plan Set 1 Control Chart To Determine Total Specimen Labelling Errors Sample PDF bundle. Topics like Control Chart To Determine, Specimen Labelling Errors can be discussed with this completely editable template. It is available for immediate download depending on the needs and requirements of the user.
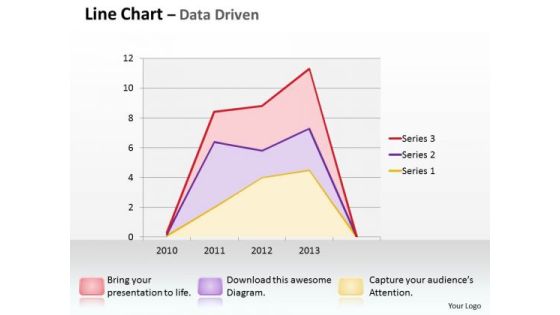
Multivariate Data Analysis Driven Line Chart Shows Revenue Trends PowerPoint Slides Templates
Good Camaraderie Is A Key To Teamwork. Our multivariate data analysis driven line chart shows revenue trends powerpoint slides Templates Can Be A Cementing Force.

Ppt 3d Men Standing On Concept Download Free Pie PowerPoint Template Chart Templates
PPT 3d men standing on concept download free pie powerpoint template chart Templates-Use this 3D Amazing PowerPoint Diagram to illustrate the steps to be followed in Circular Process. It is represented by five colorful stages. This Diagram shows every single stage which can be explained in single slide to make your Presentation Attractive.-PPT 3d men standing on concept download free pie powerpoint template chart Templates-3d, arrow, background, blue, chart, circle, circular, circulation, clipart, colorful, connection, continuity, cut, cycle, cyclic, diagram, direction, empty, flow, graph, green, icon, illustration, isolated, loop, motion, pink, presentation, process, progress, reason, recycle, recycling, repetition, report, result, ring, rotation, round, scheme, section, step, sticker, symbol, teamwork, template, turn, vector

Ppt Green Men Standing On Business Layouts PowerPoint 2003 Download Pie Chart Templates
PPT green men standing on business layouts powerpoint 2003 download pie chart Templates-This PowerPoint Diagram showing Green Man out of Group of people standing on the circular Puzzle process. It signifies the concept of analyze, conceive, conceptualize, conjure up, create, deliberate, dream up, invent, plan, ponder, put heads together, rack brains, share ideas and think.-PPT green men standing on business layouts powerpoint 2003 download pie chart Templates-3d, arrow, background, blue, chart, circle, circular, clipart, colorful, connection, continuity, cycle, cyclic, diagram, direction, flow, graph, icon, illustration, isolated, loop, motion, process, progress, recycle, ring, round, step, sticker, symbol, teamwork, template, turn, vector
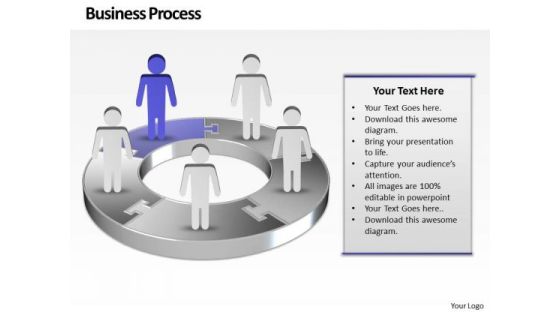
Ppt Purple Men Standing On Free Concept Pie PowerPoint Presentation Chart Templates
PPT purple men standing on free concept pie powerpoint presentation chart Templates-Use this Circular Arrow diagram to show activities that are related to the business plan metrics and monitor the results to determine if the business plan is proceeding as planned.-PPT purple men standing on free concept pie powerpoint presentation chart Templates-3d, arrow, background, blue, chart, circle, circular, clipart, colorful, connection, continuity, cycle, cyclic, diagram, direction, flow, graph, icon, illustration, isolated, loop, motion, process, progress, recycle, ring, round, step, sticker, symbol, teamwork, template, turn, vector

Research And Development Stages Flow Chart For Customer Centric Product Development Mockup PDF
Following slide showcases flow chart for customer requirement based product research and development to increase customer satisfaction. It includes key components such as customers, customer support service team and production team. Persuade your audience using this Research And Development Stages Flow Chart For Customer Centric Product Development Mockup PDF. This PPT design covers three stages, thus making it a great tool to use. It also caters to a variety of topics including Customer, Customer Support Service Team, Production Team. Download this PPT design now to present a convincing pitch that not only emphasizes the topic but also showcases your presentation skills.
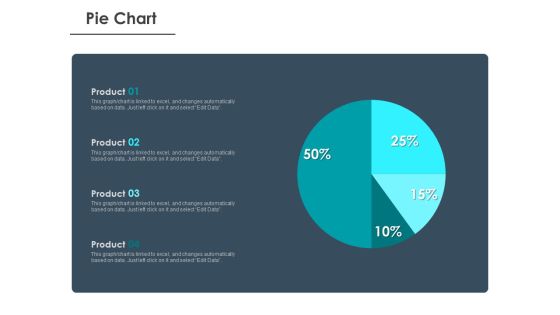
Strategic Plan For Companys Development Pie Chart Ppt PowerPoint Presentation Show Templates
Presenting this set of slides with name strategic plan for companys development pie chart ppt powerpoint presentation show templates. The topics discussed in these slide is pie chart. This is a completely editable PowerPoint presentation and is available for immediate download. Download now and impress your audience.

Business Circle Chart PowerPoint Templates Business Market Research Data Ppt Slides
Business Circle Chart PowerPoint Templates Business market research data PPT Slides-\nThis PowerPoint diagram slide shows a circular process withan arrow. Useful to represent process slides-Business Circle Chart PowerPoint Templates Business market research data PPT Slides-This template can be used for presentations relating to 3d, Abstract, Around, Arrow, Background, Bright, Business, Card, Chart, Circle, Circular, Circulation, Collection, Colorful, Communication, Concept, Cycle, Cyclic, Design, Direction, Element, Flow, Glass, Glossy, Graphic, Icon, Illustration, Modern, Motion, Network

Business Chart PowerPoint Templates Business 3d Double Concentric Rings Pieces Ppt Slides
Business Chart PowerPoint Templates Business 3d double concentric rings pieces PPT Slides-Use this diagram to explain the contribution of each of the elements and how they provide impetus to the next phase. Highlight any anticipated problems, shortfalls or weak areas-Business Chart PowerPoint Templates Business 3d double concentric rings pieces PPT Slides-This ppt can be used for concepts relating to-3d, Abstract, Account, Achievement, Analyst, Annual, Background, Blue, Business, Capital, Chart, Circular, Conceptual, Data, Design, Diagram, Document, Earnings, Economic, Finance, Financial, Forecast, Icon, Illustration
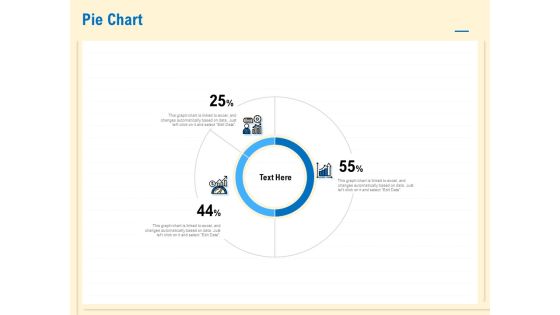
Prioritization Techniques For Software Development And Testing Pie Chart Template PDF
Presenting this set of slides with name prioritization techniques for software development and testing pie chart template pdf. The topics discussed in these slide is pie chart. This is a completely editable PowerPoint presentation and is available for immediate download. Download now and impress your audience.

Velocity Chart With Lower And Upper Control Limit Ppt PowerPoint Presentation Gallery Infographics PDF
Pitch your topic with ease and precision using this velocity chart with lower and upper control limit ppt powerpoint presentation gallery infographics pdf. This layout presents information on velocity chart with lower and upper control limit. It is also available for immediate download and adjustment. So, changes can be made in the color, design, graphics or any other component to create a unique layout.
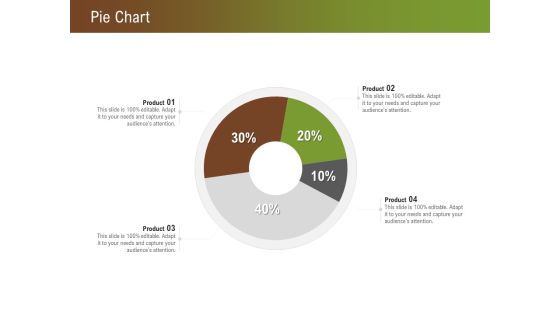
Steps For Successful Brand Building Process Pie Chart Ppt Inspiration Demonstration PDF
Presenting this set of slides with name steps for successful brand building process pie chart ppt inspiration demonstration pdf. The topics discussed in these slide is pie chart. This is a completely editable PowerPoint presentation and is available for immediate download. Download now and impress your audience.
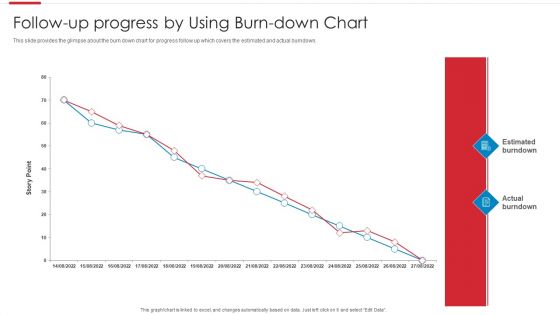
Agile Software Development Process Follow Up Progress By Using Burn Down Chart Slides PDF
This slide provides the glimpse about the burn down chart for progress follow up which covers the estimated and actual burndown. Deliver an awe inspiring pitch with this creative Agile Software Development Process Follow Up Progress By Using Burn Down Chart Slides PDF bundle. Topics like Estimated Burndown, Actual Burndown can be discussed with this completely editable template. It is available for immediate download depending on the needs and requirements of the user.

Clustered Bar Chart Percentage Product Ppt PowerPoint Presentation Portfolio Example Introduction
This is a clustered bar chart percentage product ppt powerpoint presentation portfolio example introduction. This is a three stage process. The stages in this process are area chart, finance, marketing, management, investment.
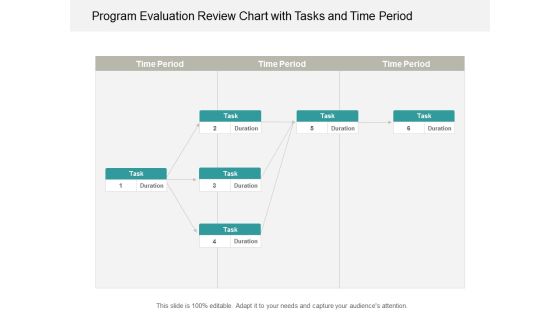
Program Evaluation Review Chart With Tasks And Time Period Ppt Powerpoint Presentation Portfolio Infographic Template
This is a program evaluation review chart with tasks and time period ppt powerpoint presentation portfolio infographic template. This is a six stage process. The stages in this process are pert chart, program evaluation and review technique, pert graph.
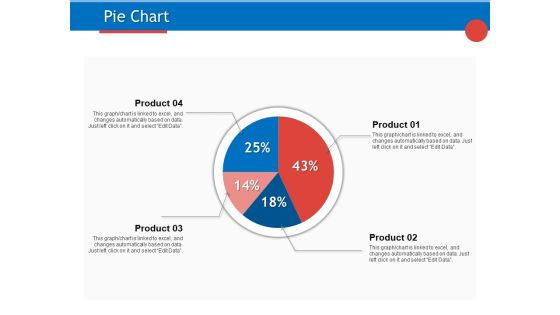
Developing Product Planning Strategies Pie Chart Ppt PowerPoint Presentation Gallery Styles PDF
Presenting this set of slides with name developing product planning strategies pie chart ppt powerpoint presentation gallery styles pdf. The topics discussed in these slide is pie chart. This is a completely editable PowerPoint presentation and is available for immediate download. Download now and impress your audience.
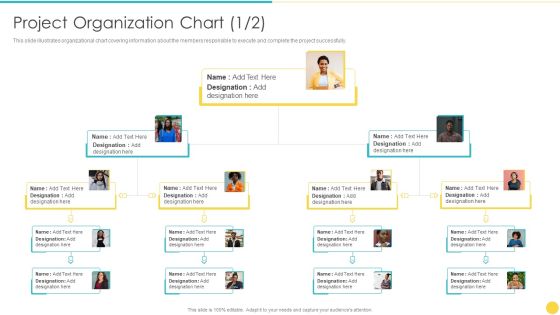
Project Management Professional Toolset IT Project Organization Chart Execute Introduction PDF
Following slide portrays organizational chart covering information about the members responsible to execute and complete the project successfully. Presenting project management professional toolset it project organization chart execute introduction pdf to provide visual cues and insights. Share and navigate important information on two stages that need your due attention. This template can be used to pitch topics like project organization chart. In addtion, this PPT design contains high resolution images, graphics, etc, that are easily editable and available for immediate download.

Determine Burndown Chart For Daily Progress Reporting Developing Fixed Bid Projects Using Agile IT Background PDF
This slide provides information regarding release burndown chart as scrum tool for monitoring scrum project progress. Deliver and pitch your topic in the best possible manner with this determine burndown chart for daily progress reporting developing fixed bid projects using agile it background pdf. Use them to share invaluable insights on monitoring, development and impress your audience. This template can be altered and modified as per your expectations. So, grab it now.

Bar Chart Showing Quarterly Business Sales Ppt PowerPoint Presentation Model Icon
Presenting this set of slides with name bar chart showing quarterly business sales ppt powerpoint presentation model icon. The topics discussed in these slides are revenue trend, bar chart, financial. This is a completely editable PowerPoint presentation and is available for immediate download. Download now and impress your audience.
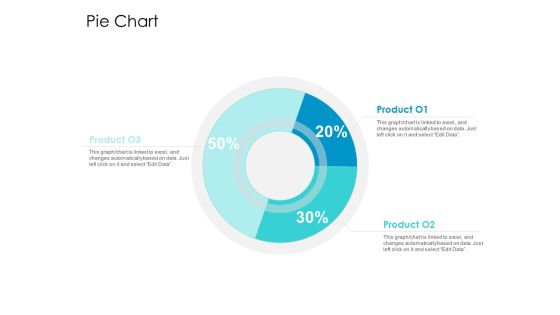
Developing New Sales And Marketing Strategic Approach Pie Chart Ppt PowerPoint Presentation Professional Example PDF
Presenting this set of slides with name developing new sales and marketing strategic approach pie chart ppt powerpoint presentation professional example pdf. The topics discussed in these slide is pie chart. This is a completely editable PowerPoint presentation and is available for immediate download. Download now and impress your audience.

Developing And Creating Corner Market Place Column Chart Ppt PowerPoint Presentation Infographics Brochure PDF
Presenting this set of slides with name developing and creating corner market place column chart ppt powerpoint presentation infographics brochure pdf. The topics discussed in these slide is column chart. This is a completely editable PowerPoint presentation and is available for immediate download. Download now and impress your audience.
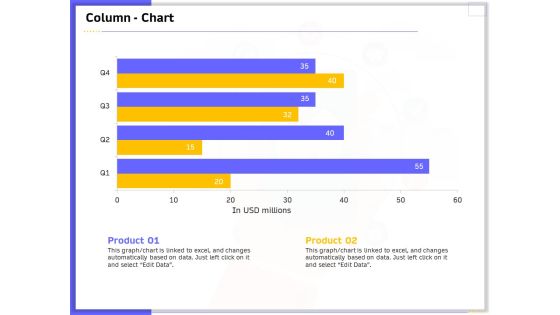
Developing And Deploying Android Applications Column Chart Ppt Show Guide PDF
Presenting this set of slides with name developing and deploying android applications column chart ppt show guide pdf. The topics discussed in these slide is column chart. This is a completely editable PowerPoint presentation and is available for immediate download. Download now and impress your audience.

Android Framework For Apps Development And Deployment Area Chart Ppt PowerPoint Presentation Layouts Graphics Pictures PDF
Presenting this set of slides with name android framework for apps development and deployment area chart ppt powerpoint presentation layouts graphics pictures pdf. The topics discussed in these slide is area chart. This is a completely editable PowerPoint presentation and is available for immediate download. Download now and impress your audience.

Android Framework For Apps Development And Deployment Column Chart Ppt PowerPoint Presentation Professional Format Ideas PDF
Presenting this set of slides with name android framework for apps development and deployment column chart ppt powerpoint presentation professional format ideas pdf. The topics discussed in these slide is column chart. This is a completely editable PowerPoint presentation and is available for immediate download. Download now and impress your audience.
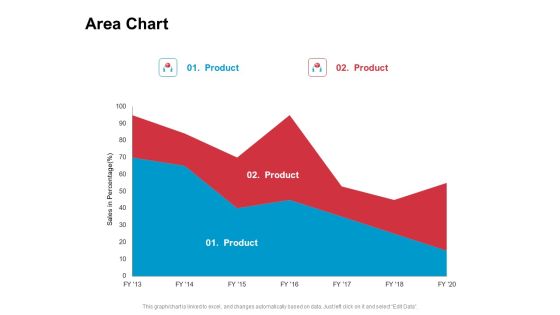
New Product Development Performance Evaluation Area Chart Ppt PowerPoint Presentation Show PDF
Presenting this set of slides with name new product development performance evaluation area chart ppt powerpoint presentation show pdf. The topics discussed in these slide is area chart. This is a completely editable PowerPoint presentation and is available for immediate download. Download now and impress your audience.

New Product Development Performance Evaluation Column Chart Ppt PowerPoint Presentation Show Example Topics PDF
Presenting this set of slides with name new product development performance evaluation column chart ppt powerpoint presentation show example topics pdf. The topics discussed in these slide is column chart. This is a completely editable PowerPoint presentation and is available for immediate download. Download now and impress your audience.
Project Task Planning And Evaluation Chart Ppt Powerpoint Presentation Icon Slide
This is a project task planning and evaluation chart ppt powerpoint presentation icon slide. This is a nine stage process. The stages in this process are pert chart, program evaluation and review technique, pert graph.

Business Circle Chart PowerPoint Templates Success Lego Blocks Flowchart Ppt Slides
Business Circle Chart PowerPoint Templates Success Lego Blocks Flowchart PPT Slides-This PowerPoint diagram shows a circular process with 2 arrows. Useful to represent process slides-Business Circle Chart PowerPoint Templates Success Lego Blocks Flowchart PPT Slides-This template can be used for presentations relating to Activity, Background, Block, Box, Brick, Build, Buildings, Child, Childhood, Colourful, Concept, Connect, Connection, Construction, Cube, Design, Development, Education, Element, Fun, Game, Geometric

Connecting Factors Diverging Arrow Diagram Ppt Circular Flow Chart PowerPoint Slides
We present our connecting factors diverging arrow diagram ppt Circular Flow Chart PowerPoint Slides.Present our Circle Charts PowerPoint Templates because you can Educate your listeners on the means to keep it ticking over. Download and present our Flow Charts PowerPoint Templates because Our PowerPoint Templates and Slides will let you meet your Deadlines. Download our Business PowerPoint Templates because you have had a great year or so business wise. It is time to celebrate the efforts of your team. Download our Shapes PowerPoint Templates because all for one and one for all. Download our Success PowerPoint Templates because you have come up with a brilliant breakthrough idea. you can also visualise the interest it will generate.Use these PowerPoint slides for presentations relating to Access, Arrow, Business, Concept, Conceptual, Connection, Corporate, Creative, Cycle, Design, Different, Empty, Graphic, Idea, Illustration, Process, Shape, Solution, Strategy, Symbol, Template. The prominent colors used in the PowerPoint template are Pink, White, Black. People tell us our connecting factors diverging arrow diagram ppt Circular Flow Chart PowerPoint Slides are Swanky. Use our Creative PowerPoint templates and PPT Slides are Graceful. Professionals tell us our connecting factors diverging arrow diagram ppt Circular Flow Chart PowerPoint Slides are Quaint. Presenters tell us our Business PowerPoint templates and PPT Slides are Amazing. Professionals tell us our connecting factors diverging arrow diagram ppt Circular Flow Chart PowerPoint Slides are Bright. PowerPoint presentation experts tell us our Business PowerPoint templates and PPT Slides are Nostalgic.
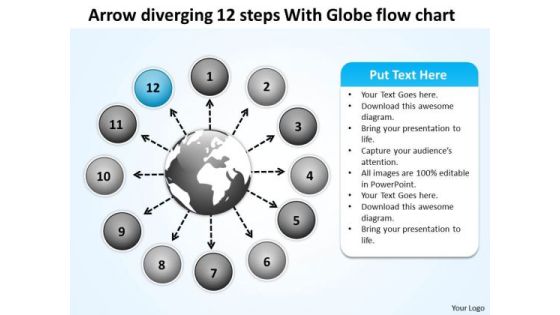
Arrow Diverging 12 Steps With Globe Flow Chart Circular PowerPoint Templates
We present our arrow diverging 12 steps with globe flow chart Circular PowerPoint templates.Download and present our Circle Charts PowerPoint Templates because you can Trigger audience minds with your interesting ideas. Download our Arrows PowerPoint Templates because the majestic tiger lord of all it surveys.It exudes power even when it is in repose. Use our Globe PowerPoint Templates because with the help of our Slides you can Illustrate how each element flows seamlessly onto the next stage. Present our Business PowerPoint Templates because you have analysed many global markets and come up with possibilities. Highlight the pros and cons of other likely business oppurtunities. Present our Flow Charts PowerPoint Templates because this Layout helps you to expand your plans to overcome obstacles and reassure the team that they shall continue to roll along merrily.Use these PowerPoint slides for presentations relating to 3d, abstract, aim, arrow, background, business, career, chart, circle, color, concept, creative, curve, design, development, direction, financial, flowing, gain, graph, green, group, growth, higher, illustration, increase, isolated, motion, moving, moving up, path, prediction, progress, red, series, shape, sign, success, symbol, target, turn, twisted, up, upload, upward, way, white, win. The prominent colors used in the PowerPoint template are Blue, Gray, White. PowerPoint presentation experts tell us our arrow diverging 12 steps with globe flow chart Circular PowerPoint templates are visually appealing. PowerPoint presentation experts tell us our background PowerPoint templates and PPT Slides are Ritzy. Presenters tell us our arrow diverging 12 steps with globe flow chart Circular PowerPoint templates are Amazing. Presenters tell us our aim PowerPoint templates and PPT Slides are Striking. You can be sure our arrow diverging 12 steps with globe flow chart Circular PowerPoint templates are Fun. We assure you our chart PowerPoint templates and PPT Slides are Swanky.
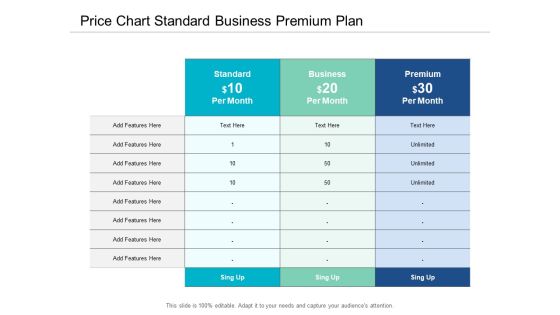
Price Chart Standard Business Premium Plan Ppt Powerpoint Presentation Visual Aids Infographic Template
This is a price chart standard business premium plan ppt powerpoint presentation visual aids infographic template. This is a three stage process. The stages in this process are comparison chart, comparison table, comparison matrix.

Program Evaluation Chart From Start To Finish Ppt Powerpoint Presentation Professional Examples
This is a program evaluation chart from start to finish ppt powerpoint presentation professional examples. This is a three stage process. The stages in this process are pert chart, program evaluation and review technique, pert graph.
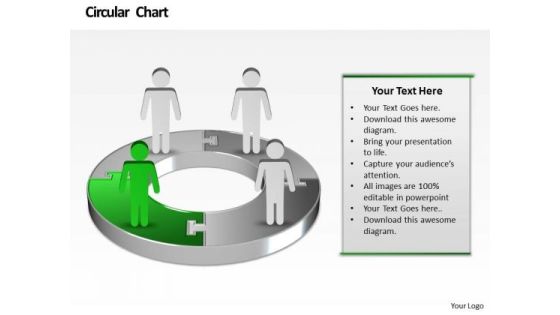
Ppt Business Men Standing Onl Pie Chart Birthday Presentation PowerPoint Templates
PPT business men standing onl pie chart birthday presentation powerpoint Templates-Develop competitive advantage with our above template which contains a diagram of one pie chart with cartoon men on it.This structure of our templates allows you to effectively highlight the key issues concerning to your business.-PPT business men standing onl pie chart birthday presentation powerpoint Templates-Arrows, Background, Business, Chart, Circle, Circular, Financial, Flow, Graphic, Gray, Icon, Illustration, Isometric, Perspective, Process, Recycle, Round, Shape, Flow, Marketing, Leadership, Steps
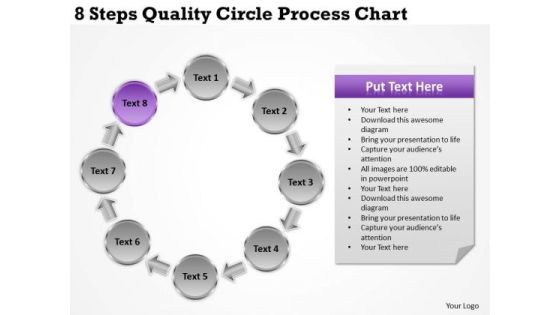
Business Strategy Consultant 8 Steps Quality Circle Process Chart Ppt Growth
We present our business strategy consultant 8 steps quality circle process chart ppt growth.Use our Flow Charts PowerPoint Templates because It can Conjure up grand ideas with our magical PowerPoint Templates and Slides. Leave everyone awestruck by the end of your presentation. Use our Business PowerPoint Templates because You can Be the puppeteer with our PowerPoint Templates and Slides as your strings. Lead your team through the steps of your script. Use our Process and Flows PowerPoint Templates because You can Zap them with our PowerPoint Templates and Slides. See them reel under the impact. Download and present our Circle Charts PowerPoint Templates because Our PowerPoint Templates and Slides provide you with a vast range of viable options. Select the appropriate ones and just fill in your text. Use our Shapes PowerPoint Templates because You are well armed with penetrative ideas. Our PowerPoint Templates and Slides will provide the gunpowder you need.Use these PowerPoint slides for presentations relating to Act, arrow, blue, business, chart, check, circle, concept, control, cycle, design, development, diagram, do, engineering, evaluate, flow, flow-chart, flowchart, graphic, green, idea, info graphic, iterative, life-cycle, lifecycle, management, method, model, process, quality, research, schema, software, spiral, step, strategy, success, system, vector, white, work, workflow. The prominent colors used in the PowerPoint template are Purple, Gray, White.
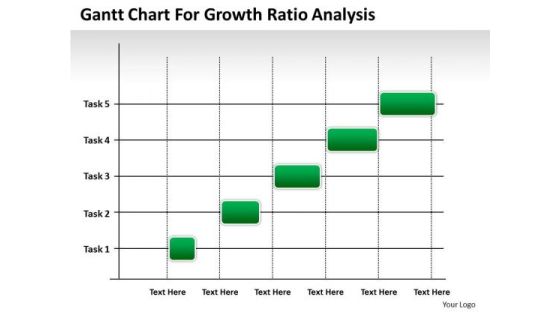
Consulting PowerPoint Template Gantt Chart For Growth Ratio Analysis Ppt Templates
Reduce the drag with our consulting PowerPoint template gantt chart for growth ratio analysis ppt templates. Give more lift to your thoughts. Your thoughts will make a dramatic entry. Write the script on our Org Charts PowerPoint Templates. Our Advertising PowerPoint Templates enjoy drama. They provide entertaining backdrops.

Column Chart Template 2 Ppt PowerPoint Presentation Infographic Template Example Introduction
This is a column chart template 2 ppt powerpoint presentation infographic template example introduction. This is a two stage process. The stages in this process are column chart, finance, analysis, marketing, strategy.
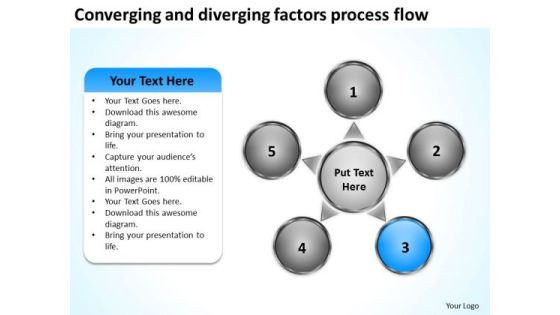
And Diverging Factors Process Flow Chart Relative Circular Arrow Network PowerPoint Templates
We present our and diverging factors process flow chart Relative Circular Arrow Network PowerPoint templates.Present our Business PowerPoint Templates because you are ready to flap your wings and launch off. All poised are you to touch the sky with glory. Download and present our Process and Flows PowerPoint Templates because you have a good idea of the roadmap to your desired destination. Download and present our Marketing PowerPoint Templates because networking is an imperative in todays world. You need to access the views of others. Similarly you need to give access to them of your abilities. Download our Circle Charts PowerPoint Templates because presenting your views using our innovative slides, will be assured of leaving a lasting impression. Present our Flow Charts PowerPoint Templates because honesty is the best policy has an ardent follower in you.Use these PowerPoint slides for presentations relating to Achievement, Aim, Arrow, Business, Chart, Communication, Diagram, Direction, Graphic, Growth, Guide, Increase, Marketing, Presentation, Shape, Sign, Success, Target, Team, Teamwork. The prominent colors used in the PowerPoint template are Blue, White, Gray. People tell us our and diverging factors process flow chart Relative Circular Arrow Network PowerPoint templates will help them to explain complicated concepts. Use our Diagram PowerPoint templates and PPT Slides are Liberated. Professionals tell us our and diverging factors process flow chart Relative Circular Arrow Network PowerPoint templates are Functional. Presenters tell us our Communication PowerPoint templates and PPT Slides are Delightful. Professionals tell us our and diverging factors process flow chart Relative Circular Arrow Network PowerPoint templates look good visually. PowerPoint presentation experts tell us our Diagram PowerPoint templates and PPT Slides will help them to explain complicated concepts.
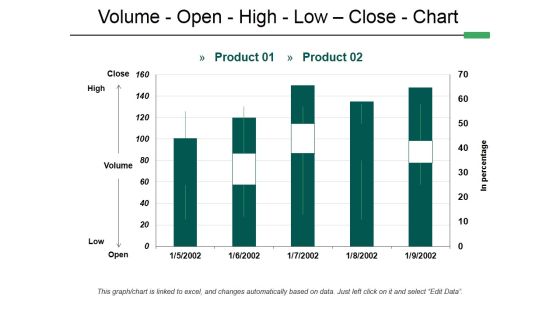
Volume Open High Low Close Chart Ppt PowerPoint Presentation Infographic Template Guidelines
This is a volume open high low close chart ppt powerpoint presentation infographic template guidelines. This is a two stage process. The stages in this process are volume, open, high, low, close, chart.

Area Chart Finance Marketing Ppt PowerPoint Presentation Infographic Template Master Slide
This is a area chart finance marketing ppt powerpoint presentation infographic template master slide. This is a three stage process. The stages in this process are area chart, finance, marketing, analysis, investment.
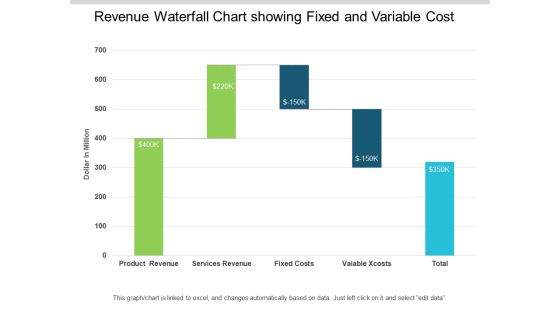
Revenue Waterfall Chart Showing Fixed And Variable Cost Ppt PowerPoint Presentation Infographic Template Images
This is a revenue waterfall chart showing fixed and variable cost ppt powerpoint presentation infographic template images. This is a five stage process. The stages in this process are sales waterfall, waterfall chart, business.

Service Strategy And Service Lifecycle Implementation Bar Chart Ppt Outline Show PDF
Presenting this set of slides with name service strategy and service lifecycle implementation bar chart ppt outline show pdf. The topics discussed in these slide is bar chart. This is a completely editable PowerPoint presentation and is available for immediate download. Download now and impress your audience.
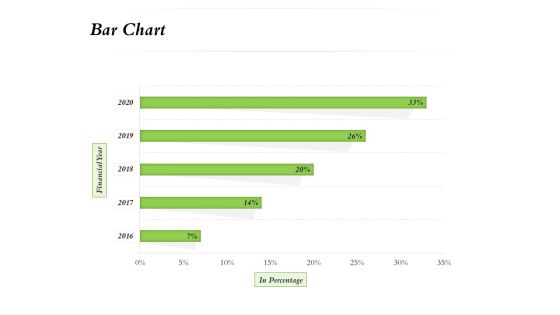
Select Of Organizational Model That Supports Your Strategy Bar Chart Ppt Outline Structure PDF
Presenting this set of slides with name select of organizational model that supports your strategy bar chart ppt outline structure pdf. The topics discussed in these slide is bar chart. This is a completely editable PowerPoint presentation and is available for immediate download. Download now and impress your audience.

Business Bar Chart With Percentage Analysis Ppt PowerPoint Presentation File Outline PDF
Presenting this set of slides with name business bar chart with percentage analysis ppt powerpoint presentation file outline pdf. The topics discussed in these slide is business bar chart with percentage analysis. This is a completely editable PowerPoint presentation and is available for immediate download. Download now and impress your audience.

9 Steps Diverging Concepts Leading To One Issue Cycle Chart PowerPoint Templates
We present our 9 steps diverging concepts leading to one issue Cycle Chart PowerPoint templates.Download and present our Process and flows PowerPoint Templates because your group can behave steady in the top bracket. Present our Shapes PowerPoint Templates because it gives a core idea about various enveloping layers. Download and present our Circle charts PowerPoint Templates because this outlines the path you have in mind in order to boost sales and stay ahead of the competition enhancing your corporate reputation as you go along the road to success. Present our Signs PowerPoint Templates because our template will help pinpoint their viability. Present our Ring charts PowerPoint Templates because this diagram depicts the essence of this chain reaction like sequence of events.Use these PowerPoint slides for presentations relating to Arrows, business, chart, circle, company, concept, continuity, continuous, cycle, dependency, diagram, direction, dynamic, endless, feeds, graph, iteration, iterative, method, path, phase, presentation, process, production, progress, progression, report, rotation, sequence, succession. The prominent colors used in the PowerPoint template are Orange, Gray, White. You can be sure our 9 steps diverging concepts leading to one issue Cycle Chart PowerPoint templates are Clever. Presenters tell us our cycle PowerPoint templates and PPT Slides are Versatile. We assure you our 9 steps diverging concepts leading to one issue Cycle Chart PowerPoint templates are Striking. Customers tell us our continuous PowerPoint templates and PPT Slides are Energetic. Presenters tell us our 9 steps diverging concepts leading to one issue Cycle Chart PowerPoint templates are Versatile. You can be sure our chart PowerPoint templates and PPT Slides will make the presenter successul in his career/life.
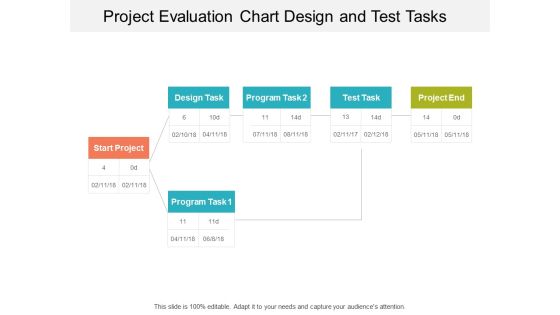
Project Evaluation Chart Design And Test Tasks Ppt Powerpoint Presentation Show Graphics Design
This is a project evaluation chart design and test tasks ppt powerpoint presentation show graphics design. This is a three stage process. The stages in this process are pert chart, program evaluation and review technique, pert graph.
Waterfall Chart Showing Effective Pricing And Profitability Insight Ppt PowerPoint Presentation Icon Graphics
This is a waterfall chart showing effective pricing and profitability insight ppt powerpoint presentation icon graphics. This is a seven stage process. The stages in this process are sales waterfall, waterfall chart, business.

Volume Open High Low Close Chart Ppt PowerPoint Presentation Pictures Slideshow
This is a volume open high low close chart ppt powerpoint presentation pictures slideshow. This is a two stage process. The stages in this process are volume, open, high, low, close, chart.

Product Features And Competitors Chart Ppt Powerpoint Presentation Slides Graphics Design
This is a product features and competitors chart ppt powerpoint presentation slides graphics design. This is a three stage process. The stages in this process are comparison chart, comparison table, comparison matrix.
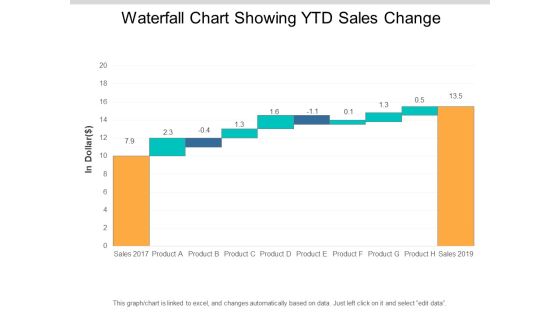
Waterfall Chart Showing Ytd Sales Change Ppt PowerPoint Presentation Professional Format
This is a waterfall chart showing ytd sales change ppt powerpoint presentation professional format. This is a ten stage process. The stages in this process are sales waterfall, waterfall chart, business.

Waterfall Chart With Merchandising Sales Cost And Net Revenue Ppt PowerPoint Presentation Summary Show
This is a waterfall chart with merchandising sales cost and net revenue ppt powerpoint presentation summary show. This is a three stage process. The stages in this process are sales waterfall, waterfall chart, business.

Waterfall Chart With Sales Overheads Interest And Depreciation Ppt PowerPoint Presentation File Display
This is a waterfall chart with sales overheads interest and depreciation ppt powerpoint presentation file display. This is a eight stage process. The stages in this process are sales waterfall, waterfall chart, business.

Chart Highlighting User Time Spending On Social Media By Age Categories Elements PDF
Showcasing this set of slides titled Chart Highlighting User Time Spending On Social Media By Age Categories Elements PDF. The topics addressed in these templates are Chart Highlighting User, Time Spending Social Media, Age Categories. All the content presented in this PPT design is completely editable. Download it and make adjustments in color, background, font etc. as per your unique business setting.

Real Estate Property Management System Real Estate Home Sales Chart Ppt Ideas Graphics Example PDF
Deliver and pitch your topic in the best possible manner with this real estate property management system real estate home sales chart ppt ideas graphics example pdf. Use them to share invaluable insights on real estate home sales chart and impress your audience. This template can be altered and modified as per your expectations. So, grab it now.
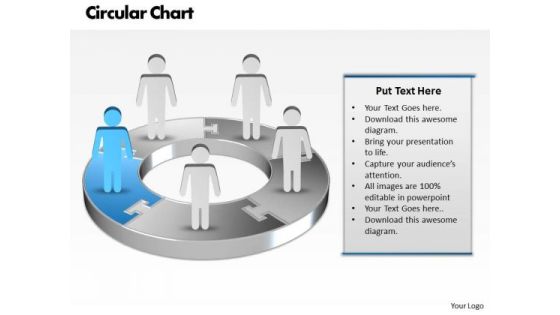
Ppt Blue Men Standing On Business Pie Organization Chart PowerPoint Template Templates
PPT blue men standing on business pie organization chart powerpoint template Templates-Use this Business based PowerPoint Diagram to represent the Business issues Graphically. It indicates arrange, block out, blueprint, cast, delineate, design, devise, draft, graph , lay out, outline, plot, project, shape, sketch etc.-PPT blue men standing on business pie organization chart powerpoint template Templates-arrow, art, basic, blank, business, capital, chart, chevron, clip, clipart, colorful, conglomerates, consumer, copy, cyclical, energy, financial, flow, goods, graph, graphic, healthcare, illustration, infographic, information, investment, isolated, market, materials, non, round, sectors, services, slide, space, stock, technology, text,
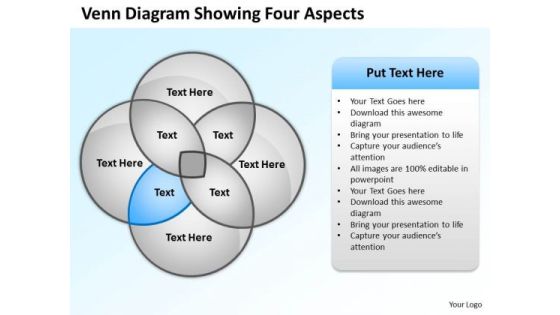
Business Organizational Chart Template Venn Diagram Showing Four Aspects PowerPoint Slides
We present our business organizational chart template venn diagram showing four aspects PowerPoint Slides.Use our Ring Charts PowerPoint Templates because Your audience will believe you are the cats whiskers. Download our Circle Charts PowerPoint Templates because You are well armed with penetrative ideas. Our PowerPoint Templates and Slides will provide the gunpowder you need. Download and present our Process and Flows PowerPoint Templates because They will Put your wonderful verbal artistry on display. Our PowerPoint Templates and Slides will provide you the necessary glam and glitter. Download and present our Flow Charts PowerPoint Templates because Our PowerPoint Templates and Slides help you meet the demand of the Market. Just browse and pick the slides that appeal to your intuitive senses. Download our Business PowerPoint Templates because Our PowerPoint Templates and Slides will let you Illuminate the road ahead to Pinpoint the important landmarks along the way.Use these PowerPoint slides for presentations relating to Business, button, catalog, chart, circle, company, cross, data, design, diagram, direction, document, financial, four, glossy, goals, graph, junction, management, market, marketing, model, multicolored, multiple, navigation, network, options, plan, presentation, process, purple, results, shiny, sphere, statistics. The prominent colors used in the PowerPoint template are Blue light, White, Gray. People tell us our business organizational chart template venn diagram showing four aspects PowerPoint Slides are effectively colour coded to prioritise your plans They automatically highlight the sequence of events you desire. PowerPoint presentation experts tell us our data PowerPoint templates and PPT Slides will impress their bosses and teams. Presenters tell us our business organizational chart template venn diagram showing four aspects PowerPoint Slides will generate and maintain the level of interest you desire. They will create the impression you want to imprint on your audience. Use our data PowerPoint templates and PPT Slides are effectively colour coded to prioritise your plans They automatically highlight the sequence of events you desire. Customers tell us our business organizational chart template venn diagram showing four aspects PowerPoint Slides are specially created by a professional team with vast experience. They diligently strive to come up with the right vehicle for your brilliant Ideas. People tell us our chart PowerPoint templates and PPT Slides are incredible easy to use.

Delivery Excellence Chart With Source Of Variance Ppt PowerPoint Presentation Outline Backgrounds PDF
Showcasing this set of slides titled delivery excellence chart with source of variance ppt powerpoint presentation outline backgrounds pdf. The topics addressed in these templates are delivery excellence chart with source of variance. All the content presented in this PPT design is completely editable. Download it and make adjustments in color, background, font etc. as per your unique business setting.

Converging And Diverging Factors Process Flow Ppt Target Chart PowerPoint Templates
We present our converging and diverging factors process flow ppt Target Chart PowerPoint templates.Use our Business PowerPoint Templates because it helps you to explain your plans in all earnest to your colleagues and raise the bar for all. Use our Process and Flows PowerPoint Templates because they will Amplify your thoughts via our appropriate templates. Download and present our Marketing PowerPoint Templates because networking is an imperative in todays world. You need to access the views of others. Similarly you need to give access to them of your abilities. Download and present our Circle Charts PowerPoint Templates because this PPt slide highlights any anticipated problems, shortfalls or weak areas. Download and present our Flow Charts PowerPoint Templates because you can illustrate your ideas and imprint them in the minds of your team with this template.Use these PowerPoint slides for presentations relating to Achievement, Aim, Arrow, Business, Chart, Communication, Diagram, Direction, Graphic, Growth, Guide, Increase, Marketing, Presentation, Shape, Sign, Success, Target, Team, Teamwork. The prominent colors used in the PowerPoint template are Red, Gray, White. People tell us our converging and diverging factors process flow ppt Target Chart PowerPoint templates are No-nonsense. Use our Arrow PowerPoint templates and PPT Slides provide you with a vast range of viable options. Select the appropriate ones and just fill in your text. Professionals tell us our converging and diverging factors process flow ppt Target Chart PowerPoint templates are Fabulous. Presenters tell us our Graphic PowerPoint templates and PPT Slides are Bold. Professionals tell us our converging and diverging factors process flow ppt Target Chart PowerPoint templates are Exuberant. PowerPoint presentation experts tell us our Arrow PowerPoint templates and PPT Slides will make the presenter look like a pro even if they are not computer savvy.

Designing Compensation Systems For Professionals Bubble Chart Ppt Infographics Files PDF
Presenting this set of slides with name designing compensation systems for professionals bubble chart ppt infographics files pdf. The topics discussed in these slide is bubble chart. This is a completely editable PowerPoint presentation and is available for immediate download. Download now and impress your audience.

Designing Compensation Systems For Professionals Combo Chart Ppt Portfolio Backgrounds PDF
Presenting this set of slides with name designing compensation systems for professionals combo chart ppt portfolio backgrounds pdf. The topics discussed in these slide is combo chart. This is a completely editable PowerPoint presentation and is available for immediate download. Download now and impress your audience.

Designing Compensation Systems For Professionals Volume Open High Low Close Chart Introduction PDF
Presenting this set of slides with name designing compensation systems for professionals volume open high low close chart introduction pdf. The topics discussed in these slide is volume open high low close chart. This is a completely editable PowerPoint presentation and is available for immediate download. Download now and impress your audience.
 Home
Home