Improvement Chart
Food Process Tracking With Control Chart Increased Superiority For Food Products Sample PDF
The quality team will use control chart as food quality management tool. It will help in determining the food processes are stable and capable under provided conditions. Deliver an awe inspiring pitch with this creative food process tracking with control chart increased superiority for food products sample pdf bundle. Topics like action plan, resources, chart analysis can be discussed with this completely editable template. It is available for immediate download depending on the needs and requirements of the user.

Consumer Service Process Flow Chart For Resolving Software Problems Background PDF
Presenting Consumer Service Process Flow Chart For Resolving Software Problems Background PDF to dispense important information. This template comprises Five stages. It also presents valuable insights into the topics including Process Flow Chart, Resolving Software Problems. This is a completely customizable PowerPoint theme that can be put to use immediately. So, download it and address the topic impactfully.
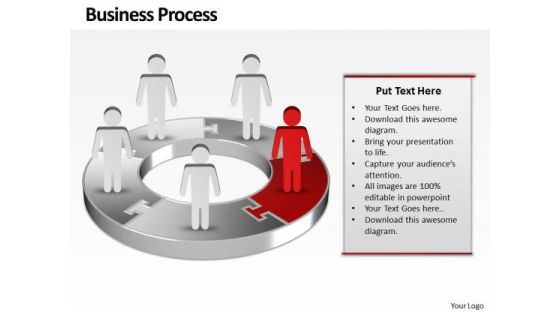
Ppt Red Men Standing On Business PowerPoint Theme Pie Chart Templates
PPT red men standing on business powerpoint theme pie chart Templates-Use this graphical approach to represent global business issues such as financial data, stock market Exchange, increase in sales, corporate presentations and more.-PPT red men standing on business powerpoint theme pie chart Templates-3d, arrow, background, blue, chart, circle, circular, clipart, colorful, connection, continuity, cycle, cyclic, diagram, direction, flow, graph, icon, illustration, isolated, loop, motion, process, progress, recycle, ring, round, step, sticker, symbol, teamwork, template, turn, vector

CRM Grid Chart With Attitude And Satisfaction Level Ppt PowerPoint Presentation Gallery Slide Download PDF
This slide represents the actions based on customer attitude and satisfaction levels such as shifting resources, fixing on priority etc. Presenting crm grid chart with attitude and satisfaction level ppt powerpoint presentation gallery slide download pdf to dispense important information. This template comprises four stages. It also presents valuable insights into the topics including fix on priority, keep improving, shift resources. This is a completely customizable PowerPoint theme that can be put to use immediately. So, download it and address the topic impactfully.
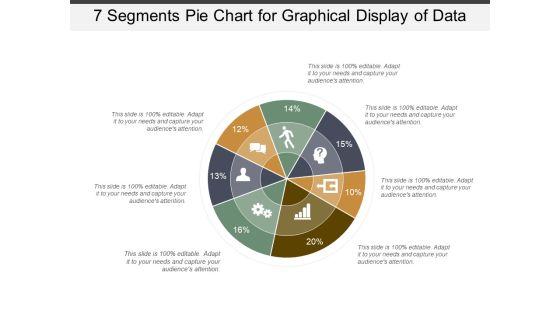
7 Segments Pie Chart For Graphical Display Of Data Ppt PowerPoint Presentation Model Elements
This is a 7 segments pie chart for graphical display of data ppt powerpoint presentation model elements. This is a seven stage process. The stages in this process are 6 piece pie chart, 6 segment pie chart, 6 parts pie chart.
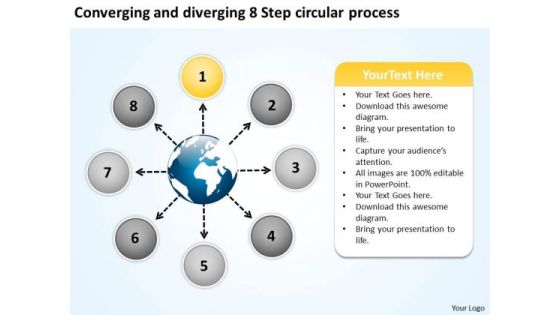
Diverging 8 Step Circular Process Ppt 2 Relative Flow Arrow Chart PowerPoint Templates
We present our diverging 8 step circular process ppt 2 Relative Flow Arrow Chart PowerPoint templates.Use our Ring Charts PowerPoint Templates because you can Unravel the desired and essential elements of your overall strategy. Download and present our Circle Charts PowerPoint Templates because this diagram put it all together to form the complete picture and reach the goal. Use our Process and flows PowerPoint Templates because this template helps you to bring your audiences to the table. Use our Marketing PowerPoint Templates because The marketplace is the merger of your dreams and your ability. Present our Flow charts PowerPoint Templates because they help to lay the base of your trend of thought.Use these PowerPoint slides for presentations relating to Arrows, business, chart, circle, company,concept, continuity, continuous, cycle,dependency, diagram, direction,dynamic,endless, graph,iteration, iterative, method, path, phase,presentation, process, production,progress, progression, report, rotation,sequence. The prominent colors used in the PowerPoint template are Yellow, White, Black. People tell us our diverging 8 step circular process ppt 2 Relative Flow Arrow Chart PowerPoint templates are designed by professionals Professionals tell us our cycle PowerPoint templates and PPT Slides are Adorable. We assure you our diverging 8 step circular process ppt 2 Relative Flow Arrow Chart PowerPoint templates are designed by professionals PowerPoint presentation experts tell us our cycle PowerPoint templates and PPT Slides are Elegant. We assure you our diverging 8 step circular process ppt 2 Relative Flow Arrow Chart PowerPoint templates are designed to make your presentations professional. People tell us our chart PowerPoint templates and PPT Slides are Stylish.
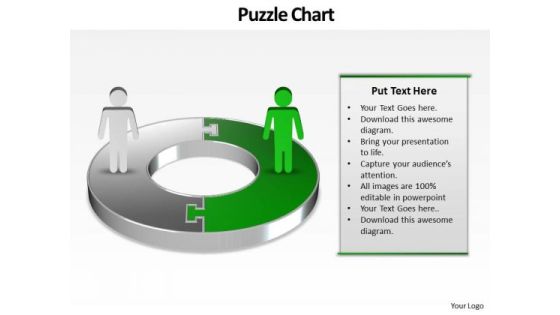
Ppt Green PowerPoint Slide Man On Circular Gantt Chart Template Templates
PPT green powerpoint slide man on circular gantt chart template Templates-This PowerPoint Diagram shows you the Circular way to represent Business components or losses in Business related Activities. This PowerPoint Diagram can be use in Investor presentations for Initial Public Offerings, Annual general meetings and financial seminars.-PPT green powerpoint slide man on circular gantt chart template Templates-abstract, accounting, background, business, businessman, chart, company, connection, corporate, diagram, earnings, finance, forecast, graph, growth, investment, management, network, people, profit, progress, puzzle, shapes, team, technology, vector, wealth

Ppt Red World Business Layouts People Stand On Circular Chart PowerPoint Templates
PPT red world business layouts people stand on circular chart PowerPoint Templates-This 3D PowerPoint Diagram shows the Three interconnected stages represented by first Red Quadrant. It signifies the concept of aspect, attribute, bearing, complexion, component, differentia, disposition, distinction, earmark, essence, essential etc.-PPT red world business layouts people stand on circular chart PowerPoint Templates-abstract, accounting, background, business, businessman, chart, company, connection, corporate, diagram, earnings, finance, forecast, graph, growth, investment, management, network, people, profit, progress, puzzle, shapes, team, technology, vector, wealth

Ppt Power Point Org Chart Shaped Arrows 6 Segments PowerPoint Templates
PPT power point org chart shaped arrows 6 segments PowerPoint Templates-This Organizational chart makes information accessible throughout the organization with a collective, visible view of critical data from different perspectives and providing the tools to upcoming business scenarios and plan for change.-PPT power point org chart shaped arrows 6 segments PowerPoint Templates-Abstract, Around, Arrow, Arrow Circles, Chart, Circle, Circular, Circular Arrows, Circular Flow, Circulation, Cycle, Cyclic, Direction, Element, Flow, Icon, Illustration, Isolated, Motion, Movement, Refresh, Ring, Rotation, Round, Section, Set, Shape, Sign, Symbol

Data Collection And Analysis Flow Chart Ppt PowerPoint Presentation Model Rules
This is a data collection and analysis flow chart ppt powerpoint presentation model rules. This is a six stage process. The stages in this process are business, marketing, management, planning, chart.
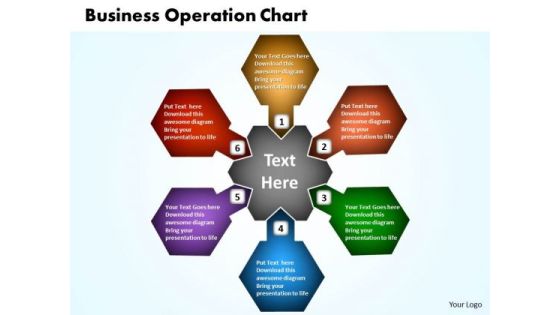
Business Process PowerPoint Templates Business The Circular Operation Process Chart Ppt Slides
Business Process PowerPoint Templates Business The Circular Operation Process Chart PPT Slides-Use this Circular Operation Chart Diagram in Business Presentations. This PowerPoint diagram can be used for information flow, business process automation, business process re-engineering and other business related issues.-Business Process PowerPoint Templates Business The Circular Operation Process Chart PPT Slides
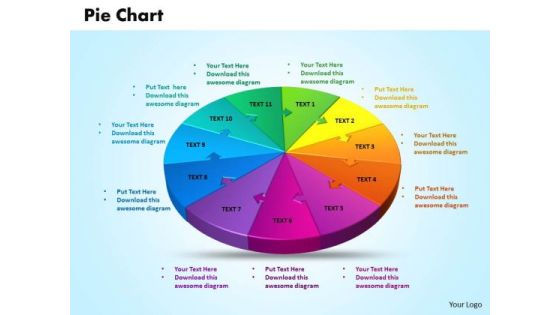
Business Graphic PowerPoint Templates Business 3d Jigsaw Circular Pie Chart Ppt Slides
Business Graphic PowerPoint Templates Business 3d jigsaw circular pie chart PPT Slides-This Circular pie chart is a compelling presentation tool. By piecing together the parts or your project, organization or product in PowerPoint, you help make a critical point to your audience-Business Company PowerPoint Templates Business interconnected jigsaw puzzle pieces PPT Slides-This ppt can be used for concepts relating to-Chart, Communication, Concept, Decision, Diagram, Management, Organization, Company Business, Chart, Illustration Etc

Ppt Yellow Men Standing On Business PowerPoint Presentation Pie Chart Templates
PPT yellow men standing on business powerpoint presentation pie chart Templates-Use this Circular Arrow diagram to show activities that are related to the business plan metrics and monitor the results to determine if the business plan is proceeding as planned.-PPT yellow men standing on business powerpoint presentation pie chart Templates-3d, arrow, background, blue, chart, circle, circular, clipart, colorful, connection, continuity, cycle, cyclic, diagram, direction, flow, graph, icon, illustration, isolated, loop, motion, process, progress, recycle, ring, round, step, sticker, symbol, teamwork, template, turn, vector

Ppt Red Quadrant On Circular Free Pie PowerPoint Template Chart Ks2 Templates
PPT red quadrant on circular free pie powerpoint template chart ks2 Templates-Use this layout to define the outcome and the multiple possibilities in a way that is used in calculation of probabilities, genetics and strategic reasoning. This chart visualize the of process steps, reoccurrences and components or of your company structure or product features.-PPT red quadrant on circular free pie powerpoint template chart ks2 Templates-3 arrow, art, background, business, chart, circle, clip, colorful, design, diagram, flow, fourth, graph, graphic, half, icon, illustration, management, point, process, progress, project, round, segment, set, slide, stage, successful business, third, transparent

8 Segments Pie Chart For Graphical Display Of Data Ppt PowerPoint Presentation Infographic Template Templates
This is a 8 segments pie chart for graphical display of data ppt powerpoint presentation infographic template templates. This is a eight stage process. The stages in this process are 6 piece pie chart, 6 segment pie chart, 6 parts pie chart.

6 Segments Pie Chart For Graphical Display Of Data Ppt PowerPoint Presentation Portfolio Rules
This is a 6 segments pie chart for graphical display of data ppt powerpoint presentation portfolio rules. This is a six stage process. The stages in this process are 6 piece pie chart, 6 segment pie chart, 6 parts pie chart.
Food Process Tracking With Control Chart Application Of Quality Management For Food Processing Companies Background PDF
The quality team will use control chart as food quality management tool. It will help in determining the food processes are stable and capable under provided conditions. Deliver an awe inspiring pitch with this creative food process tracking with control chart application of quality management for food processing companies background pdf bundle. Topics like action plan, resources, chart analysis can be discussed with this completely editable template. It is available for immediate download depending on the needs and requirements of the user.
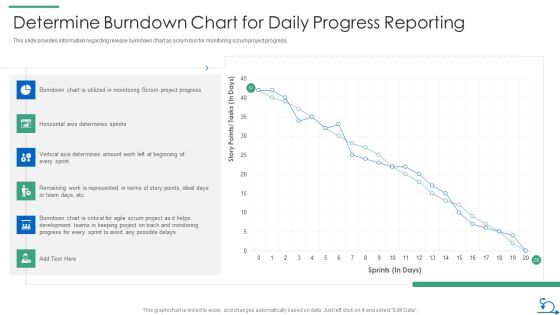
How Bidding Teams Determine Burndown Chart For Daily Progress Reporting Pictures PDF
This slide provides information regarding release burndown chart as scrum tool for monitoring scrum project progress. Deliver an awe inspiring pitch with this creative how bidding teams determine burndown chart for daily progress reporting pictures pdf bundle. Topics like burndown chart, team, project progress can be discussed with this completely editable template. It is available for immediate download depending on the needs and requirements of the user.

Chart For Business Growth Strategy Ppt Developing Plan Template PowerPoint Templates
Doll up your thoughts with our chart for business growth strategy ppt developing plan template PowerPoint templates. They will make a pretty picture.

Nine Stages Diverging Factors Flow Chart Business Circular Spoke PowerPoint Templates
We present our nine stages diverging factors flow chart business Circular Spoke PowerPoint templates.Present our Process and Flows PowerPoint Templates because it is all there in bits and pieces. Download our Flow charts PowerPoint Templates because spreading the light of knowledge around you will clear the doubts and enlighten the questioning minds with your brilliance and ability. Use our Signs PowerPoint Templates because one pushes the other till it all comes back full circle. Download our Arrows PowerPoint Templates because our template will illustrate what you want to say. Download our Ring Charts PowerPoint Templates because our presentation designs are for those on the go.Use these PowerPoint slides for presentations relating to Arrow, background, board, business,chart, circle, circular, circulation, color,colorful, concept, curving, cycle,description, design, diagram, diagram,chart, diagramcircle, diagramelements,diagramvector, direction, element, flow,flowchart, fresh, graphic, illustration,loop, message, motion, phase, present,presentation, process, process,flow,ring, rotation, round, rounddiagram,section, segment, set, shape, sign, step,success, symbol. The prominent colors used in the PowerPoint template are Blue, Black, White. People tell us our nine stages diverging factors flow chart business Circular Spoke PowerPoint templates are visually appealing. Customers tell us our chart PowerPoint templates and PPT Slides are Perfect. Professionals tell us our nine stages diverging factors flow chart business Circular Spoke PowerPoint templates are Liberated. Presenters tell us our circular PowerPoint templates and PPT Slides are designed to make your presentations professional. Use our nine stages diverging factors flow chart business Circular Spoke PowerPoint templates are Lush. Presenters tell us our chart PowerPoint templates and PPT Slides are Magnificent.

Scrum Architecture Follow Up Progress By Using Burn Down Chart Guidelines PDF
This slide provides the glimpse about the burn down chart for progress follow up which covers the estimated and actual burndown.Deliver an awe inspiring pitch with this creative scrum architecture follow up progress by using burn down chart guidelines pdf bundle. Topics like follow up progress by using burn down chart can be discussed with this completely editable template. It is available for immediate download depending on the needs and requirements of the user.

Collection Of Quality Assurance PPT Control Chart To Determine Total Specimen Labelling Graphics PDF
Following slide portrays control chart that can be used by an organization to determine total specimen labelling errors. Deliver an awe inspiring pitch with this creative collection of quality assurance ppt control chart to determine total specimen labelling graphics pdf bundle. Topics like control chart to determine total specimen labelling errors can be discussed with this completely editable template. It is available for immediate download depending on the needs and requirements of the user.
Food Process Tracking With Control Chart Uplift Food Production Company Quality Standards Introduction PDF
The quality team will use control chart as food quality management tool. It will help in determining the food processes are stable and capable under provided conditions. Deliver an awe inspiring pitch with this creative food process tracking with control chart uplift food production company quality standards introduction pdf bundle. Topics like action plan, resources, chart analysis can be discussed with this completely editable template. It is available for immediate download depending on the needs and requirements of the user.

Ppt Power Point Org Chart Shaped Circular Arrows PowerPoint 2007 6 Sections Templates
PPT power point org chart shaped circular arrows powerpoint 2007 6 sections Templates-This circular shaped Org Chart displays the system of an organization in terms of relationships among personnel or departments and is the most intuitive way to understand your organization.-PPT power point org chart shaped circular arrows powerpoint 2007 6 sections Templates-Abstract, Around, Arrow, Arrow Circles, Chart, Circle, Circular, Circular Arrows, Circular Flow, Circulation, Cycle, Cyclic, Direction, Element, Flow, Icon, Illustration, Isolated, Motion, Movement, Refresh, Ring, Rotation, Round, Section, Set, Shape, Sign, Symbol
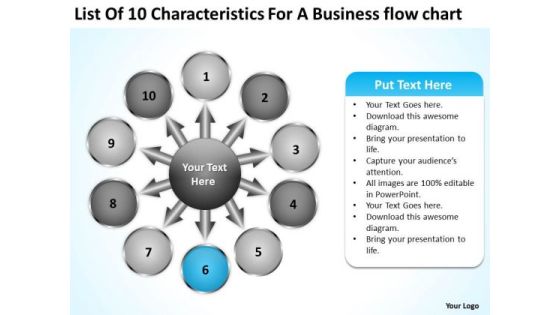
List Of 10 Characteristics For Business Flow Chart Business Gear PowerPoint Slides
We present our list of 10 characteristics for business flow chart business Gear PowerPoint Slides.Download and present our Ring Charts PowerPoint Templates because it have all to represent to your viewers. Present our Flow charts PowerPoint Templates because it Draws the universal impact to highlight the similarities with your organizational structure and plans. Present our Arrows PowerPoint Templates because this helps you to put all your brilliant views to your audience. Use our Circle charts PowerPoint Templates because you can Enlighten them with your brilliant understanding of mental health. Use our Process and Flows PowerPoint Templates because health of the determines the quality of our lives.Use these PowerPoint slides for presentations relating to Access, arrow,business, circle, color,colorful, concept, connection, corporate,creative, cycle, dark, design, different,element, empty, vector, five, four,frame, graphic, green, group, idea,illustration, message, numbers, order,part, presentation, process, purple, red,shape, solution, special, speech,strategy, symbol. The prominent colors used in the PowerPoint template are Blue, White, Black. People tell us our list of 10 characteristics for business flow chart business Gear PowerPoint Slides are Luxurious. Customers tell us our concept PowerPoint templates and PPT Slides are Functional. Professionals tell us our list of 10 characteristics for business flow chart business Gear PowerPoint Slides are Reminiscent. Presenters tell us our corporate PowerPoint templates and PPT Slides look good visually. Use our list of 10 characteristics for business flow chart business Gear PowerPoint Slides are Fantastic. Presenters tell us our business PowerPoint templates and PPT Slides are Gorgeous.
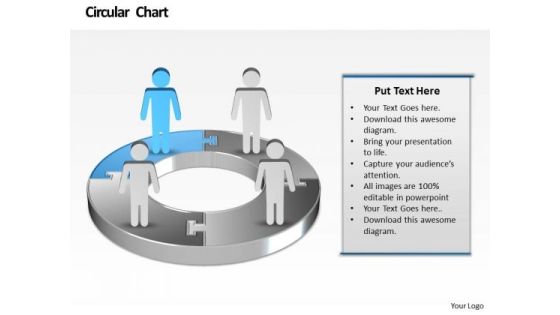
Ppt Animated Men Standing On Colorful Pie Chart Presentation PowerPoint Tips Templates
PPT animated men standing on colorful pie chart presentation powerpoint tips Templates-Emphatically define your message with our above template which contains a graphic 3d pie chart with animated men.This image represents the concept of Business Meetings, Conferences etc.This Diagram is designed to attract the attention of your audience.-PPT animated men standing on colorful pie chart presentation powerpoint tips Templates-Abstract, Access, Arrow, Background, Business, Chart, Circle, Concept, Conceptual, Connection, Corporate, Creative, Cycle, Design, Different, Element, Empty, Form, Frame, Graphic, Group, Idea, Illustration, Part, Piece, People, Place, Process, Red, Shapes, Solution, Special, Speech, Strategy, Symbol

Commercial Property Administration And Advancement Real Estate Home Sales Chart Mockup PDF
Deliver and pitch your topic in the best possible manner with this commercial property administration and advancement real estate home sales chart mockup pdf. Use them to share invaluable insights on real estate home sales chart and impress your audience. This template can be altered and modified as per your expectations. So, grab it now.

Flow Chart For Client Assistance Plan Ppt PowerPoint Presentation File Outline PDF
This slide shows the flow chart of customer service plan . this flow chart involves various stages such as issue raised by customer, problem statement, customer confirmation, etc. Persuade your audience using this Flow Chart For Client Assistance Plan Ppt PowerPoint Presentation File Outline PDF. This PPT design covers five stages, thus making it a great tool to use. It also caters to a variety of topics including Development, Technical Support, Customer, Problem Statement. Download this PPT design now to present a convincing pitch that not only emphasizes the topic but also showcases your presentation skills.

Circular Chart Showing Sales Growth Ppt PowerPoint Presentation File Images PDF
Presenting this set of slides with name circular chart showing sales growth ppt powerpoint presentation file images pdf. The topics discussed in these slides are circular chart showing sales growth, 2019 to 2020. This is a completely editable PowerPoint presentation and is available for immediate download. Download now and impress your audience.

Quality Assurance Templates Set 2 Pareto Chart Highlighting Customer Complaints Elements PDF
Following slide illustrates pareto chart that can be used by a firm to highlights its customer complaints related to documentation, product quality, packaging, delivery and other. Deliver an awe inspiring pitch with this creative quality assurance templates set 2 pareto chart highlighting customer complaints elements pdf bundle. Topics like pareto chart highlighting customer complaints can be discussed with this completely editable template. It is available for immediate download depending on the needs and requirements of the user.
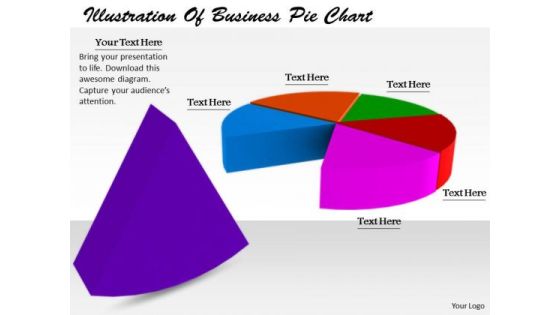
Stock Photo Business Strategy Execution Illustration Of Pie Chart Stock Photos
Plan For All Contingencies With Our Stock Photo Business Strategy Execution Illustration Of Pie Chart Stock Photos Powerpoint Templates. Douse The Fire Before It Catches. Generate Camaraderie With Our Pie Charts Powerpoint Templates. Good Wishes Will Come Raining Down.

Area Chart Ppt PowerPoint Presentation Inspiration Icons Ppt PowerPoint Presentation Professional File Formats
This is a area chart ppt powerpoint presentation inspiration icons ppt powerpoint presentation professional file formats. This is a two stage process. The stages in this process are area chart, product, percentage, business, growth.

6 Distinct Views Of An Issue Circular Manner Flow Chart PowerPoint Slides
We present our 6 distinct views of an issue circular manner Flow Chart PowerPoint Slides.Use our Arrows PowerPoint Templates because it shows the pyramid which is a symbol of the desire to reach the top in a steady manner. Download our Circle Charts PowerPoint Templates because this template contains the material to highlight the key issues of your presentation. Present our Shapes PowerPoint Templates because you can Raise your Company stocks at the Opening Bell. Use our Ring Charts PowerPoint Templates because this diagram provides range of options to garner your interest. Download and present our Flow Charts PowerPoint Templates because this Layout helps you to expand your plans to overcome obstacles and reassure the team that they shall continue to roll along merrily.Use these PowerPoint slides for presentations relating to abstract, access, arrow, background, banner, blue, bright, business, chart, circle, color, colorful, concept, conceptual, connection, corporate, creative, cycle, design, different, element, empty, form, frame, graphic, green, group, idea, illustration, match, message, order, part, piece, place, process, red, shape, solution, special, speech, strategy, symbol, template, text, usable, vector, web, website. The prominent colors used in the PowerPoint template are Red, Purple, Yellow. Presenters tell us our 6 distinct views of an issue circular manner Flow Chart PowerPoint Slides are Upbeat. You can be sure our blue PowerPoint templates and PPT Slides are Nostalgic. Professionals tell us our 6 distinct views of an issue circular manner Flow Chart PowerPoint Slides are Tasteful. People tell us our banner PowerPoint templates and PPT Slides are Multicolored. People tell us our 6 distinct views of an issue circular manner Flow Chart PowerPoint Slides are Liberated. Professionals tell us our chart PowerPoint templates and PPT Slides are Playful.
Food Process Tracking With Control Chart Food Security Excellence Ppt Inspiration Graphics Example PDF
The quality team will use control chart as food quality management tool. It will help in determining the food processes are stable and capable under provided conditions. Deliver an awe inspiring pitch with this creative food process tracking with control chart food security excellence ppt inspiration graphics example pdf bundle. Topics like action plan, resources, chart analysis can be discussed with this completely editable template. It is available for immediate download depending on the needs and requirements of the user.
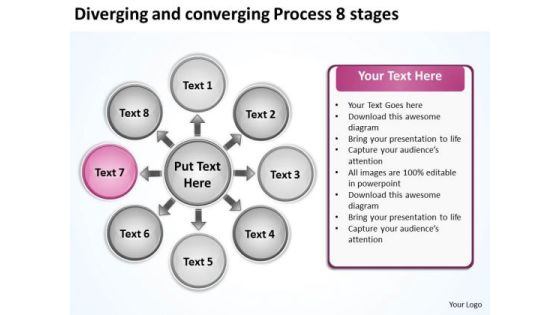
Diverging And Converging Process 8 Stages Ppt Circular Flow Motion Chart PowerPoint Slides
We present our diverging and converging process 8 stages ppt Circular Flow Motion Chart PowerPoint Slides.Download and present our Ring Charts PowerPoint Templates because the lessons have been analyzed, studied and conclusions drawn. Download our Circle Charts PowerPoint Templates because we all know that alphabetical order is a time honoured concept. Download our Process and flows PowerPoint Templates because you know your business and have a vision for it. Use our Flow charts PowerPoint Templates because you have imbibed from this fountain of ideas and developed some worthwhile views. Download our Marketing PowerPoint Templates because the plans are in your head, stage by stage, year by year.Use these PowerPoint slides for presentations relating to Arrows, blank, business,central, centralized, chart, circle, circular,circulation, concept, conceptual,converging, design, diagram, empty,executive, icon, idea, illustration,management, map, mapping, mba,model, numbers, organization, outwards,pointing, procedure, process, radial,radiating, relationship. The prominent colors used in the PowerPoint template are Green, Gray, Black. People tell us our diverging and converging process 8 stages ppt Circular Flow Motion Chart PowerPoint Slides are Attractive. Professionals tell us our circular PowerPoint templates and PPT Slides are Wonderful. We assure you our diverging and converging process 8 stages ppt Circular Flow Motion Chart PowerPoint Slides effectively help you save your valuable time. PowerPoint presentation experts tell us our circular PowerPoint templates and PPT Slides are Bright. We assure you our diverging and converging process 8 stages ppt Circular Flow Motion Chart PowerPoint Slides are One-of-a-kind. People tell us our central PowerPoint templates and PPT Slides are Versatile.

Profit Chart On Blackboard Success PowerPoint Templates And PowerPoint Themes 0412
Microsoft Powerpoint Templates and Background with business chart on blackboard

Chart Showing GDP Annual Growth Rate Ppt PowerPoint Presentation File Introduction PDF
Presenting this set of slides with name chart showing gdp annual growth rate ppt powerpoint presentation file introduction pdf. The topics discussed in these slides are chart showing gdp annual growth rate, 2016 to 2020. This is a completely editable PowerPoint presentation and is available for immediate download. Download now and impress your audience.
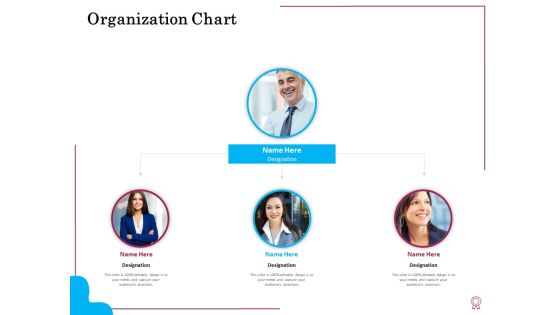
Factors Feasible Competitive Advancement Organization Chart Ppt Infographic Template Display PDF
Presenting factors feasible competitive advancement organization chart ppt infographic template display pdf to provide visual cues and insights. Share and navigate important information on three stages that need your due attention. This template can be used to pitch topics like organization chart. In addition, this PPT design contains high-resolution images, graphics, etc, that are easily editable and available for immediate download.

Chart With Percents Business Marketing PowerPoint Themes And PowerPoint Slides 0611
Microsoft PowerPoint Theme and Slide with chart with percents

11 Stages Representing Diverging Circular Flow Chart Ppt Cycle Process PowerPoint Templates
We present our 11 stages representing diverging circular flow chart ppt Cycle Process PowerPoint templates.Present our Circle Charts PowerPoint Templates because they will Amplify your basic corporate concept and forefront the benefits of overlapping processes to arrive at common goals. Download and present our Arrows PowerPoint Templates because this slide is an excellent backdrop for you to enlighten your audience on the process you have gone through and the vision you have for the future. Use our Ring Charts PowerPoint Templates because your listeners do not have to put on their thinking caps. Download and present our Business PowerPoint Templates because it helps you to project your enthusiasm and single mindedness to your colleagues. Use our Flow Charts PowerPoint Templates because you have examined every element down to the finest detail.Use these PowerPoint slides for presentations relating to arrows, business, chart, circle, company, concept, continuity, continuous, cycle, dependency, diagram, direction, dynamic, endless, feeds, graph, iteration, iterative, method, path, phase, presentation, process, production, progress, progression, report, rotation, sequence, succession, vector. The prominent colors used in the PowerPoint template are Green, Blue, Gray. Presenters tell us our 11 stages representing diverging circular flow chart ppt Cycle Process PowerPoint templates are Pleasant. You can be sure our cycle PowerPoint templates and PPT Slides will get their audience's attention. Professionals tell us our 11 stages representing diverging circular flow chart ppt Cycle Process PowerPoint templates are Flirty. People tell us our circle PowerPoint templates and PPT Slides will save the presenter time. People tell us our 11 stages representing diverging circular flow chart ppt Cycle Process PowerPoint templates are aesthetically designed to attract attention. We guarantee that they will grab all the eyeballs you need. Professionals tell us our circle PowerPoint templates and PPT Slides are Playful.

Chart With Percents Business Marketing PowerPoint Templates And PowerPoint Backgrounds 0611
Microsoft PowerPoint Template and Background with chart with percents

Success Pie Chart Concept Finance PowerPoint Templates And PowerPoint Themes 0612
Success Pie Chart Concept Finance PowerPoint Templates And PowerPoint Themes Business PPT-Microsoft Powerpoint Templates and Background with pie chart graph

Success Pie Chart Concept Global PowerPoint Templates And PowerPoint Themes 0612
Success Pie Chart Concept Global PowerPoint Templates And PowerPoint Themes PPT Slides-Microsoft Powerpoint Templates and Background with pie chart diagram

Online Finance Pie Chart Success PowerPoint Templates And PowerPoint Themes 0812
Online Finance Pie Chart Success PowerPoint Templates And PowerPoint Themes 0812-Microsoft Powerpoint Templates and Background with online finance pie chart

Financial Waterfall Chart For Data Visualization Ppt PowerPoint Presentation Ideas Elements
This is a financial waterfall chart for data visualization ppt powerpoint presentation ideas elements. This is a five stage process. The stages in this process are sales waterfall, waterfall chart, business.

Goal Pie Chart Concept Business PowerPoint Templates And PowerPoint Themes 0612
Goal Pie Chart Concept Business PowerPoint Templates And PowerPoint Themes PPT Slides-Microsoft Powerpoint Templates and Background with pie chart concept
Quality Management Plan QMP Process Tracking With Control Chart Ppt File Icons PDF
Presenting this set of slides with name quality management plan qmp process tracking with control chart ppt file icons pdf. The topics discussed in these slide is process tracking with control chart. This is a completely editable PowerPoint presentation and is available for immediate download. Download now and impress your audience.
Project Quality Management Plan Process Tracking With Control Chart Ppt Ideas Background Image PDF
Presenting this set of slides with name project quality management plan process tracking with control chart ppt ideas background image pdf. The topics discussed in these slide is process tracking with control chart. This is a completely editable PowerPoint presentation and is available for immediate download. Download now and impress your audience.
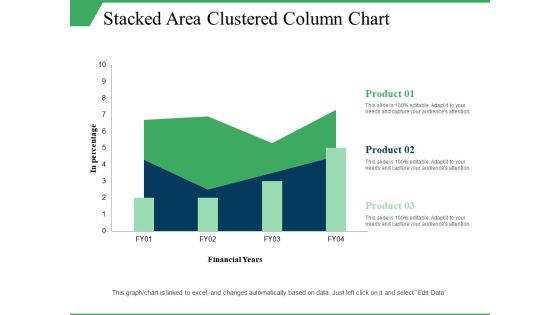
Stacked Area Clustered Column Chart Ppt PowerPoint Presentation Visual Aids Model
This is a stacked area clustered column chart ppt powerpoint presentation visual aids model. This is a three stage process. The stages in this process are in percentage, product, financial years, growth, column chart.

Ppt Layout Of 3d Pie Chart With Standing Busines Men PowerPoint Templates
PPT layout of 3d pie chart with standing busines men PowerPoint Templates-Present your views using this innovative 3d Pie chart and be assured of leaving a lasting impression. Create visually stunning and define your PPT Presentations in a unique and inspiring manner by using our above template.-PPT layout of 3d pie chart with standing busines men PowerPoint Templates-Adult, Art, Background, Business, Career, Chart, Communication, Concept, Conference, Corporate, Creative, Design, Economy, Executive, Finance, Group, Growth, Idea, Illustration, Leadership, Meeting, New, Occupation, Office, People, Person, Progress, Silhouette, Space, Speaking, Standing, Success

Distinct View Of An Issue Circularly Described Flow Chart PowerPoint Templates
We present our distinct view of an issue circularly described Flow Chart PowerPoint templates.Present our Circle Charts PowerPoint Templates because firing the arrows to emblazon the desired path will let you achieve anticipated results. Present our Arrows PowerPoint Templates because you have to coordinate and motivate your team. Download our Ring Charts PowerPoint Templates because this template helps you to illustrate your method, piece by piece, and interlock the whole process in the minds of your audience. Present our Business PowerPoint Templates because you are ready to flap your wings and launch off. All poised are you to touch the sky with glory. Present our Flow Charts PowerPoint Templates because Our PowerPoint Templates and Slides are topically designed to provide an attractive backdrop to any subject.Use these PowerPoint slides for presentations relating to 3d, arrow, blue, chart, circle, circular, circulation, collection, concept, connection, continuity, cursor, cycle, cyclic, diagram, direction, dynamic, flow, flowchart, graph, graphic, green, group, icon, loop, motion, movement, process, progress, recycle, recycling, red, refresh, reload, renew, repetition, return, reuse, rgb, ring, rotation, round, set, sign, spin, symbol, three, turn, update, vector. The prominent colors used in the PowerPoint template are Red, Yellow, Green. Presenters tell us our distinct view of an issue circularly described Flow Chart PowerPoint templates are Attractive. You can be sure our concept PowerPoint templates and PPT Slides are incredible easy to use. Professionals tell us our distinct view of an issue circularly described Flow Chart PowerPoint templates effectively help you save your valuable time. People tell us our circulation PowerPoint templates and PPT Slides will make the presenter look like a pro even if they are not computer savvy. People tell us our distinct view of an issue circularly described Flow Chart PowerPoint templates are Fancy. Professionals tell us our concept PowerPoint templates and PPT Slides are the best it can get when it comes to presenting.

Sales Target Chart Showing Yearly Progress Ppt PowerPoint Presentation Gallery Vector PDF
Showcasing this set of slides titled sales target chart showing yearly progress ppt powerpoint presentation gallery vector pdf. The topics addressed in these templates are sales target chart showing yearly progress. All the content presented in this PPT design is completely editable. Download it and make adjustments in color, background, font etc. as per your unique business setting.
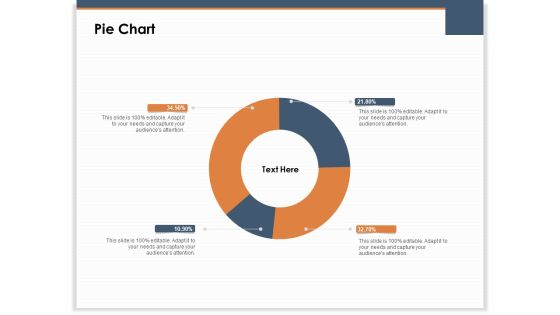
Main Revenues Progress Levers For Each Firm And Sector Pie Chart Ppt Infographic Template Aids PDF
Presenting this set of slides with name main revenues progress levers for each firm and sector pie chart ppt infographic template aids pdf. The topics discussed in these slide is pie chart. This is a completely editable PowerPoint presentation and is available for immediate download. Download now and impress your audience.

Ppt 3d Men Standing On New Business PowerPoint Presentation Pie Chart Templates
PPT 3d men standing on new business powerpoint presentation pie chart Templates-This 3D Business PowerPoint Diagram consists of men standing on circle representing their percentage of work and growth individually. This Diagram will fit for Business Presentations.-PPT 3d men standing on new business powerpoint presentation pie chart Templates-Adult, Art, Background, Business, Career, Chart, Communication, Concept, Conference, Corporate, Creative, Design, Economy, Executive, Finance, Group, Growth, Idea, Illustration, Leadership, Meeting, New, Occupation, Office, People, Person, Progress, Silhouette, Space, Speaking, Standing, Success

Circular Arrow Diverging Innovation Flow Chart Ppt Cycle Spoke Network PowerPoint Slides
We present our circular arrow diverging innovation flow chart ppt Cycle Spoke Network PowerPoint Slides.Download and present our Flow Charts PowerPoint Templates because this is an appropriate layout to convince your team that they have the ability to score a tEN every time. Download our Arrows PowerPoint Templates because watching them will strengthen your companys sinews. Present our Business PowerPoint Templates because it helps you to explain your plans in all earnest to your colleagues and raise the bar for all. Download our Shapes PowerPoint Templates because you should Emphasise the process of your business or corporate growth. Download our Process and Flows PowerPoint Templates because they are the tools that helped most of us evolve.Use these PowerPoint slides for presentations relating to 3d, Arrow, Chart, Circle, Circular, Circulation, Collection, Concept, Connection, Diagram, Direction, Flow, Flowchart, Graph, Graphic, Process, Progress, Ring, Round, Sign, Symbol, Vector, White . The prominent colors used in the PowerPoint template are Gray, Orange, White. People tell us our circular arrow diverging innovation flow chart ppt Cycle Spoke Network PowerPoint Slides are Great. Use our Connection PowerPoint templates and PPT Slides are Pleasant. Professionals tell us our circular arrow diverging innovation flow chart ppt Cycle Spoke Network PowerPoint Slides are Quaint. Presenters tell us our Chart PowerPoint templates and PPT Slides are Clever. Professionals tell us our circular arrow diverging innovation flow chart ppt Cycle Spoke Network PowerPoint Slides are Fashionable. PowerPoint presentation experts tell us our Chart PowerPoint templates and PPT Slides are Handsome.

Business Progress Bubble Chart With Arrow Line Ppt PowerPoint Presentation Gallery Styles PDF
Presenting this set of slides with name business progress bubble chart with arrow line ppt powerpoint presentation gallery styles pdf. The topics discussed in these slide is business progress bubble chart with arrow line. This is a completely editable PowerPoint presentation and is available for immediate download. Download now and impress your audience.
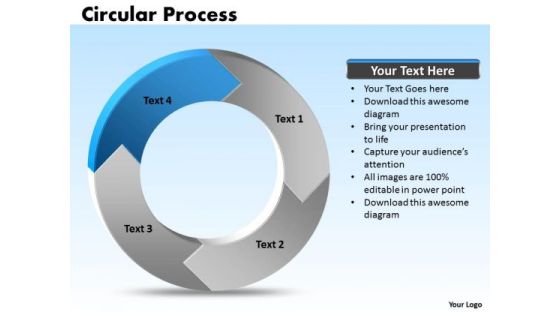
Ppt Edit Data PowerPoint Chart Processing Cycle Diagram 4 State Templates
PPT edit data powerpoint chart processing cycle diagram 4 state Templates-The above template has the theme of circular process Diagram. This image refers the concept of Act Cycle. Adjust the above image in your PPT presentations to visually support your content in your business meetings. This PPT images is so perfectly designed that it make your clients understand the business idea quickly and visually.-PPT edit data powerpoint chart processing cycle diagram 4 state Templates-Arrow, Chart, Circular, Color, Colorful, Connect, Connection, Design, Diagram, Finance, Graphic, Group, Growth, Icon, Illustration, Marketing, Pieces, Process, Recycle, Recycling, Round, Set, Strategy, Symbol, Wheel

Bar Chart Showing Quarterly Economic Growth Ppt PowerPoint Presentation Infographic Template Slideshow
Presenting this set of slides with name bar chart showing quarterly economic growth ppt powerpoint presentation infographic template slideshow. The topics discussed in these slides are revenue trend, bar chart, financial. This is a completely editable PowerPoint presentation and is available for immediate download. Download now and impress your audience.
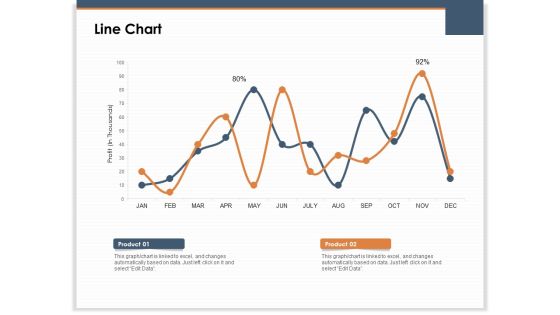
Main Revenues Progress Levers For Each Firm And Sector Line Chart Mockup PDF
Presenting this set of slides with name main revenues progress levers for each firm and sector line chart mockup pdf. The topics discussed in these slide is line chart. This is a completely editable PowerPoint presentation and is available for immediate download. Download now and impress your audience.

Ppt Team Effort Person Standing Yellow Piece Of Chart PowerPoint Ks2 Templates
PPT team effort person standing yellow piece of chart PowerPoint ks2 Templates-Use this Circular Arrow diagram to show activities that are related to the business plan metrics and monitor the results to determine if the business plan is proceeding as planned. You can apply other 3D Styles and shapes to the slide to enhance your presentations.-PPT team effort person standing yellow piece of chart PowerPoint ks2 Templates-arrow, bar, business, businessman, candidate, cartoon, character, chart, circle, circular, client, communication, company, concept, diagram, finance, financial, flow, growth, human, illustration, increase, information, iteration, man, market, marketing, process, processing, profit, sales, statistics, stats, success, target
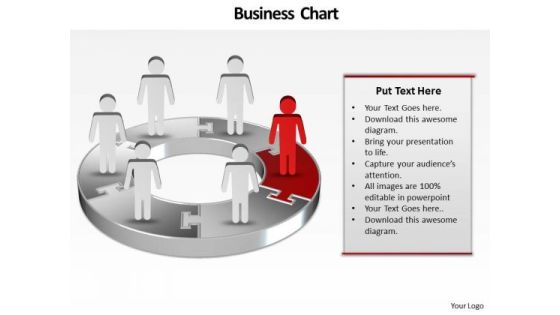
Ppt Illustration Of 3d PowerPoint Bar Chart With Standing Business People Templates
PPT illustration of 3d powerpoint bar chart with standing business people Templates-Develop competitive advantage with our above template which contains a diagram of one pie chart with cartoon men on it.This structure of our templates allows you to effectively highlight the key issues concerning to your business.-PPT illustration of 3d powerpoint bar chart with standing business people Templates-Adult, Art, Background, Business, Career, Chart, Communication, Concept, Conference, Corporate, Creative, Design, Economy, Executive, Finance, Group, Growth, Idea, Illustration, Leadership, Meeting, New, Occupation, Office, People, Person, Progress, Silhouette, Space, Speaking, Standing, Success

Ppt Pie Family Tree Chart PowerPoint 2003 Person Standing Green Piece Templates
PPT pie family tree chart PowerPoint 2003 person standing green piece Templates-The above Diagram displays a picture of eight circular text boxes placed in sequential manner. This image has been professionally designed to emphasize the concept of Operations performed in Circular process. Adjust the above image in your PPT presentations to visually support your content in your Business PPT slideshows.-PPT pie family tree chart PowerPoint 2003 person standing green piece Templates-arrow, bar, business, businessman, candidate, cartoon, character, chart, circle, circular, client, communication, company, concept, diagram, finance, financial, flow, growth, human, illustration, increase, information, iteration, man, market, marketing, process, processing, profit, sales, statistics, stats, success, target

Agile Certificate Coaching Company Determine Scrum Release Burndown Chart Demonstration PDF
This slide provides information regarding release burndown chart as scrum tool for monitoring scrum project progress. Deliver an awe-inspiring pitch with this creative agile certificate coaching company determine scrum release burndown chart demonstration pdf bundle. Topics like determine scrum release burndown chart can be discussed with this completely editable template. It is available for immediate download depending on the needs and requirements of the user.
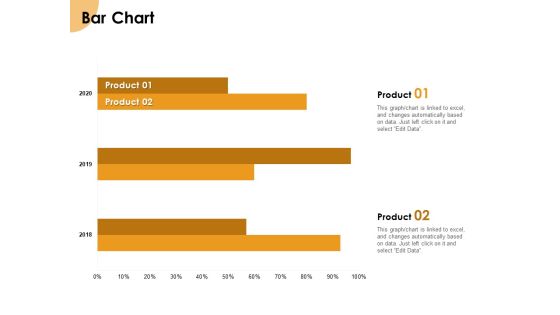
Growth Strategy And Growth Management Implementation Bar Chart Ppt Slides Graphics PDF
Presenting this set of slides with name growth strategy and growth management implementation bar chart ppt slides graphics pdf. The topics discussed in these slide is bar chart. This is a completely editable PowerPoint presentation and is available for immediate download. Download now and impress your audience.

Quarterly Sales Growth Chart For Financial Report Ppt PowerPoint Presentation Ideas Infographics
Presenting this set of slides with name quarterly sales growth chart for financial report ppt powerpoint presentation ideas infographics. The topics discussed in these slides are revenue trend, bar chart, financial. This is a completely editable PowerPoint presentation and is available for immediate download. Download now and impress your audience.
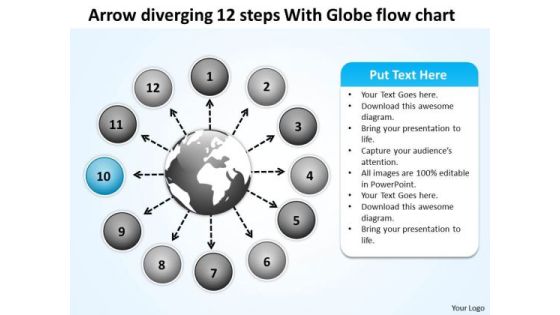
Arrow Diverging 12 Steps With Globe Flow Chart Target Network PowerPoint Templates
We present our arrow diverging 12 steps with globe flow chart Target Network PowerPoint templates.Download and present our Circle Charts PowerPoint Templates because the gears of youthful minds are useful, therefore set them in motion. Use our Arrows PowerPoint Templates because honesty is the best policy has an ardent follower in you. Use our Globe PowerPoint Templates because you have the entire picture in mind. Download our Business PowerPoint Templates because your ideas too are pinpointedly focused on you goals. Use our Flow Charts PowerPoint Templates because you are buzzing with ideas.Use these PowerPoint slides for presentations relating to 3d, abstract, aim, arrow, background, business, career, chart, circle, color, concept, creative, curve, design, development, direction, financial, flowing, gain, graph, green, group, growth, higher, illustration, increase, isolated, motion, moving, moving up, path, prediction, progress, red, series, shape, sign, success, symbol, target, turn, twisted, up, upload, upward, way, white, win. The prominent colors used in the PowerPoint template are Blue, Gray, White. PowerPoint presentation experts tell us our arrow diverging 12 steps with globe flow chart Target Network PowerPoint templates are Clever. PowerPoint presentation experts tell us our background PowerPoint templates and PPT Slides are Delightful. Presenters tell us our arrow diverging 12 steps with globe flow chart Target Network PowerPoint templates are Nostalgic. Presenters tell us our background PowerPoint templates and PPT Slides are Stylish. You can be sure our arrow diverging 12 steps with globe flow chart Target Network PowerPoint templates are Festive. We assure you our background PowerPoint templates and PPT Slides are Nice.
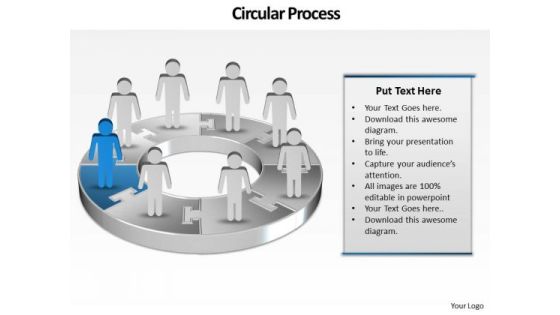
Ppt Group Of People Pie Chart Person Presentation Standing Blue Piece PowerPoint Templates
PPT group of people pie chart person presentation standing blue piece PowerPoint Templates-This PowerPoint Diagram shows the Round Description of steps which are involved in development Process. It includes Eight Steps. You can change color, size and orientation of any icon to your liking.-PPT group of people pie chart person presentation standing blue piece PowerPoint Templates-arrow, bar, business, businessman, candidate, cartoon, character, chart, circle, circular, client, communication, company, concept, diagram, finance, growth, human, illustration, increase, information, marketing, person, presentation, process, profit, sales, stats, success, target

Best Practices For Increasing Lead Conversion Rates Bar Chart Ppt Model Example Introduction PDF
Presenting this set of slides with name best practices for increasing lead conversion rates bar chart ppt model example introduction pdf. The topics discussed in these slide is bar chart. This is a completely editable PowerPoint presentation and is available for immediate download. Download now and impress your audience.

Business Profit Increase And Decrease Chart Due To Covid Ppt Templates PDF
Showcasing this set of slides titled business profit increase and decrease chart due to covid ppt templates pdf. The topics addressed in these templates are business profit increase and decrease chart due to covid. All the content presented in this PPT design is completely editable. Download it and make adjustments in color, background, font etc. as per your unique business setting.

Diverging 11 Steps Around Globe Process Flow Circular Layout Chart PowerPoint Templates
We present our diverging 11 steps around globe process flow Circular Layout Chart PowerPoint templates.Download our Globe PowerPoint Templates because as a result we often end up with errors. Download and present our Business PowerPoint Templates because you are ready to flap your wings and launch off. All poised are you to touch the sky with glory. Download and present our Circle Charts PowerPoint Templates because It can Bubble and burst with your ideas. Use our Process and flows PowerPoint Templates because you will surely see all making the grade. Present our Flow charts PowerPoint Templates because you can present your opinions in this field using our impressive templates.Use these PowerPoint slides for presentations relating to Arrows, business, chart, circle, company,concept, continuity, continuous, cycle,dependency, diagram, direction,dynamic,endless, graph,iteration, iterative, method, path, phase,presentation, process, production,progress, progression, report, rotation,sequence. The prominent colors used in the PowerPoint template are Yellow, Blue, Gray. People tell us our diverging 11 steps around globe process flow Circular Layout Chart PowerPoint templates are Awesome. Professionals tell us our cycle PowerPoint templates and PPT Slides are Splendid. We assure you our diverging 11 steps around globe process flow Circular Layout Chart PowerPoint templates are Tasteful. PowerPoint presentation experts tell us our company PowerPoint templates and PPT Slides are Breathtaking. We assure you our diverging 11 steps around globe process flow Circular Layout Chart PowerPoint templates will make the presenter successul in his career/life. People tell us our concept PowerPoint templates and PPT Slides are Tasteful.

Graphical Illustration Of 5 Stages Flow Chart Circular Process PowerPoint Slides
We present our graphical illustration of 5 stages flow chart Circular Process PowerPoint Slides.Use our Circle Charts PowerPoint Templates because your business and plans for its growth consist of processes that are highly co-related. Use our Arrows PowerPoint Templates because you have analysed the illness and know the need. Use our Business PowerPoint Templates because your thoughts are pointed and sharp as arrows. Use our Shapes PowerPoint Templates because this slide can help to bullet point your views. Download our Flow Charts PowerPoint Templates because this diagram provides multiple options for taking in and making sense of information.Use these PowerPoint slides for presentations relating to agreeable, agreeableness, art, blue, business, chart, circle, clip, clipart, conscientiousness, diagram, extraversion, factor, five, flow, graph, graphic, green, illustration, infographic, model, neuroticism, openness, personality, pointed, process, psychological, psychology, red, segment, segmented, shape, stages, star, trait, transparency. The prominent colors used in the PowerPoint template are Orange, Yellow, Green. Customers tell us our graphical illustration of 5 stages flow chart Circular Process PowerPoint Slides are Precious. PowerPoint presentation experts tell us our art PowerPoint templates and PPT Slides are Upbeat. People tell us our graphical illustration of 5 stages flow chart Circular Process PowerPoint Slides are Precious. People tell us our business PowerPoint templates and PPT Slides are Elegant. Customers tell us our graphical illustration of 5 stages flow chart Circular Process PowerPoint Slides are Clever. People tell us our art PowerPoint templates and PPT Slides are Multicolored.
Project Quality Planning And Controlling Process Tracking With Control Chart Ppt Infographic Template Clipart Images PDF
Presenting this set of slides with name project quality planning and controlling process tracking with control chart ppt infographic template clipart images pdf. The topics discussed in these slide is process tracking with control chart. This is a completely editable PowerPoint presentation and is available for immediate download. Download now and impress your audience.

Growth Strategy And Growth Management Implementation Pie Chart Ppt Show Example Introduction PDF
Presenting this set of slides with name growth strategy and growth management implementation pie chart ppt show example introduction pdf. The topics discussed in these slide is pie chart. This is a completely editable PowerPoint presentation and is available for immediate download. Download now and impress your audience.

Product Sales And Profit Increase And Decrease Chart Ppt Show PDF
Pitch your topic with ease and precision using this product sales and profit increase and decrease chart ppt show pdf. This layout presents information on product sales and profit increase and decrease chart. It is also available for immediate download and adjustment. So, changes can be made in the color, design, graphics or any other component to create a unique layout.

Best Practices For Increasing Lead Conversion Rates Line Chart Ppt Professional Show PDF
Presenting this set of slides with name best practices for increasing lead conversion rates line chart ppt professional show pdf. The topics discussed in these slide is line chart. This is a completely editable PowerPoint presentation and is available for immediate download. Download now and impress your audience.

Best Practices For Increasing Lead Conversion Rates Pie Chart Ppt Pictures Slideshow PDF
Presenting this set of slides with name best practices for increasing lead conversion rates pie chart ppt pictures slideshow pdf. The topics discussed in these slide is pie chart. This is a completely editable PowerPoint presentation and is available for immediate download. Download now and impress your audience.

3d Gears Chart 6 Stages Process Flow Ppt Business Plans For Sale PowerPoint Slides
Analyse ailments on our 3d gears chart 6 stages process flow ppt business plans for sale PowerPoint Slides. Bring out the thinking doctor in you.
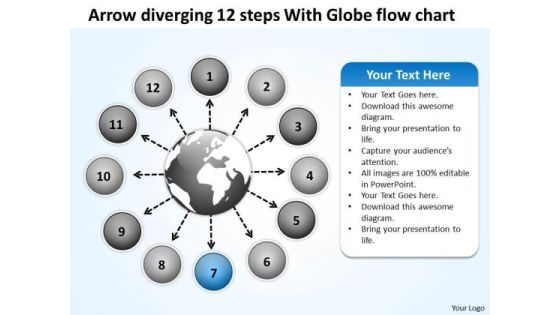
Arrow Diverging 12 Steps With Globe Flow Chart Circular PowerPoint Slides
We present our arrow diverging 12 steps with globe flow chart Circular PowerPoint Slides.Use our Circle Charts PowerPoint Templates because this diagram put it all together to form the complete picture and reach the goal. Use our Arrows PowerPoint Templates because the chart is designed to give you the flavour of the kind of tools you may need and the work that is performed in the lifecycle. Present our Globe PowerPoint Templates because you require care and diligence to function well. Use our Business PowerPoint Templates because this is the unerring accuracy in reaching the target. the effortless ability to launch into flight. Use our Flow Charts PowerPoint Templates because your marketing strategies can funnel down to the cone, stage by stage, refining as you go along.Use these PowerPoint slides for presentations relating to 3d, abstract, aim, arrow, background, business, career, chart, circle, color, concept, creative, curve, design, development, direction, financial, flowing, gain, graph, green, group, growth, higher, illustration, increase, isolated, motion, moving, moving up, path, prediction, progress, red, series, shape, sign, success, symbol, target, turn, twisted, up, upload, upward, way, white, win. The prominent colors used in the PowerPoint template are Blue, Gray, White. PowerPoint presentation experts tell us our arrow diverging 12 steps with globe flow chart Circular PowerPoint Slides are Energetic. PowerPoint presentation experts tell us our career PowerPoint templates and PPT Slides are Delightful. Presenters tell us our arrow diverging 12 steps with globe flow chart Circular PowerPoint Slides have awesome images to get your point across. Presenters tell us our background PowerPoint templates and PPT Slides are Clever. You can be sure our arrow diverging 12 steps with globe flow chart Circular PowerPoint Slides are Enchanting. We assure you our chart PowerPoint templates and PPT Slides are Bold.

Ppt Illustration Of 3d Create Pie Chart With Standing Business Persons PowerPoint Templates
PPT illustration of 3d create pie chart with standing business persons PowerPoint Templates-Emphatically define your message with our above template which contains a graphic 3d pie chart with animated men. This image represents the concept of Business Meetings, Conferences etc. This Diagram is designed to attract the attention of your audience.-PPT illustration of 3d create pie chart with standing business persons PowerPoint Templates-Adult, Art, Background, Business, Career, Chart, Communication, Concept, Conference, Corporate, Creative, Design, Economy, Executive, Finance, Group, Growth, Idea, Illustration, Leadership, Meeting, New, Occupation, Office, People, Person, Progress, Silhouette, Space, Speaking, Standing, Success

Ppt Group Of People Pie Chart Person Standing Purple Piece PowerPoint Templates
PPT group of people pie chart person standing purple piece PowerPoint Templates-This continual illustration of procedure graphic is a visual representation of your information and ideas. Use this diagram as a method of graphically representing the flow of data as an information processing system.-PPT group of people pie chart person standing purple piece PowerPoint Templates-arrow, bar, business, businessman, candidate, cartoon, character, chart, circle, circular, client, communication, company, concept, diagram, finance, growth, human, illustration, increase, information, marketing, person, presentation, process, profit, sales, stats, success, target
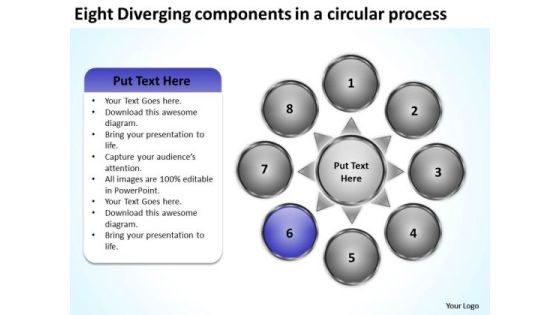
Eight Diverging Components A Circular Process Circular Pie Chart PowerPoint Slides
We present our eight diverging components a circular process Circular Pie Chart PowerPoint Slides.Use our Business PowerPoint Templates because you can Flutter your wings and enchant the world. Impress them with the innate attractiveness of your thoughts and words. Use our Circle Charts PowerPoint Templates because you are the star of your enlightened team. Download and present our Arrows PowerPoint Templates because the key criteria for necessary infrastructure are at your finger tips. Radiate this knowledge to the group and see their eyes light up. Use our Shapes PowerPoint Templates because the structure of our templates allows you to effectively highlight the key issues concerning the growth of your business. Use our Flow charts PowerPoint Templates because this template contains the material to highlight the key issues of your presentation.Use these PowerPoint slides for presentations relating to Arrows, blank, business, central, centralized, chart, circle, circular, circulation concept, conceptual, converging, design, diagram, empty, executive, icon, idea illustration, management, map, mapping, moa, model, numbers, organization outwards, pointing, procedure, process, radial, radiating, relationship, resource sequence, sequential, seven, square, strategy, template. The prominent colors used in the PowerPoint template are Blue, Gray, White. Presenters tell us our eight diverging components a circular process Circular Pie Chart PowerPoint Slides are Breathtaking. Presenters tell us our business PowerPoint templates and PPT Slides have awesome images to get your point across. PowerPoint presentation experts tell us our eight diverging components a circular process Circular Pie Chart PowerPoint Slides are Adorable. We assure you our chart PowerPoint templates and PPT Slides are Excellent. Customers tell us our eight diverging components a circular process Circular Pie Chart PowerPoint Slides are Fabulous. People tell us our chart PowerPoint templates and PPT Slides are effectively colour coded to prioritise your plans They automatically highlight the sequence of events you desire.

Ppt Team Work Person Presentation Standing Orange Piece Of Chart PowerPoint Templates
PPT team work person presentation standing orange piece of chart PowerPoint Templates-Use this graphical approach to represent global business issues such as financial data, stock market Exchange, increase in sales, corporate presentations and more. Create captivating presentations to deliver comparative and weighted arguments.-PPT team work person presentation standing orange piece of chart PowerPoint Templates-arrow, bar, business, businessman, candidate, cartoon, character, chart, circle, circular, client, communication, company, concept, diagram, finance, financial, flow, growth, human, illustration, increase, information, iteration, man, market, marketing, process, processing, profit, sales, statistics, stats, success, target

Stock Control System Volume Open High Low Close Chart Ppt Model Slides PDF
Deliver an awe inspiring pitch with this creative stock control system volume open high low close chart ppt model slides pdf bundle. Topics like volume open high low close chart can be discussed with this completely editable template. It is available for immediate download depending on the needs and requirements of the user.

Incident And Issue Management Procedure Planned And Actual Velocity Project Burndown Chart Guidelines PDF
This slide provides the glimpse about the planned and actual velocity project burndown chart which showcase the impact of introducing issue escalation process in the company. Deliver an awe inspiring pitch with this creative incident and issue management procedure planned and actual velocity project burndown chart guidelines pdf bundle. Topics like planned and actual velocity project burndown chart can be discussed with this completely editable template. It is available for immediate download depending on the needs and requirements of the user.

Approach Avoidance Conflict Planned And Actual Velocity Project Burndown Chart Structure PDF
This slide provides the glimpse about the planned and actual velocity project burndown chart which showcase the impact of introducing issue escalation process in the company. Deliver an awe inspiring pitch with this creative approach avoidance conflict planned and actual velocity project burndown chart structure pdf bundle. Topics like planned and actual velocity project burndown chart can be discussed with this completely editable template. It is available for immediate download depending on the needs and requirements of the user.
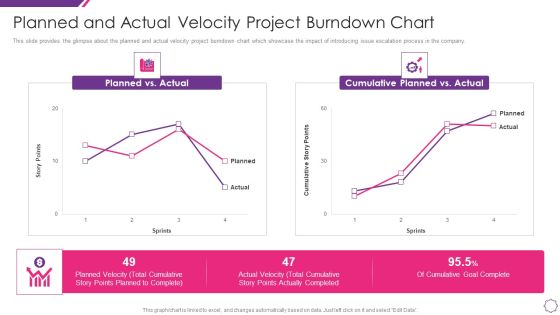
Handle Project Escalations Planned And Actual Velocity Project Burndown Chart Ppt Portfolio Outfit PDF
This slide provides the glimpse about the planned and actual velocity project burndown chart which showcase the impact of introducing issue escalation process in the company. Deliver an awe inspiring pitch with this creative handle project escalations planned and actual velocity project burndown chart ppt portfolio outfit pdf bundle. Topics like planned and actual velocity project burndown chart can be discussed with this completely editable template. It is available for immediate download depending on the needs and requirements of the user.
Share Market Trading In Progress Evaluation On Chart Icon Themes PDF
Presenting share market trading in progress evaluation on chart icon themes pdf to dispense important information. This template comprises one stages. It also presents valuable insights into the topics including share market trading in progress evaluation on chart icon. This is a completely customizable PowerPoint theme that can be put to use immediately. So, download it and address the topic impactfully.
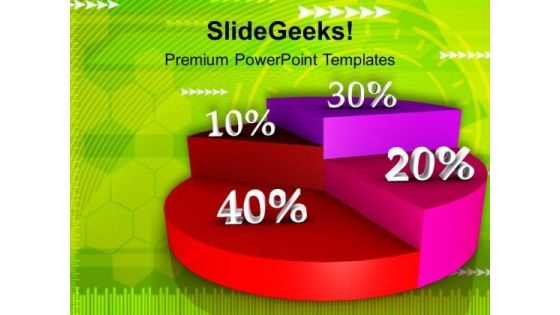
Percentage Pie Chart Growth Future PowerPoint Templates Ppt Backgrounds For Slides 0313
We present our Percentage Pie Chart Growth Future PowerPoint Templates PPT Backgrounds For Slides 0313.Download our Pie Charts PowerPoint Templates because You will get more than you ever bargained for. Download our Circle Charts PowerPoint Templates because Your success is our commitment. Our PowerPoint Templates and Slides will ensure you reach your goal. Download and present our Business PowerPoint Templates because Our PowerPoint Templates and Slides will let you Leave a lasting impression to your audiences. They possess an inherent longstanding recall factor. Download and present our Marketing PowerPoint Templates because you can Break through with our PowerPoint Templates and Slides. Bring down the mental barriers of your audience. Present our Curves and Lines PowerPoint Templates because These PowerPoint Templates and Slides will give the updraft to your ideas. See them soar to great heights with ease.Use these PowerPoint slides for presentations relating to Pie chart with percents written on it, pie charts, circle charts, business, marketing, curves and lines. The prominent colors used in the PowerPoint template are Pink, Red, Green lime.
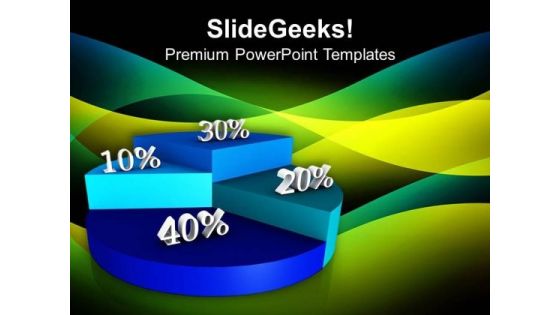
Blue Pie Chart Percentage Growth Future PowerPoint Templates Ppt Backgrounds For Slides 0313
We present our Blue Pie Chart Percentage Growth Future PowerPoint Templates PPT Backgrounds For Slides 0313.Download our Pie Charts PowerPoint Templates because Our PowerPoint Templates and Slides will let Your superior ideas hit the target always and everytime. Use our Circle Charts PowerPoint Templates because You have belief amd faith in your futuristic plans. Chalk them out for your team with our PowerPoint Templates and Slides. Download and present our Business PowerPoint Templates because You can Hit a home run with our PowerPoint Templates and Slides. See your ideas sail into the minds of your audience. Present our Marketing PowerPoint Templates because You should Kick up a storm with our PowerPoint Templates and Slides. The heads of your listeners will swirl with your ideas. Download our Curves and Lines PowerPoint Templates because Our PowerPoint Templates and Slides are a sure bet. Gauranteed to win against all odds. Use these PowerPoint slides for presentations relating to Blue pie chart with percents written on it, pie charts, circle charts, business, marketing, curves and lines. The prominent colors used in the PowerPoint template are Blue light, Blue, White.

6 Stages Flow Diverging Process Arrows Relative Cycle Chart PowerPoint Slides
We present our 6 stages flow diverging process arrows Relative Cycle Chart PowerPoint Slides.Download and present our Boxes PowerPoint Templates because you understand the ailment and how to fight it. Download our Business PowerPoint Templates because this template can project the path to sucess that you have charted. Download our Arrows PowerPoint Templates because so that you can Lead the way to spread good cheer to one and all. Download and present our Circle Charts PowerPoint Templates because Our PowerPoint Templates and Slides offer you the widest possible range of options. Download our Flow Charts PowerPoint Templates because your group can behave steady in the top bracket.Use these PowerPoint slides for presentations relating to 3d, abstract, arrow, art, background, blank, business, chart, circle, concept, connection, cycle, development, diagram, direction, element, environment, exchange, finance, financial, flow, graph, graphic, graphic presentation, group, icon, illustration, investment, isolated, isometric, market, motion, movement, organization, passive income, perspective, process, process chart, recycle, report, ring, sign, step, stock, success, symbol, teamwork, text, vector. The prominent colors used in the PowerPoint template are Blue, Red, Yellow. Presenters tell us our 6 stages flow diverging process arrows Relative Cycle Chart PowerPoint Slides will save the presenter time. You can be sure our arrow PowerPoint templates and PPT Slides are Excellent. Professionals tell us our 6 stages flow diverging process arrows Relative Cycle Chart PowerPoint Slides are Handsome. People tell us our art PowerPoint templates and PPT Slides are Youthful. People tell us our 6 stages flow diverging process arrows Relative Cycle Chart PowerPoint Slides will make the presenter look like a pro even if they are not computer savvy. Professionals tell us our arrow PowerPoint templates and PPT Slides provide great value for your money. Be assured of finding the best projection to highlight your words.

Bar Chart Showing Business Growth Ppt PowerPoint Presentation Portfolio Design Ideas PDF
Presenting this set of slides with name bar chart showing business growth ppt powerpoint presentation portfolio design ideas pdf. The topics discussed in these slide is bar chart showing business growth. This is a completely editable PowerPoint presentation and is available for immediate download. Download now and impress your audience.

Business Policy And Strategy Steps Quality Circle Process Chart Innovative Marketing Concepts
We present our business policy and strategy steps quality circle process chart innovative marketing concepts.Use our Flow Charts PowerPoint Templates because It can Bubble and burst with your ideas. Use our Business PowerPoint Templates because You can Be the puppeteer with our PowerPoint Templates and Slides as your strings. Lead your team through the steps of your script. Present our Process and Flows PowerPoint Templates because You should Press the right buttons with our PowerPoint Templates and Slides. They will take your ideas down the perfect channel. Download and present our Circle Charts PowerPoint Templates because You can Connect the dots. Fan expectations as the whole picture emerges. Present our Shapes PowerPoint Templates because you should Experience excellence with our PowerPoint Templates and Slides. They will take your breath away.Use these PowerPoint slides for presentations relating to Act, arrow, blue, business, chart, check, circle, concept, control, cycle, design, development, diagram, do, engineering, evaluate, flow, flow-chart, flowchart, graphic, green, idea, info graphic, iterative, life-cycle, lifecycle, management, method, model, process, quality, research, schema, software, spiral, step, strategy, success, system, vector, white, work, workflow. The prominent colors used in the PowerPoint template are Green, Gray, Black.
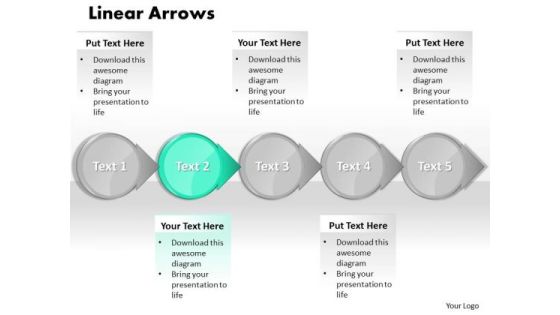
Ppt Cyan Circular Arrow Business PowerPoint Slide Text Download Process Chart Templates
PPT cyan circular arrow business powerpoint slide text download process chart Templates-This mechanical and industrial Diagram for PowerPoint features a 3D representation of interconnected Curved Arrows. Includes several predesigned layouts. Use this successive PowerPoint diagram to represent a series of interconnected ideas.-PPT cyan circular arrow business powerpoint slide text download process chart Templates-abstract, algorithm, arrow, arrow chart, block, block diagram, business, chart, connection, design, development, diagram, direction, element, flow, flowchart, graph, linear, management, organization, plan, process, program, section, segment, set, sign, solution, strategy, symbol, vector
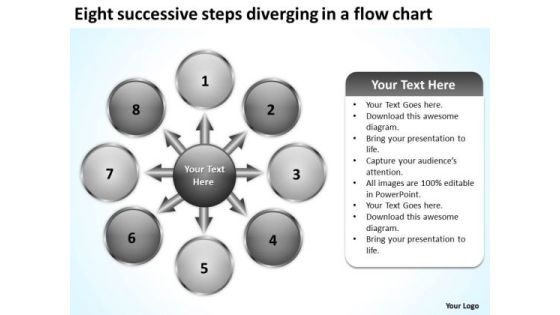
Eight Successive Steps Diverging A Flow Chart Cycle Motion Network PowerPoint Slides
We present our eight successive steps diverging a flow chart Cycle Motion Network PowerPoint Slides.Download our Business PowerPoint Templates because a lot of dissimilar elements needing to gel to strike the deal. Use our Circle Charts PowerPoint Templates because this diagram is designed to help your audience to develop their thoughts along the way. Download and present our Arrows PowerPoint Templates because this business powerpoint template helps expound on the logic of your detailed thought process to take your company forward. Download our Shapes PowerPoint Templates because you have a handle on all the targets, a master of the game, the experienced and consummate juggler. Download our Flow charts PowerPoint Templates because there is a key aspect to be emphasised.Use these PowerPoint slides for presentations relating to Arrows, blank, business, central, centralized, chart, circle, circular, circulation concept, conceptual, converging, design, diagram, empty, executive, icon, idea illustration, management, map, mapping, moa, model, numbers, organization outwards, pointing, procedure, process, radial, radiating, relationship, resource sequence, sequential, seven, square, strategy, template. The prominent colors used in the PowerPoint template are Blue, Gray, White. Presenters tell us our eight successive steps diverging a flow chart Cycle Motion Network PowerPoint Slides are Exuberant. Presenters tell us our centralized PowerPoint templates and PPT Slides help you meet deadlines which are an element of today's workplace. Just browse and pick the slides that appeal to your intuitive senses. PowerPoint presentation experts tell us our eight successive steps diverging a flow chart Cycle Motion Network PowerPoint Slides are Awesome. We assure you our chart PowerPoint templates and PPT Slides have awesome images to get your point across. Customers tell us our eight successive steps diverging a flow chart Cycle Motion Network PowerPoint Slides will get their audience's attention. People tell us our central PowerPoint templates and PPT Slides are Festive.

Chart For Financial Trends Analysis Ppt PowerPoint Presentation Inspiration Background Image
Presenting this set of slides with name chart for financial trends analysis ppt powerpoint presentation inspiration background image. The topics discussed in these slides are revenue trend, bar chart, financial. This is a completely editable PowerPoint presentation and is available for immediate download. Download now and impress your audience.

Circle And Quadrilateral Shapes Business Workflow Chart Vector Icon Ppt PowerPoint Presentation Gallery Master Slide PDF
Presenting circle and quadrilateral shapes business workflow chart vector icon ppt powerpoint presentation gallery master slide pdf to dispense important information. This template comprises three stages. It also presents valuable insights into the topics including circle and quadrilateral shapes business workflow chart vector icon. This is a completely customizable PowerPoint theme that can be put to use immediately. So, download it and address the topic impactfully.

Chart Showing Changes For Business Investment And Credit Growth Ppt Infographic Template Slides PDF
Showcasing this set of slides titled chart showing changes for business investment and credit growth ppt infographic template slides pdf. The topics addressed in these templates are chart showing changes for business investment and credit growth. All the content presented in this PPT design is completely editable. Download it and make adjustments in color, background, font etc. as per your unique business setting.
Quadrilateral And Circle Shapes Flow Chart Icon Ppt PowerPoint Presentation File Gallery PDF
Persuade your audience using this quadrilateral and circle shapes flow chart icon ppt powerpoint presentation file gallery pdf. This PPT design covers two stages, thus making it a great tool to use. It also caters to a variety of topics including quadrilateral and circle shapes flow chart icon. Download this PPT design now to present a convincing pitch that not only emphasizes the topic but also showcases your presentation skills.

Business Chart Vector Illustrating Growth And Decline Ppt Pictures Deck PDF
Showcasing this set of slides titled business chart vector illustrating growth and decline ppt pictures deck pdf. The topics addressed in these templates are business chart vector illustrating growth and decline . All the content presented in this PPT design is completely editable. Download it and make adjustments in color, background, font etc. as per your unique business setting.

Arrow Diverging 12 Steps With Globe Flow Chart Pie Process PowerPoint Templates
We present our arrow diverging 12 steps with globe flow chart Pie Process PowerPoint templates.Present our Circle Charts PowerPoint Templates because you can Unravel the desired and essential elements of your overall strategy. Present our Arrows PowerPoint Templates because they will Amplify your thoughts via our appropriate templates. Present our Globe PowerPoint Templates because like your thoughts arrows are inherently precise and true. Present our Business PowerPoint Templates because this diagram can set an example to enthuse your team with the passion and fervour of your ideas. Download our Flow Charts PowerPoint Templates because you have some excellent plans to spread some more of it across your community.Use these PowerPoint slides for presentations relating to 3d, abstract, aim, arrow, background, business, career, chart, circle, color, concept, creative, curve, design, development, direction, financial, flowing, gain, graph, green, group, growth, higher, illustration, increase, isolated, motion, moving, moving up, path, prediction, progress, red, series, shape, sign, success, symbol, target, turn, twisted, up, upload, upward, way, white, win. The prominent colors used in the PowerPoint template are Blue, Gray, White. PowerPoint presentation experts tell us our arrow diverging 12 steps with globe flow chart Pie Process PowerPoint templates provide great value for your money. Be assured of finding the best projection to highlight your words. PowerPoint presentation experts tell us our chart PowerPoint templates and PPT Slides are aesthetically designed to attract attention. We guarantee that they will grab all the eyeballs you need. Presenters tell us our arrow diverging 12 steps with globe flow chart Pie Process PowerPoint templates are Reminiscent. Presenters tell us our arrow PowerPoint templates and PPT Slides are Beautiful. You can be sure our arrow diverging 12 steps with globe flow chart Pie Process PowerPoint templates look good visually. We assure you our background PowerPoint templates and PPT Slides are Second to none.
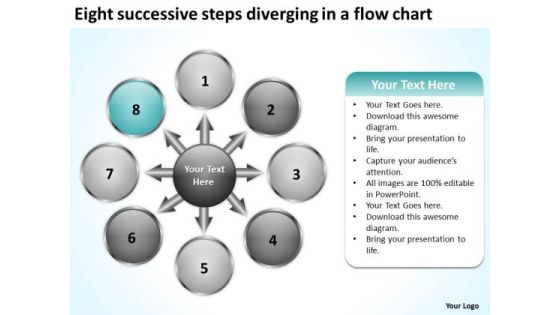
Eight Successive Steps Diverging A Flow Chart Cycle Motion PowerPoint Slides
We present our eight successive steps diverging a flow chart Cycle Motion PowerPoint Slides.Use our Business PowerPoint Templates because a lot of dissimilar elements needing to gel to strike the deal. Download and present our Circle Charts PowerPoint Templates because your group can behave steady in the top bracket. Download and present our Arrows PowerPoint Templates because this is An innovative slide design depicting driving home the relevance of a steady rhythm. Download and present our Shapes PowerPoint Templates because it illustrates the symbols of human growth. Present our Flow charts PowerPoint Templates because this is an impressive template to unravel your recipe for a mouth watering result.Use these PowerPoint slides for presentations relating to Arrows, blank, business, central, centralized, chart, circle, circular, circulation concept, conceptual, converging, design, diagram, empty, executive, icon, idea illustration, management, map, mapping, moa, model, numbers, organization outwards, pointing, procedure, process, radial, radiating, relationship, resource sequence, sequential, seven, square, strategy, template. The prominent colors used in the PowerPoint template are Blue, Gray, White. Presenters tell us our eight successive steps diverging a flow chart Cycle Motion PowerPoint Slides are Glamorous. Presenters tell us our circulation PowerPoint templates and PPT Slides provide great value for your money. Be assured of finding the best projection to highlight your words. PowerPoint presentation experts tell us our eight successive steps diverging a flow chart Cycle Motion PowerPoint Slides are Functional. We assure you our business PowerPoint templates and PPT Slides are Fashionable. Customers tell us our eight successive steps diverging a flow chart Cycle Motion PowerPoint Slides effectively help you save your valuable time. People tell us our chart PowerPoint templates and PPT Slides are effectively colour coded to prioritise your plans They automatically highlight the sequence of events you desire.

Eight Diverging Components A Circular Process Business Pie Chart PowerPoint Slides
We present our eight diverging components a circular process business Pie Chart PowerPoint Slides.Present our Business PowerPoint Templates because everybody knows The world over it is a priority for many. Along with it there are so many oppurtunities waiting to be utilised. Download and present our Circle Charts PowerPoint Templates because our ready backdrops leave a lasting impression. Present our Arrows PowerPoint Templates because you can Show them how to churn out fresh ideas. Use our Shapes PowerPoint Templates because watching them will strengthen your companys sinews. Use our Flow charts PowerPoint Templates because you can get advantage to prioritise your ideas.Use these PowerPoint slides for presentations relating to Arrows, blank, business, central, centralized, chart, circle, circular, circulation concept, conceptual, converging, design, diagram, empty, executive, icon, idea illustration, management, map, mapping, moa, model, numbers, organization outwards, pointing, procedure, process, radial, radiating, relationship, resource sequence, sequential, seven, square, strategy, template. The prominent colors used in the PowerPoint template are Blue, Gray, White. Presenters tell us our eight diverging components a circular process business Pie Chart PowerPoint Slides are Efficacious. Presenters tell us our centralized PowerPoint templates and PPT Slides are Handsome. PowerPoint presentation experts tell us our eight diverging components a circular process business Pie Chart PowerPoint Slides are Awesome. We assure you our business PowerPoint templates and PPT Slides are Delightful. Customers tell us our eight diverging components a circular process business Pie Chart PowerPoint Slides are Functional. People tell us our central PowerPoint templates and PPT Slides are Delightful.
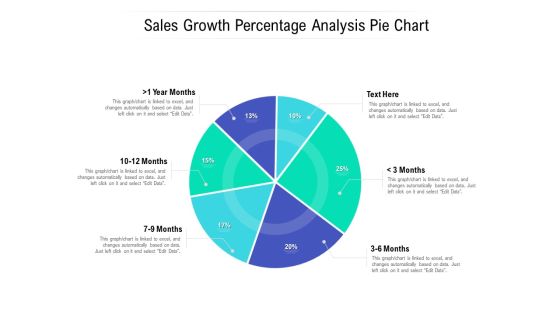
Sales Growth Percentage Analysis Pie Chart Ppt PowerPoint Presentation Summary Skills PDF
Presenting this set of slides with name sales growth percentage analysis pie chart ppt powerpoint presentation summary skills pdf. The topics discussed in these slide is sales growth percentage analysis pie chart. This is a completely editable PowerPoint presentation and is available for immediate download. Download now and impress your audience.

Business Statistic Chart With Expansion And Reduction Icon Ppt Visual Aids Ideas PDF
Pitch your topic with ease and precision using this business statistic chart with expansion and reduction icon ppt visual aids ideas pdf. This layout presents information on business statistic chart with expansion and reduction icon. It is also available for immediate download and adjustment. So, changes can be made in the color, design, graphics or any other component to create a unique layout.

Ppt Circle Arrow Free Business Presentation Process Flow Chart PowerPoint Templates
PPT circle arrow free business presentation process flow chart PowerPoint Templates-This Business Oriented Chart will definitely help you to be more Successful. Use this graphics as key element in streamlining your plans. It consists of Circular Arrows connected together to form a complete Process.-PPT circle arrow free business presentation process flow chart PowerPoint Templates-abstract, access, arrow, background, banner, blue, bright, business, chart, circle, colorful, concept, corporate, creative, cycle, design, different, element, frame, graphic, group, idea, illustration, process, shape, speech, strategy, symbol, template, text, usable, vector
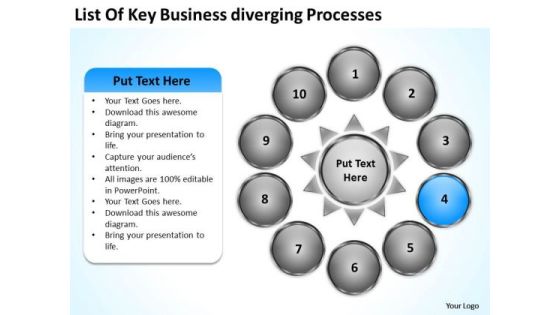
Nine Stages Diverging Factors Flow Chart Gear Circular Spoke PowerPoint Templates
We present our nine stages diverging factors flow chart Gear Circular Spoke PowerPoint templates.Download our Success PowerPoint Templates because the success of your venture depends on the performance of every team member. Present our Arrows PowerPoint Templates because this template with an image of helps you chart the course of your presentation. Download our Flow charts PowerPoint Templates because it describes the benefits of healthy food habits and lifestyles in respect of vital organs of the human anatomy. Download and present our Ring Charts PowerPoint Templates because our PowerPoint templates give this step by step process to acheive the aim. Present our Signs PowerPoint Templates because this slide shows each path to the smallest detail.Use these PowerPoint slides for presentations relating to Arrow, background, board, business,chart, circle, circular, circulation, color,colorful, concept, curving, cycle,description, design, diagram, diagram,chart, diagramcircle, diagramelements,diagramvector, direction, element, flow,flowchart, fresh, graphic, illustration,loop, message, motion, phase, present,presentation, process, process,flow,ring, rotation, round, rounddiagram,section, segment, set, shape, sign, step,success, symbol. The prominent colors used in the PowerPoint template are Blue, Gray, White. People tell us our nine stages diverging factors flow chart Gear Circular Spoke PowerPoint templates are Chic. Customers tell us our chart PowerPoint templates and PPT Slides are topically designed to provide an attractive backdrop to any subject. Professionals tell us our nine stages diverging factors flow chart Gear Circular Spoke PowerPoint templates are Fun. Presenters tell us our circular PowerPoint templates and PPT Slides will generate and maintain the level of interest you desire. They will create the impression you want to imprint on your audience. Use our nine stages diverging factors flow chart Gear Circular Spoke PowerPoint templates provide you with a vast range of viable options. Select the appropriate ones and just fill in your text. Presenters tell us our color PowerPoint templates and PPT Slides are Reminiscent.
Steps For Successful Brand Building Process Bar Chart Ppt Portfolio Icon PDF
Presenting this set of slides with name steps for successful brand building process bar chart ppt portfolio icon pdf. The topics discussed in these slide is bar chart. This is a completely editable PowerPoint presentation and is available for immediate download. Download now and impress your audience.
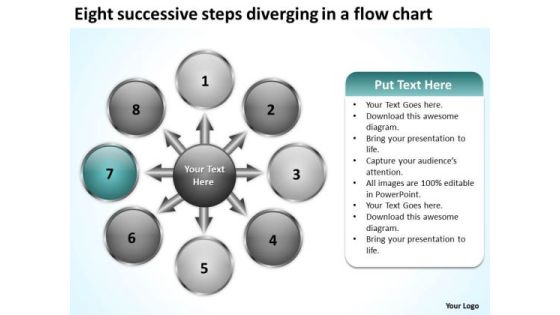
Successive Steps Diverging A Flow Chart Circular Spoke Diagram PowerPoint Templates
We present our successive steps diverging a flow chart Circular Spoke Diagram PowerPoint templates.Present our Process and Flows PowerPoint Templates because you have the process in your head, our template design showing will illuminate your thoughts. Use our Flow charts PowerPoint Templates because this Slide offers an excellent background to build up the various stages of your business process. Download and present our Business PowerPoint Templates because your fledgling career is in the chrysallis stage. Nurture it and watch it grow into a beautiful butterfly. Download our Ring Charts PowerPoint Templates because this diagram has the unique ability to drive home your ideas and show how they mesh to guarantee success. Download and present our Shapes PowerPoint Templates because it helps you to get your team in the desired sequence into the bracket.Use these PowerPoint slides for presentations relating to Arrows, background, blue, chart, circle, circular, circulation, clipart, colorful, connection, continuity, cycle, cyclic, diagram, direction, empty, flow, graph, green, icon, illustration, isolated ,loop, motion presentation, process, progress, reason, recycle, recycling, repetition, report, result, ring, rotation, round, scheme, section, step, symbol, teamwork . The prominent colors used in the PowerPoint template are Green dark , Black, White. The feedback we get is that our successive steps diverging a flow chart Circular Spoke Diagram PowerPoint templates are Pretty. The feedback we get is that our circle PowerPoint templates and PPT Slides are specially created by a professional team with vast experience. They diligently strive to come up with the right vehicle for your brilliant Ideas. People tell us our successive steps diverging a flow chart Circular Spoke Diagram PowerPoint templates are Wonderful. We assure you our chart PowerPoint templates and PPT Slides are Beautiful. We assure you our successive steps diverging a flow chart Circular Spoke Diagram PowerPoint templates will make the presenter look like a pro even if they are not computer savvy. The feedback we get is that our blue PowerPoint templates and PPT Slides are Detailed.

Data Analysis Template Driven Stock Chart For Market Trends PowerPoint Slides Templates
Drive Your Team Along The Road To Success. Take The Wheel With Our data analysis template driven stock chart for market trends powerpoint slides Templates .
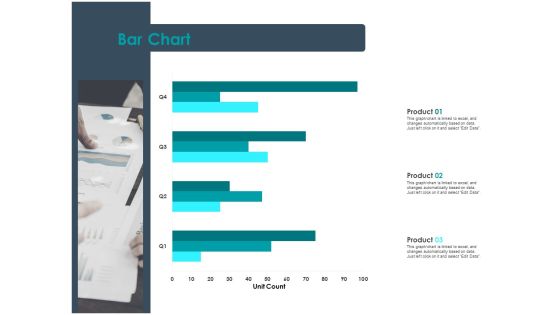
Strategic Plan For Companys Development Bar Chart Ppt PowerPoint Presentation Visual Aids Gallery
Presenting this set of slides with name strategic plan for companys development bar chart ppt powerpoint presentation visual aids gallery. The topics discussed in these slide is bar chart. This is a completely editable PowerPoint presentation and is available for immediate download. Download now and impress your audience.
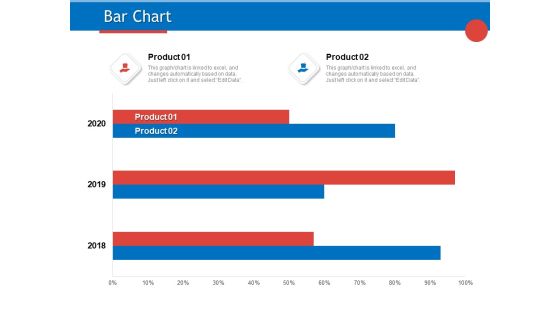
Developing Product Planning Strategies Bar Chart Ppt PowerPoint Presentation Styles Ideas PDF
Presenting this set of slides with name developing product planning strategies bar chart ppt powerpoint presentation styles ideas pdf. The topics discussed in these slide is bar chart. This is a completely editable PowerPoint presentation and is available for immediate download. Download now and impress your audience.

Key Data Quality Measurement Chart With Share Of Respondents Ppt PowerPoint Presentation Model Good PDF
Showcasing this set of slides titled key data quality measurement chart with share of respondents ppt powerpoint presentation model good pdf. The topics addressed in these templates are key data quality measurement chart with share of respondents. All the content presented in this PPT design is completely editable. Download it and make adjustments in color, background, font etc. as per your unique business setting.
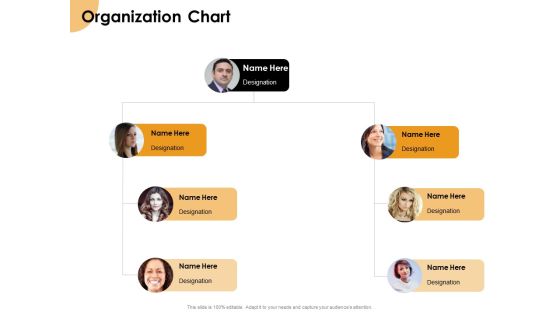
Growth Strategy And Growth Management Implementation Organization Chart Ppt Gallery File Formats PDF
Presenting this set of slides with name growth strategy and growth management implementation organization chart ppt gallery file formats pdf. This is a four stage process. The stages in this process are organization chart. This is a completely editable PowerPoint presentation and is available for immediate download. Download now and impress your audience.

Bar Chart For Segmentation Of Workforce Development Ppt PowerPoint Presentation Styles Portrait PDF
Presenting this set of slides with name bar chart for segmentation of workforce development ppt powerpoint presentation styles portrait pdf. The topics discussed in these slide is bar chart for segmentation of workforce development. This is a completely editable PowerPoint presentation and is available for immediate download. Download now and impress your audience.
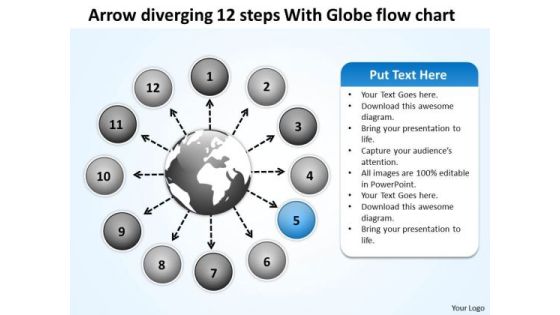
Arrow Diverging 12 Steps With Globe Flow Chart Circular Motion PowerPoint Slides
We present our arrow diverging 12 steps with globe flow chart Circular Motion PowerPoint Slides.Use our Circle Charts PowerPoint Templates because this outlines the path you have in mind in order to boost sales and stay ahead of the competition enhancing your corporate reputation as you go along the road to success. Download our Arrows PowerPoint Templates because Our PowerPoint Templates and Slides are conceived by a dedicated team. Use them and give form to your wondrous ideas. Use our Globe PowerPoint Templates because you can Start with the fundamental basic activities and slowly but surely hone them down to the top of the pyramid, the ultimate goal. Present our Business PowerPoint Templates because profit levels have been steady over the recent past. Spread your heightened excitement to others in the room. Present our Flow Charts PowerPoint Templates because we provide the means to project your views.Use these PowerPoint slides for presentations relating to 3d, abstract, aim, arrow, background, business, career, chart, circle, color, concept, creative, curve, design, development, direction, financial, flowing, gain, graph, green, group, growth, higher, illustration, increase, isolated, motion, moving, moving up, path, prediction, progress, red, series, shape, sign, success, symbol, target, turn, twisted, up, upload, upward, way, white, win. The prominent colors used in the PowerPoint template are Blue, Gray, White. PowerPoint presentation experts tell us our arrow diverging 12 steps with globe flow chart Circular Motion PowerPoint Slides are Perfect. PowerPoint presentation experts tell us our arrow PowerPoint templates and PPT Slides provide great value for your money. Be assured of finding the best projection to highlight your words. Presenters tell us our arrow diverging 12 steps with globe flow chart Circular Motion PowerPoint Slides are Reminiscent. Presenters tell us our background PowerPoint templates and PPT Slides are Flirty. You can be sure our arrow diverging 12 steps with globe flow chart Circular Motion PowerPoint Slides are designed by a team of presentation professionals. We assure you our chart PowerPoint templates and PPT Slides are Ultra.

Developing Organization Partner Strategy Bar Chart Ppt PowerPoint Presentation Styles Ideas PDF
Presenting this set of slides with name developing organization partner strategy bar chart ppt powerpoint presentation styles ideas pdf. The topics discussed in these slide is bar chart. This is a completely editable PowerPoint presentation and is available for immediate download. Download now and impress your audience.

Developing New Sales And Marketing Strategic Approach Bar Chart Ppt PowerPoint Presentation Show Samples PDF
Presenting this set of slides with name developing new sales and marketing strategic approach bar chart ppt powerpoint presentation show samples pdf. The topics discussed in these slide is bar chart. This is a completely editable PowerPoint presentation and is available for immediate download. Download now and impress your audience.

Best Practices For Increasing Lead Conversion Rates Organization Chart Ppt Gallery Graphic Images PDF
Presenting this set of slides with name best practices for increasing lead conversion rates organization chart ppt gallery graphic images pdf. This is a three stage process. The stages in this process are organization chart. This is a completely editable PowerPoint presentation and is available for immediate download. Download now and impress your audience.

Diverging 11 Factors Round Manner Ppt Cycle Flow Chart PowerPoint Slides
We present our diverging 11 factors round manner ppt Cycle Flow Chart PowerPoint Slides.Use our Circle Charts PowerPoint Templates because you have played a stellar role and have a few ideas. Use our Arrows PowerPoint Templates because you can see clearly through to the bigger bowl ahead. Time your jump to perfection and hit the nail on the head. Use our Business PowerPoint Templates because spell out your advertising plans to increase market share. The feedback has been positive and productive. Download and present our Shapes PowerPoint Templates because this one depicts the popular chart. Use our Flow Charts PowerPoint Templates because like your thoughts arrows are inherently precise and true.Use these PowerPoint slides for presentations relating to amazement, application, arrow, background, black, circle, devolution, direction, direction-giving, email, glamour, help, icon, insert, internet, joy, manners, reflex, roundly, scalable, search, searching, solution, support, universal, vector, visible, way, website, white. The prominent colors used in the PowerPoint template are Yellow, Green, Blue. Customers tell us our diverging 11 factors round manner ppt Cycle Flow Chart PowerPoint Slides are Fashionable. PowerPoint presentation experts tell us our devolution PowerPoint templates and PPT Slides are Ritzy. People tell us our diverging 11 factors round manner ppt Cycle Flow Chart PowerPoint Slides are Glamorous. People tell us our arrow PowerPoint templates and PPT Slides will make you look like a winner. Customers tell us our diverging 11 factors round manner ppt Cycle Flow Chart PowerPoint Slides are Bold. People tell us our arrow PowerPoint templates and PPT Slides are One-of-a-kind.

Chart Depicting New Emerging Markets Share With Advanced Economies Ppt PowerPoint Presentation Gallery Design Ideas PDF
Pitch your topic with ease and precision using this chart depicting new emerging markets share with advanced economies ppt powerpoint presentation gallery design ideas pdf. This layout presents information on chart depicting new emerging markets share with advanced economies. It is also available for immediate download and adjustment. So, changes can be made in the color, design, graphics or any other component to create a unique layout.
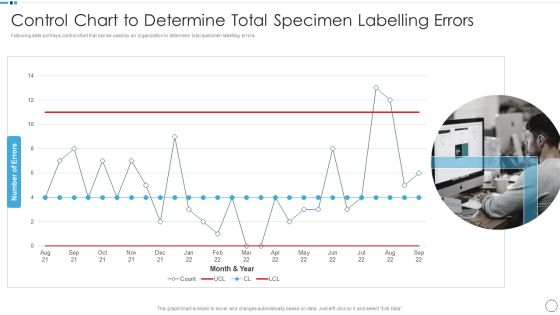
QA Plan Set 1 Control Chart To Determine Total Specimen Labelling Errors Sample PDF
Deliver an awe inspiring pitch with this creative QA Plan Set 1 Control Chart To Determine Total Specimen Labelling Errors Sample PDF bundle. Topics like Control Chart To Determine, Specimen Labelling Errors can be discussed with this completely editable template. It is available for immediate download depending on the needs and requirements of the user.
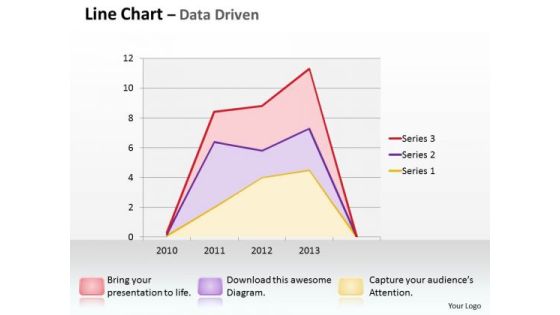
Multivariate Data Analysis Driven Line Chart Shows Revenue Trends PowerPoint Slides Templates
Good Camaraderie Is A Key To Teamwork. Our multivariate data analysis driven line chart shows revenue trends powerpoint slides Templates Can Be A Cementing Force.

Ppt 3d Men Standing On Concept Download Free Pie PowerPoint Template Chart Templates
PPT 3d men standing on concept download free pie powerpoint template chart Templates-Use this 3D Amazing PowerPoint Diagram to illustrate the steps to be followed in Circular Process. It is represented by five colorful stages. This Diagram shows every single stage which can be explained in single slide to make your Presentation Attractive.-PPT 3d men standing on concept download free pie powerpoint template chart Templates-3d, arrow, background, blue, chart, circle, circular, circulation, clipart, colorful, connection, continuity, cut, cycle, cyclic, diagram, direction, empty, flow, graph, green, icon, illustration, isolated, loop, motion, pink, presentation, process, progress, reason, recycle, recycling, repetition, report, result, ring, rotation, round, scheme, section, step, sticker, symbol, teamwork, template, turn, vector

Ppt Green Men Standing On Business Layouts PowerPoint 2003 Download Pie Chart Templates
PPT green men standing on business layouts powerpoint 2003 download pie chart Templates-This PowerPoint Diagram showing Green Man out of Group of people standing on the circular Puzzle process. It signifies the concept of analyze, conceive, conceptualize, conjure up, create, deliberate, dream up, invent, plan, ponder, put heads together, rack brains, share ideas and think.-PPT green men standing on business layouts powerpoint 2003 download pie chart Templates-3d, arrow, background, blue, chart, circle, circular, clipart, colorful, connection, continuity, cycle, cyclic, diagram, direction, flow, graph, icon, illustration, isolated, loop, motion, process, progress, recycle, ring, round, step, sticker, symbol, teamwork, template, turn, vector
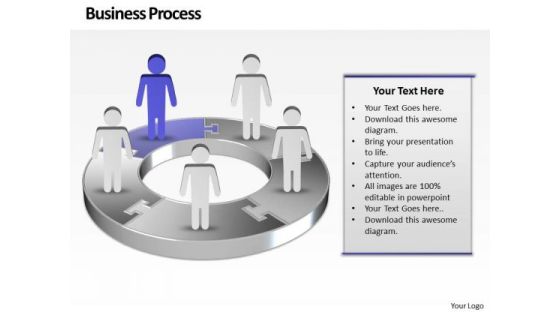
Ppt Purple Men Standing On Free Concept Pie PowerPoint Presentation Chart Templates
PPT purple men standing on free concept pie powerpoint presentation chart Templates-Use this Circular Arrow diagram to show activities that are related to the business plan metrics and monitor the results to determine if the business plan is proceeding as planned.-PPT purple men standing on free concept pie powerpoint presentation chart Templates-3d, arrow, background, blue, chart, circle, circular, clipart, colorful, connection, continuity, cycle, cyclic, diagram, direction, flow, graph, icon, illustration, isolated, loop, motion, process, progress, recycle, ring, round, step, sticker, symbol, teamwork, template, turn, vector

Research And Development Stages Flow Chart For Customer Centric Product Development Mockup PDF
Following slide showcases flow chart for customer requirement based product research and development to increase customer satisfaction. It includes key components such as customers, customer support service team and production team. Persuade your audience using this Research And Development Stages Flow Chart For Customer Centric Product Development Mockup PDF. This PPT design covers three stages, thus making it a great tool to use. It also caters to a variety of topics including Customer, Customer Support Service Team, Production Team. Download this PPT design now to present a convincing pitch that not only emphasizes the topic but also showcases your presentation skills.
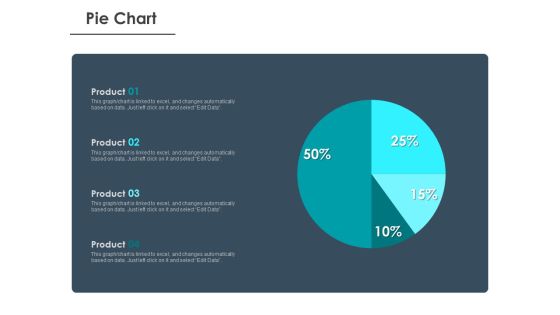
Strategic Plan For Companys Development Pie Chart Ppt PowerPoint Presentation Show Templates
Presenting this set of slides with name strategic plan for companys development pie chart ppt powerpoint presentation show templates. The topics discussed in these slide is pie chart. This is a completely editable PowerPoint presentation and is available for immediate download. Download now and impress your audience.

Business Circle Chart PowerPoint Templates Business Market Research Data Ppt Slides
Business Circle Chart PowerPoint Templates Business market research data PPT Slides-\nThis PowerPoint diagram slide shows a circular process withan arrow. Useful to represent process slides-Business Circle Chart PowerPoint Templates Business market research data PPT Slides-This template can be used for presentations relating to 3d, Abstract, Around, Arrow, Background, Bright, Business, Card, Chart, Circle, Circular, Circulation, Collection, Colorful, Communication, Concept, Cycle, Cyclic, Design, Direction, Element, Flow, Glass, Glossy, Graphic, Icon, Illustration, Modern, Motion, Network

Business Chart PowerPoint Templates Business 3d Double Concentric Rings Pieces Ppt Slides
Business Chart PowerPoint Templates Business 3d double concentric rings pieces PPT Slides-Use this diagram to explain the contribution of each of the elements and how they provide impetus to the next phase. Highlight any anticipated problems, shortfalls or weak areas-Business Chart PowerPoint Templates Business 3d double concentric rings pieces PPT Slides-This ppt can be used for concepts relating to-3d, Abstract, Account, Achievement, Analyst, Annual, Background, Blue, Business, Capital, Chart, Circular, Conceptual, Data, Design, Diagram, Document, Earnings, Economic, Finance, Financial, Forecast, Icon, Illustration
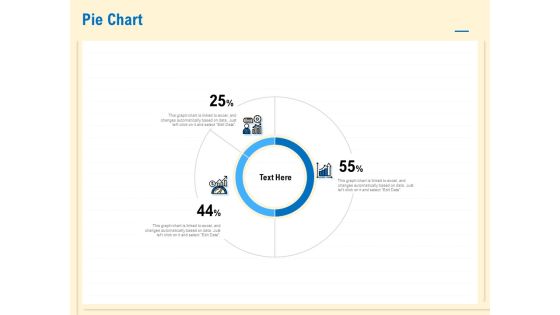
Prioritization Techniques For Software Development And Testing Pie Chart Template PDF
Presenting this set of slides with name prioritization techniques for software development and testing pie chart template pdf. The topics discussed in these slide is pie chart. This is a completely editable PowerPoint presentation and is available for immediate download. Download now and impress your audience.

Velocity Chart With Lower And Upper Control Limit Ppt PowerPoint Presentation Gallery Infographics PDF
Pitch your topic with ease and precision using this velocity chart with lower and upper control limit ppt powerpoint presentation gallery infographics pdf. This layout presents information on velocity chart with lower and upper control limit. It is also available for immediate download and adjustment. So, changes can be made in the color, design, graphics or any other component to create a unique layout.
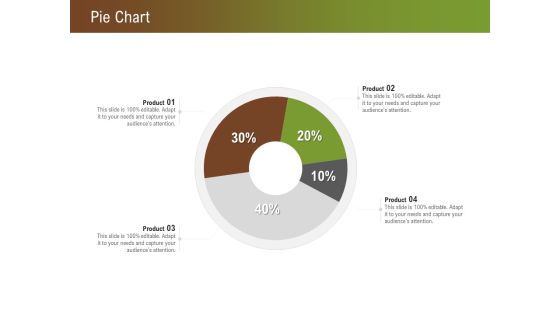
Steps For Successful Brand Building Process Pie Chart Ppt Inspiration Demonstration PDF
Presenting this set of slides with name steps for successful brand building process pie chart ppt inspiration demonstration pdf. The topics discussed in these slide is pie chart. This is a completely editable PowerPoint presentation and is available for immediate download. Download now and impress your audience.
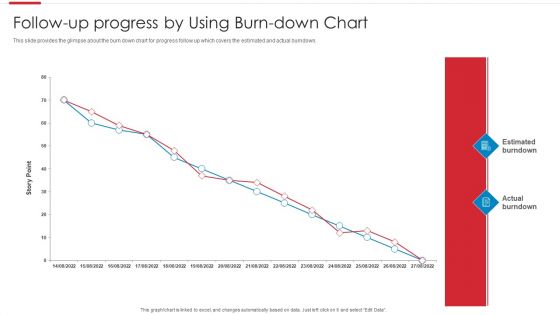
Agile Software Development Process Follow Up Progress By Using Burn Down Chart Slides PDF
This slide provides the glimpse about the burn down chart for progress follow up which covers the estimated and actual burndown. Deliver an awe inspiring pitch with this creative Agile Software Development Process Follow Up Progress By Using Burn Down Chart Slides PDF bundle. Topics like Estimated Burndown, Actual Burndown can be discussed with this completely editable template. It is available for immediate download depending on the needs and requirements of the user.

Clustered Bar Chart Percentage Product Ppt PowerPoint Presentation Portfolio Example Introduction
This is a clustered bar chart percentage product ppt powerpoint presentation portfolio example introduction. This is a three stage process. The stages in this process are area chart, finance, marketing, management, investment.
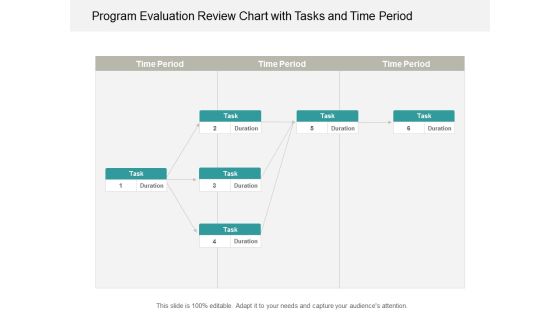
Program Evaluation Review Chart With Tasks And Time Period Ppt Powerpoint Presentation Portfolio Infographic Template
This is a program evaluation review chart with tasks and time period ppt powerpoint presentation portfolio infographic template. This is a six stage process. The stages in this process are pert chart, program evaluation and review technique, pert graph.
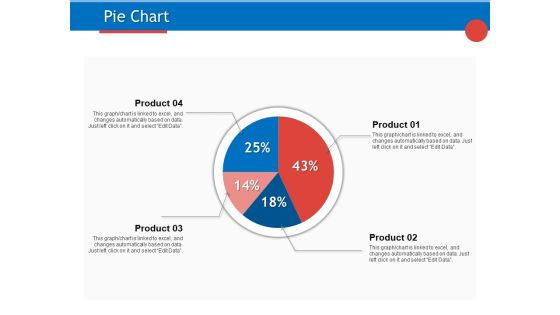
Developing Product Planning Strategies Pie Chart Ppt PowerPoint Presentation Gallery Styles PDF
Presenting this set of slides with name developing product planning strategies pie chart ppt powerpoint presentation gallery styles pdf. The topics discussed in these slide is pie chart. This is a completely editable PowerPoint presentation and is available for immediate download. Download now and impress your audience.
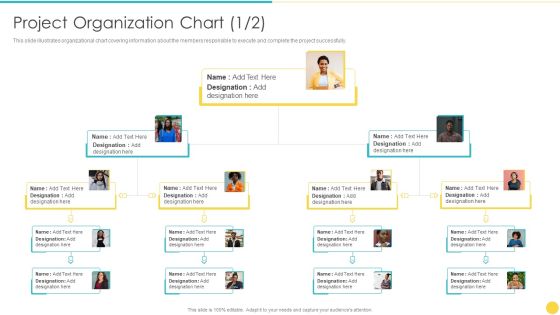
Project Management Professional Toolset IT Project Organization Chart Execute Introduction PDF
Following slide portrays organizational chart covering information about the members responsible to execute and complete the project successfully. Presenting project management professional toolset it project organization chart execute introduction pdf to provide visual cues and insights. Share and navigate important information on two stages that need your due attention. This template can be used to pitch topics like project organization chart. In addtion, this PPT design contains high resolution images, graphics, etc, that are easily editable and available for immediate download.

Determine Burndown Chart For Daily Progress Reporting Developing Fixed Bid Projects Using Agile IT Background PDF
This slide provides information regarding release burndown chart as scrum tool for monitoring scrum project progress. Deliver and pitch your topic in the best possible manner with this determine burndown chart for daily progress reporting developing fixed bid projects using agile it background pdf. Use them to share invaluable insights on monitoring, development and impress your audience. This template can be altered and modified as per your expectations. So, grab it now.

Bar Chart Showing Quarterly Business Sales Ppt PowerPoint Presentation Model Icon
Presenting this set of slides with name bar chart showing quarterly business sales ppt powerpoint presentation model icon. The topics discussed in these slides are revenue trend, bar chart, financial. This is a completely editable PowerPoint presentation and is available for immediate download. Download now and impress your audience.
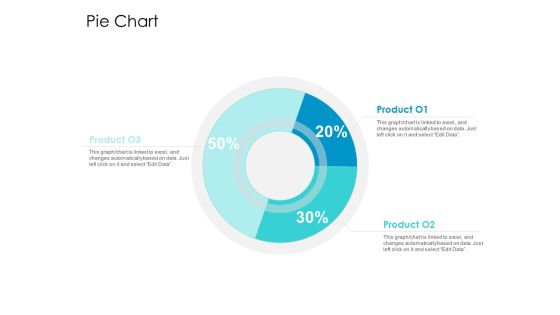
Developing New Sales And Marketing Strategic Approach Pie Chart Ppt PowerPoint Presentation Professional Example PDF
Presenting this set of slides with name developing new sales and marketing strategic approach pie chart ppt powerpoint presentation professional example pdf. The topics discussed in these slide is pie chart. This is a completely editable PowerPoint presentation and is available for immediate download. Download now and impress your audience.

Developing And Creating Corner Market Place Column Chart Ppt PowerPoint Presentation Infographics Brochure PDF
Presenting this set of slides with name developing and creating corner market place column chart ppt powerpoint presentation infographics brochure pdf. The topics discussed in these slide is column chart. This is a completely editable PowerPoint presentation and is available for immediate download. Download now and impress your audience.
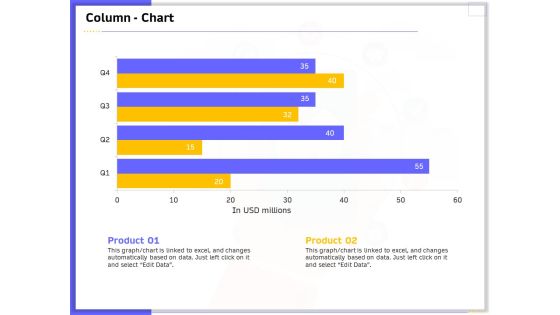
Developing And Deploying Android Applications Column Chart Ppt Show Guide PDF
Presenting this set of slides with name developing and deploying android applications column chart ppt show guide pdf. The topics discussed in these slide is column chart. This is a completely editable PowerPoint presentation and is available for immediate download. Download now and impress your audience.

Android Framework For Apps Development And Deployment Area Chart Ppt PowerPoint Presentation Layouts Graphics Pictures PDF
Presenting this set of slides with name android framework for apps development and deployment area chart ppt powerpoint presentation layouts graphics pictures pdf. The topics discussed in these slide is area chart. This is a completely editable PowerPoint presentation and is available for immediate download. Download now and impress your audience.

Android Framework For Apps Development And Deployment Column Chart Ppt PowerPoint Presentation Professional Format Ideas PDF
Presenting this set of slides with name android framework for apps development and deployment column chart ppt powerpoint presentation professional format ideas pdf. The topics discussed in these slide is column chart. This is a completely editable PowerPoint presentation and is available for immediate download. Download now and impress your audience.
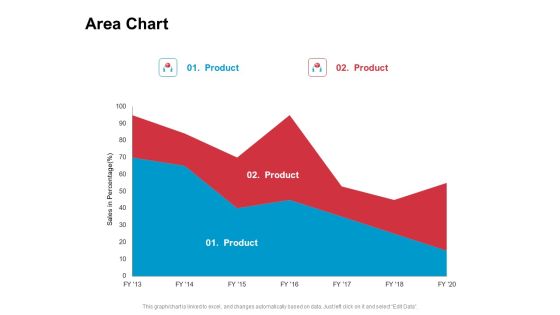
New Product Development Performance Evaluation Area Chart Ppt PowerPoint Presentation Show PDF
Presenting this set of slides with name new product development performance evaluation area chart ppt powerpoint presentation show pdf. The topics discussed in these slide is area chart. This is a completely editable PowerPoint presentation and is available for immediate download. Download now and impress your audience.

New Product Development Performance Evaluation Column Chart Ppt PowerPoint Presentation Show Example Topics PDF
Presenting this set of slides with name new product development performance evaluation column chart ppt powerpoint presentation show example topics pdf. The topics discussed in these slide is column chart. This is a completely editable PowerPoint presentation and is available for immediate download. Download now and impress your audience.
Project Task Planning And Evaluation Chart Ppt Powerpoint Presentation Icon Slide
This is a project task planning and evaluation chart ppt powerpoint presentation icon slide. This is a nine stage process. The stages in this process are pert chart, program evaluation and review technique, pert graph.

Business Circle Chart PowerPoint Templates Success Lego Blocks Flowchart Ppt Slides
Business Circle Chart PowerPoint Templates Success Lego Blocks Flowchart PPT Slides-This PowerPoint diagram shows a circular process with 2 arrows. Useful to represent process slides-Business Circle Chart PowerPoint Templates Success Lego Blocks Flowchart PPT Slides-This template can be used for presentations relating to Activity, Background, Block, Box, Brick, Build, Buildings, Child, Childhood, Colourful, Concept, Connect, Connection, Construction, Cube, Design, Development, Education, Element, Fun, Game, Geometric

Connecting Factors Diverging Arrow Diagram Ppt Circular Flow Chart PowerPoint Slides
We present our connecting factors diverging arrow diagram ppt Circular Flow Chart PowerPoint Slides.Present our Circle Charts PowerPoint Templates because you can Educate your listeners on the means to keep it ticking over. Download and present our Flow Charts PowerPoint Templates because Our PowerPoint Templates and Slides will let you meet your Deadlines. Download our Business PowerPoint Templates because you have had a great year or so business wise. It is time to celebrate the efforts of your team. Download our Shapes PowerPoint Templates because all for one and one for all. Download our Success PowerPoint Templates because you have come up with a brilliant breakthrough idea. you can also visualise the interest it will generate.Use these PowerPoint slides for presentations relating to Access, Arrow, Business, Concept, Conceptual, Connection, Corporate, Creative, Cycle, Design, Different, Empty, Graphic, Idea, Illustration, Process, Shape, Solution, Strategy, Symbol, Template. The prominent colors used in the PowerPoint template are Pink, White, Black. People tell us our connecting factors diverging arrow diagram ppt Circular Flow Chart PowerPoint Slides are Swanky. Use our Creative PowerPoint templates and PPT Slides are Graceful. Professionals tell us our connecting factors diverging arrow diagram ppt Circular Flow Chart PowerPoint Slides are Quaint. Presenters tell us our Business PowerPoint templates and PPT Slides are Amazing. Professionals tell us our connecting factors diverging arrow diagram ppt Circular Flow Chart PowerPoint Slides are Bright. PowerPoint presentation experts tell us our Business PowerPoint templates and PPT Slides are Nostalgic.
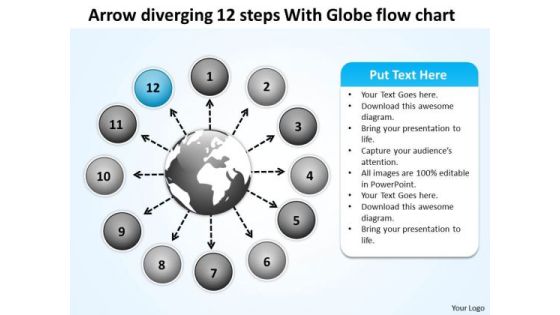
Arrow Diverging 12 Steps With Globe Flow Chart Circular PowerPoint Templates
We present our arrow diverging 12 steps with globe flow chart Circular PowerPoint templates.Download and present our Circle Charts PowerPoint Templates because you can Trigger audience minds with your interesting ideas. Download our Arrows PowerPoint Templates because the majestic tiger lord of all it surveys.It exudes power even when it is in repose. Use our Globe PowerPoint Templates because with the help of our Slides you can Illustrate how each element flows seamlessly onto the next stage. Present our Business PowerPoint Templates because you have analysed many global markets and come up with possibilities. Highlight the pros and cons of other likely business oppurtunities. Present our Flow Charts PowerPoint Templates because this Layout helps you to expand your plans to overcome obstacles and reassure the team that they shall continue to roll along merrily.Use these PowerPoint slides for presentations relating to 3d, abstract, aim, arrow, background, business, career, chart, circle, color, concept, creative, curve, design, development, direction, financial, flowing, gain, graph, green, group, growth, higher, illustration, increase, isolated, motion, moving, moving up, path, prediction, progress, red, series, shape, sign, success, symbol, target, turn, twisted, up, upload, upward, way, white, win. The prominent colors used in the PowerPoint template are Blue, Gray, White. PowerPoint presentation experts tell us our arrow diverging 12 steps with globe flow chart Circular PowerPoint templates are visually appealing. PowerPoint presentation experts tell us our background PowerPoint templates and PPT Slides are Ritzy. Presenters tell us our arrow diverging 12 steps with globe flow chart Circular PowerPoint templates are Amazing. Presenters tell us our aim PowerPoint templates and PPT Slides are Striking. You can be sure our arrow diverging 12 steps with globe flow chart Circular PowerPoint templates are Fun. We assure you our chart PowerPoint templates and PPT Slides are Swanky.
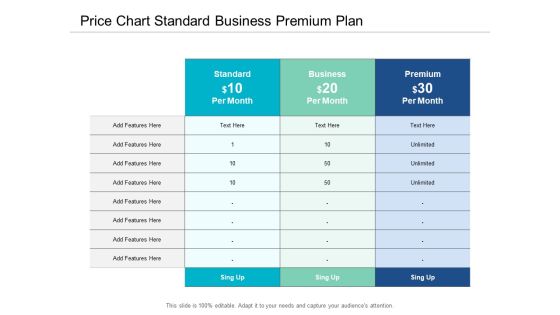
Price Chart Standard Business Premium Plan Ppt Powerpoint Presentation Visual Aids Infographic Template
This is a price chart standard business premium plan ppt powerpoint presentation visual aids infographic template. This is a three stage process. The stages in this process are comparison chart, comparison table, comparison matrix.

Program Evaluation Chart From Start To Finish Ppt Powerpoint Presentation Professional Examples
This is a program evaluation chart from start to finish ppt powerpoint presentation professional examples. This is a three stage process. The stages in this process are pert chart, program evaluation and review technique, pert graph.
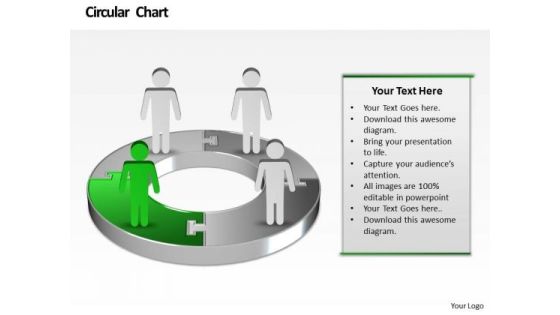
Ppt Business Men Standing Onl Pie Chart Birthday Presentation PowerPoint Templates
PPT business men standing onl pie chart birthday presentation powerpoint Templates-Develop competitive advantage with our above template which contains a diagram of one pie chart with cartoon men on it.This structure of our templates allows you to effectively highlight the key issues concerning to your business.-PPT business men standing onl pie chart birthday presentation powerpoint Templates-Arrows, Background, Business, Chart, Circle, Circular, Financial, Flow, Graphic, Gray, Icon, Illustration, Isometric, Perspective, Process, Recycle, Round, Shape, Flow, Marketing, Leadership, Steps
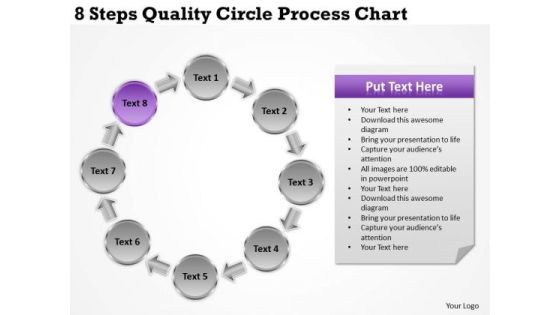
Business Strategy Consultant 8 Steps Quality Circle Process Chart Ppt Growth
We present our business strategy consultant 8 steps quality circle process chart ppt growth.Use our Flow Charts PowerPoint Templates because It can Conjure up grand ideas with our magical PowerPoint Templates and Slides. Leave everyone awestruck by the end of your presentation. Use our Business PowerPoint Templates because You can Be the puppeteer with our PowerPoint Templates and Slides as your strings. Lead your team through the steps of your script. Use our Process and Flows PowerPoint Templates because You can Zap them with our PowerPoint Templates and Slides. See them reel under the impact. Download and present our Circle Charts PowerPoint Templates because Our PowerPoint Templates and Slides provide you with a vast range of viable options. Select the appropriate ones and just fill in your text. Use our Shapes PowerPoint Templates because You are well armed with penetrative ideas. Our PowerPoint Templates and Slides will provide the gunpowder you need.Use these PowerPoint slides for presentations relating to Act, arrow, blue, business, chart, check, circle, concept, control, cycle, design, development, diagram, do, engineering, evaluate, flow, flow-chart, flowchart, graphic, green, idea, info graphic, iterative, life-cycle, lifecycle, management, method, model, process, quality, research, schema, software, spiral, step, strategy, success, system, vector, white, work, workflow. The prominent colors used in the PowerPoint template are Purple, Gray, White.
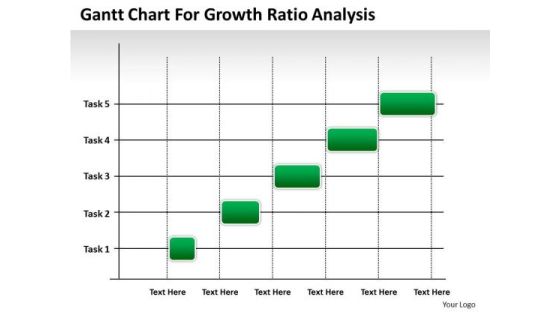
Consulting PowerPoint Template Gantt Chart For Growth Ratio Analysis Ppt Templates
Reduce the drag with our consulting PowerPoint template gantt chart for growth ratio analysis ppt templates. Give more lift to your thoughts. Your thoughts will make a dramatic entry. Write the script on our Org Charts PowerPoint Templates. Our Advertising PowerPoint Templates enjoy drama. They provide entertaining backdrops.

Column Chart Template 2 Ppt PowerPoint Presentation Infographic Template Example Introduction
This is a column chart template 2 ppt powerpoint presentation infographic template example introduction. This is a two stage process. The stages in this process are column chart, finance, analysis, marketing, strategy.
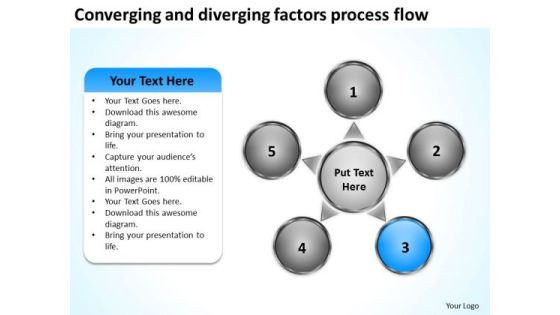
And Diverging Factors Process Flow Chart Relative Circular Arrow Network PowerPoint Templates
We present our and diverging factors process flow chart Relative Circular Arrow Network PowerPoint templates.Present our Business PowerPoint Templates because you are ready to flap your wings and launch off. All poised are you to touch the sky with glory. Download and present our Process and Flows PowerPoint Templates because you have a good idea of the roadmap to your desired destination. Download and present our Marketing PowerPoint Templates because networking is an imperative in todays world. You need to access the views of others. Similarly you need to give access to them of your abilities. Download our Circle Charts PowerPoint Templates because presenting your views using our innovative slides, will be assured of leaving a lasting impression. Present our Flow Charts PowerPoint Templates because honesty is the best policy has an ardent follower in you.Use these PowerPoint slides for presentations relating to Achievement, Aim, Arrow, Business, Chart, Communication, Diagram, Direction, Graphic, Growth, Guide, Increase, Marketing, Presentation, Shape, Sign, Success, Target, Team, Teamwork. The prominent colors used in the PowerPoint template are Blue, White, Gray. People tell us our and diverging factors process flow chart Relative Circular Arrow Network PowerPoint templates will help them to explain complicated concepts. Use our Diagram PowerPoint templates and PPT Slides are Liberated. Professionals tell us our and diverging factors process flow chart Relative Circular Arrow Network PowerPoint templates are Functional. Presenters tell us our Communication PowerPoint templates and PPT Slides are Delightful. Professionals tell us our and diverging factors process flow chart Relative Circular Arrow Network PowerPoint templates look good visually. PowerPoint presentation experts tell us our Diagram PowerPoint templates and PPT Slides will help them to explain complicated concepts.
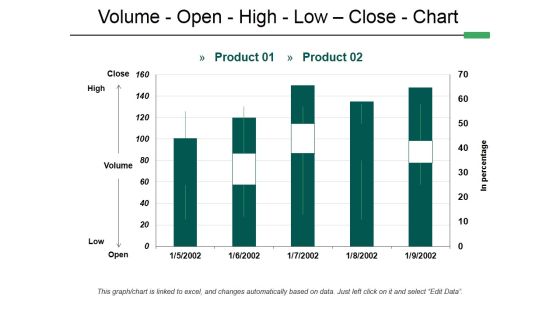
Volume Open High Low Close Chart Ppt PowerPoint Presentation Infographic Template Guidelines
This is a volume open high low close chart ppt powerpoint presentation infographic template guidelines. This is a two stage process. The stages in this process are volume, open, high, low, close, chart.

Area Chart Finance Marketing Ppt PowerPoint Presentation Infographic Template Master Slide
This is a area chart finance marketing ppt powerpoint presentation infographic template master slide. This is a three stage process. The stages in this process are area chart, finance, marketing, analysis, investment.
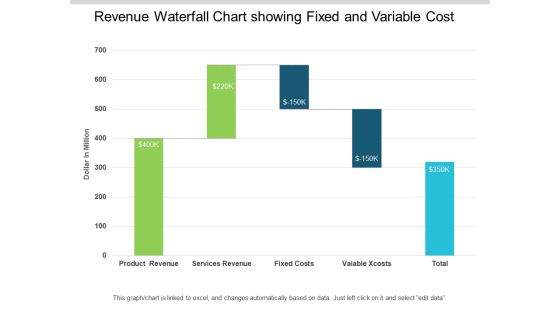
Revenue Waterfall Chart Showing Fixed And Variable Cost Ppt PowerPoint Presentation Infographic Template Images
This is a revenue waterfall chart showing fixed and variable cost ppt powerpoint presentation infographic template images. This is a five stage process. The stages in this process are sales waterfall, waterfall chart, business.

Service Strategy And Service Lifecycle Implementation Bar Chart Ppt Outline Show PDF
Presenting this set of slides with name service strategy and service lifecycle implementation bar chart ppt outline show pdf. The topics discussed in these slide is bar chart. This is a completely editable PowerPoint presentation and is available for immediate download. Download now and impress your audience.
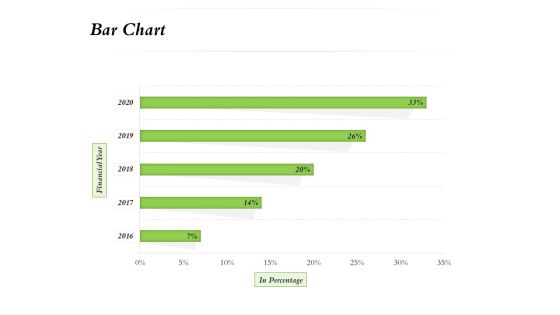
Select Of Organizational Model That Supports Your Strategy Bar Chart Ppt Outline Structure PDF
Presenting this set of slides with name select of organizational model that supports your strategy bar chart ppt outline structure pdf. The topics discussed in these slide is bar chart. This is a completely editable PowerPoint presentation and is available for immediate download. Download now and impress your audience.

Business Bar Chart With Percentage Analysis Ppt PowerPoint Presentation File Outline PDF
Presenting this set of slides with name business bar chart with percentage analysis ppt powerpoint presentation file outline pdf. The topics discussed in these slide is business bar chart with percentage analysis. This is a completely editable PowerPoint presentation and is available for immediate download. Download now and impress your audience.

9 Steps Diverging Concepts Leading To One Issue Cycle Chart PowerPoint Templates
We present our 9 steps diverging concepts leading to one issue Cycle Chart PowerPoint templates.Download and present our Process and flows PowerPoint Templates because your group can behave steady in the top bracket. Present our Shapes PowerPoint Templates because it gives a core idea about various enveloping layers. Download and present our Circle charts PowerPoint Templates because this outlines the path you have in mind in order to boost sales and stay ahead of the competition enhancing your corporate reputation as you go along the road to success. Present our Signs PowerPoint Templates because our template will help pinpoint their viability. Present our Ring charts PowerPoint Templates because this diagram depicts the essence of this chain reaction like sequence of events.Use these PowerPoint slides for presentations relating to Arrows, business, chart, circle, company, concept, continuity, continuous, cycle, dependency, diagram, direction, dynamic, endless, feeds, graph, iteration, iterative, method, path, phase, presentation, process, production, progress, progression, report, rotation, sequence, succession. The prominent colors used in the PowerPoint template are Orange, Gray, White. You can be sure our 9 steps diverging concepts leading to one issue Cycle Chart PowerPoint templates are Clever. Presenters tell us our cycle PowerPoint templates and PPT Slides are Versatile. We assure you our 9 steps diverging concepts leading to one issue Cycle Chart PowerPoint templates are Striking. Customers tell us our continuous PowerPoint templates and PPT Slides are Energetic. Presenters tell us our 9 steps diverging concepts leading to one issue Cycle Chart PowerPoint templates are Versatile. You can be sure our chart PowerPoint templates and PPT Slides will make the presenter successul in his career/life.
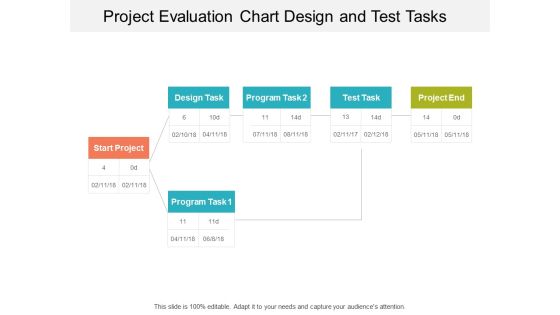
Project Evaluation Chart Design And Test Tasks Ppt Powerpoint Presentation Show Graphics Design
This is a project evaluation chart design and test tasks ppt powerpoint presentation show graphics design. This is a three stage process. The stages in this process are pert chart, program evaluation and review technique, pert graph.
Waterfall Chart Showing Effective Pricing And Profitability Insight Ppt PowerPoint Presentation Icon Graphics
This is a waterfall chart showing effective pricing and profitability insight ppt powerpoint presentation icon graphics. This is a seven stage process. The stages in this process are sales waterfall, waterfall chart, business.

Volume Open High Low Close Chart Ppt PowerPoint Presentation Pictures Slideshow
This is a volume open high low close chart ppt powerpoint presentation pictures slideshow. This is a two stage process. The stages in this process are volume, open, high, low, close, chart.

Product Features And Competitors Chart Ppt Powerpoint Presentation Slides Graphics Design
This is a product features and competitors chart ppt powerpoint presentation slides graphics design. This is a three stage process. The stages in this process are comparison chart, comparison table, comparison matrix.
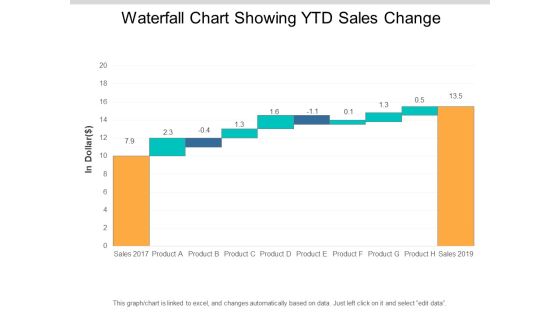
Waterfall Chart Showing Ytd Sales Change Ppt PowerPoint Presentation Professional Format
This is a waterfall chart showing ytd sales change ppt powerpoint presentation professional format. This is a ten stage process. The stages in this process are sales waterfall, waterfall chart, business.

Waterfall Chart With Merchandising Sales Cost And Net Revenue Ppt PowerPoint Presentation Summary Show
This is a waterfall chart with merchandising sales cost and net revenue ppt powerpoint presentation summary show. This is a three stage process. The stages in this process are sales waterfall, waterfall chart, business.

Waterfall Chart With Sales Overheads Interest And Depreciation Ppt PowerPoint Presentation File Display
This is a waterfall chart with sales overheads interest and depreciation ppt powerpoint presentation file display. This is a eight stage process. The stages in this process are sales waterfall, waterfall chart, business.

Chart Highlighting User Time Spending On Social Media By Age Categories Elements PDF
Showcasing this set of slides titled Chart Highlighting User Time Spending On Social Media By Age Categories Elements PDF. The topics addressed in these templates are Chart Highlighting User, Time Spending Social Media, Age Categories. All the content presented in this PPT design is completely editable. Download it and make adjustments in color, background, font etc. as per your unique business setting.

Real Estate Property Management System Real Estate Home Sales Chart Ppt Ideas Graphics Example PDF
Deliver and pitch your topic in the best possible manner with this real estate property management system real estate home sales chart ppt ideas graphics example pdf. Use them to share invaluable insights on real estate home sales chart and impress your audience. This template can be altered and modified as per your expectations. So, grab it now.
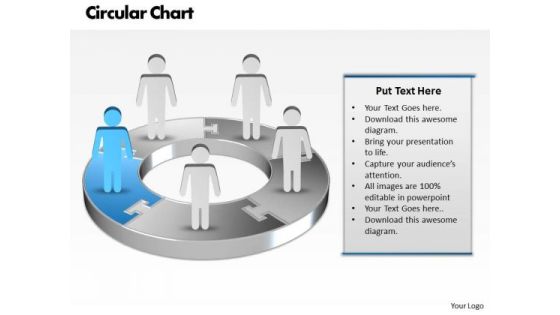
Ppt Blue Men Standing On Business Pie Organization Chart PowerPoint Template Templates
PPT blue men standing on business pie organization chart powerpoint template Templates-Use this Business based PowerPoint Diagram to represent the Business issues Graphically. It indicates arrange, block out, blueprint, cast, delineate, design, devise, draft, graph , lay out, outline, plot, project, shape, sketch etc.-PPT blue men standing on business pie organization chart powerpoint template Templates-arrow, art, basic, blank, business, capital, chart, chevron, clip, clipart, colorful, conglomerates, consumer, copy, cyclical, energy, financial, flow, goods, graph, graphic, healthcare, illustration, infographic, information, investment, isolated, market, materials, non, round, sectors, services, slide, space, stock, technology, text,
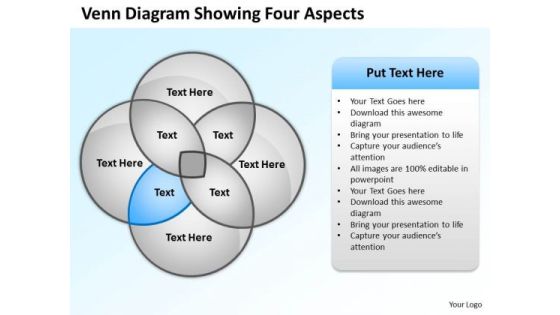
Business Organizational Chart Template Venn Diagram Showing Four Aspects PowerPoint Slides
We present our business organizational chart template venn diagram showing four aspects PowerPoint Slides.Use our Ring Charts PowerPoint Templates because Your audience will believe you are the cats whiskers. Download our Circle Charts PowerPoint Templates because You are well armed with penetrative ideas. Our PowerPoint Templates and Slides will provide the gunpowder you need. Download and present our Process and Flows PowerPoint Templates because They will Put your wonderful verbal artistry on display. Our PowerPoint Templates and Slides will provide you the necessary glam and glitter. Download and present our Flow Charts PowerPoint Templates because Our PowerPoint Templates and Slides help you meet the demand of the Market. Just browse and pick the slides that appeal to your intuitive senses. Download our Business PowerPoint Templates because Our PowerPoint Templates and Slides will let you Illuminate the road ahead to Pinpoint the important landmarks along the way.Use these PowerPoint slides for presentations relating to Business, button, catalog, chart, circle, company, cross, data, design, diagram, direction, document, financial, four, glossy, goals, graph, junction, management, market, marketing, model, multicolored, multiple, navigation, network, options, plan, presentation, process, purple, results, shiny, sphere, statistics. The prominent colors used in the PowerPoint template are Blue light, White, Gray. People tell us our business organizational chart template venn diagram showing four aspects PowerPoint Slides are effectively colour coded to prioritise your plans They automatically highlight the sequence of events you desire. PowerPoint presentation experts tell us our data PowerPoint templates and PPT Slides will impress their bosses and teams. Presenters tell us our business organizational chart template venn diagram showing four aspects PowerPoint Slides will generate and maintain the level of interest you desire. They will create the impression you want to imprint on your audience. Use our data PowerPoint templates and PPT Slides are effectively colour coded to prioritise your plans They automatically highlight the sequence of events you desire. Customers tell us our business organizational chart template venn diagram showing four aspects PowerPoint Slides are specially created by a professional team with vast experience. They diligently strive to come up with the right vehicle for your brilliant Ideas. People tell us our chart PowerPoint templates and PPT Slides are incredible easy to use.

Delivery Excellence Chart With Source Of Variance Ppt PowerPoint Presentation Outline Backgrounds PDF
Showcasing this set of slides titled delivery excellence chart with source of variance ppt powerpoint presentation outline backgrounds pdf. The topics addressed in these templates are delivery excellence chart with source of variance. All the content presented in this PPT design is completely editable. Download it and make adjustments in color, background, font etc. as per your unique business setting.

Converging And Diverging Factors Process Flow Ppt Target Chart PowerPoint Templates
We present our converging and diverging factors process flow ppt Target Chart PowerPoint templates.Use our Business PowerPoint Templates because it helps you to explain your plans in all earnest to your colleagues and raise the bar for all. Use our Process and Flows PowerPoint Templates because they will Amplify your thoughts via our appropriate templates. Download and present our Marketing PowerPoint Templates because networking is an imperative in todays world. You need to access the views of others. Similarly you need to give access to them of your abilities. Download and present our Circle Charts PowerPoint Templates because this PPt slide highlights any anticipated problems, shortfalls or weak areas. Download and present our Flow Charts PowerPoint Templates because you can illustrate your ideas and imprint them in the minds of your team with this template.Use these PowerPoint slides for presentations relating to Achievement, Aim, Arrow, Business, Chart, Communication, Diagram, Direction, Graphic, Growth, Guide, Increase, Marketing, Presentation, Shape, Sign, Success, Target, Team, Teamwork. The prominent colors used in the PowerPoint template are Red, Gray, White. People tell us our converging and diverging factors process flow ppt Target Chart PowerPoint templates are No-nonsense. Use our Arrow PowerPoint templates and PPT Slides provide you with a vast range of viable options. Select the appropriate ones and just fill in your text. Professionals tell us our converging and diverging factors process flow ppt Target Chart PowerPoint templates are Fabulous. Presenters tell us our Graphic PowerPoint templates and PPT Slides are Bold. Professionals tell us our converging and diverging factors process flow ppt Target Chart PowerPoint templates are Exuberant. PowerPoint presentation experts tell us our Arrow PowerPoint templates and PPT Slides will make the presenter look like a pro even if they are not computer savvy.

Designing Compensation Systems For Professionals Bubble Chart Ppt Infographics Files PDF
Presenting this set of slides with name designing compensation systems for professionals bubble chart ppt infographics files pdf. The topics discussed in these slide is bubble chart. This is a completely editable PowerPoint presentation and is available for immediate download. Download now and impress your audience.

Designing Compensation Systems For Professionals Combo Chart Ppt Portfolio Backgrounds PDF
Presenting this set of slides with name designing compensation systems for professionals combo chart ppt portfolio backgrounds pdf. The topics discussed in these slide is combo chart. This is a completely editable PowerPoint presentation and is available for immediate download. Download now and impress your audience.

Designing Compensation Systems For Professionals Volume Open High Low Close Chart Introduction PDF
Presenting this set of slides with name designing compensation systems for professionals volume open high low close chart introduction pdf. The topics discussed in these slide is volume open high low close chart. This is a completely editable PowerPoint presentation and is available for immediate download. Download now and impress your audience.
 Home
Home