Improvement Chart

Business Evolution Chart Ppt PowerPoint Presentation Inspiration Graphics Tutorials
This is a business evolution chart ppt powerpoint presentation inspiration graphics tutorials. This is a three stage process. The stages in this process are marketing, business, management, planning, strategy.

Consulting Diagram Dashboard Business Information Chart Business Diagram
Get The Domestics Right With Our Consulting Diagram Dashboard Business Information Chart Business Diagram Powerpoint Templates. Create The Base For Thoughts To Grow.
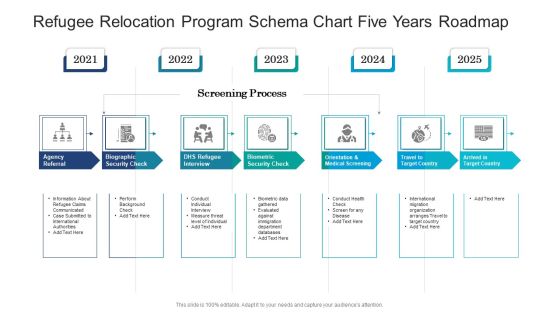
Refugee Relocation Program Schema Chart Five Years Roadmap Introduction
Presenting our innovatively structured refugee relocation program schema chart five years roadmap introduction Template. Showcase your roadmap process in different formats like PDF, PNG, and JPG by clicking the download button below. This PPT design is available in both Standard Screen and Widescreen aspect ratios. It can also be easily personalized and presented with modified font size, font type, color, and shapes to measure your progress in a clear way.
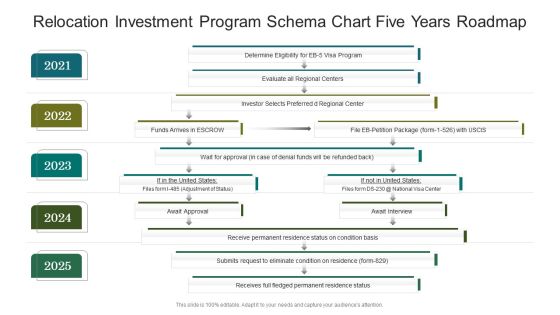
Relocation Investment Program Schema Chart Five Years Roadmap Portrait
Presenting our innovatively structured relocation investment program schema chart five years roadmap portrait Template. Showcase your roadmap process in different formats like PDF, PNG, and JPG by clicking the download button below. This PPT design is available in both Standard Screen and Widescreen aspect ratios. It can also be easily personalized and presented with modified font size, font type, color, and shapes to measure your progress in a clear way.

Business Framework Model Three Way System Circular Chart Strategy Diagram
Document The Process On Our Business Framework Model Three Way System Circular Chart Strategy Diagram Powerpoint Templates. Make A Record Of Every Detail.

Stock Photo Pie Chart And Bar Graph PowerPoint Template
Put In A Dollop Of Our stock photo Pie Chart And Bar Graph powerpoint template Powerpoint Templates. Give Your Thoughts A Distinctive Flavor.
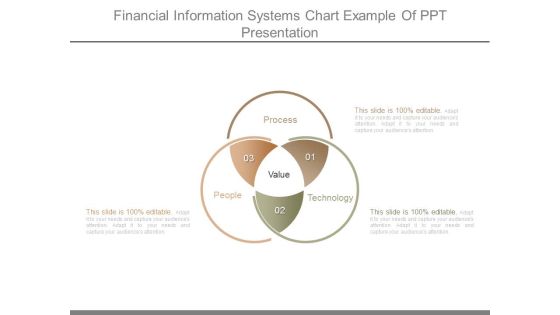
Financial Information Systems Chart Example Of Ppt Presentation
This is a financial information systems chart example of ppt presentation. This is a three stage process. The stages in this process are process, people, value, technology.
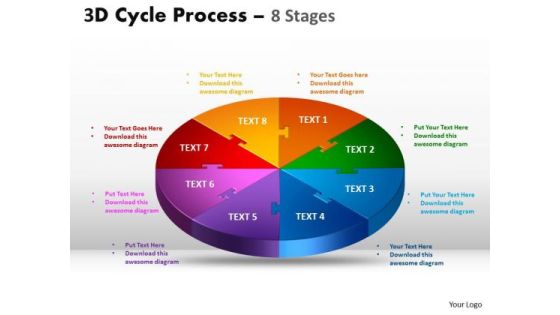
Strategic Management 3d Flow Chart Diagram Style Business Cycle Diagram
Get The Domestics Right With Our Strategic Management 3D Flow Chart Diagram Style Business Cycle Diagram Powerpoint Templates. Create The Base For Thoughts To Grow.
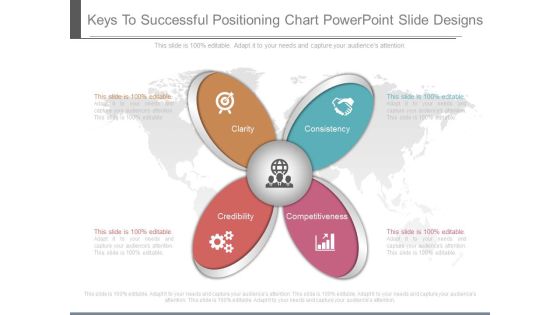
Keys To Successful Positioning Chart Powerpoint Slide Designs
This is a keys to successful positioning chart powerpoint slide designs. This is a four stage process. The stages in this process are clarity, consistency, credibility, competitiveness.

Growth Timeline Chart PowerPoint Slides And Time Ppt Templates
Growth Timeline Chart PowerPoint Slides and Time PPT TemplatesThese high quality powerpoint pre-designed slides and powerpoint templates have been carefully created by our professional team to help you impress your audience. All slides have been created and are 100% editable in powerpoint. Each and every property of any graphic - color, size, orientation, shading, outline etc. can be modified to help you build an effective powerpoint presentation. Any text can be entered at any point in the powerpoint template or slide. Simply DOWNLOAD, TYPE and PRESENT!
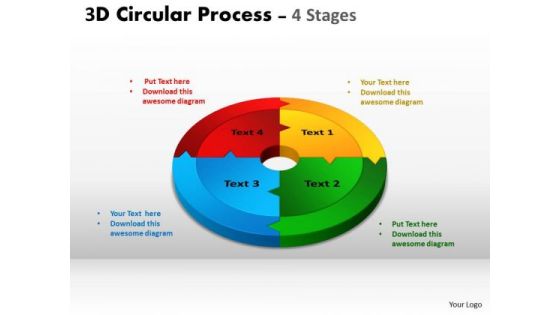
Strategic Management 3d Chart Ppt Templates Business Diagram
Get The Domestics Right With Our Strategic Management 3D Chart ppt Templates Business Diagram Powerpoint Templates. Create The Base For Thoughts To Grow.

Business Diagram Pie Chart Showing Percentages Presentation Template
This image slide displays business consulting diagram of pie chart showing percentage. Pie Charts can be used to display a wide variety of information. When data is represented in the form of a pie chart the human eye finds it very easy to compare the data and quickly draw conclusions. In short they are a great visual aid and will add a touch of professionalism to any presentation which requires the display of data.

Donut Pie Chart Ppt PowerPoint Presentation Model Outline
This is a donut pie chart ppt powerpoint presentation model outline. This is a four stage process. The stages in this process are percentage, product, business.

Five Years Relocation Schema Chart Roadmap For Permanent Residence Graphics
Presenting our innovatively structured five years relocation schema chart roadmap for permanent residence graphics Template. Showcase your roadmap process in different formats like PDF, PNG, and JPG by clicking the download button below. This PPT design is available in both Standard Screen and Widescreen aspect ratios. It can also be easily personalized and presented with modified font size, font type, color, and shapes to measure your progress in a clear way.
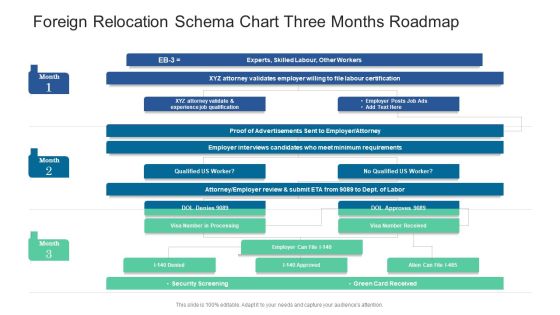
Foreign Relocation Schema Chart Three Months Roadmap Topics
Presenting our innovatively structured foreign relocation schema chart three months roadmap topics Template. Showcase your roadmap process in different formats like PDF, PNG, and JPG by clicking the download button below. This PPT design is available in both Standard Screen and Widescreen aspect ratios. It can also be easily personalized and presented with modified font size, font type, color, and shapes to measure your progress in a clear way.

Management Information Systems Chart Powerpoint Slide Presentation Tips
This is a management information systems chart powerpoint slide presentation tips. This is a three stage process. The stages in this process are organizations, technology, management, information system.
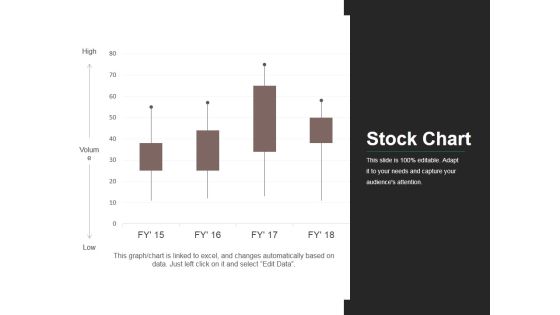
Stock Chart Ppt PowerPoint Presentation Infographic Template Elements
This is a stock chart ppt powerpoint presentation infographic template elements. This is a four stage process. The stages in this process are business, market, stock, finance, analysis.

Column Chart Graph Ppt PowerPoint Presentation Outline Information
This is a column chart graph ppt powerpoint presentation outline information. This is a three stage process. The stages in this process are compare, marketing, business, management, planning.
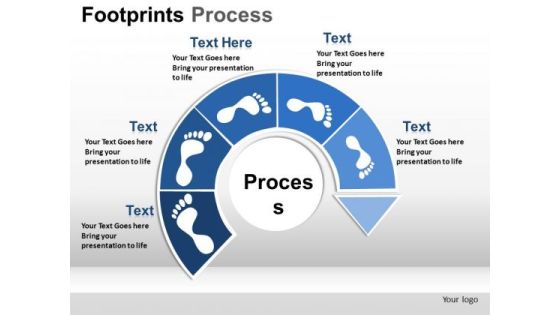
PowerPoint Slides Footprints Process Chart Ppt Slide Designs
PowerPoint Slides Footprints Process Chart PPT Slide Designs-These high quality powerpoint pre-designed slides and powerpoint templates have been carefully created by our professional team to help you impress your audience. All slides have been created and are 100% editable in powerpoint. Each and every property of any graphic - color, size, orientation, shading, outline etc. can be modified to help you build an effective powerpoint presentation. Any text can be entered at any point in the powerpoint template or slide. Simply DOWNLOAD, TYPE and PRESENT!
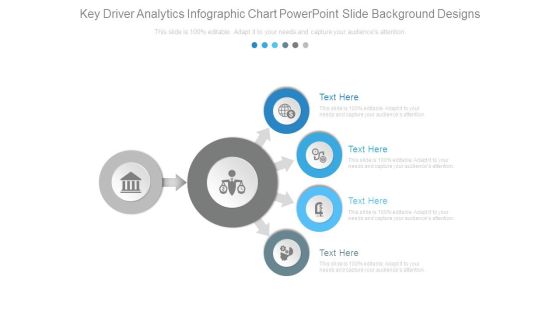
Key Driver Analytics Infographic Chart Powerpoint Slide Background Designs
This is a key driver analytics infographic chart powerpoint slide background designs. This is a four stage process. The stages in this process are business, marketing, arrows, icons, strategy.
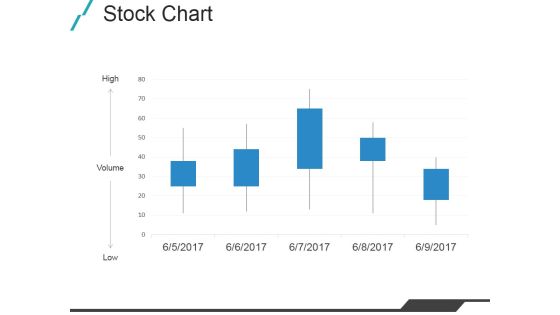
Stock Chart Ppt PowerPoint Presentation Outline Slide Portrait
This is a stock chart ppt powerpoint presentation outline slide portrait. This is a five stage process. The stages in this process are high, volume, low, business.

Donut Pie Chart Ppt PowerPoint Presentation Outline Graphics Example
This is a donut pie chart ppt powerpoint presentation outline graphics example. This is a five stage process. The stages in this process are percentage, finance, donut, business.
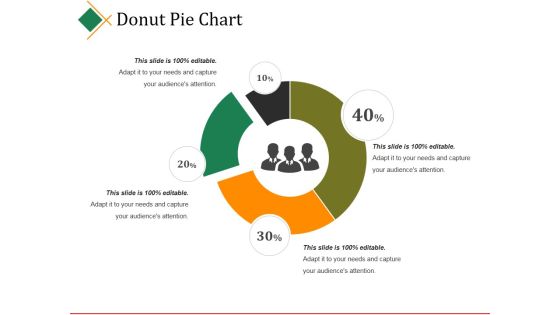
Donut Pie Chart Ppt PowerPoint Presentation Outline Microsoft
This is a donut pie chart ppt powerpoint presentation outline microsoft. This is a four stage process. The stages in this process are percentage, finance, donut, business.

Donut Pie Chart Ppt PowerPoint Presentation Outline Mockup
This is a donut pie chart ppt powerpoint presentation outline mockup. This is a four stage process. The stages in this process are product, donut, percentage, finance, business.
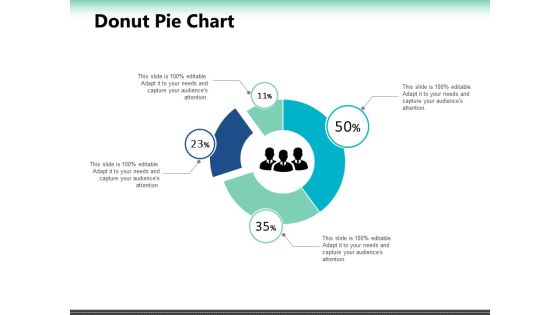
Donut Pie Chart Ppt PowerPoint Presentation Outline Deck
This is a donut pie chart ppt powerpoint presentation outline deck. This is a four stage process. The stages in this process are finance, business, marketing, management, percentage.
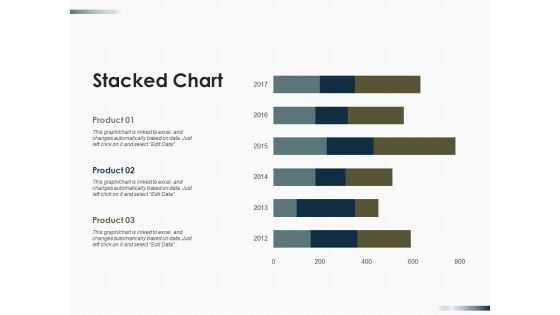
Stacked Chart Finance Ppt PowerPoint Presentation Outline Infographics
This is a stacked chart finance ppt powerpoint presentation outline infographics. This is a three stage process. The stages in this process are finance, marketing, management, investment, analysis.
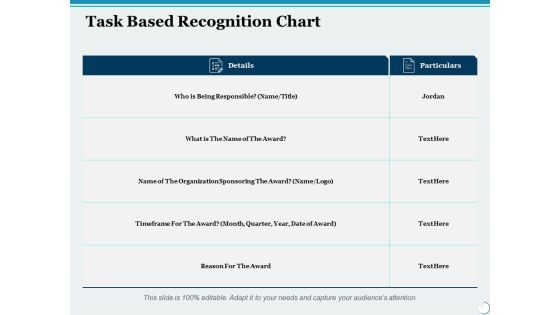
Task Based Recognition Chart Ppt PowerPoint Presentation Inspiration Outline
This is a task based recognition chart ppt powerpoint presentation inspiration outline. This is a two stage process. The stages in this process are compare, management, marketing, business.

Area Chart Finance Ppt PowerPoint Presentation Outline Structure
This is a area chart finance ppt powerpoint presentation outline structure. This is a three stage process. The stages in this process are finance, marketing, analysis, investment, million.
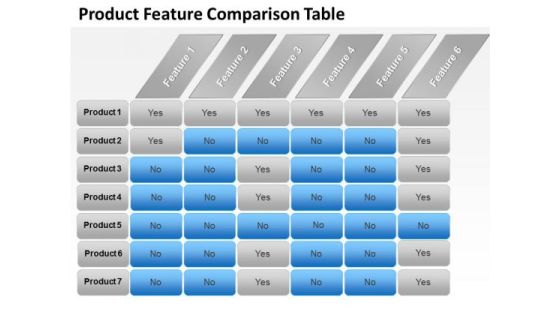
Strategic Management Product Features Comparison Chart Marketing Diagram
Double Your Chances With Our Strategic Management Product Features Comparison Chart Marketing Diagram Powerpoint Templates. The Value Of Your Thoughts Will Increase Two-Fold.
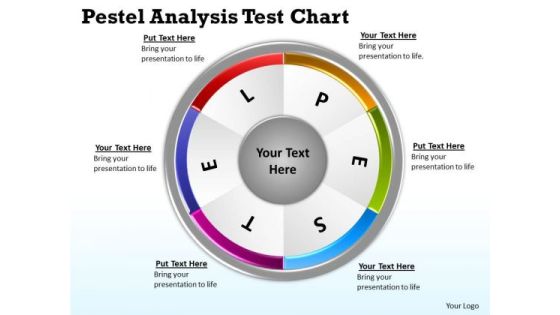
Mba Models And Frameworks Pestel Analysis Test Chart Business Diagram
Double Your Chances With Our Mba Models And Frameworks Pestel Analysis Test Chart Business Diagram Powerpoint Templates. The Value Of Your Thoughts Will Increase Two-Fold.

Quality Assurance Flow Chart In Production Process Guidelines PDF
Pitch your topic with ease and precision using this Quality Assurance Flow Chart In Production Process Guidelines PDF. This layout presents information on Quality Assurance, Flow Chart, Production Process. It is also available for immediate download and adjustment. So, changes can be made in the color, design, graphics or any other component to create a unique layout.
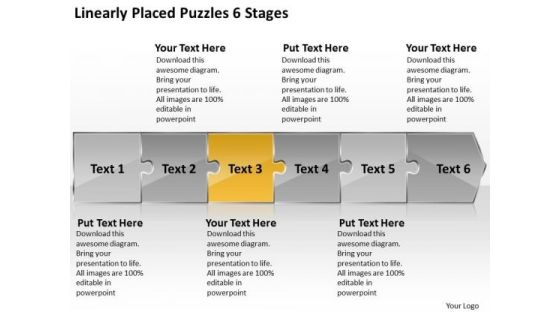
Linearly Placed Puzzles 6 Stages Flow Chart Template PowerPoint Slides
We present our linearly placed puzzles 6 stages flow chart template PowerPoint Slides.Use our Arrows PowerPoint Templates because,With the help of our Slides you can Illustrate how each element flows seamlessly onto the next stage. Use our Symbol PowerPoint Templates because,You can Determine your targets and sequence them as per your priorities. Use our Leadership PowerPoint Templates because,This diagram can be used to illustrate the logical path or system Use our Abstract PowerPoint Templates because, Activities which in themselves have many inherent business oppurtunities. Use our Business PowerPoint Templates because, Spell out your advertising plans to increase market share. The feedback has been positive and productiveUse these PowerPoint slides for presentations relating to Arrow, Background, Business, Chart, Diagram, Financial, Graphic, Gray, Icon, Illustration, Management, Orange, Perspective, Planning, Process, Stages, Steps, Text. The prominent colors used in the PowerPoint template are Yellow, Gray, White

Bar Chart Dollar Business PowerPoint Templates And PowerPoint Themes 0912
Bar Chart Dollar Business PowerPoint Templates And PowerPoint Themes 0912-Microsoft Powerpoint Templates and Background with dollar bar graph-Dollar bar graph, money, finance, success, future, business

Area Chart Ppt PowerPoint Presentation Show Graphic Images
This is a area chart ppt powerpoint presentation show graphic images. This is a two stage process. The stages in this process are business, marketing, management, finance, growth.

Combo Chart Ppt Powerpoint Presentation Infographic Template File Formats
This is a combo chart ppt powerpoint presentation infographic template file formats. This is a four stage process. The stages in this process are product, growth, management, business.

Rescue Pie Chart Business PowerPoint Templates And PowerPoint Themes 1112
Rescue Pie Chart Business PowerPoint Templates And PowerPoint Themes 1112-This Awesome PowerPoint template contains a diagram of lifesaver and pie chart. This image depicts the concept of statistics. Adjust the above image in your PPT presentations to visually support your content in your Business and Marketing PPT slideshows. Present your views using our innovative slides and be assured of leaving a lasting impression.-Rescue Pie Chart Business PowerPoint Templates And PowerPoint Themes 1112-This PowerPoint template can be used for presentations relating to-Lifesaver and Pie Chart, Symbol, Finance, Marketing, Business, Metaphor
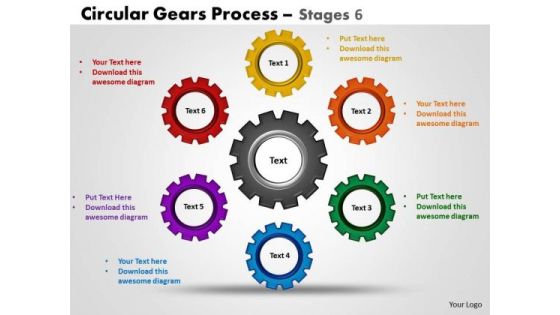
PowerPoint Backgrounds Chart Circular Gears Ppt Slide Designs
PowerPoint Backgrounds Chart Circular Gears PPT Slide Designs--These high quality powerpoint pre-designed slides and powerpoint templates have been carefully created by our professional team to help you impress your audience. All slides have been created and are 100% editable in powerpoint. Each and every property of any graphic - color, size, orientation, shading, outline etc. can be modified to help you build an effective powerpoint presentation. Any text can be entered at any point in the powerpoint template or slide. Simply DOWNLOAD, TYPE and PRESENT!

Bar Graph Chart Ppt PowerPoint Presentation Portfolio Templates
This is a bar graph chart ppt powerpoint presentation portfolio templates. This is a two stage process. The stages in this process are financial, minimum, medium, maximum.

Chart 2d Pyramid Simple PowerPoint Slides And Ppt Diagram Templates
Chart 2D Pyramid Simple PowerPoint Slides And PPT Diagram Templates-These high quality powerpoint pre-designed slides and powerpoint templates have been carefully created by our professional team to help you impress your audience. All slides have been created and are 100% editable in powerpoint. Each and every property of any graphic - color, size, orientation, shading, outline etc. can be modified to help you build an effective powerpoint presentation. Any text can be entered at any point in the powerpoint template or slide. Simply DOWNLOAD, TYPE and PRESENT!

Honeycomb Structure Scientific Illustration Circular Process Chart PowerPoint Templates
We present our honeycomb structure scientific illustration Circular Process Chart PowerPoint templates.Use our Nature PowerPoint Templates because a showpiece of the symmetry of nature. absorb its attributes and demonstrate your great innate strength. Present our Shapes PowerPoint Templates because you can Grab the attention of your team with this eye catching template signifying . Download our Technology PowerPoint Templates because you understand the ailment and how to fight it. Download our Business PowerPoint Templates because it will demonstrate the strength of character under severe stress. Shine the torch ahead and bring the light to shine on all. Download our Process and Flows PowerPoint Templates because you can Break it all down to Key Result Areas.Use these PowerPoint slides for presentations relating to Abstract, Animals, Backgrounds, Bee, Beehive, Beeswax, Biology, Cells, Cloning, Close-Up, Color, Computer, Concepts, Design, Digital, Effort, Food, Futuristic, Generated, Graphic, Healthcare, Healthy, Helix, High-Scale, Honey, Honeycomb, Ideas, Illustration, Image, Light, Macro, Magnification, Medicine, Molecule, Nature, Objects, Pattern, Research, Science, Scientific, Shape, Stem, Structure, Sweet, Technology. The prominent colors used in the PowerPoint template are Yellow, Orange, Black. We assure you our honeycomb structure scientific illustration Circular Process Chart PowerPoint templates will help you be quick off the draw. Just enter your specific text and see your points hit home. Customers tell us our Bee PowerPoint templates and PPT Slides are Handsome. The feedback we get is that our honeycomb structure scientific illustration Circular Process Chart PowerPoint templates are Elegant. We assure you our Beehive PowerPoint templates and PPT Slides are Amazing. People tell us our honeycomb structure scientific illustration Circular Process Chart PowerPoint templates are Spectacular. We assure you our Cloning PowerPoint templates and PPT Slides are Romantic.

Phases Of Implementation Linear Chart Ppt Slide Templates
This is a phases of implementation linear chart ppt slide templates. This is a five stage process. The stages in this process are arrow, business, strategy, marketing, management.
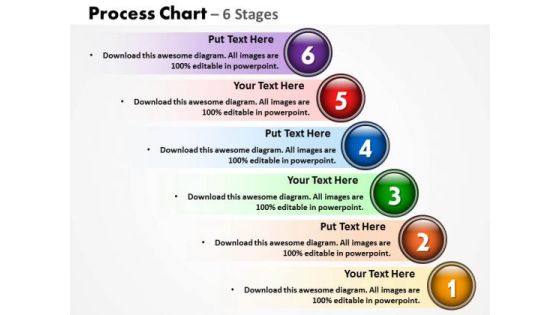
Business Cycle Diagram Process Chart With 6 Stages Strategy Diagram
Document The Process On Our Business Cycle Diagram Process Chart With 6 Stages Strategy Diagram Powerpoint Templates. Make A Record Of Every Detail.
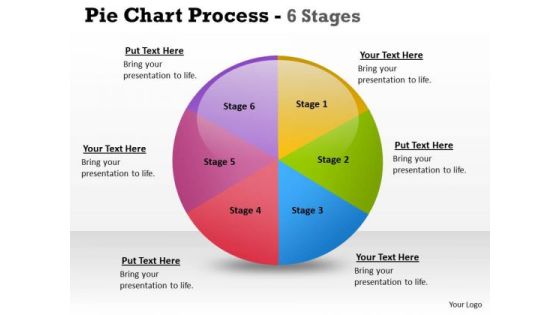
Marketing Diagram Pie Chart Process 6 Stages Strategic Management
Document The Process On Our Marketing Diagram Pie Chart Process 6 Stages Strategic Management Powerpoint Templates. Make A Record Of Every Detail.

Sales Diagram Pie Chart Process 10 Stages Business Framework Model
Document The Process On Our Sales Diagram Pie Chart Process 10 Stages Business Framework Model Powerpoint Templates. Make A Record Of Every Detail.

Quarterly Sales Revenue Generation Performance Chart Icon Slides PDF
This graph or chart is linked to excel, and changes automatically based on data. Just left click on it and select edit data. Persuade your audience using this Quarterly Sales Revenue Generation Performance Chart Icon Slides PDF. This PPT design covers four stages, thus making it a great tool to use. It also caters to a variety of topics including Quarterly Sales Revenue, Generation Performance, Chart Icon. Download this PPT design now to present a convincing pitch that not only emphasizes the topic but also showcases your presentation skills.
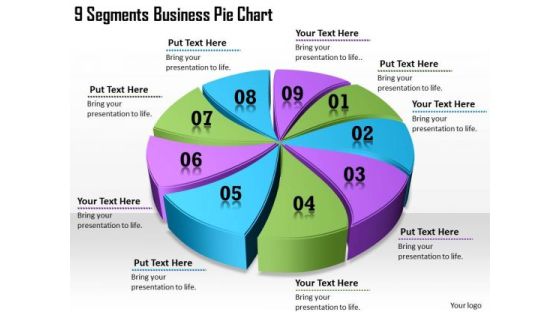
Timeline Ppt Template 9 Segments Business Pie Chart
Our Timeline Ppt Template 9 Segments Business Pie Chart Powerpoint Templates Leave No One In Doubt. Provide A Certainty To Your Views.
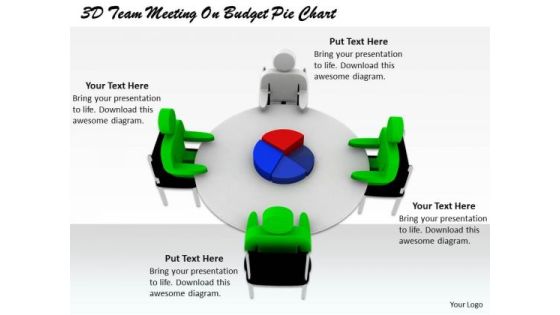
Modern Marketing Concepts 3d Team Meeting Budget Pie Chart Characters
Good Camaraderie Is A Key To Teamwork. Our modern marketing concepts 3d team meeting budget pie chart characters Powerpoint Templates Can Be A Cementing Force.

Hierarchy Chart Ppt PowerPoint Presentation Model Graphics Pictures
This is a hierarchy chart ppt powerpoint presentation model graphics pictures. This is a four stage process. The stages in this process are ceo, accountant, sales, developer, designer.

Organization Chart Template Ppt PowerPoint Presentation File Topics
This is a organization chart template ppt powerpoint presentation file topics. This is a three stage process. The stages in this process are ceo, marketing, developer, director, designer.
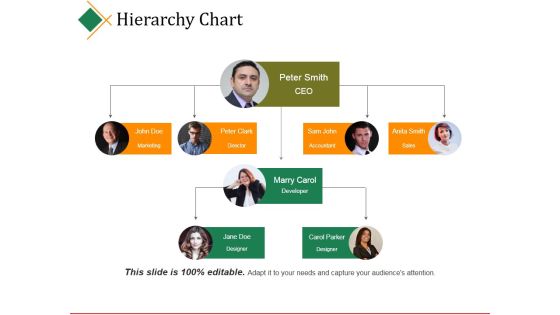
Hierarchy Chart Ppt PowerPoint Presentation Infographic Template Graphics
This is a hierarchy chart ppt powerpoint presentation infographic template graphics. This is a four stage process. The stages in this process are ceo, director, accountant, sales, developer.
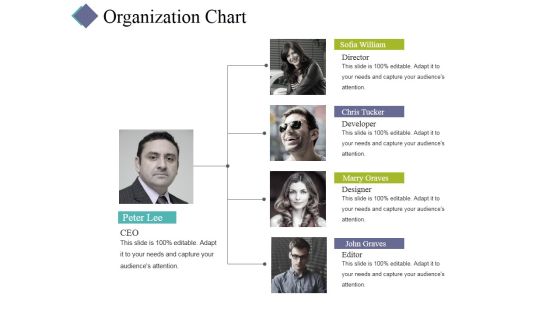
Organization Chart Ppt PowerPoint Presentation Infographic Template Gallery
This is a organization chart ppt powerpoint presentation infographic template gallery. This is a four stage process. The stages in this process are ceo, director, developer, designer, editor.

Personal Characteristics Flow Chart Powerpoint Slide Background Picture
This is a personal characteristics flow chart powerpoint slide background picture. This is a three stage process. The stages in this process are attitude, personal characteristics, loyalty.

Vision Mission Goal Infographic Chart Ppt Slide Show
This is a vision mission goal infographic chart ppt slide show. This is a three stage process. The stages in this process are vision, mission, goal.

Refugee Relocation Program Schema Chart Half Yearly Roadmap Slides
Introducing our refugee relocation program schema chart half yearly roadmap slides. This PPT presentation is Google Slides compatible, therefore, you can share it easily with the collaborators for measuring the progress. Also, the presentation is available in both standard screen and widescreen aspect ratios. So edit the template design by modifying the font size, font type, color, and shapes as per your requirements. As this PPT design is fully editable it can be presented in PDF, JPG and PNG formats.
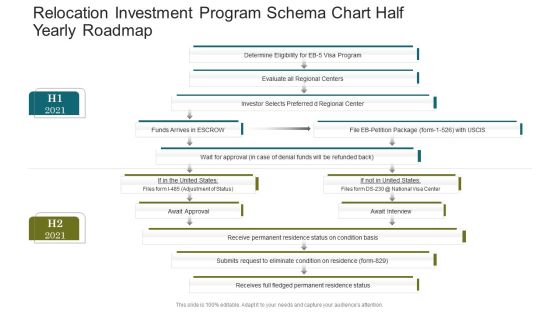
Relocation Investment Program Schema Chart Half Yearly Roadmap Topics
Introducing our relocation investment program schema chart half yearly roadmap topics. This PPT presentation is Google Slides compatible, therefore, you can share it easily with the collaborators for measuring the progress. Also, the presentation is available in both standard screen and widescreen aspect ratios. So edit the template design by modifying the font size, font type, color, and shapes as per your requirements. As this PPT design is fully editable it can be presented in PDF, JPG and PNG formats.

Stock Photo 3d Image Of Pie Chart Ppt Template
Document The Process On Our Stock Photo 3d Image Of Pie Chart PPT template Powerpoint Templates. Make A Record Of Every Detail.

3d Regular Implementation 7 Steps Flow Chart Template PowerPoint Slides
We present our 3d regular implementation 7 steps flow chart template PowerPoint Slides. Use our Business PowerPoint Templates because, The lessons have been analyzed, studied and conclusions drawn. Use our Arrows PowerPoint Templates because, Our Template designs are State of the Art. Use our Shapes PowerPoint Templates because; Highlight the key components of your entire manufacturing/ business process. Use our Abstract PowerPoint Templates because, Demonstrate to your audience how the best and most refined ideas pass through. Use our Process and Flows PowerPoint Templates because, to go for Gold and not just silver. Use these PowerPoint slides for presentations relating to analysis, art, blank, blue, business, categories, chart, chief, circle, clip, clipart, corporate, design, diagram, directors, element, executive, financial, graph, icon, illustration, implementation, isolated, managers, media, network, relations, role, sales, segments, set. The prominent colors used in the PowerPoint template are Blue, Gray, and Black

3d Regular Implementation 7 Steps Flow Chart PowerPoint Templates
We present our 3d regular implementation 7 steps flow chart PowerPoint templates. Use our Business PowerPoint Templates because, Emphasize on the relevance and importance of all milestones along the way. Use our Arrows PowerPoint Templates because, you have a great training programmer in mind to upgrade the skills of your staff. Use our Shapes PowerPoint Templates because; in any endeavor people matter most. Use our Abstract PowerPoint Templates because; Lay down the fundamentals to build upon. Use our Process and Flows PowerPoint Templates because, the vision of being the market leader is clear to you. Use these PowerPoint slides for presentations relating to analysis, art, blank, blue, business, categories, chart, chief, circle, clip, clipart, corporate, design, diagram, directors, element, executive, financial, graph, icon, illustration, implementation, isolated, managers, media, network, relations, role, sales, segments, set. The prominent colors used in the PowerPoint template are Green, Gray, and Black

Digital Marketing Roadmap Gantt Chart Powerpoint Slides Design
This is a digital marketing roadmap gantt chart powerpoint slides design. This is a four stage process. The stages in this process are content, whitepaper development, webinars, content creation initiative, newsletter sing up plugin, blog post developments, video lead capture, home page redesign, paid organic search, analytics implementation, competitive analysis, keyword research, new bar, on site seo improvements, ad roll campaign iteration, display advertising analysis, paid organic search initiative, email marketing, trial drip campaign, a b message testing, conversion initiative, onboarding optimization, social media, influencer outreach program , social media initiative.

Supply Chain Management Process With Gantt Chart Ideas PDF
This slide covers Gantt chart which will be helpful in providing task directions to different department involved in procurement process. The chart illustrates different tasks required to do by department for successful completion of project.Showcasing this set of slides titled Supply Chain Management Process With Gantt Chart Ideas PDF. The topics addressed in these templates are Supply Chain Management Process With Gantt Chart. All the content presented in this PPT design is completely editable. Download it and make adjustments in color, background, font etc. as per your unique business setting.
 Home
Home