Improvement Chart

Bubble Chart Ppt PowerPoint Presentation Inspiration Graphics Download
This is a bubble chart ppt powerpoint presentation inspiration graphics download. This is a three stage process. The stages in this process are product, growth, success, bubble chart, business.

Area Chart Ppt PowerPoint Presentation Infographic Template Model
This is a area chart ppt powerpoint presentation infographic template model. This is a two stage process. The stages in this process are product, area chart, growth, percentage, success.

Column Chart Ppt PowerPoint Presentation Model Background Images
This is a column chart ppt powerpoint presentation model background images. This is a six stage process. The stages in this process are bar graph, marketing, finance, strategy, planning.

Compliance Management Structural Chart Ppt Model Graphics Template PDF
Presenting this set of slides with name compliance management structural chart ppt model graphics template pdf. This is a four stage process. The stages in this process are chief compliance officer, compliance committee, worldwide sites, administrative office. This is a completely editable PowerPoint presentation and is available for immediate download. Download now and impress your audience.
Scatter Chart Template 2 Ppt PowerPoint Presentation Slides Icons
This is a scatter chart template 2 ppt powerpoint presentation slides icons. This is a two stage process. The stages in this process are business, marketing, graph, in percentage, finance.

Column Chart Ppt PowerPoint Presentation Infographic Template Icon
This is a column chart ppt powerpoint presentation infographic template icon. This is a two stage process. The stages in this process are business, marketing, sales in percentage, financial year, graph.

Business Growth Strategy Circular Resource Allocation Chart Consultant
We present our business growth strategy circular resource allocation chart consultant.Download our Advertising PowerPoint Templates because Watching this your Audience will Grab their eyeballs, they wont even blink. Download and present our Process and Flows PowerPoint Templates because It will Strengthen your hand with your thoughts. They have all the aces you need to win the day. Present our Circle Charts PowerPoint Templates because Your audience will believe you are the cats whiskers. Download and present our Business PowerPoint Templates because Our PowerPoint Templates and Slides will provide you the cutting edge. Slice through the doubts in the minds of your listeners. Download and present our Metaphors-Visual Concepts PowerPoint Templates because Our PowerPoint Templates and Slides will effectively help you save your valuable time. They are readymade to fit into any presentation structure. Use these PowerPoint slides for presentations relating to Arrow, chart, circle, circular, circulation, concept, connection, continuity, correlate, course, cycle, cyclic, diagram, direction, duplicate, flow, iterate, jigsaw, link, manage, method, order, phase, presentation, procedure, process, react, recycle, refresh, relate, repeat, repetition, report, review, ring, rotation, round, section, segment, sequence, simple, stage, step, strategy, success, system, work flow. The prominent colors used in the PowerPoint template are Green, Black, Gray.

Corporate Governance Flow Chart Ppt PowerPoint Presentation Show Diagrams
Presenting this set of slides with name corporate governance flow chart ppt powerpoint presentation show diagrams. This is a five stage process. The stages in this process are headquarters, manufacturing, marketing, finance, other functions. This is a completely editable PowerPoint presentation and is available for immediate download. Download now and impress your audience.

PowerPoint Templates Business Success Puzzle Segment Pie Chart Ppt Themes
PowerPoint Templates Business Success Puzzle Segment Pie Chart PPT Themes-These amazing PowerPoint pre-designed slides and PowerPoint templates have been carefully created by our team of experts to help you impress your audience. Our stunning collection of Powerpoint slides are 100% editable and can easily fit in any PowerPoint presentations. By using these animations and graphics in PowerPoint and you can easily make professional presentations. Any text can be entered at any point in the PowerPoint template or slide. Just DOWNLOAD our awesome PowerPoint templates and you are ready to go.

PowerPoint Templates Success Puzzle Segment Pie Chart Ppt Themes
PowerPoint Templates Success Puzzle Segment Pie Chart PPT Themes-These amazing PowerPoint pre-designed slides and PowerPoint templates have been carefully created by our team of experts to help you impress your audience. Our stunning collection of Powerpoint slides are 100% editable and can easily fit in any PowerPoint presentations. By using these animations and graphics in PowerPoint and you can easily make professional presentations. Any text can be entered at any point in the PowerPoint template or slide. Just DOWNLOAD our awesome PowerPoint templates and you are ready to go.

Column Chart Ppt PowerPoint Presentation Infographics Design Inspiration
This is a column chart ppt powerpoint presentation infographics design inspiration. This is a two stage process. The stages in this process are slide bar, marketing, strategy, finance, planning.

PowerPoint Process Circular Chart Cycle Process Ppt Process
PowerPoint Process Circular Chart Cycle Process PPT Process -These high quality powerpoint pre-designed slides and powerpoint templates have been carefully created by our professional team to help you impress your audience. All slides have been created and are 100% editable in powerpoint. Each and every property of any graphic - color, size, orientation, shading, outline etc. can be modified to help you build an effective powerpoint presentation. Any text can be entered at any point in the powerpoint template or slide. Simply DOWNLOAD, TYPE and PRESENT!

PowerPoint Process Cycle Chart Cycle Process Ppt Process
PowerPoint Process Cycle Chart Cycle Process PPT Process -These high quality powerpoint pre-designed slides and powerpoint templates have been carefully created by our professional team to help you impress your audience. All slides have been created and are 100% editable in powerpoint. Each and every property of any graphic - color, size, orientation, shading, outline etc. can be modified to help you build an effective powerpoint presentation. Any text can be entered at any point in the powerpoint template or slide. Simply DOWNLOAD, TYPE and PRESENT!

Cost Summary Report Pie Chart For Project Development Infographics PDF
This slide represents cost summary for project development illustrating employee salary, internal expenses, consulting costs, capital expenditure, factory rent etc. Showcasing this set of slides titled Cost Summary Report Pie Chart For Project Development Infographics PDF. The topics addressed in these templates are Fiscal Year Return, Project Development Costs. All the content presented in this PPT design is completely editable. Download it and make adjustments in color, background, font etc. as per your unique business setting.

Column Chart Finance Ppt Powerpoint Presentation Infographic Template Icon
This is a column chart finance ppt powerpoint presentation infographic template icon. This is a three stage process. The stages in this process are finance, marketing, management, investment, analysis.
Donut Pie Chart Marketing Ppt PowerPoint Presentation Infographic Template Icon
This is a donut pie chart marketing ppt powerpoint presentation infographic template icon. This is a five stage process. The stages in this process are finance, marketing, analysis, business, investment.

Column Chart Marketing Management Ppt PowerPoint Presentation Infographic Template Icon
This is a column chart marketing management ppt powerpoint presentation infographic template icon. This is a two stage process. The stages in this process are finance, marketing, management, investment, analysis.

Combo Chart Ppt PowerPoint Presentation Infographic Template Graphic Images
This is a combo chart ppt powerpoint presentation infographic template graphic images. This is a three stage process. The stages in this process are market size, growth rate, percentage, business, marketing.
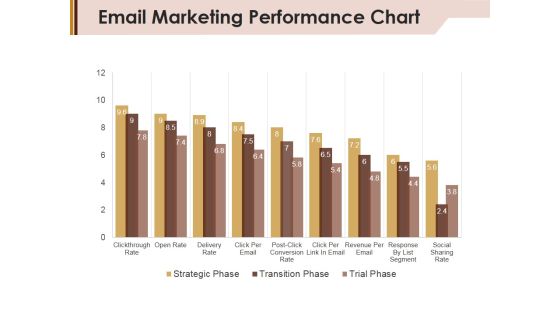
Email Marketing Performance Chart Ppt Powerpoint Presentation Layouts Graphics Pictures
This is a email marketing performance chart ppt powerpoint presentation layouts graphics pictures. This is a nine stage process. The stages in this process are strategic phase, transition phase, trial phase.
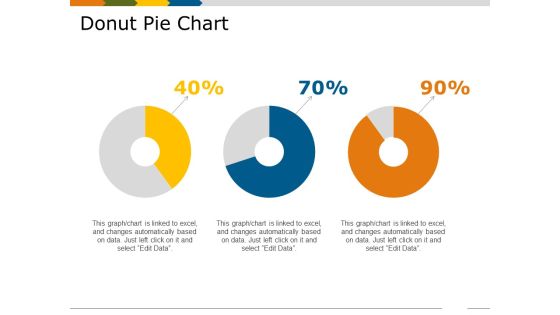
Donut Pie Chart Template 2 Ppt PowerPoint Presentation Show Skills
This is a donut pie chart template 2 ppt powerpoint presentation show skills. This is a three stage process. The stages in this process are percentage, business, marketing, process, finance.

Pareto Chart Ppt PowerPoint Presentation File Infographic Template
This is a pareto chart ppt powerpoint presentation file infographic template. This is a six stage process. The stages in this process are number of defects, business, marketing, graph.
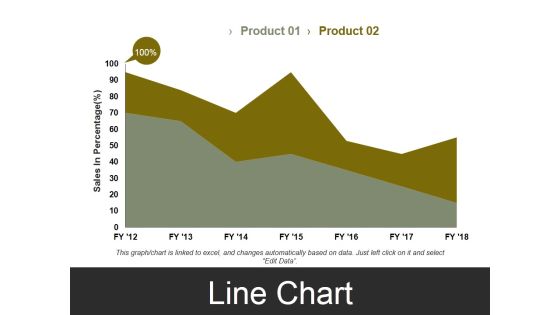
Line Chart Template 3 Ppt PowerPoint Presentation Styles Visual Aids
This is a line chart template 3 ppt powerpoint presentation styles visual aids. This is a two stage process. The stages in this process are sales in percentage, business, marketing, finance, graph.
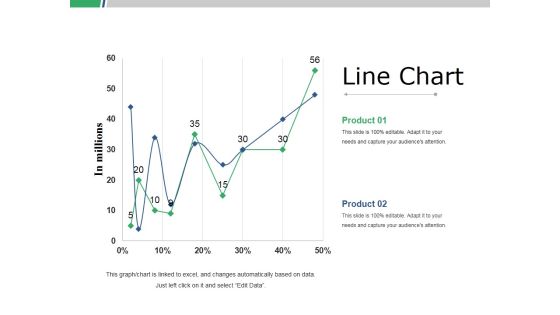
Line Chart Ppt PowerPoint Presentation Slides Graphics Template
This is a line chart ppt powerpoint presentation slides graphics template. This is a two stage process. The stages in this process are business, marketing, strategy, line graph, finance.
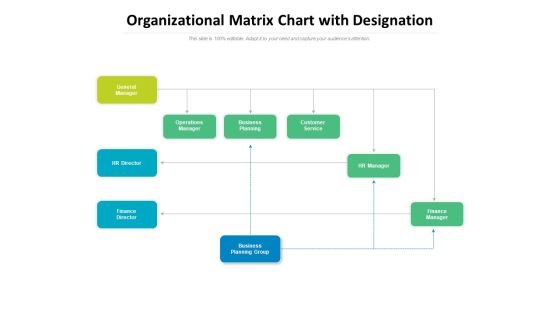
Organizational Matrix Chart With Designation Ppt PowerPoint Presentation File Infographics
Presenting this set of slides with name organizational matrix chart with designation ppt powerpoint presentation file infographics. This is a nine stage process. The stages in this process are general manager, finance director, business planning group, hr manager, customer service, business planning. This is a completely editable PowerPoint presentation and is available for immediate download. Download now and impress your audience.

Organization Chart Communication Ppt PowerPoint Presentation Gallery Guidelines
Presenting this set of slides with name organization chart communication ppt powerpoint presentation gallery guidelines. This is a five stage process. The stages in this process are business, management, planning, strategy, marketing. This is a completely editable PowerPoint presentation and is available for immediate download. Download now and impress your audience.
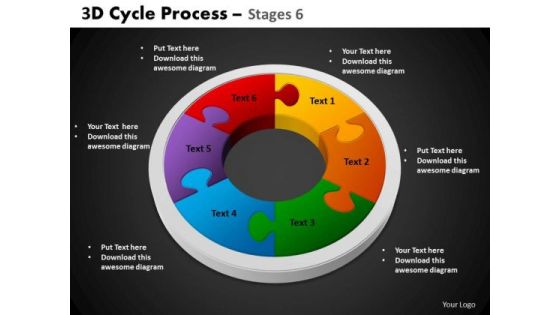
PowerPoint Themes Circular Chart Cycle Process Ppt Process
PowerPoint Themes Circular Chart Cycle Process PPT Process -These high quality powerpoint pre-designed slides and powerpoint templates have been carefully created by our professional team to help you impress your audience. All slides have been created and are 100% editable in powerpoint. Each and every property of any graphic - color, size, orientation, shading, outline etc. can be modified to help you build an effective powerpoint presentation. Any text can be entered at any point in the powerpoint template or slide. Simply DOWNLOAD, TYPE and PRESENT!

Scatter Bubble Chart Ppt PowerPoint Presentation Infographic Template Examples
This is a scatter bubble chart ppt powerpoint presentation infographic template examples. This is a two stage process. The stages in this process are highest sale, product, in price, finance, business.

Pareto Chart Template 1 Ppt PowerPoint Presentation File Ideas
This is a pareto chart template 1 ppt powerpoint presentation file ideas. This is a eight stage process. The stages in this process are business, finance, marketing, strategy, analysis.

Combo Chart Finance Ppt PowerPoint Presentation Infographic Template Microsoft
This is a combo chart finance ppt powerpoint presentation infographic template microsoft. This is a three stage process. The stages in this process are finance, marketing, management, investment, analysis.
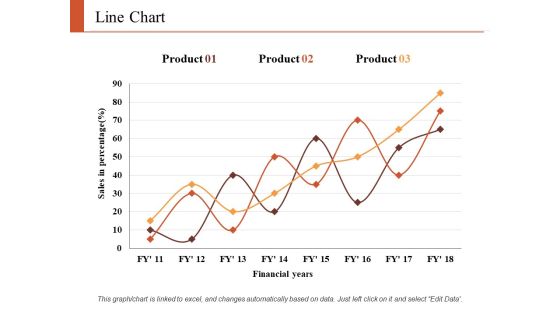
Line Chart Finance Ppt PowerPoint Presentation Infographic Template Graphics Tutorials
This is a line chart finance ppt powerpoint presentation infographic template graphics tutorials. This is a three stage process. The stages in this process are finance, marketing, analysis, business, investment.

Area Chart Finance Ppt PowerPoint Presentation Summary Design Templates
This is a area chart finance ppt powerpoint presentation summary design templates. This is a two stage process. The stages in this process are finance, marketing, management, investment, analysis.

Donut Pie Chart Ppt PowerPoint Presentation Infographic Template Slides
This is a donut pie chart ppt powerpoint presentation infographic template slides. This is a three stage process. The stages in this process are percentage, product, business, management, marketing.

Daunt Pie Chart Investment Ppt PowerPoint Presentation Infographic Template Aids
This is a daunt pie chart investment ppt powerpoint presentation infographic template aids. This is a four stage process. The stages in this process are finance, analysis, business, investment, marketing.

Clustered Column Chart Investment Ppt PowerPoint Presentation Infographic Template Clipart
This is a clustered column chart investment ppt powerpoint presentation infographic template clipart. This is a four stage process. The stages in this process are finance, analysis, business, investment, marketing.

Column Chart Finance Investment Ppt PowerPoint Presentation Inspiration Template
This is a column chart finance investment ppt powerpoint presentation inspiration template. This is a two stage process. The stages in this process are finance, analysis, business, investment, marketing.

Column Chart Marketing Finance Ppt PowerPoint Presentation Infographic Template Rules
This is a column chart marketing finance ppt powerpoint presentation infographic template rules. This is a two stage process. The stages in this process are finance, analysis, business, investment, marketing.

Combo Chart Investment Ppt PowerPoint Presentation Summary Infographic Template
This is a combo chart investment ppt powerpoint presentation summary infographic template. This is a three stage process. The stages in this process are finance, analysis, business, investment, marketing.
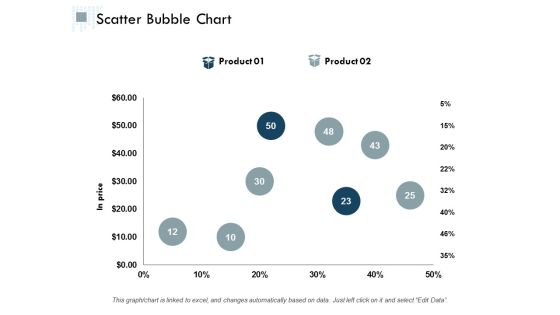
Scatter Bubble Chart Ppt PowerPoint Presentation Infographic Template Graphics Design
This is a scatter bubble chart ppt powerpoint presentation infographic template graphics design. This is a two stage process. The stages in this process are finance, analysis, business, investment, marketing.
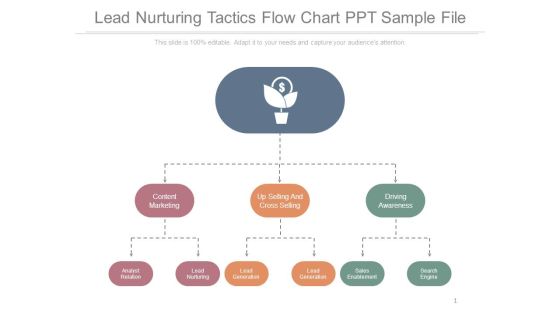
Lead Nurturing Tactics Flow Chart Ppt Sample File
This is a lead nurturing tactics flow chart ppt sample file. This is a three stage process. The stages in this process are content marketing, up selling and cross selling, driving awareness, search engine, sales enablement, lead generation, lead nurturing, analyst relation.
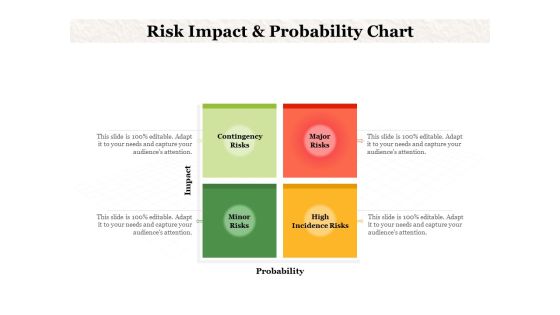
Risk Impact And Probability Chart Ppt PowerPoint Presentation Inspiration Background
Presenting this set of slides with name risk impact and probability chart ppt powerpoint presentation inspiration background. This is a four stage process. The stages in this process are contingency risks, major risks, minor risks, high incidence risks. This is a completely editable PowerPoint presentation and is available for immediate download. Download now and impress your audience.

Company Org Chart With Designations Ppt PowerPoint Presentation Professional Infographics
Presenting this set of slides with name company org chart with designations ppt powerpoint presentation professional infographics. This is a five stage process. The stages in this process are designation, managers. This is a completely editable PowerPoint presentation and is available for immediate download. Download now and impress your audience.

Company Structure Chart With Designation Ppt PowerPoint Presentation Styles Shapes
Presenting this set of slides with name company structure chart with designation ppt powerpoint presentation styles shapes. This is a five stage process. The stages in this process are designation, managers. This is a completely editable PowerPoint presentation and is available for immediate download. Download now and impress your audience.

Departmental Organizational Structure Chart Ppt PowerPoint Presentation File Portfolio
Presenting this set of slides with name departmental organizational structure chart ppt powerpoint presentation file portfolio. This is a four stage process. The stages in this process are executive board, sales, hr, it, department. This is a completely editable PowerPoint presentation and is available for immediate download. Download now and impress your audience.

Compliance Department Organizational Chart Ppt Gallery Influencers PDF
Presenting this set of slides with name compliance department organizational chart ppt gallery influencers pdf. This is a one stage process. The stages in this process are group hotline, group company hotline, chief compliance officer, internal, external, employee, instruct, employees. This is a completely editable PowerPoint presentation and is available for immediate download. Download now and impress your audience.
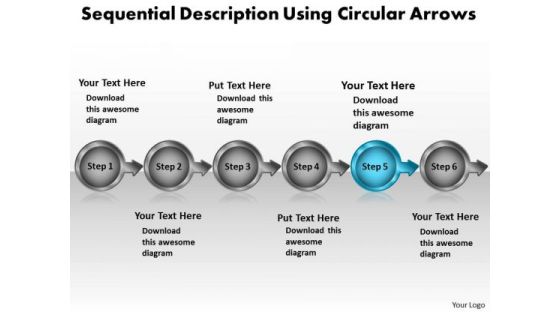
Sequential Description Using Circular Arrows Working Flow Chart PowerPoint Slides
We present our sequential description using circular arrows working flow chart PowerPoint Slides.Use our Arrows PowerPoint Templates because, This will helps you to explore the minutest detail of each concept and follow the trail to its conclusion. Use our Circle Charts PowerPoint Templates because, Profit is fairly earned in what you believe. Use our Shapes PowerPoint Templates because,This diagram provides range of options to garner your interest. Use our Design PowerPoint Templates because,Let your words be the drops of wisdom spreading knowledge and peace like ripples through the expectant minds of your devoted followers. Use our Process and Flows PowerPoint Templates because,You will be able to Highlight the various ways in which we can maintain its efficiency.Use these PowerPoint slides for presentations relating to 3d, Abstract, Around, Arrows, Blue, Border, Business, Center, Circle, Circular, Concept, Connections, Copy, Curve, Cycle, Directions, Distribution, Illustration, Management, Middle, Objects, Pieces, Plan, Pointing, Process, Recycle, Rounded, Shadows, Space, System. The prominent colors used in the PowerPoint template are Blue, Gray, Black. People tell us our sequential description using circular arrows working flow chart PowerPoint Slides will generate and maintain the level of interest you desire. They will create the impression you want to imprint on your audience. PowerPoint presentation experts tell us our Business PowerPoint templates and PPT Slides are the best it can get when it comes to presenting. PowerPoint presentation experts tell us our sequential description using circular arrows working flow chart PowerPoint Slides are Endearing. Professionals tell us our Border PowerPoint templates and PPT Slides are Vintage. Professionals tell us our sequential description using circular arrows working flow chart PowerPoint Slides will help them to explain complicated concepts. People tell us our Business PowerPoint templates and PPT Slides are Appealing.
Open High Low Close Chart Ppt PowerPoint Presentation Gallery Icons
This is a open high low close chart ppt powerpoint presentation gallery icons. This is a five stage process. The stages in this process are business, marketing, finance, planning, strategy.

PowerPoint Design Success Puzzle Segment Pie Chart Ppt Template
PowerPoint Design Success Puzzle Segment Pie Chart PPT Template-These amazing PowerPoint pre-designed slides and PowerPoint templates have been carefully created by our team of experts to help you impress your audience. Our stunning collection of Powerpoint slides are 100% editable and can easily fit in any PowerPoint presentations. By using these animations and graphics in PowerPoint and you can easily make professional presentations. Any text can be entered at any point in the PowerPoint template or slide. Just DOWNLOAD our awesome PowerPoint templates and you are ready to go.

PowerPoint Template Company Success Puzzle Segment Pie Chart Ppt Design
PowerPoint Template Company Success Puzzle Segment Pie Chart PPT Design-These amazing PowerPoint pre-designed slides and PowerPoint templates have been carefully created by our team of experts to help you impress your audience. Our stunning collection of Powerpoint slides are 100% editable and can easily fit in any PowerPoint presentations. By using these animations and graphics in PowerPoint and you can easily make professional presentations. Any text can be entered at any point in the PowerPoint template or slide. Just DOWNLOAD our awesome PowerPoint templates and you are ready to go.
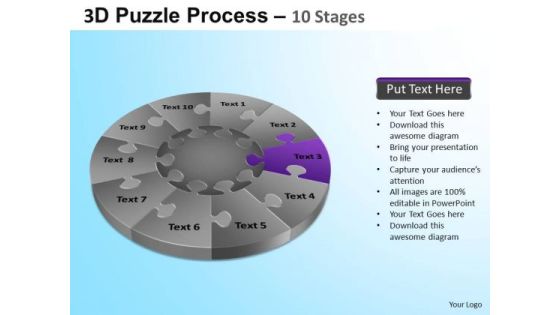
PowerPoint Template Company Success Puzzle Segment Pie Chart Ppt Slide
PowerPoint Template Company Success Puzzle Segment Pie Chart PPT Slide-These amazing PowerPoint pre-designed slides and PowerPoint templates have been carefully created by our team of experts to help you impress your audience. Our stunning collection of Powerpoint slides are 100% editable and can easily fit in any PowerPoint presentations. By using these animations and graphics in PowerPoint and you can easily make professional presentations. Any text can be entered at any point in the PowerPoint template or slide. Just DOWNLOAD our awesome PowerPoint templates and you are ready to go.
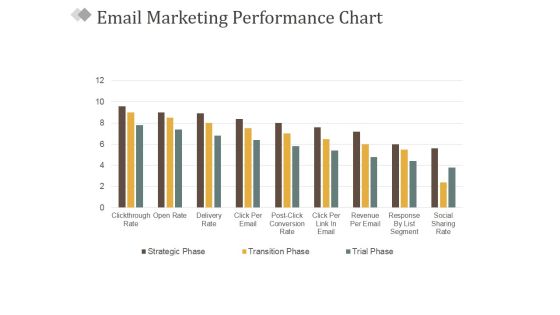
Email Marketing Performance Chart Ppt PowerPoint Presentation Gallery Elements
This is a email marketing performance chart ppt powerpoint presentation gallery elements. This is a nine stage process. The stages in this process are business, marketing, success, management, bar graph.
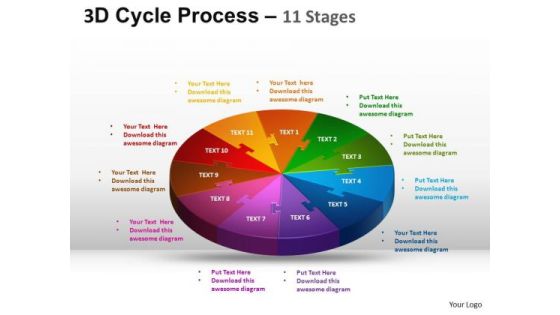
PowerPoint Template Chart Cycle Process Flow Ppt Process
PowerPoint Template Chart Cycle Process Flow PPT Process--These high quality powerpoint pre-designed slides and powerpoint templates have been carefully created by our professional team to help you impress your audience. All slides have been created and are 100% editable in powerpoint. Each and every property of any graphic - color, size, orientation, shading, outline etc. can be modified to help you build an effective powerpoint presentation. Any text can be entered at any point in the powerpoint template or slide. Simply DOWNLOAD, TYPE and PRESENT!

Clustered Column Chart Planning Ppt PowerPoint Presentation Portfolio Information
This is a clustered column chart planning ppt powerpoint presentation portfolio information. This is a four stage process. The stages in this process are finance, marketing, analysis, business, investment.
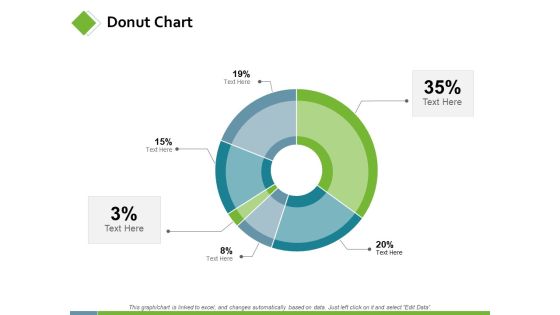
Donut Chart Marketing Planning Ppt PowerPoint Presentation Model Slideshow
This is a donut chart marketing planning ppt powerpoint presentation model slideshow. This is a six stage process. The stages in this process are finance, analysis, business, investment, marketing.
Donut Pie Chart Ppt PowerPoint Presentation Icon Background Designs
This is a donut pie chart ppt powerpoint presentation icon background designs. This is a four stage process. The stages in this process are product, percentage, finance, donut, business.

cost volume profit analysis chart ppt powerpoint presentation icon slideshow
This is a cost volume profit analysis chart ppt powerpoint presentation icon slideshow. This is a three stage process. The stages in this process are break even point,break even analysis,break even level.
Open High Low Close Chart Ppt PowerPoint Presentation Icon Portrait
This is a open high low close chart ppt powerpoint presentation icon portrait. This is a two stage process. The stages in this process are business, management, marketing, percentage, product.

PowerPoint Layout Chart Circular Process Cycle Ppt Slide Designs
PowerPoint Layout Chart Circular Process Cycle PPT Slide Designs-These high quality powerpoint pre-designed slides and powerpoint templates have been carefully created by our professional team to help you impress your audience. All slides have been created and are 100% editable in powerpoint. Each and every property of any graphic - color, size, orientation, shading, outline etc. can be modified to help you build an effective powerpoint presentation. Any text can be entered at any point in the powerpoint template or slide. Simply DOWNLOAD, TYPE and PRESENT!
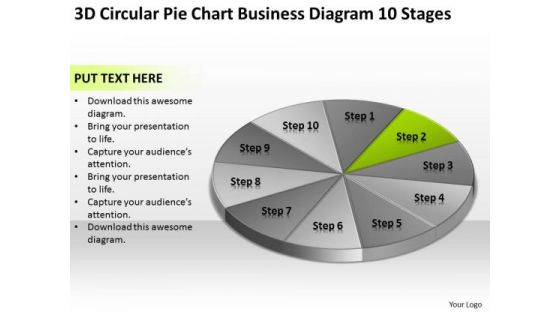
Circular Pie Chart Business Diagram 10 Stages Plan PowerPoint Slides
We present our circular pie chart business diagram 10 stages plan PowerPoint Slides.Present our Business PowerPoint Templates because Our PowerPoint Templates and Slides are conceived by a dedicated team. Use them and give form to your wondrous ideas. Present our Finance PowerPoint Templates because Our PowerPoint Templates and Slides are created with admirable insight. Use them and give your group a sense of your logical mind. Use our Circle Charts PowerPoint Templates because Our PowerPoint Templates and Slides come in all colours, shades and hues. They help highlight every nuance of your views. Download our Shapes PowerPoint Templates because Our PowerPoint Templates and Slides will let your team Walk through your plans. See their energy levels rise as you show them the way. Download and present our Process and Flows PowerPoint Templates because Timeline crunches are a fact of life. Meet all deadlines using our PowerPoint Templates and Slides.Use these PowerPoint slides for presentations relating to Chart, donut, market, isolated, diminishing, rate, downtrend, business, three-dimensional, success, presentation, diagram, circle, uptrend, percentage, graphic, finance, data, stock, holdings, report, marketing, analyzing, trading, graph, illustration, pie, sale, up, money, design, currency, growth, descriptive, representing, painting, moving, progress, part, increases, background, investment, index, financial, multi, counter. The prominent colors used in the PowerPoint template are Green, Gray, White.
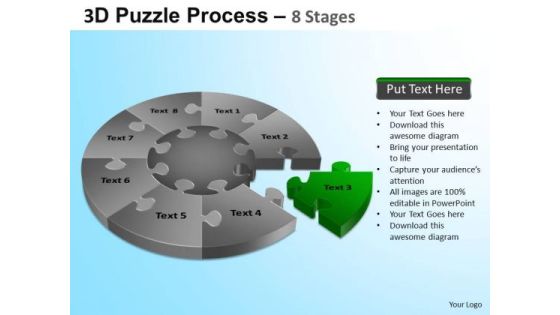
PowerPoint Design Business Success Puzzle Segment Pie Chart Ppt Slide
PowerPoint Design Business Success Puzzle Segment Pie Chart PPT Slide-These amazing PowerPoint pre-designed slides and PowerPoint templates have been carefully created by our team of experts to help you impress your audience. Our stunning collection of Powerpoint slides are 100% editable and can easily fit in any PowerPoint presentations. By using these animations and graphics in PowerPoint and you can easily make professional presentations. Any text can be entered at any point in the PowerPoint template or slide. Just DOWNLOAD our awesome PowerPoint templates and you are ready to go.

IT Business Valuation Comparison Chart Ppt Model Themes PDF
This slide shows the comparison amongst valuation of three information technology companies. It includes data of last four years. Showcasing this set of slides titled IT Business Valuation Comparison Chart Ppt Model Themes PDF. The topics addressed in these templates are Key Takeaways, Increasing Competition, Innovative Products . All the content presented in this PPT design is completely editable. Download it and make adjustments in color, background, font etc. as per your unique business setting.

Donut Pie Chart Ppt PowerPoint Presentation Professional Example File
This is a donut pie chart ppt powerpoint presentation professional example file. This is a four stage process. The stages in this process are percentage, finance, donut, business, process.
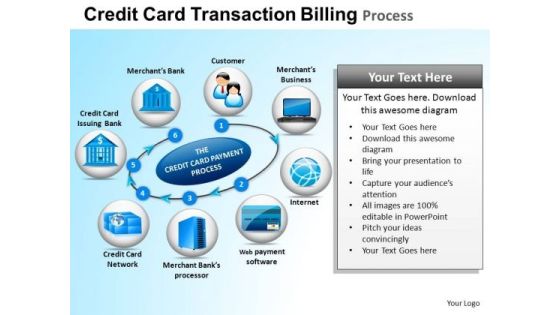
PowerPoint Template Chart Credit Card Transaction Ppt Themes
PowerPoint Template Chart credit card transaction PPT Themes-These high quality powerpoint pre-designed slides and powerpoint templates have been carefully created by our professional team to help you impress your audience. All slides have been created and are 100% editable in powerpoint. Each and every property of any graphic - color, size, orientation, shading, outline etc. can be modified to help you build an effective powerpoint presentation. Any text can be entered at any point in the powerpoint template or slide. Simply DOWNLOAD, TYPE and PRESENT!

PowerPoint Template Chart Pedestal Platform Showcase Ppt Theme
PowerPoint Template Chart pedestal platform showcase PPT Theme-These high quality powerpoint pre-designed slides and powerpoint templates have been carefully created by our professional team to help you impress your audience. All slides have been created and are 100% editable in powerpoint. Each and every property of any graphic - color, size, orientation, shading, outline etc. can be modified to help you build an effective powerpoint presentation. Any text can be entered at any point in the powerpoint template or slide. Simply DOWNLOAD, TYPE and PRESENT!
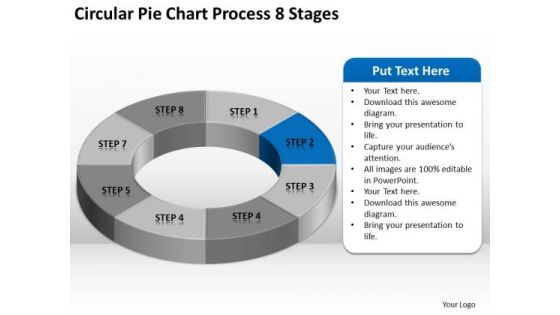
Circular Pie Chart Process 8 Stages Business Plan PowerPoint Slides
We present our circular pie chart process 8 stages business plan PowerPoint Slides.Download our Marketing PowerPoint Templates because Our PowerPoint Templates and Slides are designed to help you succeed. They have all the ingredients you need. Use our Finance PowerPoint Templates because It can be used to Set your controls for the heart of the sun. Our PowerPoint Templates and Slides will be the propellant to get you there. Download our Business PowerPoint Templates because It can Leverage your style with our PowerPoint Templates and Slides. Charm your audience with your ability. Use our Circle Charts PowerPoint Templates because you should once Tap the ingenuity of our PowerPoint Templates and Slides. They are programmed to succeed. Download our Shapes PowerPoint Templates because You can Hit the nail on the head with our PowerPoint Templates and Slides. Embed your ideas in the minds of your audience.Use these PowerPoint slides for presentations relating to Chart, Pie, Graph, Vector, 3d, Icon, Diagram, Progress, Business, Circular, Design, Information, Market, Opinion, Corporate, Sign, Symbol, Shadow, Percentage, Graphic, Finance, Data, Element, Drawing, Report, Marketing, Shape, Illustration, Earnings, Number, Strategy, Money, Dimensional, Survey, Growth, Colorful, Global, Account, Part, Investment, Statistic, Financial. The prominent colors used in the PowerPoint template are Blue, Gray, White.

Open High Low Close Chart Ppt PowerPoint Presentation Styles Example
This is a open high low close chart ppt powerpoint presentation styles example. This is a four stage process. The stages in this process are business, marketing, finance, strategy, planning.
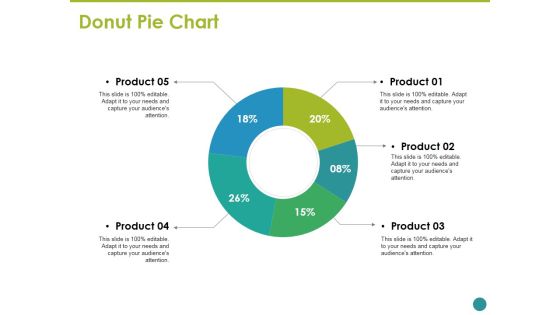
Donut Pie Chart Ppt PowerPoint Presentation Inspiration Graphic Images
This is a donut pie chart ppt powerpoint presentation inspiration graphic images. This is a five stage process. The stages in this process are business, marketing, strategy, planning, donut.

Clustered Column Line Chart Ppt PowerPoint Presentation Inspiration Graphics Pictures
This is a clustered column line chart ppt powerpoint presentation inspiration graphics pictures. This is a four stage process. The stages in this process are business, marketing, strategy, planning, finance.
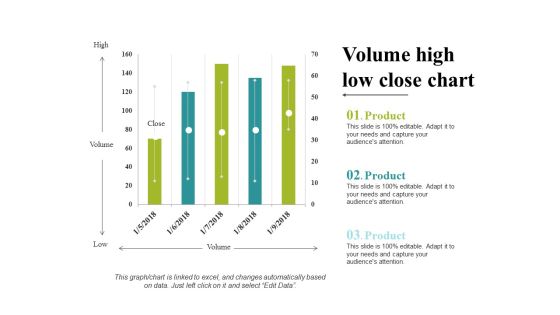
Volume High Low Close Chart Ppt PowerPoint Presentation Portfolio Clipart
This is a volume high low close chart ppt powerpoint presentation portfolio clipart. This is a five stage process. The stages in this process are business, marketing, strategy, planning, finance.
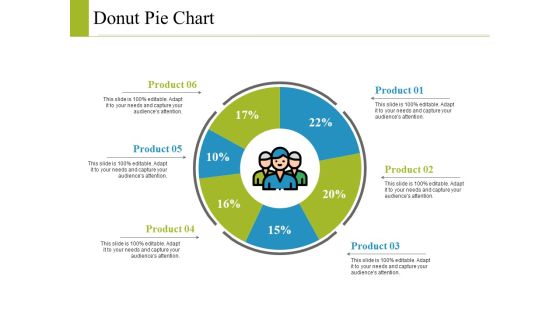
Donut Pie Chart Ppt PowerPoint Presentation Model Graphics Example
This is a donut pie chart ppt powerpoint presentation model graphics example. This is a six stage process. The stages in this process are business, marketing, strategy, planning, finance.
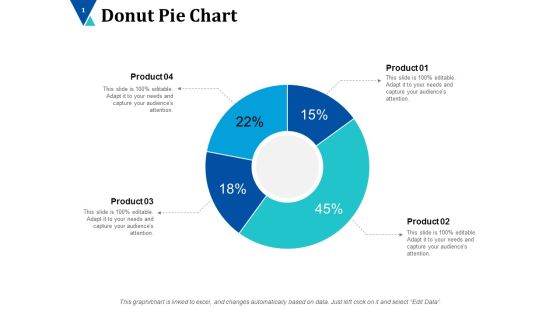
Donut Pie Chart Ppt PowerPoint Presentation Inspiration Designs Download
This is a donut pie chart ppt powerpoint presentation inspiration designs download. This is a four stage process. The stages in this process are donut, business, planning, marketing, finance.
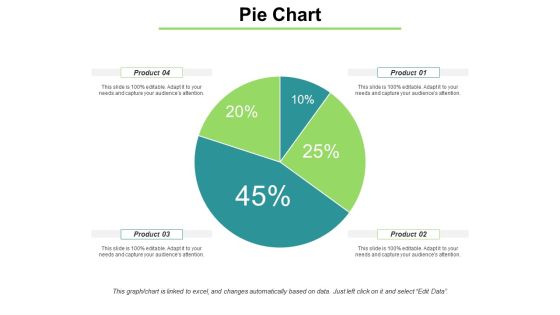
Pie Chart With Distrubation Ppt PowerPoint Presentation Model Ideas
This is a pie chart with distrubation ppt powerpoint presentation model ideas. This is a four stage process. The stages in this process are pie, finance, marketing, strategy, planning.
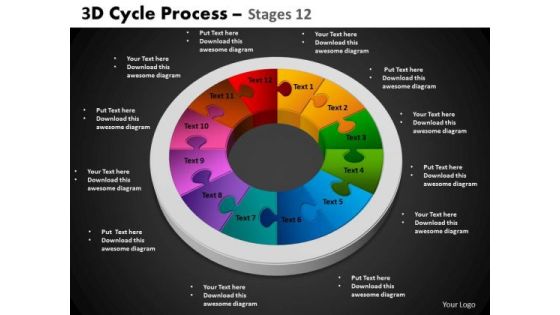
PowerPoint Backgrounds Circle Chart Cycle Process Ppt Process
PowerPoint Backgrounds Circle Chart Cycle Process PPT Process -These high quality powerpoint pre-designed slides and powerpoint templates have been carefully created by our professional team to help you impress your audience. All slides have been created and are 100% editable in powerpoint. Each and every property of any graphic - color, size, orientation, shading, outline etc. can be modified to help you build an effective powerpoint presentation. Any text can be entered at any point in the powerpoint template or slide. Simply DOWNLOAD, TYPE and PRESENT!
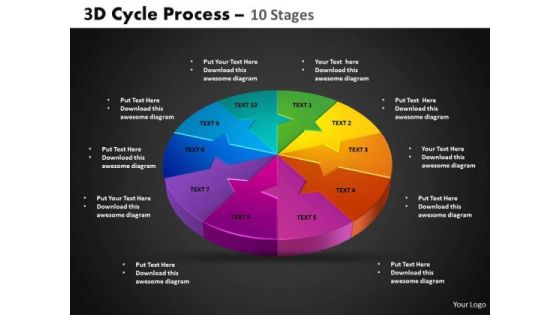
PowerPoint Designs Circle Chart Cycle Process Ppt Process
PowerPoint Designs Circle Chart Cycle Process PPT Process -These high quality powerpoint pre-designed slides and powerpoint templates have been carefully created by our professional team to help you impress your audience. All slides have been created and are 100% editable in powerpoint. Each and every property of any graphic - color, size, orientation, shading, outline etc. can be modified to help you build an effective powerpoint presentation. Any text can be entered at any point in the powerpoint template or slide. Simply DOWNLOAD, TYPE and PRESENT!

PowerPoint Slides Circle Chart Cycle Process Ppt Process
PowerPoint Slides Circle Chart Cycle Process PPT Process -These high quality powerpoint pre-designed slides and powerpoint templates have been carefully created by our professional team to help you impress your audience. All slides have been created and are 100% editable in powerpoint. Each and every property of any graphic - color, size, orientation, shading, outline etc. can be modified to help you build an effective powerpoint presentation. Any text can be entered at any point in the powerpoint template or slide. Simply DOWNLOAD, TYPE and PRESENT!

Line Chart Ppt PowerPoint Presentation Summary Graphic Tips
This is a line chart ppt powerpoint presentation summary graphic tips. This is a two stage process. The stages in this process are line chart, product, in percentage, analysis, business.
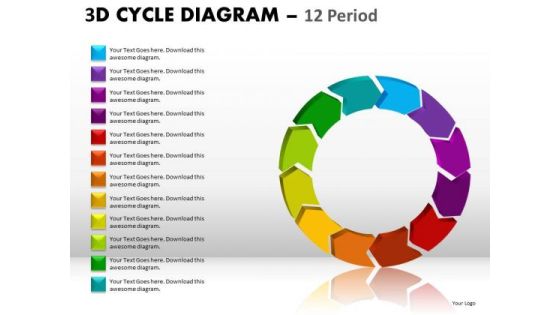
Ppt Templates Cycle Diagram Circle Process Chart PowerPoint Slides
PPT templates Cycle Diagram Circle Process Chart PowerPoint Slides-These high quality powerpoint pre-designed slides and powerpoint templates have been carefully created by our professional team to help you impress your audience. All slides have been created and are 100% editable in powerpoint. Each and every property of any graphic - color, size, orientation, shading, outline etc. can be modified to help you build an effective powerpoint presentation. Any text can be entered at any point in the powerpoint template or slide. Simply DOWNLOAD, TYPE and PRESENT! These PowerPoint presentation slides can be used to represent themes relating to -
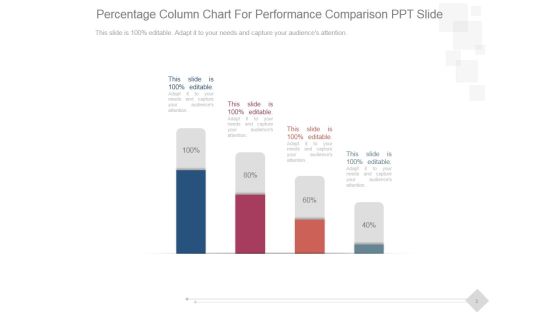
Percentage Column Chart For Performance Comparison Ppt PowerPoint Presentation Good
This is a percentage column chart for performance comparison ppt powerpoint presentation good. This is a four stage process. The stages in this process are business, marketing, technology, presentation, management.

High Low Close Chart Ppt Powerpoint Presentation Gallery Slides
This is a high low close chart ppt powerpoint presentation gallery slides. This is a five stage process. The stages in this process are close, volume, high, low, graph.

High Low Close Chart Ppt PowerPoint Presentation Layouts Guide
This is a high low close chart ppt powerpoint presentation layouts guide. This is a ten stage process. The stages in this process are high, volume, low, business, marketing, finance.

High Low Close Chart Ppt PowerPoint Presentation Ideas Brochure
This is a high low close chart ppt powerpoint presentation ideas brochure. This is a three stage process. The stages in this process are in percentage, product, business, marketing, finance.
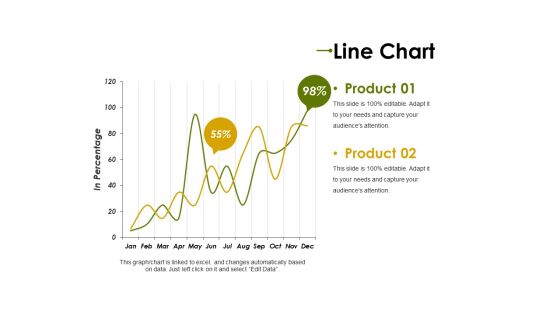
Line Chart Ppt PowerPoint Presentation Professional Clipart Images
This is a line chart ppt powerpoint presentation professional clipart images. This is a two stage process. The stages in this process are product, in percentage, graph, percentage, finance, business.
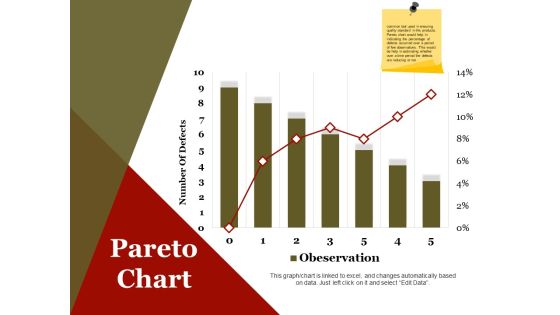
Pareto Chart Ppt PowerPoint Presentation Infographics Design Inspiration
This is a pareto chart ppt powerpoint presentation infographics design inspiration. This is a seven stage process. The stages in this process are number of defects, business, marketing, finance.
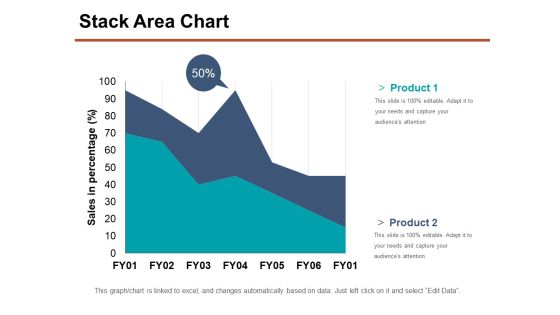
Stack Area Chart Ppt PowerPoint Presentation Show Samples
This is a stack area chart ppt powerpoint presentation show samples. This is a two stage process. The stages in this process are product, sales in percentage, business, marketing, percentage.

High Low Close Chart Ppt PowerPoint Presentation Layouts Objects
This is a high low close chart ppt powerpoint presentation layouts objects. This is a five stage process. The stages in this process are high, volume, low, business, marketing.
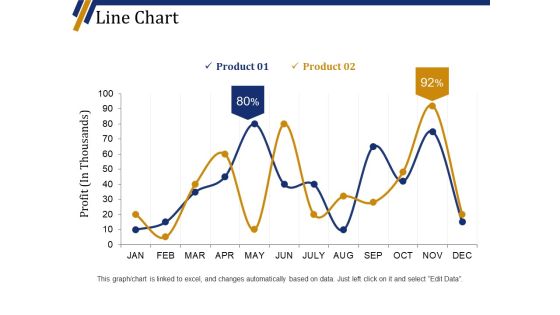
Line Chart Ppt PowerPoint Presentation Portfolio Background Designs
This is a line chart ppt powerpoint presentation portfolio background designs. This is a two stage process. The stages in this process are product, business, finance, marketing, profit in thousands.
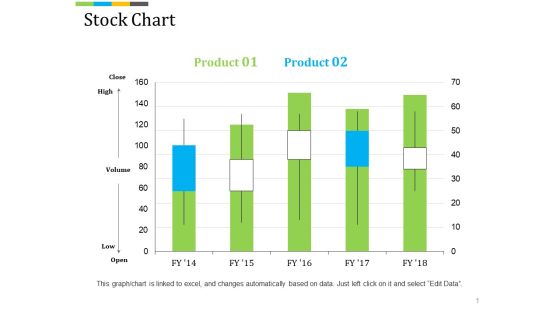
Stock Chart Ppt PowerPoint Presentation Professional Background Image
This is a stock chart ppt powerpoint presentation professional background image. This is a five stage process. The stages in this process are high, volume, low, finance, business, marketing.

Stock Chart Ppt PowerPoint Presentation Summary File Formats
This is a stock chart ppt powerpoint presentation summary file formats. This is a five stage process. The stages in this process are high, volume, low, business, graph, finance.

Column Chart Ppt PowerPoint Presentation Show Master Slide
This is a column chart ppt powerpoint presentation show master slide. This is a six stage process. The stages in this process are financial, years, business, marketing, finance, graph.
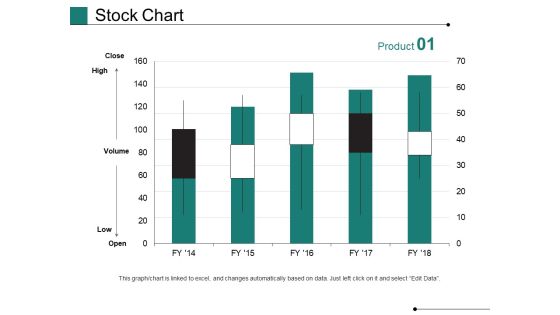
Stock Chart Ppt PowerPoint Presentation Pictures Graphics Design
This is a stock chart ppt powerpoint presentation pictures graphics design. This is a five stage process. The stages in this process are high, volume, low, business, marketing, graph.

Scatter Bubble Chart Ppt PowerPoint Presentation Gallery Example Introduction
This is a scatter bubble chart ppt powerpoint presentation gallery example introduction. This is a eight stage process. The stages in this process are business, marketing, finance, bubble, scatter.
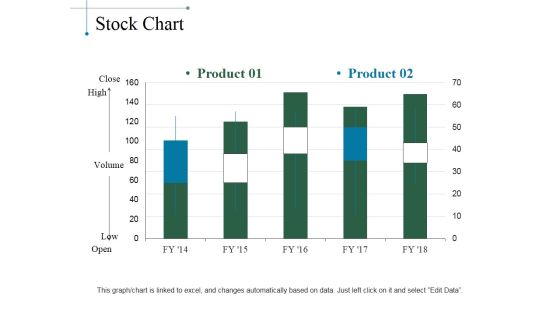
Stock Chart Ppt PowerPoint Presentation Layouts Designs Download
This is a stock chart ppt powerpoint presentation layouts designs download. This is a five stage process. The stages in this process are product, close, high, volume, low, open.

Volume High Low Close Chart Ppt PowerPoint Presentation Slides Styles
This is a volume high low close chart ppt powerpoint presentation slides styles. This is a two stage process. The stages in this process are high, volume, low, business, marketing.
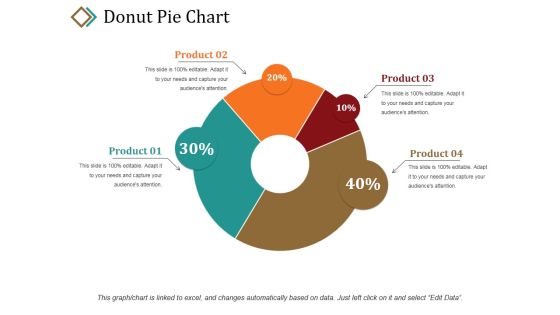
Donut Pie Chart Ppt PowerPoint Presentation Portfolio Graphic Tips
This is a donut pie chart ppt powerpoint presentation portfolio graphic tips. This is a four stage process. The stages in this process are product, percentage, business, marketing, donut.

Clustered Column Chart Ppt PowerPoint Presentation Show Slideshow
This is a clustered column chart ppt powerpoint presentation show slideshow. This is a six stage process. The stages in this process are financial year in, sales in percentage, business, marketing, finance.
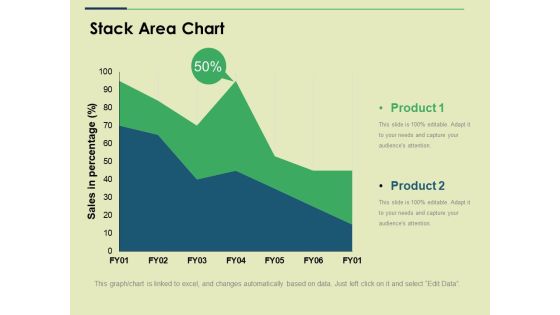
Stack Area Chart Ppt PowerPoint Presentation Show Slide
This is a stack area chart ppt powerpoint presentation show slide. This is a two stage process. The stages in this process are sales in percentage, business, marketing, strategy, graph.
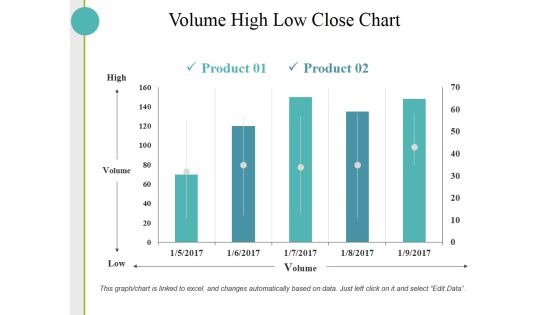
Volume High Low Close Chart Ppt PowerPoint Presentation Inspiration Skills
This is a volume high low close chart ppt powerpoint presentation inspiration skills. This is a two stage process. The stages in this process are high, volume, low, business.

Scatter Bubble Chart Ppt PowerPoint Presentation Gallery Show
This is a scatter bubble chart ppt powerpoint presentation gallery show. This is a two stage process. The stages in this process are profit, in percentage, finance, marketing, business.

Area Chart Ppt PowerPoint Presentation Portfolio Graphics Design
This is a area chart ppt powerpoint presentation portfolio graphics design. This is a two stage process. The stages in this process are business, marketing, in percentage, graph, finance.
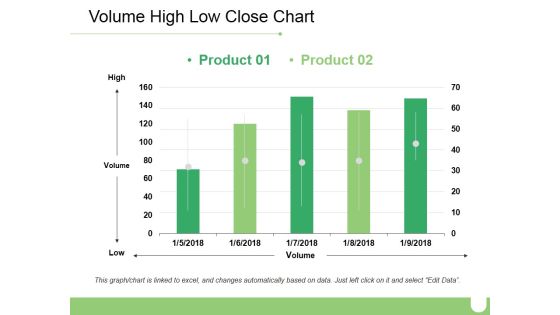
Volume High Low Close Chart Ppt PowerPoint Presentation Inspiration Brochure
This is a volume high low close chart ppt powerpoint presentation inspiration brochure. This is a two stage process. The stages in this process are business, high, volume, low, marketing.
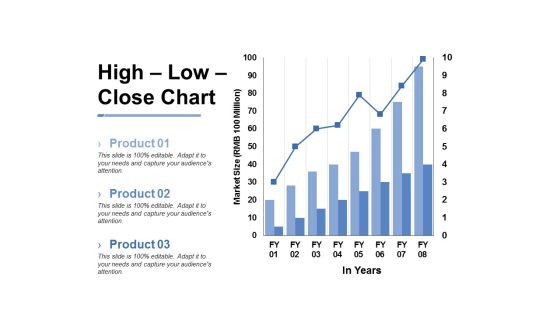
High Low Close Chart Ppt PowerPoint Presentation Inspiration Slide
This is a high low close chart ppt powerpoint presentation inspiration slide. This is a three stage process. The stages in this process are business, marketing, market size, in years, graph.
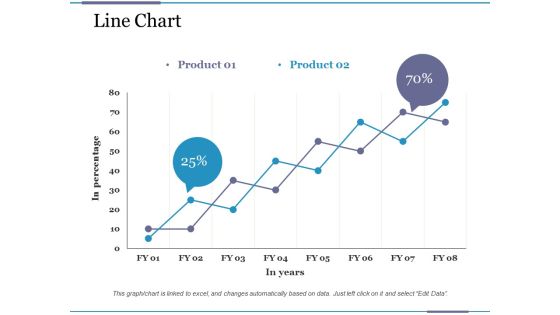
Line Chart Ppt PowerPoint Presentation Pictures File Formats
This is a line chart ppt powerpoint presentation pictures file formats. This is a two stage process. The stages in this process are business, financial, in percentage, in years, graph.

Donut Pie Chart Ppt PowerPoint Presentation Visual Aids Model
This is a donut pie chart ppt powerpoint presentation visual aids model. This is a four stage process. The stages in this process are product, percentage, finance, donut, business.

Column Chart Ppt PowerPoint Presentation Layouts Graphic Images
This is a column chart ppt powerpoint presentation layouts graphic images. This is a two stage process. The stages in this process are business, finance, years, graph, expenditure in, marketing.

Combo Chart Ppt PowerPoint Presentation Gallery Design Ideas
This is a combo chart ppt powerpoint presentation gallery design ideas. This is a three stage process. The stages in this process are business, financial years, sales in percentage, finance, graph.

Donut Pie Chart Ppt PowerPoint Presentation Pictures Layout Ideas
This is a donut pie chart ppt powerpoint presentation pictures layout ideas. This is a four stage process. The stages in this process are percentage, finance, donut, business, product.

Combo Chart Ppt PowerPoint Presentation Summary Background Images
This is a combo chart ppt powerpoint presentation summary background images. This is a two stage process. The stages in this process are business, marketing, financial year, in percentage, graph.

Area Chart Ppt PowerPoint Presentation Layouts Graphic Images
This is a area chart ppt powerpoint presentation layouts graphic images. This is a three stage process. The stages in this process are business, in years, marketing, in percentage, finance, graph.
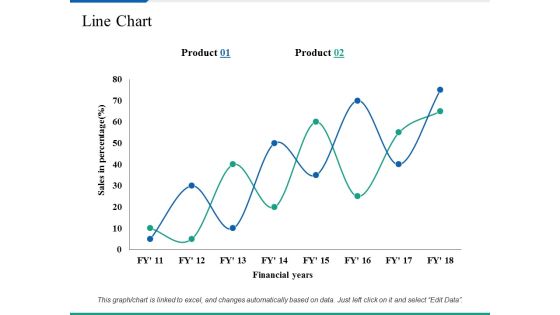
Line Chart Ppt PowerPoint Presentation Summary Clipart Images
This is a line chart ppt powerpoint presentation summary clipart images. This is a two stage process. The stages in this process are business, marketing, sales in percentage, financial years, strategy.
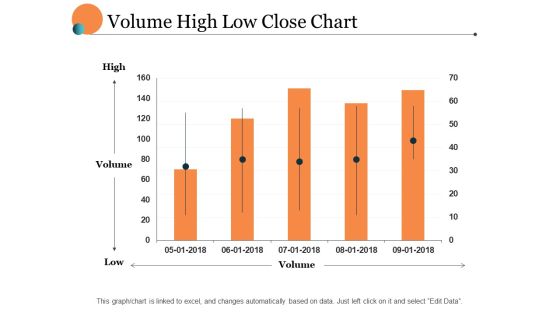
Volume High Low Close Chart Ppt PowerPoint Presentation Portfolio Layout
This is a volume high low close chart ppt powerpoint presentation portfolio layout. This is a five stage process. The stages in this process are finance, marketing, management, investment, analysis.

Clustered Column Chart Ppt PowerPoint Presentation Professional Ideas
This is a clustered column chart ppt powerpoint presentation professional ideas. This is a three stage process. The stages in this process are product, sales in percentage, column, years.
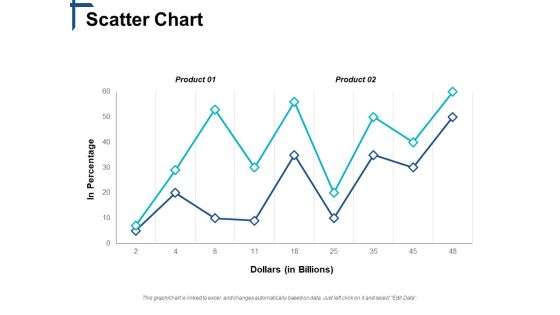
Scatter Chart Competitive Differentiation Ppt PowerPoint Presentation Show Slides
This is a scatter chart competitive differentiation ppt powerpoint presentation show slides. This is a two stage process. The stages in this process are business, management, marketing, strategy, sales.
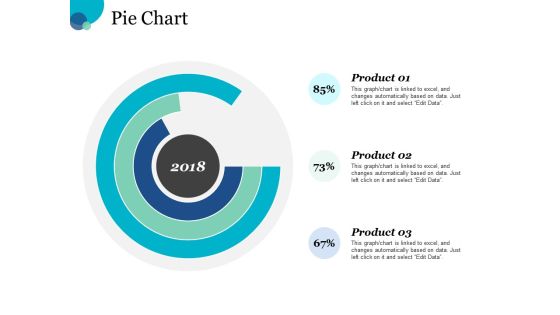
Pie Chart Finance Ppt PowerPoint Presentation Slides Graphic Images
This is a pie chart finance ppt powerpoint presentation slides graphic images. This is a three stage process. The stages in this process are finance, marketing, management, investment, analysis.

Pie Chart Finance Ppt PowerPoint Presentation Styles File Formats
This is a pie chart finance ppt powerpoint presentation styles file formats. This is a four stage process. The stages in this process are finance, analysis, business, investment, marketing.

Pie Chart Marketing Finance Ppt PowerPoint Presentation Gallery Good
This is a pie chart marketing finance ppt powerpoint presentation gallery good. This is a three stage process. The stages in this process are finance, analysis, business, investment, marketing.

Donut Pie Chart Finance Ppt PowerPoint Presentation Inspiration Graphics
This is a donut pie chart finance ppt powerpoint presentation inspiration graphics. This is a three stage process. The stages in this process are finance, analysis, business, investment, marketing.
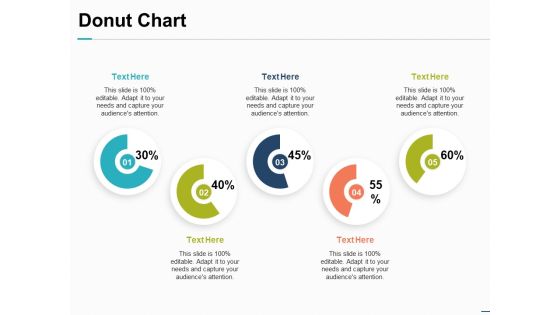
Donut Chart Financial Investment Ppt PowerPoint Presentation Inspiration Introduction
This is a donut chart financial investment ppt powerpoint presentation inspiration introduction. This is a five stage process. The stages in this process are finance, marketing, management, investment, analysis.

Area Chart Investment Ppt PowerPoint Presentation Summary Design Inspiration
This is a area chart investment ppt powerpoint presentation summary design inspiration. This is a three stage process. The stages in this process are finance, marketing, management, investment, analysis.
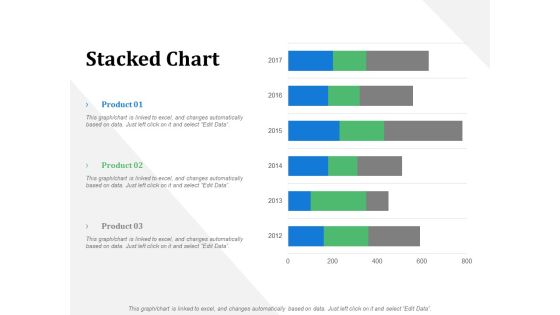
Stacked Chart Business Marketing Ppt PowerPoint Presentation File Design Ideas
This is a stacked chart business marketing ppt powerpoint presentation file design ideas. This is a three stage process. The stages in this process are business, management, marketing, product, percentage.

Donut Chart Marketing Product Ppt PowerPoint Presentation Slides Background Designs
This is a donut chart marketing product ppt powerpoint presentation slides background designs. This is a three stage process. The stages in this process are business, management, marketing, percentage, product.

Combo Chart Finance Marketing Ppt PowerPoint Presentation File Guidelines
This is a combo chart finance marketing ppt powerpoint presentation file guidelines. This is a three stage process. The stages in this process are finance, analysis, business, investment, marketing.
 Home
Home