Improvement Chart

Area Chart Ppt PowerPoint Presentation Inspiration Background Designs
This is a area chart ppt powerpoint presentation inspiration background designs. This is a two stage process. The stages in this process are business, sales in percentage, area chart, marketing, finance.

filled radar chart ppt powerpoint presentation ideas brochure
This is a filled radar chart ppt powerpoint presentation ideas brochure. This is a two stage process. The stages in this process are radar chart, finance, analysis, business, marketing, strategy.

Area Chart Ppt PowerPoint Presentation Layouts Background Designs
This is a area chart ppt powerpoint presentation layouts background designs. This is a two stage process. The stages in this process are business, marketing, in percentage, area chart, finance.
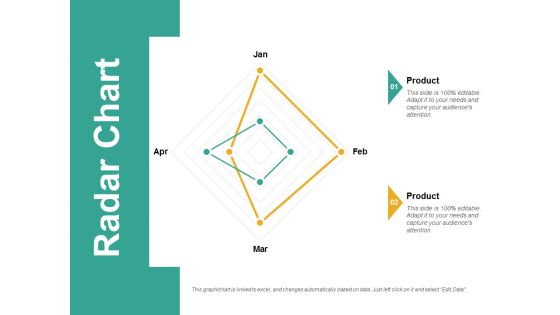
Radar Chart Ppt PowerPoint Presentation Visual Aids Professional
This is a radar chart ppt powerpoint presentation visual aids professional. This is a two stage process. The stages in this process are radar chart, finance, marketing, strategy, business.

Combo Chart Ppt PowerPoint Presentation Inspiration Slide Download
This is a combo chart ppt powerpoint presentation inspiration slide download. This is a two stage process. The stages in this process are Combo chart, finance, marketing, strategy, analysis.
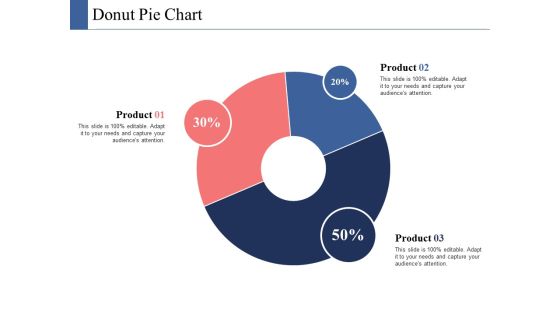
Donut Pie Chart Ppt PowerPoint Presentation Infographics Ideas
This is a donut pie chart ppt powerpoint presentation infographics ideas. This is a three stage process. The stages in this process are donut pie chart, finance, marketing, strategy, analysis.
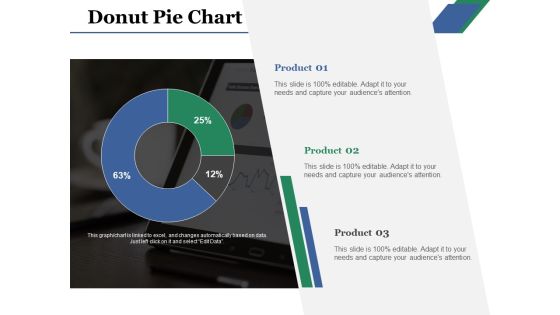
Donut Pie Chart Ppt PowerPoint Presentation Gallery Gridlines
This is a donut pie chart ppt powerpoint presentation gallery gridlines. This is a three stage process. The stages in this process are donut pie chart, product, business, management, analysis.

Area Chart Finance Ppt PowerPoint Presentation Show Visual Aids
This is a area chart finance ppt powerpoint presentation show visual aids. This is a two stage process. The stages in this process are area chart, business, finance, investment, strategy.

Column Chart Finance Ppt PowerPoint Presentation Infographics Backgrounds
This is a column chart finance ppt powerpoint presentation infographics backgrounds. This is a two stage process. The stages in this process are column chart, investment, marketing, finance, analysis.
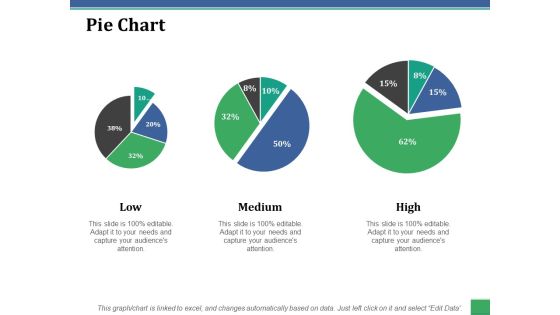
Pie Chart Ppt PowerPoint Presentation File Graphics Download
This is a pie chart ppt powerpoint presentation file graphics download. This is a three stage process. The stages in this process are low, medium, high, pie chart, finance.
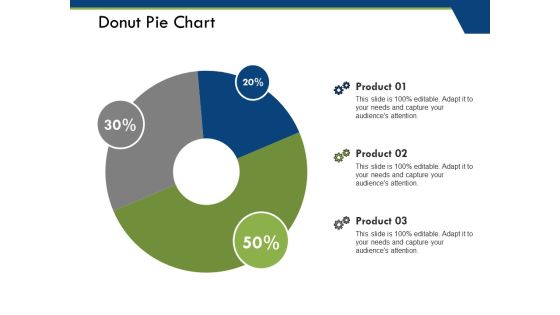
Donut Pie Chart Ppt PowerPoint Presentation Pictures File Formats
This is a donut pie chart ppt powerpoint presentation pictures file formats. This is a three stage process. The stages in this process are product, donut pie chart, percentage, business, marketing.
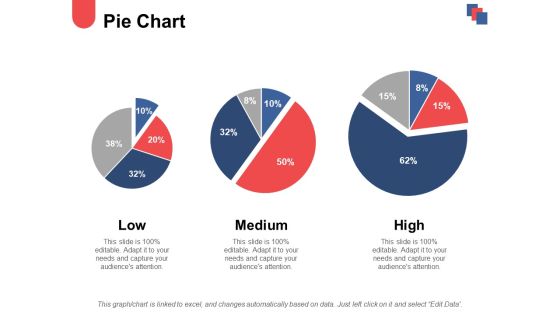
Pie Chart And Finance Ppt PowerPoint Presentation Ideas Demonstration
This is a pie chart and finance ppt powerpoint presentation ideas demonstration. This is a three stage process. The stages in this process are low, medium, high, pie chart, finance.

Area Chart Finance Ppt PowerPoint Presentation Show Brochure
This is a area chart finance ppt powerpoint presentation show brochure. This is a two stage process. The stages in this process are area chart, finance, marketing, management, investment.

Clustered Column Chart Ppt PowerPoint Presentation Model Deck
This is a clustered column chart ppt powerpoint presentation model deck. This is a three stage process. The stages in this process are clustered column chart, product, finance, profit, business.
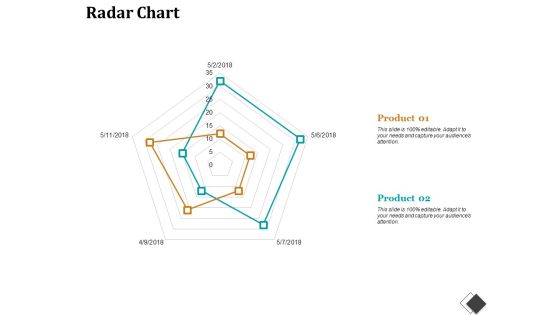
Radar Chart Enterprise Model Canvas Ppt PowerPoint Presentation File Slides
This is a radar chart enterprise model canvas ppt powerpoint presentation file slides. This is a two stage process. The stages in this process are radar chart, finance, marketing, strategy, business.

Bank Offerings Analysis Chart Ppt PowerPoint Presentation Slides Show
This is a bank offerings analysis chart ppt powerpoint presentation slides show. This is a five stage process. The stages in this process are comparison chart, comparison table, comparison matrix.

Customer Analysis Percentage Chart Ppt PowerPoint Presentation Infographics Master Slide
This is a customer analysis percentage chart ppt powerpoint presentation infographics master slide. This is a four stage process. The stages in this process are comparison chart, comparison table, comparison matrix.

Column Chart Ppt PowerPoint Presentation Layouts File Formats
This is a column chart ppt powerpoint presentation layouts file formats. This is a three stage process. The stages in this process are column chart, product, in percentage, year, finance.

Bubble Chart Ppt PowerPoint Presentation Summary Graphics Tutorials
This is a bubble chart ppt powerpoint presentation summary graphics tutorials. This is a three stage process. The stages in this process are product, sales in percentage, bubble chart.
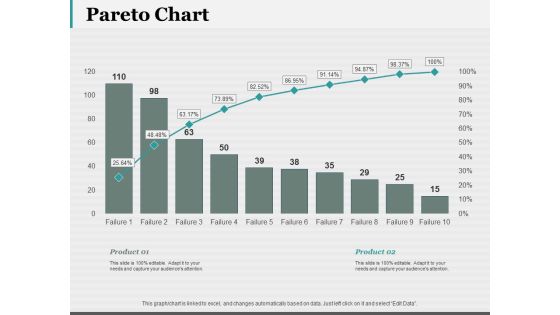
Pareto Chart Ppt PowerPoint Presentation Visual Aids Pictures
This is a pareto chart ppt powerpoint presentation visual aids pictures. This is a two stage process. The stages in this process are pareto chart, finance, marketing, strategy, business.

Bubble Chart Analysis Ppt PowerPoint Presentation Gallery Introduction
This is a bubble chart analysis ppt powerpoint presentation gallery introduction. This is a two stage process. The stages in this process are bubble chart, finance, marketing, strategy, business.

Column Chart Finance Ppt PowerPoint Presentation Model Examples
This is a column chart finance ppt powerpoint presentation model examples. This is a two stage process. The stages in this process are column chart, finance, marketing, analysis, investment.
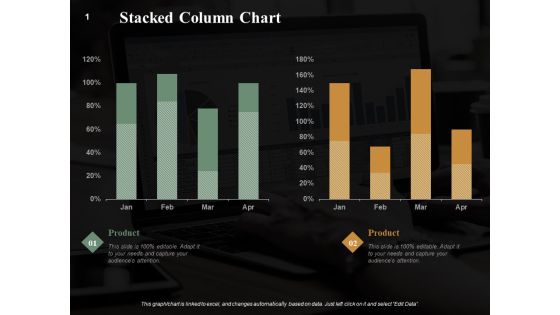
Stacked Column Chart Finance Ppt PowerPoint Presentation Summary Graphics Example
This is a stacked column chart finance ppt powerpoint presentation summary graphics example. This is a two stage process. The stages in this process are stacked column chart, marketing, analysis, business, investment.

Combo Chart Finance Ppt PowerPoint Presentation Ideas Microsoft
This is a combo chart finance ppt powerpoint presentation ideas microsoft. This is a three stage process. The stages in this process are combo chart, Finance, Analysis, Business, Investment.

Area Chart Investment Ppt PowerPoint Presentation Styles Topics
This is a area chart investment ppt powerpoint presentation styles topics. This is a three stage process. The stages in this process are area chart, finance, marketing, analysis, investment.

Product Comparison Chart Ppt Powerpoint Presentation Styles Background Designs
This is a product comparison chart ppt powerpoint presentation styles background designs. This is a two stage process. The stages in this process are comparison chart, comparison table, comparison matrix.

donut pie chart investment ppt powerpoint presentation show guide
This is a donut pie chart investment ppt powerpoint presentation show guide. This is a four stage process. The stages in this process are donut pie chart, finance, marketing, business, analysis.

Area Chart Finance Ppt Powerpoint Presentation Slides Picture
This is a area chart finance ppt powerpoint presentation slides picture. This is a three stage process. The stages in this process are area chart, finance, marketing, management, investment.

Area Chart Finance Ppt PowerPoint Presentation Infographics Slide
This is a area chart finance ppt powerpoint presentation infographics slide. This is a three stage process. The stages in this process are area chart, finance, marketing, analysis, investment.

Area Chart Finance Ppt Powerpoint Presentation Inspiration Example
This is a area chart finance ppt powerpoint presentation inspiration example. This is a three stage process. The stages in this process are area chart, finance, marketing, management, investment.

Combo Chart Finance Marketing Ppt Powerpoint Presentation Layouts Inspiration
This is a combo chart finance marketing ppt powerpoint presentation layouts inspiration. This is a three stage process. The stages in this process are combo chart, finance, marketing, management, analysis.

Hobbies Pie Chart Ppt PowerPoint Presentation Show Smartart
This is a hobbies pie chart ppt powerpoint presentation show smartart. This is a five stage process. The stages in this process are financial, business, marketing, management, pie chart.

Area Chart Investment Ppt PowerPoint Presentation Gallery Example Introduction
This is a area chart investment ppt powerpoint presentation gallery example introduction. This is a three stage process. The stages in this process are area chart, finance, marketing, management, investment.

Area Chart Percentage Ppt PowerPoint Presentation Portfolio Pictures
This is a area chart percentage ppt powerpoint presentation portfolio pictures. This is a three stage process. The stages in this process are area chart, finance, marketing, management, investment.

Area Chart Finance Marketing Ppt PowerPoint Presentation Gallery Styles
This is a area chart finance marketing ppt powerpoint presentation gallery styles. This is a three stage process. The stages in this process are area chart, finance, marketing, analysis, investment.

Area Chart Finance Ppt PowerPoint Presentation Pictures Clipart
This is a area chart finance ppt powerpoint presentation pictures clipart. This is a two stage process. The stages in this process are area chart, finance, marketing, analysis, investment.

Column Chart Ppt PowerPoint Presentation Infographic Template Graphics Tutorials
This is a column chart ppt powerpoint presentation infographic template graphics tutorials. This is a twelve stage process. The stages in this process are column chart, finance, marketing, strategy, investment, business.
Determine Scrum Release Burndown Chart Tool Icons PDF
This slide provides information regarding release burndown chart as scrum tool for monitoring scrum project progress. Deliver an awe inspiring pitch with this creative determine scrum release burndown chart tool icons pdf bundle. Topics like determines, work, team can be discussed with this completely editable template. It is available for immediate download depending on the needs and requirements of the user.

Pie Chart Investment Finance Ppt PowerPoint Presentation Outline Objects
Presenting this set of slides with name pie chart investment finance ppt powerpoint presentation outline objects. The topics discussed in these slides are pie chart, finance, analysis, business, investment, marketing. This is a completely editable PowerPoint presentation and is available for immediate download. Download now and impress your audience.

Bubble Chart Analysis Ppt PowerPoint Presentation Outline Smartart
Presenting this set of slides with name bubble chart analysis ppt powerpoint presentation outline smartart. The topics discussed in these slide is bubble chart. This is a completely editable PowerPoint presentation and is available for immediate download. Download now and impress your audience.
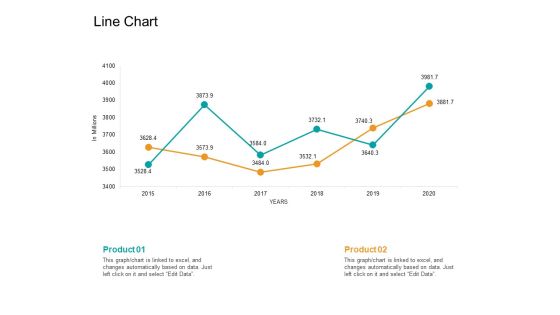
Facts Assessment Line Chart Ppt PowerPoint Presentation Outline Brochure PDF
Presenting this set of slides with name facts assessment line chart ppt powerpoint presentation outline brochure pdf. The topics discussed in these slide is line chart. This is a completely editable PowerPoint presentation and is available for immediate download. Download now and impress your audience.

Line Chart Ppt PowerPoint Presentation Visual Aids Pictures
This is a line chart ppt powerpoint presentation visual aids pictures. This is a three stage process. The stages in this process are business, marketing, line chart, analysis, growth.

Area Chart Ppt PowerPoint Presentation Inspiration Clipart Images
This is a area chart ppt powerpoint presentation inspiration clipart images. This is a two stage process. The stages in this process are area chart, growth, finance, business, strategy.

Area Chart Ppt PowerPoint Presentation Show Slide Portrait
This is a area chart ppt powerpoint presentation show slide portrait. This is a two stage process. The stages in this process are business, strategy, marketing, analysis, area chart.
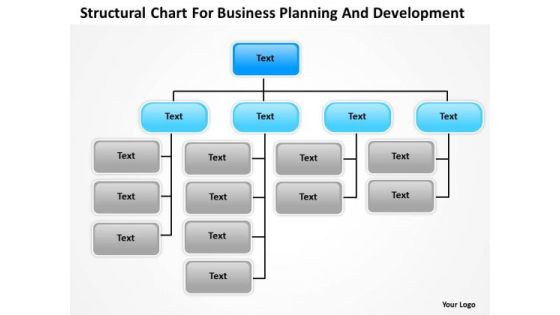
Timeline Structural Chart For Business Planning And Development
Our Timeline Structural Chart For Business Planning And Development give good value for money. They also have respect for the value of your time. Take a leap off the starting blocks with our Timeline Structural Chart For Business Planning And Development. They will put you ahead of the competition in quick time.

PowerPoint Presentation Success Business Process Chart Ppt Backgrounds
PowerPoint Presentation Success Business Process Chart PPT Backgrounds-Highlight the key components of your entire manufacturing/ business process. Illustrate how each element flows seamlessly onto the next stage. Emphasise on any critical or key factors within them. Demonstrate how they all combine to form the final product.-PowerPoint Presentation Success Business Process Chart PPT Backgrounds

10 Stages Converging Business PowerPoint Theme Process Radial Chart Slides
We present our 10 stages converging business powerpoint theme process Radial Chart Slides.Use our Arrows PowerPoint Templates because they help to lay the base of your trend of thought. Use our Flow charts PowerPoint Templates because this template with an image of helps you chart the course of your presentation. Download and present our Business PowerPoint Templates because the majestic tiger lord of all it surveys.It exudes power even when it is in repose. Present our Process and Flows PowerPoint Templates because you can Take your team along by explaining your plans. Present our Circle charts PowerPoint Templates because it is the time to bond with family, friends, colleagues and any other group of your choice.Use these PowerPoint slides for presentations relating to Business, chart, circle, colors, concept, corporate, cycle, data, design, detail, development, diagram, engineering, graphic, ideas, illustration, image, implement, implementation, life, lifecycle, management, model, objects, organization, plan, process, product, professional, project, quality, schema, shape, stack, stage, steps, strategy, structure, success, symbol. The prominent colors used in the PowerPoint template are Yellow, Black, Gray. You can be sure our 10 stages converging business powerpoint theme process Radial Chart Slides are Luxuriant. Presenters tell us our corporate PowerPoint templates and PPT Slides are effectively colour coded to prioritise your plans They automatically highlight the sequence of events you desire. We assure you our 10 stages converging business powerpoint theme process Radial Chart Slides are Efficient. Customers tell us our data PowerPoint templates and PPT Slides are One-of-a-kind. Presenters tell us our 10 stages converging business powerpoint theme process Radial Chart Slides are Stunning. You can be sure our cycle PowerPoint templates and PPT Slides are Lush.
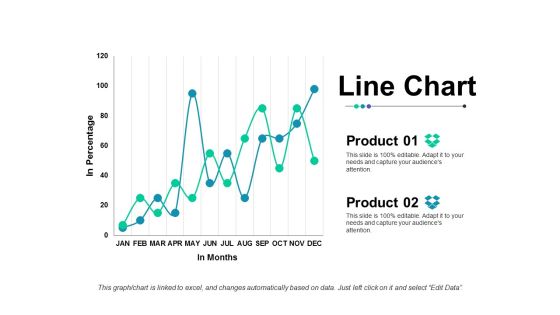
Line Chart Ppt Powerpoint Presentation Outline Slide Portrait
This is a line chart ppt powerpoint presentation outline slide portrait. This is a two stage process. The stages in this process are line chart, finance, strategy, business, analysis.

Business Process Chart With Key Takeaways Ppt Summary Files PDF
Pitch your topic with ease and precision using this business process chart with key takeaways ppt summary files pdf. This layout presents information on business process chart with key takeaways. It is also available for immediate download and adjustment. So, changes can be made in the color, design, graphics or any other component to create a unique layout.
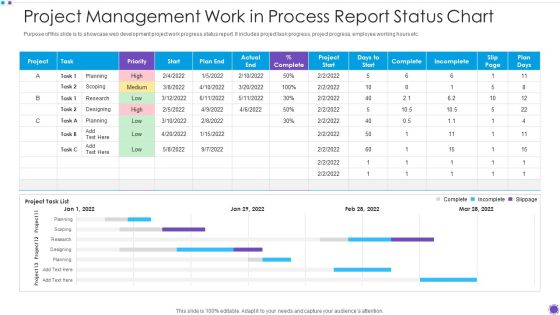
Project Management Work In Process Report Status Chart Microsoft PDF
Pitch your topic with ease and precision using this project management work in process report status chart microsoft pdf. This layout presents information on project management work in process report status chart. It is also available for immediate download and adjustment. So, changes can be made in the color, design, graphics or any other component to create a unique layout.

Work In Process Report Chart For Logistics Management Slides PDF
Pitch your topic with ease and precision using this work in process report chart for logistics management slides pdf. This layout presents information on work in process report chart for logistics management. It is also available for immediate download and adjustment. So, changes can be made in the color, design, graphics or any other component to create a unique layout.
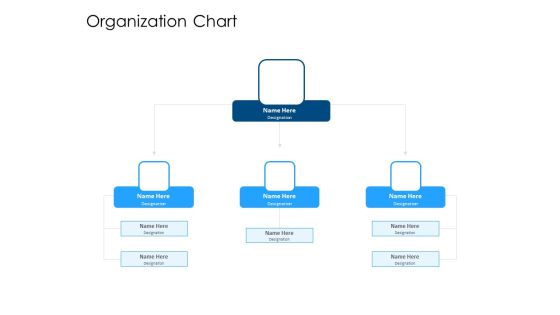
Developing Implementing Organization Marketing Promotional Strategies Organization Chart Microsoft PDF
This is a developing implementing organization marketing promotional strategies organization chart microsoft pdf template with various stages. Focus and dispense information on three stages using this creative set, that comes with editable features. It contains large content boxes to add your information on topics like organization chart. You can also showcase facts, figures, and other relevant content using this PPT layout. Grab it now.
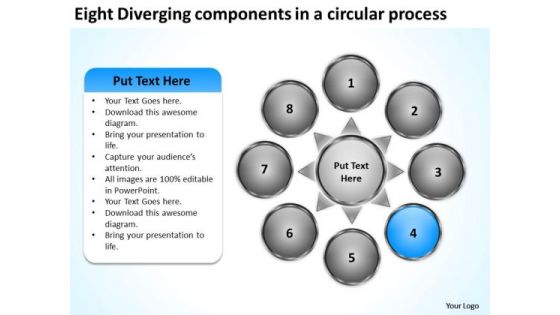
Eight Diverging Components A Circular Process Pie Chart PowerPoint Slides
We present our eight diverging components a circular process Pie Chart PowerPoint Slides.Download our Business PowerPoint Templates because this is the unerring accuracy in reaching the target. the effortless ability to launch into flight. Present our Circle Charts PowerPoint Templates because you have the entire picture in mind. Use our Arrows PowerPoint Templates because this template helps you to put your finger on the pulse of your business and sense the need to re-align a bit. Use our Shapes PowerPoint Templates because this can explain the various related aspects of these varied tracks and how they will, on hitting their own targets, cumulatively contribute to hitting GOLD. Download our Flow charts PowerPoint Templates because this is an appropriate layout to convince your team that they have the ability to score a tEN every time.Use these PowerPoint slides for presentations relating to Arrows, blank, business, central, centralized, chart, circle, circular, circulation concept, conceptual, converging, design, diagram, empty, executive, icon, idea illustration, management, map, mapping, moa, model, numbers, organization outwards, pointing, procedure, process, radial, radiating, relationship, resource sequence, sequential, seven, square, strategy, template. The prominent colors used in the PowerPoint template are Blue, Gray, White. Presenters tell us our eight diverging components a circular process Pie Chart PowerPoint Slides will save the presenter time. Presenters tell us our business PowerPoint templates and PPT Slides are Zippy. PowerPoint presentation experts tell us our eight diverging components a circular process Pie Chart PowerPoint Slides are Appealing. We assure you our chart PowerPoint templates and PPT Slides are Pleasant. Customers tell us our eight diverging components a circular process Pie Chart PowerPoint Slides are Gorgeous. People tell us our business PowerPoint templates and PPT Slides are the best it can get when it comes to presenting.

Help Desk Process Flow Chart For Consumer Service Pictures PDF
This slide contains information about steps followed by help desk to resolve customers queries without delay. It includes elements such as customers, help desk tech, automated systems, technical team, supervisor and supplier. Presenting Help Desk Process Flow Chart For Consumer Service Pictures PDF to dispense important information. This template comprises Six stages. It also presents valuable insights into the topics including Help Desk Process, Flow Chart, Consumer Service. This is a completely customizable PowerPoint theme that can be put to use immediately. So, download it and address the topic impactfully.
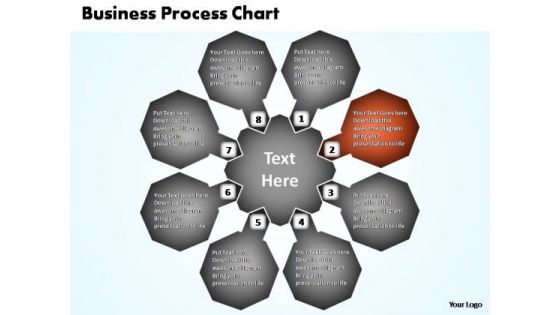
PowerPoint Process Diagram Business Process Chart Ppt Backgrounds
PowerPoint Process Diagram Business Process Chart PPT Backgrounds-Highlight the key components of your entire manufacturing/ business process. Illustrate how each element flows seamlessly onto the next stage. Emphasise on any critical or key factors within them. Demonstrate how they all combine to form the final product.-PowerPoint Process Diagram Business Process Chart PPT Backgrounds
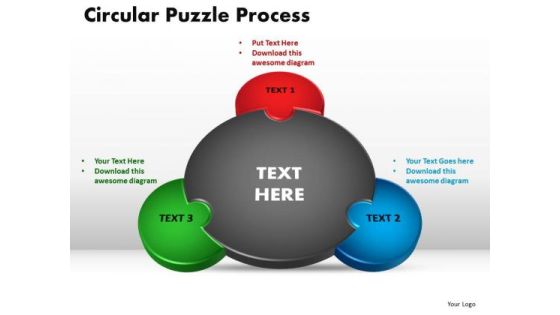
PowerPoint Layout Circular Puzzle Process Chart Ppt Design
PowerPoint Layout Circular Puzzle Process Chart PPT Design-Use this diagram to show the relationship to a central idea. Emphasizes on both information in the center circle and how information in the outer ring of circles contributes to the central idea.-PowerPoint Layout Circular Puzzle Process Chart PPT Design
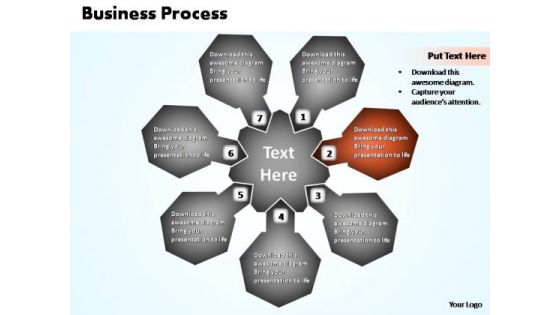
PowerPoint Process Global Business Process Chart Ppt Presentation
PowerPoint Process Global Business Process Chart PPT Presentation-Highlight the key components of your entire manufacturing/ business process. Illustrate how each element flows seamlessly onto the next stage. Emphasise on any critical or key factors within them. Demonstrate how they all combine to form the final product.-PowerPoint Process Global Business Process Chart PPT Presentation

Business Strategy Development Stage Circular Budget Management Chart Ppt Model
We present our business strategy development stage circular budget management chart ppt model.Use our Flow Charts PowerPoint Templates because It will let you Set new benchmarks with our PowerPoint Templates and Slides. They will keep your prospects well above par. Present our Business PowerPoint Templates because You should Kick up a storm with our PowerPoint Templates and Slides. The heads of your listeners will swirl with your ideas. Download and present our Process and Flows PowerPoint Templates because It will Give impetus to the hopes of your colleagues. Our PowerPoint Templates and Slides will aid you in winning their trust. Download and present our Circle Charts PowerPoint Templates because Our PowerPoint Templates and Slides will weave a web of your great ideas. They are gauranteed to attract even the most critical of your colleagues. Present our Shapes PowerPoint Templates because you should once Tap the ingenuity of our PowerPoint Templates and Slides. They are programmed to succeed.Use these PowerPoint slides for presentations relating to Act, arrow, blue, business, chart, check, circle, concept, control, cycle, design, development, diagram, do, engineering, evaluate, flow, flow-chart, flowchart, graphic, green, idea, info graphic, iterative, life-cycle, lifecycle, management, method, model, process, quality, research, schema, software, spiral, step, strategy, success, system, vector, white, work, workflow. The prominent colors used in the PowerPoint template are Pink, Gray, White.
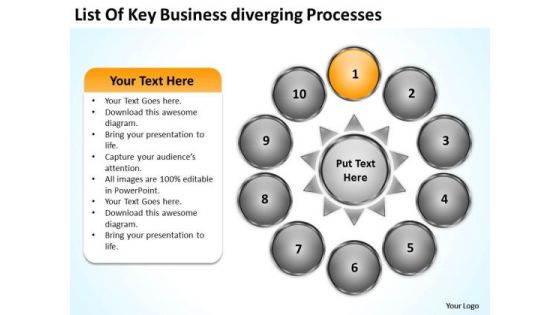
Nine Stages Diverging Factors Flow Chart Gear Diagram PowerPoint Slides
We present our nine stages diverging factors flow chart Gear Diagram PowerPoint Slides.Present our Circle charts PowerPoint Templates because you can put it up there for all to see. Download and present our Process and Flows PowerPoint Templates because you can Educate your team with the attention to be paid. Download our Shapes PowerPoint Templates because you can Churn the wheels of the brains of your colleagues. Download and present our Ring Charts PowerPoint Templates because they help to focus the thoughts of your listeners. Download our Signs PowerPoint Templates because they are logical, accurate and to the point.Use these PowerPoint slides for presentations relating to Access, arrow, background,banner, blue, bright, business, chart,circle, color, colorful, concept,conceptual, connection, corporate,creative, cycle, design, different, element,empty, form, frame, graphic, green,group, idea, illustration, match,message, order, part, piece, place,process, red, shape, solution, special,speech, strategy, symbol. The prominent colors used in the PowerPoint template are Yellow, White, Black. People tell us our nine stages diverging factors flow chart Gear Diagram PowerPoint Slides will make the presenter look like a pro even if they are not computer savvy. Customers tell us our chart PowerPoint templates and PPT Slides are Sparkling. Professionals tell us our nine stages diverging factors flow chart Gear Diagram PowerPoint Slides are Bright. Presenters tell us our circle PowerPoint templates and PPT Slides are Awesome. Use our nine stages diverging factors flow chart Gear Diagram PowerPoint Slides are readymade to fit into any presentation structure. Presenters tell us our circle PowerPoint templates and PPT Slides will help you be quick off the draw. Just enter your specific text and see your points hit home.
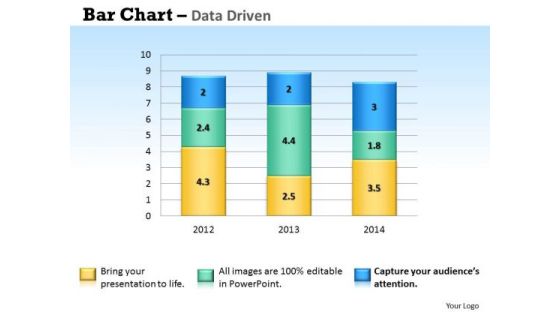
Microsoft Excel Data Analysis Bar Chart To Handle PowerPoint Templates
Our microsoft excel data analysis bar chart to handle Powerpoint Templates And Your Ideas Make A Great Doubles Pair. Play The Net With Assured Hands.

 Home
Home