Improvement Chart
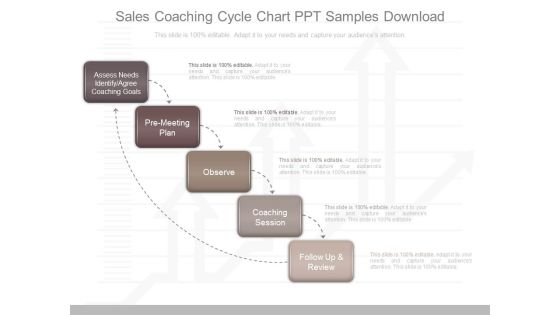
Sales Coaching Cycle Chart Ppt Samples Download
This is a sales coaching cycle chart ppt samples download. This is a five stage process. The stages in this process are assess needs identify agree coaching goals, pre meeting plan, observe, coaching session, follow up and review.
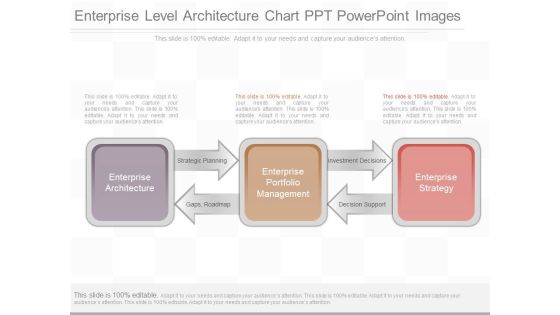
Enterprise Level Architecture Chart Ppt Powerpoint Images
This is a enterprise level architecture chart ppt powerpoint images. This is a three stage process. The stages in this process are enterprise architecture, strategic planning, gaps, roadmap, enterprise portfolio management, investment decisions, decision support, enterprise strategy.
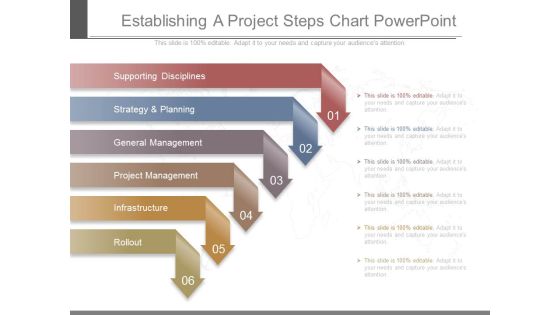
Establishing A Project Steps Chart Powerpoint
This is a establishing a project steps chart powerpoint. This is a six stage process. The stages in this process are supporting disciplines, strategy and planning, general management, project management, infrastructure, rollout.

Basic Accounting And Bookkeeping Chart Ppt Slides
This is a basic accounting and bookkeeping chart ppt slides. This is a five stage process. The stages in this process are financial statements, source documents, accounting cycle, journals, ledger, trial balance.

Financial Public Relations Arrows Chart Powerpoint Templates
This is a financial public relations arrows chart powerpoint templates. This is a five stage process. The stages in this process are investor relations, consumer relations, government relations, public relations, internal communications, crisis communications.

Banking Operations Management Chart Good Ppt Example
This is a banking operations management chart good ppt example. This is a seven stage process. The stages in this process are results, accountability, focused action, commitment, roles and responsibilities, communication and collaboration, trust.

Professional Retail Merchandising Chart Presentation Design
This is a professional retail merchandising chart presentation design. This is a seven stage process. The stages in this process are market trends, product assortment, individual product demand forecasting, product display and advertising, inventory, markdowns, purchase quantity, merchandising.
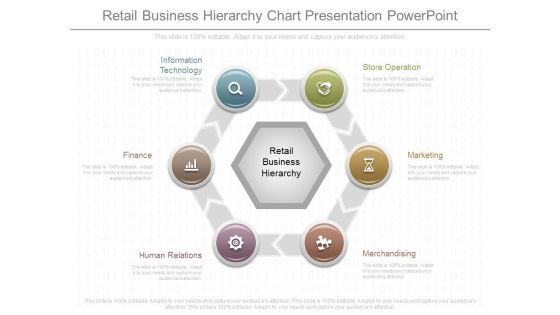
Retail Business Hierarchy Chart Presentation Powerpoint
This is a retail business hierarchy chart presentation powerpoint. This is a six stage process. The stages in this process are store operation, marketing, merchandising, human relations, finance, information technology.

Revenue And Expenditures Cycle Chart Ppt Design
This is a revenue and expenditures cycle chart ppt design. This is a four stage process. The stages in this process are cash check disbursement, cash check receipt journal, bank account, bank reconciliation.

Retail Merchandising Activities Chart Presentation Background Images
This is a retail merchandising activities chart presentation background images. This is a six stage process. The stages in this process are customer, print advertising, electronic advertising, marketing collateral, store displays, promotional activities, store images.
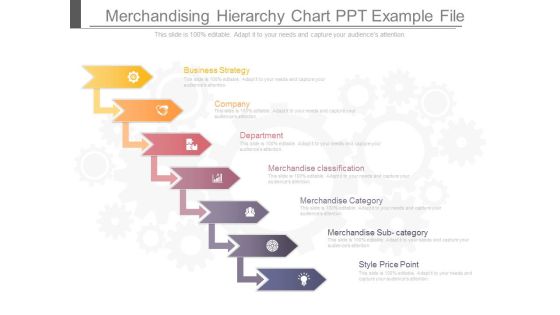
Merchandising Hierarchy Chart Ppt Example File
This is a merchandising hierarchy chart ppt example file. This is a seven stage process. The stages in this process are business strategy, company, department, merchandise classification, merchandise category, merchandise sub category, style price point.

Mutual Fund Flow Chart Ppt Presentation
This is a mutual fund flow chart ppt presentation. This is a four stage process. The stages in this process are passed back to, generates, pool their money with, invest in, returns, securities, fund manager, investors.
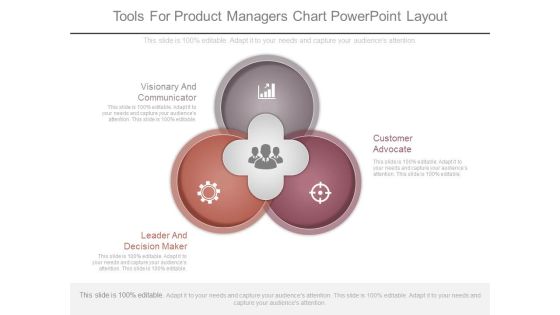
Tools For Product Managers Chart Powerpoint Layout
This is a tools for product managers chart powerpoint layout. This is a three stage process. The stages in this process are visionary and communicator, leader and decision maker, customer advocate.

Pricing Research Flow Chart Ppt Sample Download
This is a pricing research flow chart ppt sample download. This is a three stage process. The stages in this process are price customers are waiting to pay, price dictated by competition, optimal price, price for sustainability.

Professional Brand Management Chart Powerpoint Slides
This is a professional brand management chart powerpoint slides. This is a four stage process. The stages in this process are branding strategies, line extension, brand extension, new brands, multi branding.

Brand Equity Flow Chart Powerpoint Slides
This is a brand equity flow chart powerpoint slides. This is a five stage process. The stages in this process are brand equity, brand awareness, perceived quality, brand association, brand loyalty.

Financial Marketing Solutions Chart Presentation Ideas
This is a financial marketing solutions chart presentation ideas. This is a eight stage process. The stages in this process are direct deposits, e commerce, prepaid cards, bill payments, money orders, small loans, mobile transaction, international money transfer.

Financial Logistics Pyramid Chart Presentation Ideas
This is a financial logistics pyramid chart presentation ideas. This is a five stage process. The stages in this process are advice, risk management, liquidity management, cash flow management, payments and receivables.

Brand Building Circle Chart Ppt Example
This is a brand building circle chart ppt example. This is a seven stage process. The stages in this process are long term perspective, positioning, quality, well blended communication, credibility, internal marketing, repositioning, brand building.

Market Research Data Collection Chart Presentation
This is a market research data collection chart presentation. This is a five stage process. The stages in this process are concept testing, customer satisfaction, pricing research, market segmentation, awareness usage.
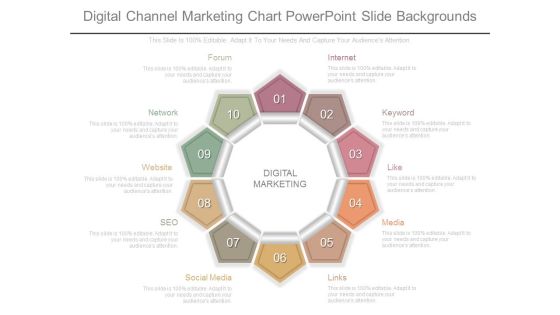
Digital Channel Marketing Chart Powerpoint Slide Backgrounds
This is a digital channel marketing chart powerpoint slide backgrounds. This is a ten stage process. The stages in this process are digital marketing, internet, keyword, like, media, links, social media, seo, website, network, forum.
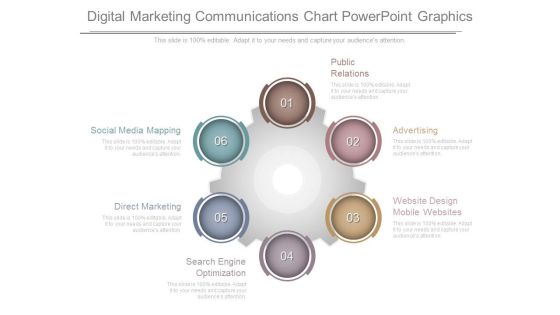
Digital Marketing Communications Chart Powerpoint Graphics
This is a digital marketing communications chart powerpoint graphics. This is a six stage process. The stages in this process are public relations, advertising, website design mobile websites, search engine optimization, direct marketing, social media mapping.

Customer Engagement Touch Points Chart Ppt Sample
This is a customer engagement touch points chart ppt sample. This is a seven stage process. The stages in this process are research, consider and evaluate, awareness, formal rfp, use and service, buy, loyalty repurchase.

Goal Chart Layout Example Of Ppt Presentation
This is a goal chart layout example of ppt presentation. This is a seven stage process. The stages in this process are clear description, how to measure, can i do it, level of effort, start end date, smart goal, research.

Sales Channel Strategy Chart Powerpoint Show
This is a sales channel strategy chart powerpoint show. This is a four stage process. The stages in this process are channel integration, better offer, channel selection, more front of mind.

Procurement Flow Chart Presentation Powerpoint Example
This is a procurement flow chart presentation powerpoint example. This is a four stage process. The stages in this process are procurement, epayments, order products and services, receive products.

Conversion Funnel Optimization Chart Powerpoint Idea
This is a conversion funnel optimization chart powerpoint idea. This is a seven stage process. The stages in this process are viewers, question, website visitors, sales, interest, purchase, qualified inquiries.
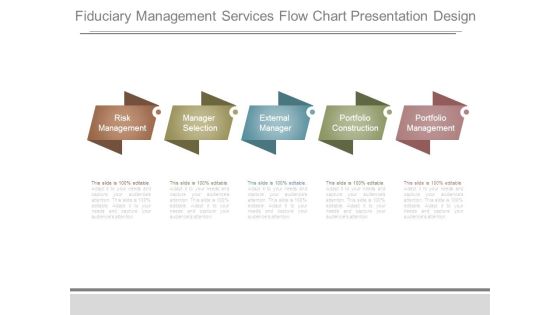
Fiduciary Management Services Flow Chart Presentation Design
This is a fiduciary management services flow chart presentation design. This is a five stage process. The stages in this process are risk management, manager selection, external manager, portfolio construction, portfolio management.

International Portfolio Functions Chart Ppt Examples Professional
This is a international portfolio functions chart ppt examples professional. This is a five stage process. The stages in this process are value, tools for cash, human capital, alignment, balance.
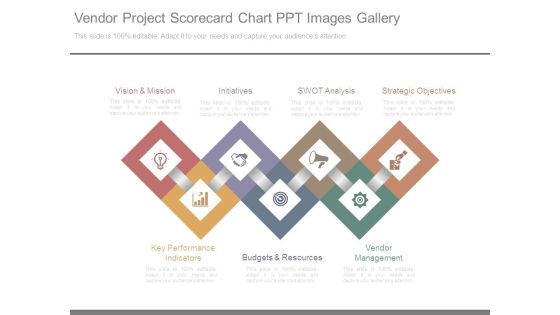
Vendor Project Scorecard Chart Ppt Images Gallery
This is a vendor project scorecard chart ppt images gallery. This is a seven stage process. The stages in this process are vision and mission, initiatives, swot analysis, strategic objectives, vendor management, budgets and resources, key performance indicators.

Employee Life Cycle Chart Powerpoint Templates Microsoft
This is a employee life cycle chart powerpoint templates microsoft. This is a six stage process. The stages in this process are training, appraisal, payroll run, attendance, separation, manage performance.

Business To Business Sales Chart Presentation Images
This is a business to business sales chart presentation images. This is a six stage process. The stages in this process are your business, marketing, reactive existing customers, culture, reach new customers, sales.

Business Economic Cycle Chart Ppt Templates
This is a business economic cycle chart ppt templates. This is a four stage process. The stages in this process are economic prosperity, falling prices, economic depression, rising prices.

Key Communications Activities Chart Layout Powerpoint Slides
This is a key communications activities chart layout powerpoint slides. This is a five stage process. The stages in this process are start of project, cost effective, equal and inclusive, clearly branded, end of project.

Business Assessment Ppt Chart Powerpoint Slides Show
This is a business assessment ppt chart powerpoint slides show. This is a six stage process. The stages in this process are mission, goals, objectives, outcomes, result analysis, action.
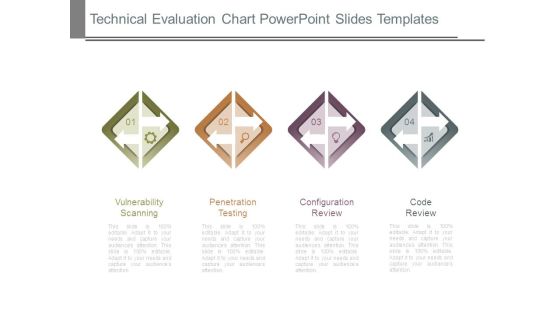
Technical Evaluation Chart Powerpoint Slides Templates
This is a technical evaluation chart powerpoint slides templates. This is a four stage process. The stages in this process are vulnerability scanning, penetration testing, configuration review, code review.

Project Issues Description Chart Powerpoint Slide Graphics
This is a project issues description chart powerpoint slide graphics. This is a seven stage process. The stages in this process are issue description, reported on, reported by, owner, severity, priority, status.

Project Issues Infogarphic Chart Ppt Examples Slides
This is a project issues infogarphic chart ppt examples slides. This is a seven stage process. The stages in this process are issue description, reported on, reported by, owner, severity, priority, status.

Competitive Analysis Table Chart Powerpoint Guide
This is a competitive analysis table chart powerpoint guide. This is a twelve stage process. The stages in this process are jan,feb, mar, apr, may, jun, jul, aug, sep, oct, nov, dec.

Partner Sales Cloud Infographic Chart Powerpoint Graphics
This is a partner sales cloud infographic chart powerpoint graphics. This is a six stage process. The stages in this process are news and events, marketing literature, sales tools, channel incentives, product promotions, deal registration.
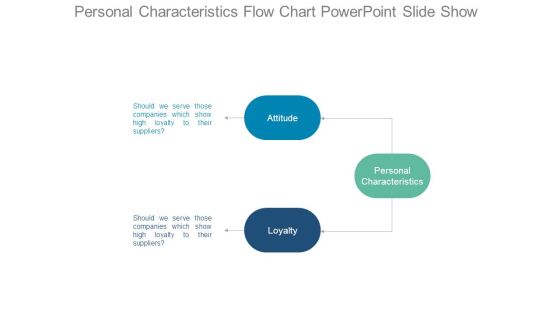
Personal Characteristics Flow Chart Powerpoint Slide Show
This is a personal characteristics flow chart powerpoint slide show. This is a three stage process. The stages in this process are should we serve those companies which show high loyalty to their suppliers, attitude, loyalty, personal characteristics.

Competitive Analysis Matrix Chart Ppt Samples Download
This is a competitive analysis matrix chart ppt samples download. This is a six stage process. The stages in this process are competitor, jan, feb, mar, apr, may, jun, jul, aug, sep, oct, nov, dec.
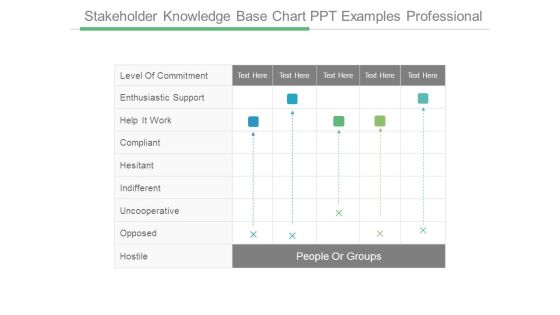
Stakeholder Knowledge Base Chart Ppt Examples Professional
This is a stakeholder knowledge base chart ppt examples professional. This is a five stage process. The stages in this process are people or groups, level of commitment, enthusiastic support, help it work, compliant, hesitant, indifferent, uncooperative, opposed, hostile.
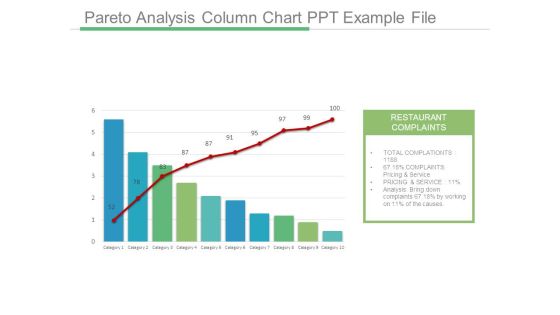
Pareto Analysis Column Chart Ppt Example File
This is a pareto analysis column chart ppt example file. This is a ten stage process. The stages in this process are restaurant complaints, total complaints, complaints pricing and service, pricing and service, analysis bring down complaints, category.
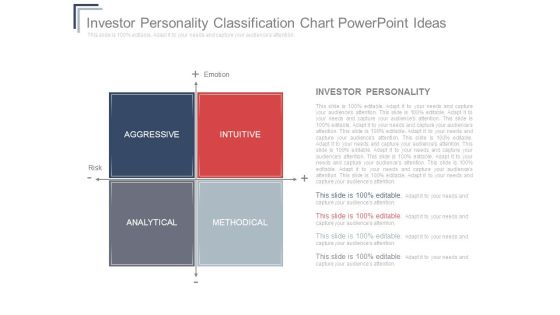
Investor Personality Classification Chart Powerpoint Ideas
This is a investor personality classification chart powerpoint ideas. This is a four stage process. The stages in this process are aggressive, intuitive, analytical, methodical, emotion, risk, investor personality.

Business Model Canvas Chart Ppt Images
This is a business model canvas chart ppt images. This is a five stage process. The stages in this process are key partners, key activities, value propositions, customer relationships, customer segments, key resources, channels, cost structure, revenue streams.

Customer Experience Survey Chart Powerpoint Templates Download
This is a customer experience survey chart powerpoint templates download. This is a four stage process. The stages in this process are satisfy unstated, customer needs, achieve customer delight, meet basic, customer requirements.

Organizational Design Chart Ppt Samples Download
This is a organizational design chart ppt samples download. This is a five stage process. The stages in this process are owners, stockholders and shareholders, board of directors president, chief, executive officer ceo, senior vice president.

Digital Marketing Roadmap Gantt Chart Ppt Slide
This is a digital marketing roadmap gantt chart ppt slide. This is a five stage process. The stages in this process are content, paid organic search, email marketing, social media.

Business Model Canvas Chart Example Ppt Presentation
This is a business model canvas chart example ppt presentation. This is a five stage process. The stages in this process are key partners, key activities, value propositions, customer relationships, customer segments, key resources, channels, cost structure, revenue streams.

New Business Model Chart Presentation Powerpoint Example
This is a new business model chart presentation powerpoint example. This is a five stage process. The stages in this process are key partners, key activities, value propositions, customer, relationships, customer segments, key resources, channels, cost structure, revenue streams.

Customer Revenue Statistical Chart Powerpoint Templates Microsoft
This is a customer revenue statistical chart powerpoint templates microsoft. This is a ten stage process. The stages in this process are email, display retargeting, comparison shopping, display, affiliates, inbound free links, brand organic search, brand paid search.
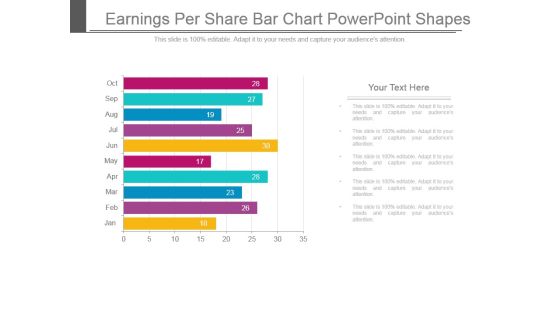
Earnings Per Share Bar Chart Powerpoint Shapes
This is a earnings per share bar chart powerpoint shapes. This is a ten stage process. The stages in this process are jan, feb, mar, apr, may, jun, jul, aug, sep, oct.

Competitor Analysis Chart Ppt PowerPoint Presentation Visuals
This is a competitor analysis chart ppt powerpoint presentation visuals. This is a five stage process. The stages in this process are revenue, profit, market share, main activity, number of employee, product quality.
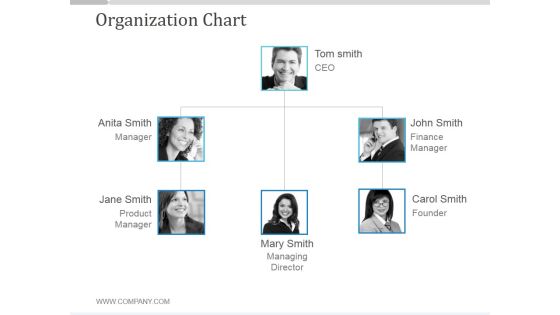
Organization Chart Ppt PowerPoint Presentation Backgrounds
This is a organization chart ppt powerpoint presentation backgrounds. This is a three stage process. The stages in this process are tom smith ceo, john smith finance manager, john smith finance manager, john smit finance manager.

Hierarchy Chart Ppt PowerPoint Presentation Ideas
This is a hierarchy chart ppt powerpoint presentation ideas. This is a three stage process. The stages in this process are peter smith, anita dross, carol taren, marry dsouza, even worsen.
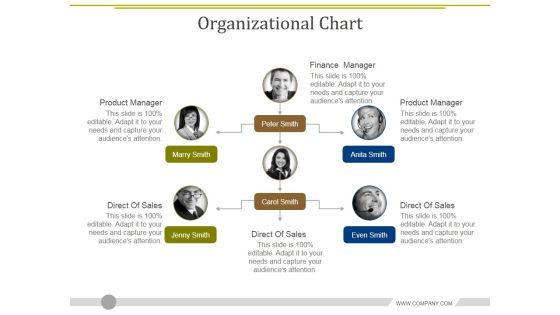
Organizational Chart Ppt PowerPoint Presentation Layouts Demonstration
This is a organizational chart ppt powerpoint presentation layouts demonstration. This is a six stage process. The stages in this process are finance manager, product manager, direct of sales, direct of sales, direct of sales.
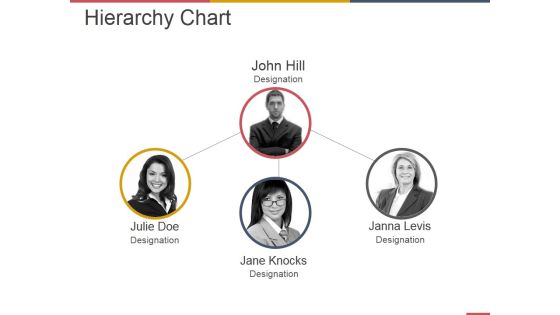
Hierarchy Chart Ppt PowerPoint Presentation Model Maker
This is a hierarchy chart ppt powerpoint presentation model maker. This is a four stage process. The stages in this process are business, strategy, marketing, communication, work management, teamwork.
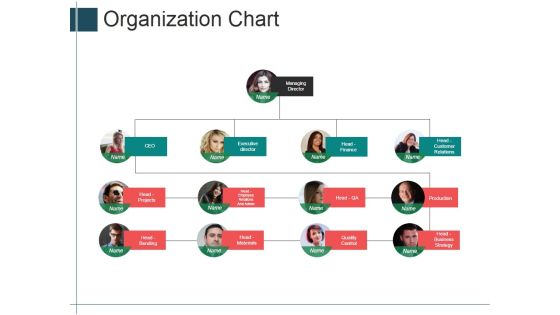
Organization Chart Ppt PowerPoint Presentation Portfolio Shapes
This is a organization chart ppt powerpoint presentation portfolio shapes. This is a four stage process. The stages in this process are managing director, executive director, head finance, head projects.
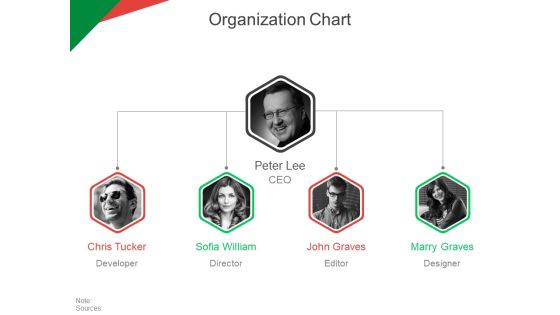
Organization Chart Ppt PowerPoint Presentation Ideas Tips
This is a organization chart ppt powerpoint presentation ideas tips. This is a four stage process. The stages in this process are peter lee, john graves, marry graves, sofia william, chris tucker.

Area Chart Ppt PowerPoint Presentation Pictures Files
This is a area chart ppt powerpoint presentation pictures files. This is a two stage process. The stages in this process are product, sales, in percentage, financial year, business.

Scatter Chart Ppt PowerPoint Presentation Summary Visuals
This is a scatter chart ppt powerpoint presentation summary visuals. This is a eight stage process. The stages in this process are product, profit in sales, in percentage, finance, business.

Organization Chart Ppt PowerPoint Presentation Gallery Ideas
This is a organization chart ppt powerpoint presentation gallery ideas. This is a four stage process. The stages in this process are managing director, ceo, head projects, head bending.

Bar Chart Ppt PowerPoint Presentation Ideas Deck
This is a bar chart ppt powerpoint presentation ideas deck. This is a two stage process. The stages in this process are product, in percentage, in years, financial, business.
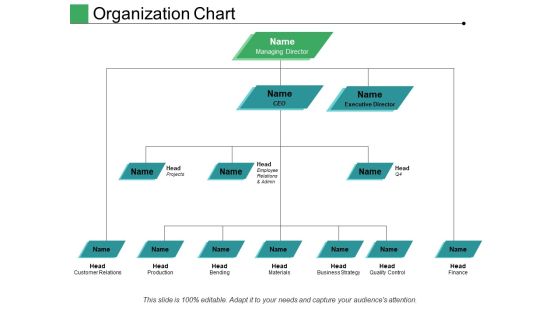
Organization Chart Ppt PowerPoint Presentation Pictures Structure
This is a organization chart ppt powerpoint presentation pictures structure. This is a three stage process. The stages in this process are managing director, executive director, head, ceo, finance.
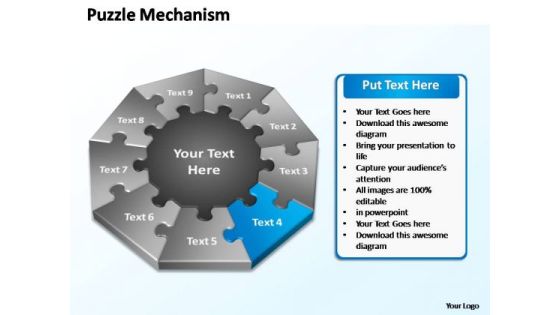
PowerPoint Layout Chart Puzzle Mechanism Ppt Slide
PowerPoint Layout Chart Puzzle Mechanism PPT Slide-The basic stages are in place. Various threads are joining up and being stitched together providing necessary strength Now you have to take the last leap. Illustrate your ideas and imprint them in the minds of your team with this template. Feel the buzz as they comprehend your plan to get the entire act together. Watch their eyes light up with enthusiasm as they see the dream emerge.-PowerPoint Layout Chart Puzzle Mechanism PPT Slide
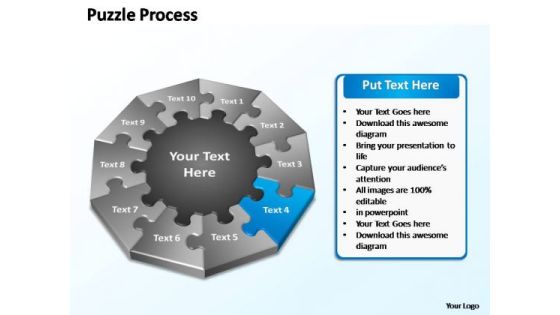
PowerPoint Presentation Chart Puzzle Business Ppt Template
PowerPoint Presentation Chart Puzzle Business PPT Template-The basic stages are in place. Various threads are joining up and being stitched together providing necessary strength Now you have to take the last leap. Illustrate your ideas and imprint them in the minds of your team with this template. Feel the buzz as they comprehend your plan to get the entire act together. Watch their eyes light up with enthusiasm as they see the dream emerge.-PowerPoint Presentation Chart Puzzle Business PPT Template

Project Management Implementation Management Chart Microsoft PDF
This slide project management implementation planning chart illustrating project area such as project management, project planning, status update, infrastructure etc that helps in over viewing tasks and estimating a project. Showcasing this set of slides titled Project Management Implementation Management Chart Microsoft PDF. The topics addressed in these templates are Retail, Finance, System. All the content presented in this PPT design is completely editable. Download it and make adjustments in color, background, font etc. as per your unique business setting.
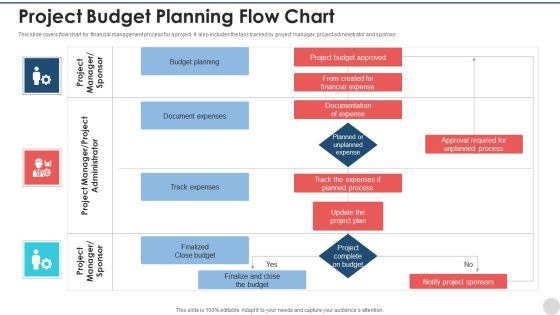
Project Budget Planning Flow Chart Inspiration PDF
This slide covers flow chart for financial management process for a project. It also includes the task tracked by project manager, project administrator and sponsor. Showcasing this set of slides titled project budget planning flow chart inspiration pdf. The topics addressed in these templates are budget planning, document expenses, track expenses, finalized close budget. All the content presented in this PPT design is completely editable. Download it and make adjustments in color, background, font etc. as per your unique business setting.

Lesson Learned Procedure Gantt Chart Topics PDF
This slide showcases the lesson learned process Gantt chart for projects, to conduct and save lessons learned. It also includes project name , date , future work , issues , etc. Showcasing this set of slides titled Lesson Learned Procedure Gantt Chart Topics PDF. The topics addressed in these templates are SEARCH TASKS, Gantt, Workload. All the content presented in this PPT design is completely editable. Download it and make adjustments in color, background, font etc. as per your unique business setting.

Financial Analysis Progressive Chart Powerpoint Slide Download
This is a financial analysis progressive chart powerpoint slide download. This is a three stage process. The stages in this process are 3 point 4 percent dollar 832 point 5m, 7 point 5 percent dollar 435 point 2 m, 10 point 1 percent dollar 721 point 8m.

PowerPoint Backgrounds Company Process Chart Ppt Template
PowerPoint_Backgrounds_Company_process_chart_PPT_Template Power Point-These amazing PowerPoint pre-designed slides and PowerPoint templates have been carefully created by our team of experts to help you impress your audience. Our stunning collection of Powerpoint slides are 100% editable and can easily fit in any PowerPoint presentations. By using these animations and graphics in PowerPoint and you can easily make professional presentations. Any text can be entered at any point in the PowerPoint template or slide. Just DOWNLOAD our awesome PowerPoint templates and you are ready to go.
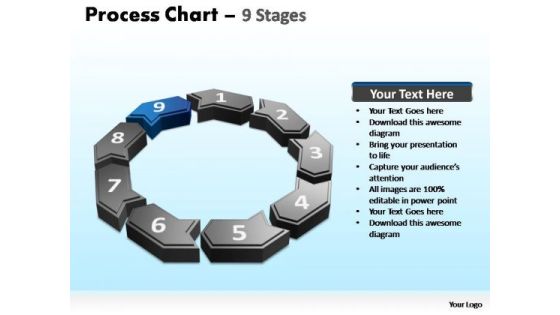
PowerPoint Backgrounds Global Process Chart Ppt Template
PowerPoint_Backgrounds_Global_process_chart_PPT_Template Power Point-These amazing PowerPoint pre-designed slides and PowerPoint templates have been carefully created by our team of experts to help you impress your audience. Our stunning collection of Powerpoint slides are 100% editable and can easily fit in any PowerPoint presentations. By using these animations and graphics in PowerPoint and you can easily make professional presentations. Any text can be entered at any point in the PowerPoint template or slide. Just DOWNLOAD our awesome PowerPoint templates and you are ready to go.
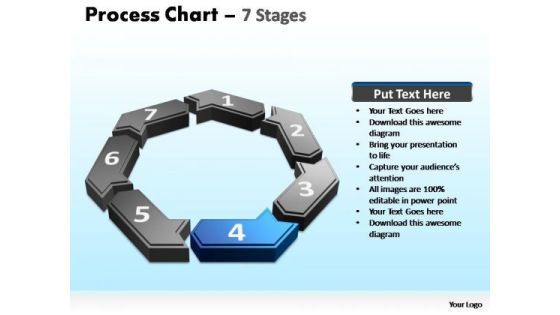
PowerPoint Backgrounds Editable Process Chart Ppt Presentation
PowerPoint_Backgrounds_Editable_process_chart_PPT_Presentation Power Point-These amazing PowerPoint pre-designed slides and PowerPoint templates have been carefully created by our team of experts to help you impress your audience. Our stunning collection of Powerpoint slides are 100% editable and can easily fit in any PowerPoint presentations. By using these animations and graphics in PowerPoint and you can easily make professional presentations. Any text can be entered at any point in the PowerPoint template or slide. Just DOWNLOAD our awesome PowerPoint templates and you are ready to go.
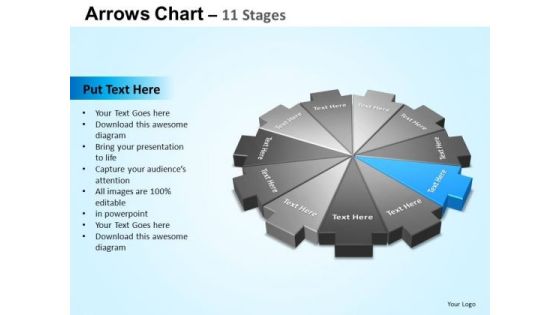
PowerPoint Templates Sales Arrows Chart Ppt Theme
PowerPoint_Templates_Sales_Arrows_Chart_PPT_Theme-Explore the various directions and layers existing in your in your plans and processes. Unravel the desired and essential elements of your overall strategy. Explain the relevance of the different layers and stages and directions in getting down to your core competence, ability and desired result.-These amazing PowerPoint pre-designed slides and PowerPoint templates have been carefully created by our team of experts to help you impress your audience. Our stunning collection of Powerpoint slides are 100% editable and can easily fit in any PowerPoint presentations. By using these animations and graphics in PowerPoint and you can easily make professional presentations. Any text can be entered at any point in the PowerPoint template or slide. Just DOWNLOAD our awesome PowerPoint templates and you are ready to go.
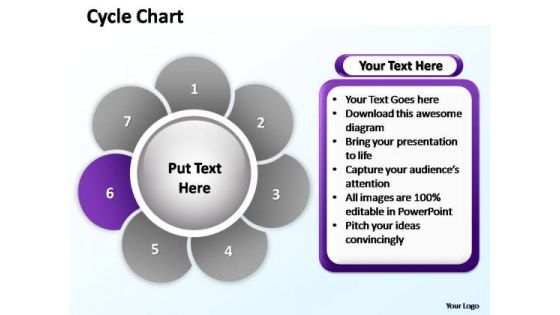
PowerPoint Templates Success Cycle Chart Ppt Layouts
Cycle Diagrams are a type of graphics that shows how items are related to one another in a repeating cycle. In a cycle diagram, you can explain the main events in the cycle, how they interact, and how the cycle repeats. These Diagrams can be used to interact visually and logically with audiences.

Circular Process Chart Infographic Design Powerpoint Template
Download this exclusive business diagram to present progress steps. This PowerPoint template contains the circular process chart. This infographic design can be useful for business presentations.

PowerPoint Presentation Chart Circular Arrows Ppt Backgrounds
PowerPoint_Presentation_Chart_Circular_Arrows_PPT_Backgrounds Business PowerPoints-Explore the various directions and layers existing in your in your plans and processes. Unravel the desired and essential elements of your overall strategy. Explain the relevance of the different layers and stages and directions in getting down to your core competence, ability and desired result.-These amazing PowerPoint pre-designed slides and PowerPoint templates have been carefully created by our team of experts to help you impress your audience. Our stunning collection of Powerpoint slides are 100% editable and can easily fit in any PowerPoint presentations. By using these animations and graphics in PowerPoint and you can easily make professional presentations. Any text can be entered at any point in the PowerPoint template or slide. Just DOWNLOAD our awesome PowerPoint templates and you are ready to go.

Financials Summary Comparison Chart Powerpoint Show
This is a financials summary comparison chart powerpoint show. This is a three stage process. The stages in this process are revenue, cost of sales, gross profit, customer acquisition cost, other operating cost expense, operating profit, change in cash, ending cash, employees.
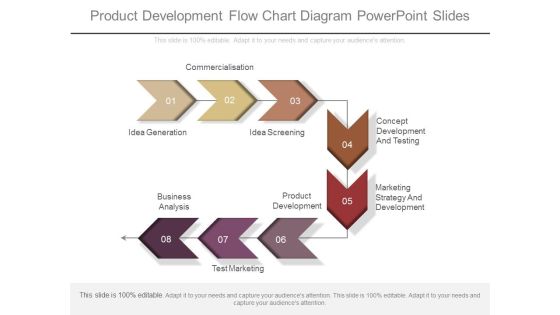
Product Development Flow Chart Diagram Powerpoint Slides
This is a product development flow chart diagram powerpoint slides. This is a eight stage process. The stages in this process are concept development and testing, marketing strategy and development, test marketing, business analysis, product development, idea screening, idea generation, commercialisation.
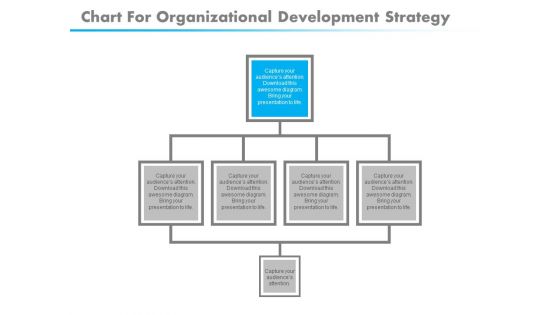
Chart For Organizational Development Strategy Powerpoint Template
Our above slide displays graphics of flow chart. This PowerPoint template may be used to display organizational development strategy. Download this template to leave permanent impression on your audience.
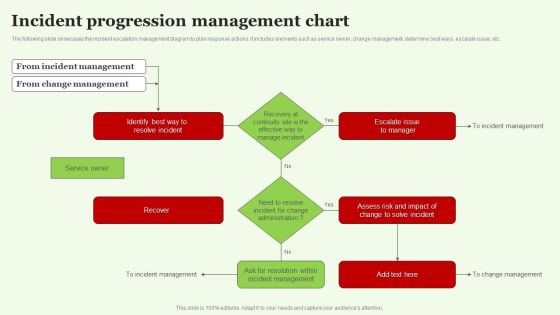
Incident Progression Management Chart Information PDF
The following slide showcases the incident escalation management diagram to plan response actions. It includes elements such as service owner, change management, determine best ways, escalate issue, etc. Showcasing this set of slides titled Incident Progression Management Chart Information PDF. The topics addressed in these templates are Service Owner, Recover, Escalate Issue Manager. All the content presented in this PPT design is completely editable. Download it and make adjustments in color, background, font etc. as per your unique business setting.

Company Procurement Process Flow Chart Background PDF
Find highly impressive Company Procurement Process Flow Chart Background PDF on Slidegeeks to deliver a meaningful presentation. You can save an ample amount of time using these presentation templates. No need to worry to prepare everything from scratch because Slidegeeks experts have already done a huge research and work for you. You need to download Company Procurement Process Flow Chart Background PDF for your upcoming presentation. All the presentation templates are 100 percent editable and you can change the color and personalize the content accordingly. Download now.

Timeline Hierarchical Many To One Organization Chart
Illuminate the road ahead withour Timeline Hierarchical Many To One Organization Chart. Pinpoint the important landmarks along the way. Blaze a trail with our innovative Timeline Hierarchical Many To One Organization Chart. Clearly mark the path for others to follow.
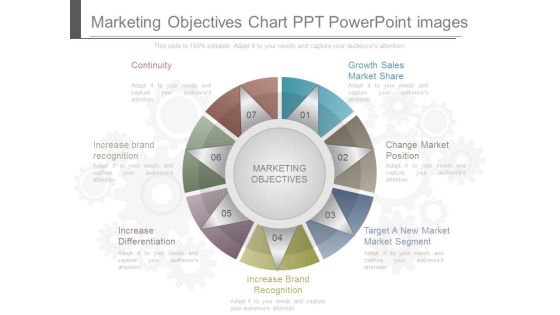
Marketing Objectives Chart Ppt Powerpoint Images
This is a marketing objectives chart ppt powerpoint images. This is a seven stage process. The stages in this process are continuity, growth sales market share, change market position, target a new market market segment, increase brand recognition, increase differentiation, increase brand recognition, marketing objectives.

Workforce Engagement Schedule Gantt Chart Icons PDF
The given below slide highlights a Gantt chart consisting various tasks planned for different teams in the stipulated time. It includes workshops and training sessions that assist in overall development of an employee. Pitch your topic with ease and precision using this Workforce Engagement Schedule Gantt Chart Icons PDF. This layout presents information on Software Development Training, Designing Processes, Project Planning. It is also available for immediate download and adjustment. So, changes can be made in the color, design, graphics or any other component to create a unique layout.

Three Staged Organization Chart PowerPoint Template
Create dynamic presentations with our professional template containing flow chart. This diagram may be used as organizational chart. Download this template to leave permanent impression on your audience.
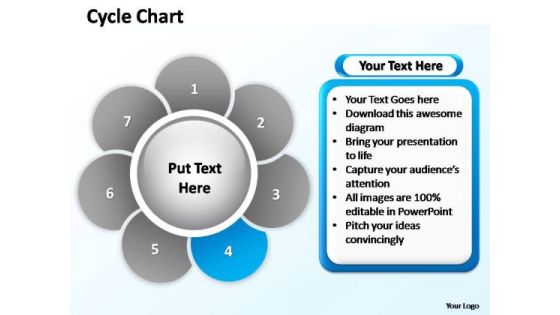
PowerPoint Templates Business Cycle Chart Ppt Themes
Cycle Diagrams are a type of graphics that shows how items are related to one another in a repeating cycle. In a cycle diagram, you can explain the main events in the cycle, how they interact, and how the cycle repeats. These Diagrams can be used to interact visually and logically with audiences.
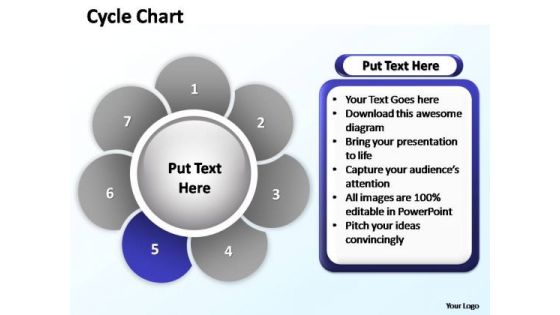
PowerPoint Templates Image Cycle Chart Ppt Themes
Cycle Diagrams are a type of graphics that shows how items are related to one another in a repeating cycle. In a cycle diagram, you can explain the main events in the cycle, how they interact, and how the cycle repeats. These Diagrams can be used to interact visually and logically with audiences.

Brand Management Systems Chart Powerpoint Show
This is a brand management systems chart powerpoint show. This is a six stage process. The stages in this process are brand perception stages, iterative perception tracking, solution usability, solution usp, solution tangibles, customer experience, solution continuity and enhancement, iterative perception tracking.

International Business Trade Payment Chart Ppt Slides
This is a international business trade payment chart ppt slides. This is a four stage process. The stages in this process are open account, documentary collections, letter of credit, cash in advance, buyer, seller, least desirable, most desirable, least desirable, most desirable.
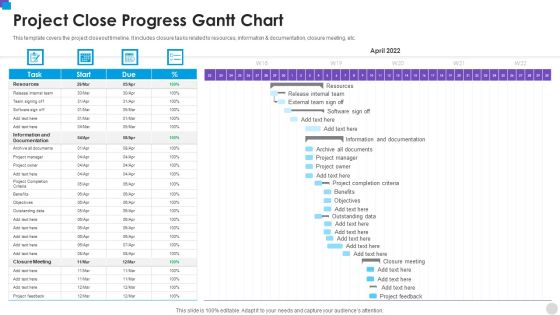
Project Close Progress Gantt Chart Microsoft PDF
This template covers the project closeout timeline. It includes closure tasks related to resources, information and documentation, closure meeting, etc. Pitch your topic with ease and precision using this Project Close Progress Gantt Chart Microsoft PDF. This layout presents information on Resources, Task, Information. It is also available for immediate download and adjustment. So, changes can be made in the color, design, graphics or any other component to create a unique layout.

New Product Development Management Chart Presentation Ideas
This is a new product development management chart presentation ideas. This is a five stage process. The stages in this process are new product development, product testing, product development, product design, business plans, change management, lunch products, portfolio analysis, idea capture, portfolio selection, iteration planning.

Sales Outreach Program Gantt Chart Infographics PDF
This slide includes Gantt chart showcases sales outreach activity to seek customers attention and increase engagement rate. The activities are sent attractive email, sales calls to prospective, social selling, personalized video, live chat and personal meeting. Pitch your topic with ease and precision using this Sales Outreach Program Gantt Chart Infographics PDF. This layout presents information on Attractive Email, Personalized Video, Person Meetings. It is also available for immediate download and adjustment. So, changes can be made in the color, design, graphics or any other component to create a unique layout.

PowerPoint Templates Education Cycle Chart Ppt Designs
Cycle Diagrams are a type of graphics that shows how items are related to one another in a repeating cycle. In a cycle diagram, you can explain the main events in the cycle, how they interact, and how the cycle repeats. These Diagrams can be used to interact visually and logically with audiences.
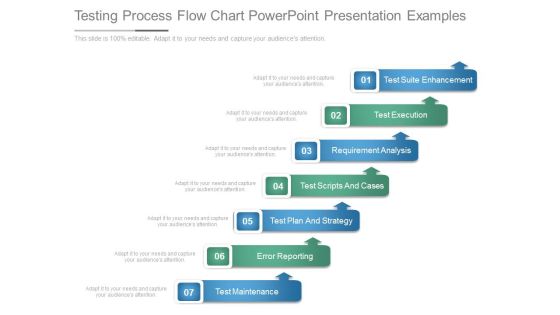
Testing Process Flow Chart Powerpoint Presentation Examples
This is a testing process flow chart powerpoint presentation examples. This is a seven stage process. The stages in this process are test suite enhancement, test execution, requirement analysis, test scripts and cases, test plan and strategy, error reporting, test maintenance.

Lead Scoring Chart Powerpoint Slide Background
This is a lead scoring chart powerpoint slide background. This is a six stage process. The stages in this process are measurable roi on lead generation program, increased conversion rates from qualified lead to opportunity, increased sales productivity and effectiveness, shortened sales cycle, better forecast and pipeline visibility, better alignment of marketing and sales efforts.

Business Framework Organization Chart 1 PowerPoint Presentation
This image slide has been designed to display span of control flow chart. Use this image slide, in your presentations to depict human resource management in business. This image slide will enhance the quality of your presentations.

Business Framework Organization Chart PowerPoint Presentation
This image slide has been designed to display sample of organization chart. Use this image slide, in your presentations to depict project development team management. This image slide will enhance the quality of your presentations.
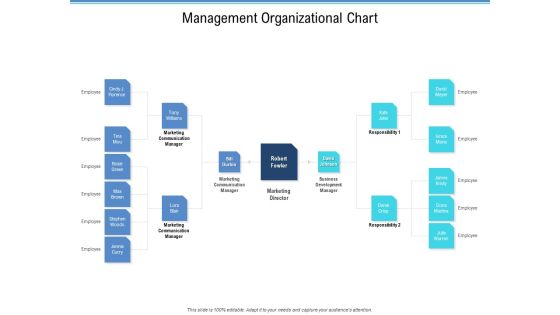
Enterprise Analysis Management Organizational Chart Elements PDF
Deliver and pitch your topic in the best possible manner with this enterprise analysis management organizational chart elements pdf. Use them to share invaluable insights on marketing communication manager, business development manager, marketing director and impress your audience. This template can be altered and modified as per your expectations. So, grab it now.

Quality Management Flow Chart Diagram Powerpoint Images
This is a quality management flow chart diagram powerpoint images. This is a four stage process. The stages in this process are project document, project quality management, plan quality management, control quality, perform quality assurance, develop project mgmt. plan, perform integrated, change control, project documents, enterprise, organization, quality mgmt plan, process impr plan, quality metrics, quality control measurements, project mgmt plan update, project document, change requests, project documents updates, organizational process asset update.

Unconstrained Investment Selection Process Chart Diagram
This is a unconstrained investment selection process chart diagram. This is a six stage process. The stages in this process are portfolio decision making, fundamental financial principles, client centric, economic guidance, optimal investment selection, strategic and tactical, allocation, market trends and cycles.

Business Flow Chart PowerPoint Presentations Process Slides
We present our business flow chart powerpoint presentations process Slides.Use our Advertising PowerPoint Templates because this PPt slide can educate your listeners on the relevance and importance of each one as per your plan and how they all contribute as you strive to hit the Bullseye. Present our Business PowerPoint Templates because the great Bald headed Eagle embodies your personality. the eagle eye to seize upon the smallest of opportunities. Download and present our Marketing PowerPoint Templates because that was the well known Musketeers call. Use our Finance PowerPoint Templates because you envisage some areas of difficulty in the near future. The overall financial situation could be a source of worry. Download and present our Shapes PowerPoint Templates because there is a key aspect to be emphasised.Use these PowerPoint slides for presentations relating to Analysis, Business, Concept, Design, Diagram, Direction, Goals, Guide, Icon, Idea, Management, Model, Opportunity, Organization, Performance, Plan, Process, Project, Representation, Resource, Strategy, Swot. The prominent colors used in the PowerPoint template are Blue, Black, Gray. PowerPoint presentation experts tell us our business flow chart powerpoint presentations process Slides are Perfect. Professionals tell us our Diagram PowerPoint templates and PPT Slides are Striking. People tell us our business flow chart powerpoint presentations process Slides are Appealing. We assure you our Icon PowerPoint templates and PPT Slides are Endearing. PowerPoint presentation experts tell us our business flow chart powerpoint presentations process Slides are Appealing. Professionals tell us our Direction PowerPoint templates and PPT Slides effectively help you save your valuable time.

Four Steps Pyramid Diagram Templates PowerPoint Chart
We present our Four steps Pyramid Diagram templates powerpoint Chart.Present our Finance PowerPoint Templates because this template helps you to delve on these thoughts and brief your team on the value of your depth of understanding of the subject. Download our Business PowerPoint Templates because it helps you to explain your plans in all earnest to your colleagues and raise the bar for all. Use our Shapes PowerPoint Templates because to achieve sureshot success you need to come together at the right time, place and manner. Use our Pyramids PowerPoint Templates because pyramids are a symbol of the continuity of life. Download our Signs PowerPoint Templates because this diagram provides trainers a tool to teach the procedure in a highly visual, engaging way.Use these PowerPoint slides for presentations relating to 3d, Abstract, Business, Chart, Color, Colorful, Concept, Conceptual, Diagram, Financial, Four, Graph, Green, Growth, Hierarchy, Illustration, Increase, Isolated, Layer, Level, Multi-Colored, Multicolored, Orange, Part, Performance, Polychrome, Presentation, Progress, Pyramid, Red, Render, Rendered, Report, Results, Section, Shape, Sliced, Stage, Statistics, Status, Step, Success, Triangle. The prominent colors used in the PowerPoint template are Blue, Red, Green. We assure you our Four steps Pyramid Diagram templates powerpoint Chart are Awesome. Customers tell us our Diagram PowerPoint templates and PPT Slides are Radiant. The feedback we get is that our Four steps Pyramid Diagram templates powerpoint Chart are Clever. We assure you our Conceptual PowerPoint templates and PPT Slides are Fashionable. People tell us our Four steps Pyramid Diagram templates powerpoint Chart are incredible easy to use. We assure you our Colorful PowerPoint templates and PPT Slides are specially created by a professional team with vast experience. They diligently strive to come up with the right vehicle for your brilliant Ideas.

Website Design Procedure Gant Chart Graphics PDF
This slide showcases website design gantt chart illustrates helpful resource for both designers and clients, since it keeps everyone focused on the work and objectives at hand. It includes starting point , activities under process , summary element , finish etc. Showcasing this set of slides titled Website Design Procedure Gant Chart Graphics PDF. The topics addressed in these templates are Stages, Weeks, Security. All the content presented in this PPT design is completely editable. Download it and make adjustments in color, background, font etc. as per your unique business setting.

New Product Development Progress Chart Brochure PDF
The slide showcases the progressing stages of new product development. It covers ideation, product definition, prototyping, detailed design, validation testing and commercialization. Persuade your audience using this New Product Development Progress Chart Brochure PDF. This PPT design covers six stages, thus making it a great tool to use. It also caters to a variety of topics including Prototyping, Detailed Design, Validation Testing. Download this PPT design now to present a convincing pitch that not only emphasizes the topic but also showcases your presentation skills.
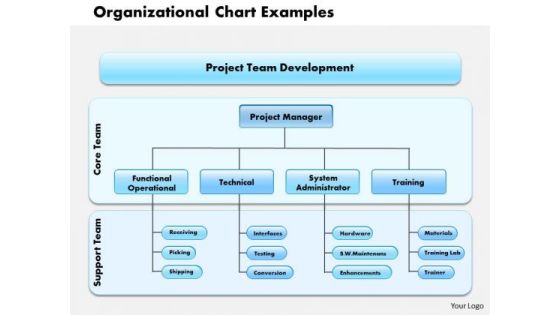
Business Framework Organizational Chart Examples PowerPoint Presentation
This image slide has been designed to display organizational charts. Use this image slide, in your presentations to depict business management. This image slide will enhance the quality of your presentations and will provide professional appearance to your presentations.

Business Framework Organizational Chart PowerPoint Presentation
This image slide has been designed to display organizational flow chart. Use this image slide, in your presentations to depict human resource management in business designation. This image slide will enhance the quality of your presentations.
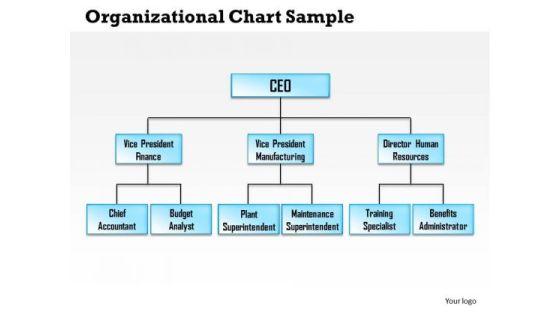
Business Framework Organizational Chart Sample PowerPoint Presentation
This image slide has been designed to display organizational flow chart. Use this image slide, in your presentations to depict higher post management in business. This image slide will enhance the quality of your presentations.

PowerPoint Design Chart Four Concepts Ppt Layouts
PowerPoint Design Chart Four Concepts PPT Layouts-The graphic is a symbol of growth and success. Display your ideas and highlight their ability to accelerate the growth of your company and you. Impress upon the audience how your strategy will carry all to the top of the corporate heap.

PowerPoint Process Chart Circular Arrow Ppt Design
PowerPoint Process Chart Circular Arrow PPT Design-Explore the various directions and layers existing in your in your plans and processes. Unravel the desired and essential elements of your overall strategy. Explain the relevance of the different layers and stages and directions in getting down to your core competence, ability and desired result.
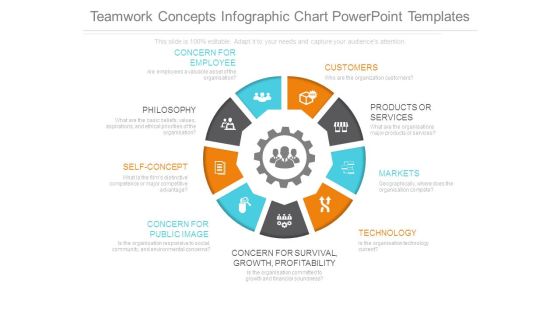
Teamwork Concepts Infographic Chart Powerpoint Templates
This is a teamwork concepts infographic chart powerpoint templates. This is a nine stage process. The stages in this process are concern for survival growth profitability, concern for employee, customers, products or services, markets, technology, concern for public image, self concept, philosophy.

Sales Performance Wheel Chart Ppt Examples Professional
This is a sales performance wheel chart ppt examples professional. This is a ten stage process. The stages in this process are performance management, system and governance, supplier relationship management, result tracking and reporting, information technology, category plan development, trading partners relationship, organizational capabilities, business alignment, strategy and business process.

Business Exercise Flow Chart Powerpoint Presentation Examples
This is a business exercise flow chart powerpoint presentation examples. This is a six stage process. The stages in this process are talent management, planning for the future, leadership, recruitment and selection, information systems finance energy, pay and benefits, labor relations, training and development, time people talent knowledge.

PowerPoint Layouts Graphic Performance Chart Ppt Design
PowerPoint Layouts Graphic Performance Chart PPT Design-Explore the various directions and layers existing in your in your plans and processes. Unravel the desired and essential elements of your overall strategy. Explain the relevance of the different layers and stages and directions in getting down to your core competence, ability and desired result.
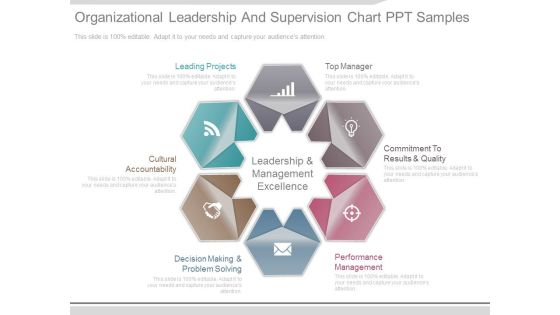
Organizational Leadership And Supervision Chart Ppt Samples
This is a organizational leadership and supervision chart ppt samples. This is a six stage process. The stages in this process are leading projects, top manager, commitment to results and quality, performance management, decision making and problem solving, cultural accountability, leadership and management excellence.
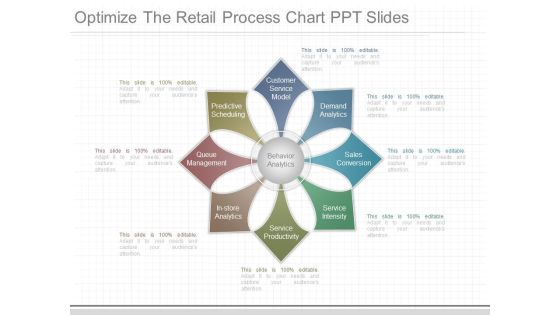
Optimize The Retail Process Chart Ppt Slides
This is a optimize the retail process chart ppt slides. This is a eight stage process. The stages in this process are predictive, scheduling, queue, management, in store, analytics, service, productivity, service, intensity, sales conversion, demand analytics, customer service model, behavior analytics.
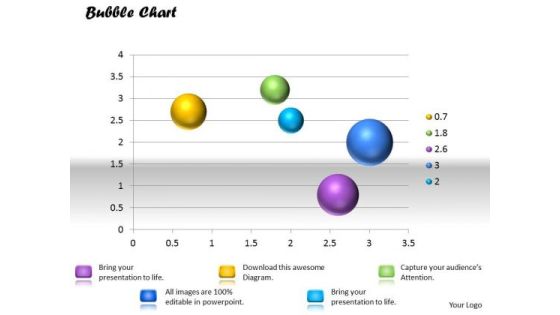
Business Framework PowerPoint Bubble Chart PowerPoint Presentation
This innovative image slide has been designed with graphic of bubble chart to depict any information which requires visual presentation. This image slide is 100% editable. You may change color, size and orientation of any icon to your liking. This image slide may be used in school, business and social presentations. Make your presentations interesting using this image slide.
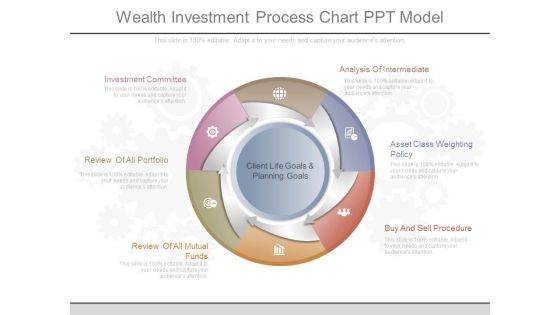
Wealth Investment Process Chart Ppt Model
This is a wealth investment process chart ppt model. This is a six stage process. The stages in this process are investment committee, review of all portfolio, review of all mutual funds, client life goals and planning goals, analysis of intermediate, asset class weighting policy, buy and sell procedure.
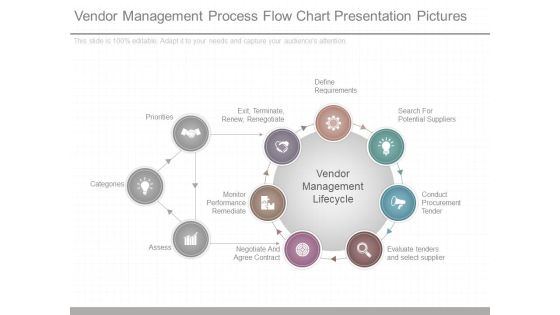
Vendor Management Process Flow Chart Presentation Pictures
This is a vendor management process flow chart presentation pictures. This is a seven stage process. The stages in this process are define requirements, search for potential suppliers, conduct procurement tender, evaluate tenders and select supplier, negotiate and agree contract, monitor performance remediate, exit, terminate, renew, renegotiate, vendor management lifecycle, assess, categories, priorities.
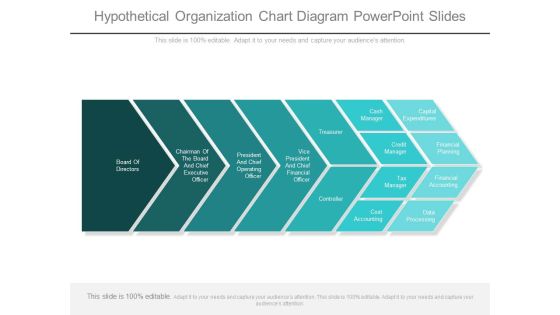
Hypothetical Organization Chart Diagram Powerpoint Slides
This is a hypothetical organization chart diagram powerpoint slides. This is a seven stage process. The stages in this process are board of directors, chairman of the board and chief executive officer, president and chief operating officer, vice president and chief financial officer, treasurer, controller, cash manager, capital expenditures, credit manager, financial planning, tax manager, financial accounting, cost accounting, data processing.
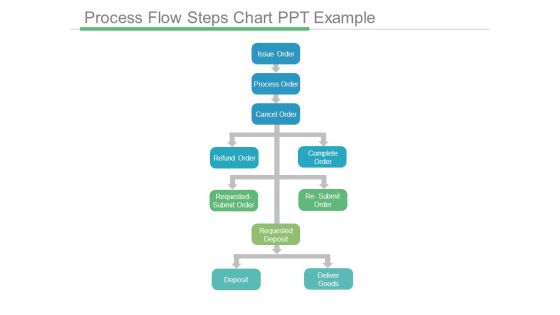
Process Flow Steps Chart Ppt Example
This is a process flow steps chart ppt example. This is a seven stage process. The stages in this process are issue order, process order, cancel order, refund order, complete order, requested submit order, re submit order, requested deposit, deposit, deliver goods.
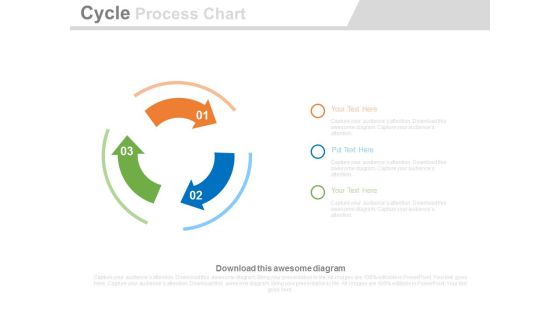
Three Arrows Cycles Process Chart Powerpoint Slides
This business slide contains three arrows cycle chart. This diagram provides schematic representation of any information. Visual effect this slide helps in maintaining the flow of the discussion and provides more clarity to the subject.
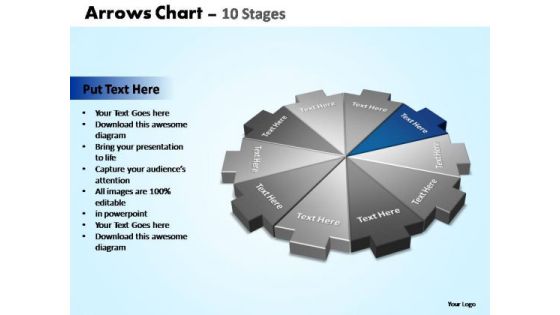
PowerPoint Template Success Arrows Chart Ppt Slides
PowerPoint_Template_Success_Arrows_Chart_PPT_Slides-Explore the various directions and layers existing in your in your plans and processes. Unravel the desired and essential elements of your overall strategy. Explain the relevance of the different layers and stages and directions in getting down to your core competence, ability and desired result.-These amazing PowerPoint pre-designed slides and PowerPoint templates have been carefully created by our team of experts to help you impress your audience. Our stunning collection of Powerpoint slides are 100% editable and can easily fit in any PowerPoint presentations. By using these animations and graphics in PowerPoint and you can easily make professional presentations. Any text can be entered at any point in the PowerPoint template or slide. Just DOWNLOAD our awesome PowerPoint templates and you are ready to go.

Portfolio Return Ratio Analysis Chart Powerpoint Images
This is a portfolio return ratio analysis chart powerpoint images. This is a six stage process. The stages in this process are type of investment, stocks, bonds, real estate, domestic equity, foreign developed equity, emerging market equity, u s treasury inflation protected securities tips, u s treasury securities, real estate investment trusts tips, share.

Project Management Gantt Chart Ppt Powerpoint Images
This is a project management gantt chart ppt powerpoint images. This is a seven stage process. The stages in this process are requirement, setup, development, testing, deployment, training, support, project ma, review, coding, integration tests, customer tests, go live, training, support, project management.

PowerPoint Slide Chart Chain Management Ppt Theme
PowerPoint Slide Chart Chain Management PPT Theme-Most events and in every aspect of life are invariably interlinked. Use this chains graphic to outline your thoughts and their inherent interdependance to acheive the final outcome. Highlight the strength and durability of your thoughts, ideas and products.
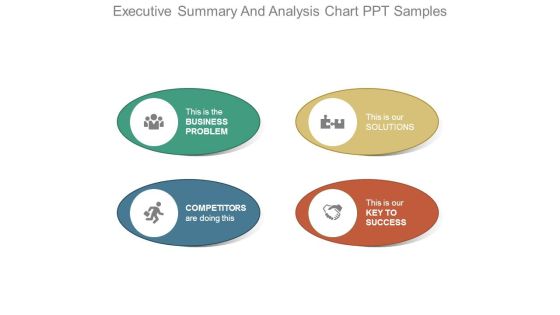
Executive Summary And Analysis Chart Ppt Samples
This is a executive summary and analysis chart ppt samples. This is a four stage process. The stages in this process are this is the business problem, this is our solutions, competitors are doing this, this is our key to success.

Banking Management Hierarchy Chart Powerpoint Slide Ideas
This is a banking management hierarchy chart powerpoint slide ideas. This is a three stage process. The stages in this process are board of directors, chief executive officer, chief operating, general managers, deputy general managers, assistant general managers, principal officers, senior officers, clerical staff members, non clerical staff members.

Behavioral Segmentation Flow Chart Powerpoint Graphics
This is a behavioral segmentation flow chart powerpoint graphics. This is a six stage process. The stages in this process are target market, negative opinion, neutral, favorable opinion, unaware, aware, not tried, rejecter, not yet repeated, loyal to other brand, switcher, light user, regular user.
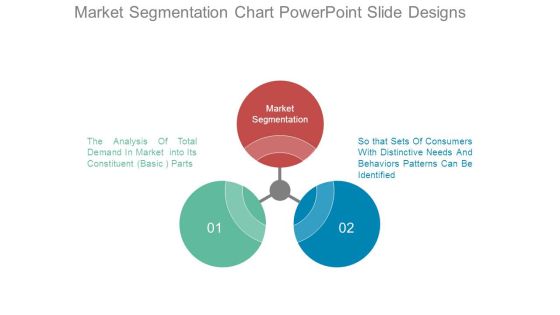
Market Segmentation Chart Powerpoint Slide Designs
This is a market segmentation chart powerpoint slide designs. This is a three stage process. The stages in this process are market segmentation, so that sets of consumers with distinctive needs and behaviors patterns can be identified, the analysis of total demand in market into its constituent basic parts.
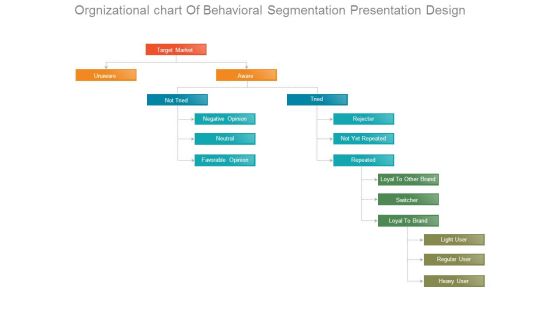
Orgnizational Chart Of Behavioral Segmentation Presentation Design
This is a orgnizational chart of behavioral segmentation presentation design. This is a four stage process. The stages in this process are unaware, target market, aware, not tried, negative opinion, favorable opinion, tried, rejecter, not yet repeated, repeated, loyal to other brand, switcher, loyal to brand, light user, regular user, heavy user.

Ppt Linear Chart 7 Stages5 PowerPoint Templates
PPT linear chart 7 stages5 PowerPoint Templates-Use this 3d Arrow PPT slide to show the sequence of events in a story or describe the steps to be taken in a process. This image has been conceived to enable you to emphatically communicate your ideas in

Project Status Summary Chart Powerpoint Slide Themes
This is a project status summary chart powerpoint slide themes. This is a five stage process. The stages in this process are deployment 24 feb 2017, we are here, midterm presentation 28 feb 2017, uat 1 28 jan 2017, uat 2 18 feb 2017, uat 3 07 mar 2017, deployment 01 apr 2017, final presentation 14 apr 2017, dec, jan, feb, mar, apr, iteration, scheduling absences profile management programme management, vacation, advanced scheduling enrolment, advanced scheduling enrolment, notification business analytics.

Mobile Marketing Flow Chart Ppt Presentation
This is a mobile marketing flow chart ppt presentation. This is a six stage process. The stages in this process are creating a user flow diagram, a text messaging platform, carrier approval certification, common short codes, an opt in marketing program, requirements of sms campaign.
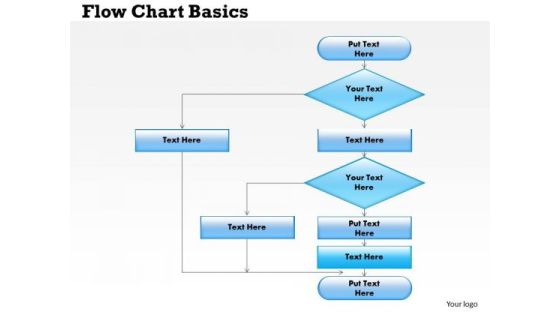
Business Framework Flow Chart Basics PowerPoint Presentation
This business framework power point image template has been crafted with graphic of flow chart. This PPT diagram contains the concept of process flow and management. Use this PPT diagram for your organizational and management related presentations.
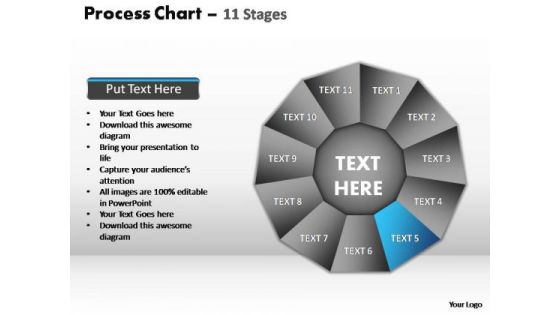
PowerPoint Backgrounds Diagram Process Chart Ppt Template
PowerPoint_Backgrounds_Diagram_process_chart_PPT_Template Power Point-These amazing PowerPoint pre-designed slides and PowerPoint templates have been carefully created by our team of experts to help you impress your audience. Our stunning collection of Powerpoint slides are 100% editable and can easily fit in any PowerPoint presentations. By using these animations and graphics in PowerPoint and you can easily make professional presentations. Any text can be entered at any point in the PowerPoint template or slide. Just DOWNLOAD our awesome PowerPoint templates and you are ready to go.

Banking Investment Management Chart Powerpoint Slides
This is a banking investment management chart powerpoint slides. This is a nine stage process. The stages in this process are tax planning, estate and trust planning, us banking and credit capabilities, us business owner planning, banking and cash management, financial literacy, credit strategies, philanthropy, investment management, private client, private client, team.

PowerPoint Backgrounds Download Process Chart Ppt Themes
PowerPoint_Backgrounds_Download_process_chart_PPT_Themes Power Point-These amazing PowerPoint pre-designed slides and PowerPoint templates have been carefully created by our team of experts to help you impress your audience. Our stunning collection of Powerpoint slides are 100% editable and can easily fit in any PowerPoint presentations. By using these animations and graphics in PowerPoint and you can easily make professional presentations. Any text can be entered at any point in the PowerPoint template or slide. Just DOWNLOAD our awesome PowerPoint templates and you are ready to go.

Four Circles Spaghetti Chart Powerpoint Slides Design
This is a four circles spaghetti chart powerpoint slides design. This is a three stage process. The stages in this process are spaghetti diagram also used to described movement of people in a factory or office motion is waste, arrow, business, marketing, circles.

Hiring Flow Chart Template Ppt Examples Professional
This is a hiring flow chart template ppt examples professional. This is a seven stage process. The stages in this process are candidates are screened, employers receive cvs, candidate is hired, sourcing of candidates, hiring process begins, interviews and help, background checks are conducted.
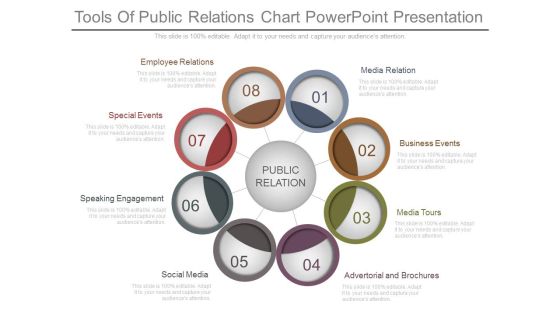
Tools Of Public Relations Chart Powerpoint Presentation
This is a tools of public relations chart powerpoint presentation. This is a eight stage process. The stages in this process are media relation, business events, media tours, advertorial and brochures, social media, speaking engagement, special events, employee relations, public relation.

Our Positioning Matrix Chart Powerpoint Slides
This is a our positioning matrix chart powerpoint slides. This is a three stage process. The stages in this process are new markets, existing markets, your company, competition, existing markets, new markets, best product, possible dimension, operational excellence, best price, price, competitor 1, choice, quality, service.
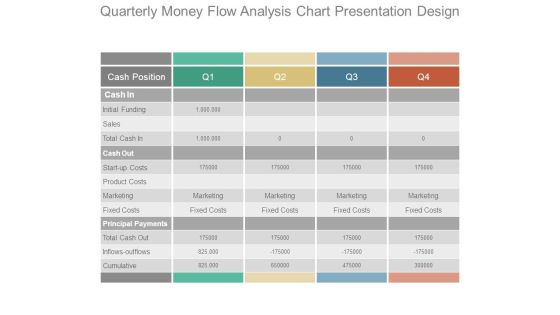
Quarterly Money Flow Analysis Chart Presentation Design
This is a quarterly money flow analysis chart presentation design. This is a four stage process. The stages in this process are cash position, cash in, initial funding, sales, total cash in, cash out, start up costs, product costs, marketing, fixed costs, principal payments, total cash out, inflows outflows, cumulative.
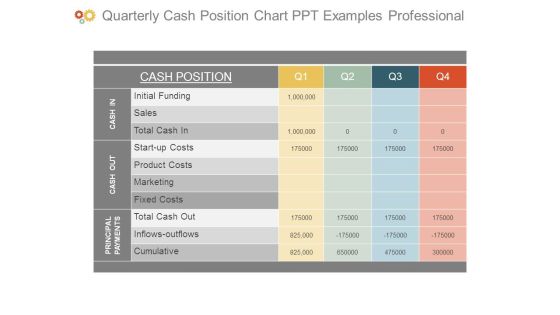
Quarterly Cash Position Chart Ppt Examples Professional
This is a quarterly cash position chart ppt examples professional. This is a four stage process. The stages in this process are cash position, initial funding, sales, total cash in, start up costs, product costs, marketing, fixed costs, total cash out, inflows outflows, cumulative, cash in, cash out, principal payments.

Revenue Projections Example Chart Powerpoint Ideas
This is a revenue projections example chart powerpoint ideas. This is a eleven stage process. The stages in this process are brand paid search, non branded paid search, direct load, brand organic search, non brand organic, inbound free links, affiliates, display, comparison shopping, display retargeting, email.
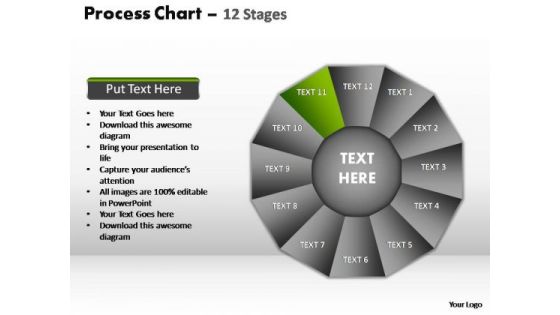
PowerPoint Backgrounds Business Process Chart Ppt Template
PowerPoint_Backgrounds_Business_process_chart_PPT_Template Power Point-These amazing PowerPoint pre-designed slides and PowerPoint templates have been carefully created by our team of experts to help you impress your audience. Our stunning collection of Powerpoint slides are 100% editable and can easily fit in any PowerPoint presentations. By using these animations and graphics in PowerPoint and you can easily make professional presentations. Any text can be entered at any point in the PowerPoint template or slide. Just DOWNLOAD our awesome PowerPoint templates and you are ready to go.

PowerPoint Backgrounds Company Process Chart Ppt Templates
PowerPoint_Backgrounds_Company_process_chart_PPT_Templates Power Point-These amazing PowerPoint pre-designed slides and PowerPoint templates have been carefully created by our team of experts to help you impress your audience. Our stunning collection of Powerpoint slides are 100% editable and can easily fit in any PowerPoint presentations. By using these animations and graphics in PowerPoint and you can easily make professional presentations. Any text can be entered at any point in the PowerPoint template or slide. Just DOWNLOAD our awesome PowerPoint templates and you are ready to go.
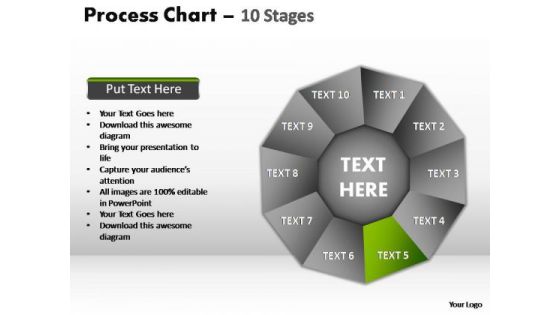
PowerPoint Backgrounds Graphic Process Chart Ppt Templates
PowerPoint_Backgrounds_Graphic_process_chart_PPT_Templates Power Point-These amazing PowerPoint pre-designed slides and PowerPoint templates have been carefully created by our team of experts to help you impress your audience. Our stunning collection of Powerpoint slides are 100% editable and can easily fit in any PowerPoint presentations. By using these animations and graphics in PowerPoint and you can easily make professional presentations. Any text can be entered at any point in the PowerPoint template or slide. Just DOWNLOAD our awesome PowerPoint templates and you are ready to go.
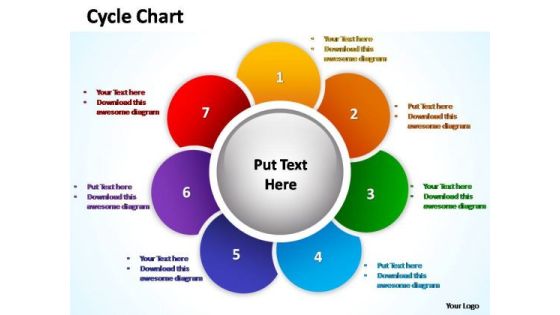
PowerPoint Slide Graphic Cycle Chart Ppt Design
PowerPoint_Slide_Graphic_Cycle_Chart_PPT_Design Business Power Points-Cycle Diagrams are a type of graphics that shows how items are related to one another in a repeating cycle. In a cycle diagram, you can explain the main events in the cycle, how they interact, and how the cycle repeats. These Diagrams can be used to interact visually and logically with audiences. -PowerPoint_Slide_Graphic_Cycle_Chart_PPT_Design Business Power Points

PowerPoint Backgrounds Editable Process Chart Ppt Backgrounds
PowerPoint_Backgrounds_Editable_process_chart_PPT_Backgrounds Power Point-These amazing PowerPoint pre-designed slides and PowerPoint templates have been carefully created by our team of experts to help you impress your audience. Our stunning collection of Powerpoint slides are 100% editable and can easily fit in any PowerPoint presentations. By using these animations and graphics in PowerPoint and you can easily make professional presentations. Any text can be entered at any point in the PowerPoint template or slide. Just DOWNLOAD our awesome PowerPoint templates and you are ready to go.
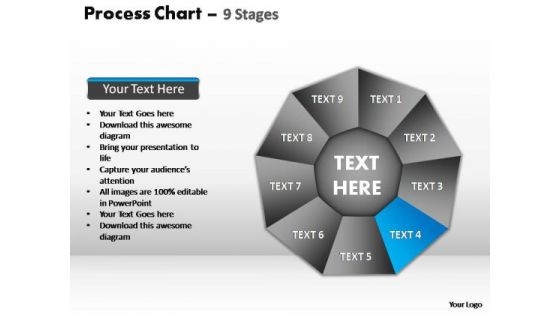
PowerPoint Backgrounds Education Process Chart Ppt Design
PowerPoint_Backgrounds_Education_process_chart_PPT_Design Power Point-These amazing PowerPoint pre-designed slides and PowerPoint templates have been carefully created by our team of experts to help you impress your audience. Our stunning collection of Powerpoint slides are 100% editable and can easily fit in any PowerPoint presentations. By using these animations and graphics in PowerPoint and you can easily make professional presentations. Any text can be entered at any point in the PowerPoint template or slide. Just DOWNLOAD our awesome PowerPoint templates and you are ready to go.
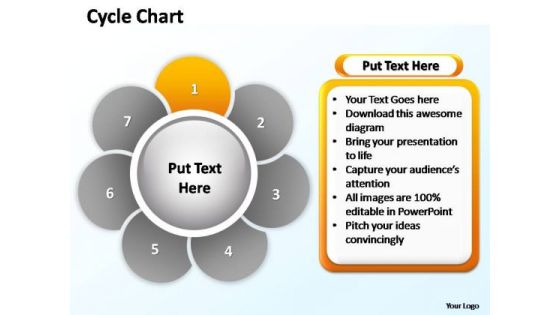
PowerPoint Slide Leadership Cycle Chart Ppt Design
PowerPoint_Slide_Leadership_Cycle_Chart_PPT_Design Business Power Points-Cycle Diagrams are a type of graphics that shows how items are related to one another in a repeating cycle. In a cycle diagram, you can explain the main events in the cycle, how they interact, and how the cycle repeats. These Diagrams can be used to interact visually and logically with audiences. -PowerPoint_Slide_Leadership_Cycle_Chart_PPT_Design Business Power Points
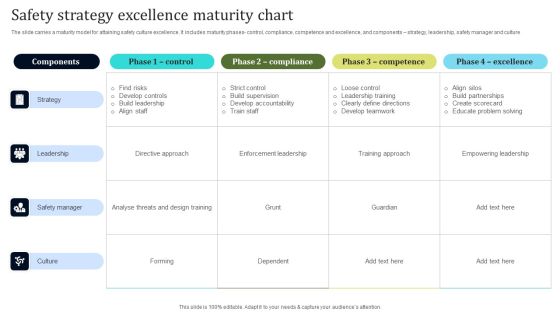
Safety Strategy Excellence Maturity Chart Elements PDF
The slide carries a maturity model for attaining safety culture excellence. It includes maturity phases control, compliance, competence and excellence, and components strategy, leadership, safety manager and culture. Pitch your topic with ease and precision using this Safety Strategy Excellence Maturity Chart Elements PDF. This layout presents information on Training Approach, Develop Teamwork, Strategy. It is also available for immediate download and adjustment. So, changes can be made in the color, design, graphics or any other component to create a unique layout.

PowerPoint Designs Global Process Chart Ppt Designs
PowerPoint_Designs_Global_Process_Chart_PPT_Designs Business Power Points-Explore the various directions and layers existing in your in your plans and processes. Unravel the desired and essential elements of your overall strategy. Explain the relevance of the different layers and stages and directions in getting down to your core competence, ability and desired result.-These amazing PowerPoint pre-designed slides and PowerPoint templates have been carefully created by our team of experts to help you impress your audience. Our stunning collection of Powerpoint slides are 100% editable and can easily fit in any PowerPoint presentations. By using these animations and graphics in PowerPoint and you can easily make professional presentations. Any text can be entered at any point in the PowerPoint template or slide. Just DOWNLOAD our awesome PowerPoint templates and you are ready to go.

Pharmaceutical Company Inventory Diagram Chart Information PDF
This slide can be used by a pharmaceutical company to show its inventory flow. In includes stages like advance shipping notice, raw material inspection, transfer to warehouse, etc. Presenting Pharmaceutical Company Inventory Diagram Chart Information PDF to dispense important information. This template comprises one stages. It also presents valuable insights into the topics including Inbound, Customer, Location. This is a completely customizable PowerPoint theme that can be put to use immediately. So, download it and address the topic impactfully.

Inventory Warehousing Process Diagram Chart Brochure PDF
This slide shows the warehousing process of inventory. It includes stages such as order receiving, order processing, quality assurance. Persuade your audience using this Inventory Warehousing Process Diagram Chart Brochure PDF. This PPT design covers one stages, thus making it a great tool to use. It also caters to a variety of topics including Order Receiving, Vendors, Order Processing. Download this PPT design now to present a convincing pitch that not only emphasizes the topic but also showcases your presentation skills.
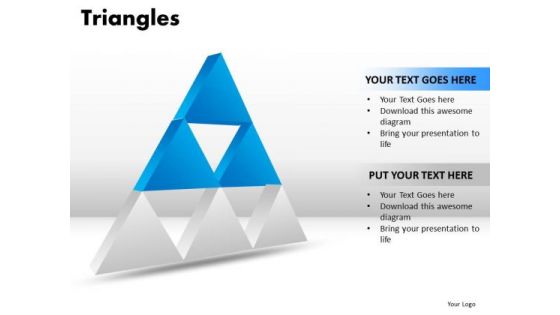
PowerPoint Process Chart Triangles Ppt Themes
PowerPoint Process Chart Triangles PPT Themes-These high quality powerpoint pre-designed slides and powerpoint templates have been carefully created by our professional team to help you impress your audience. All slides have been created and are 100% editable in powerpoint. Each and every property of any graphic - color, size, orientation, shading, outline etc. can be modified to help you build an effective powerpoint presentation. Any text can be entered at any point in the powerpoint template or slide. Simply DOWNLOAD, TYPE and PRESENT!
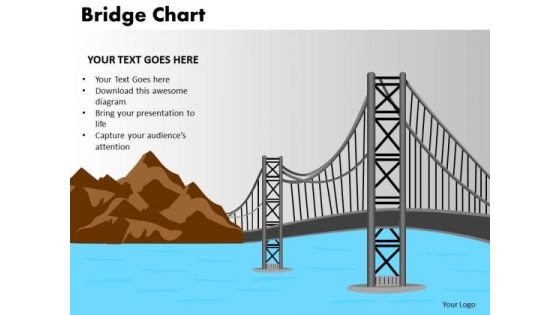
PowerPoint Theme Architecture Bridge Chart Ppt Designs
PowerPoint Theme Architecture Bridge Chart PPT Designs-A Bridge is a structure built to span physical obstacles such as body of water, valley, or road for the purpose of providing passage over the obstacle. Explain your plan of action to bring out likely opposing obstacles and how you intend to convert them into opportunities to achieve results. All this will enable you to share the interesting opportunities with your Audiences. This will increase the interest of the Audiences and thus will help them understand what you are trying to convey to them-PowerPoint Theme Architecture Bridge Chart PPT Designs-This ppt can be used for presentations relating to-Architecture, Area, Attraction, Bay, Beauty, Blue, Bridge, Cable, California, City, Cloud, Commute, Connection, Dusk, Famous, Francisco, Gate, Golden, Headlands, Historic, Historical, Illustration, Landmark, Marin, Metal, Monument
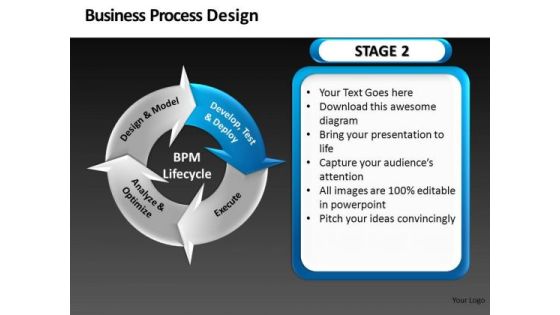
Process Cycle Chart Diagram PowerPoint Templates
Process Cycle Chart Diagram PowerPoint TemplatesThese high quality powerpoint pre-designed slides and powerpoint templates have been carefully created by our professional team to help you impress your audience. All slides have been created and are 100% editable in powerpoint. Each and every property of any graphic - color, size, orientation, shading, outline etc. can be modified to help you build an effective powerpoint presentation. Any text can be entered at any point in the powerpoint template or slide. Simply DOWNLOAD, TYPE and PRESENT!
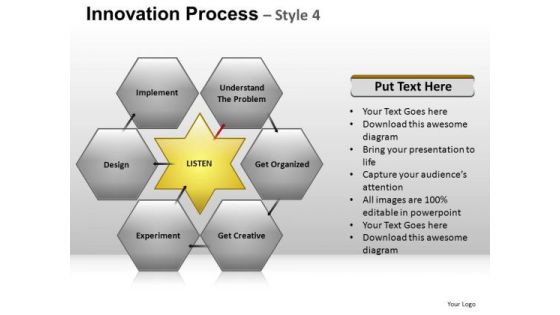
PowerPoint Slidelayout Growth Hexagon Chart Ppt Themes
PowerPoint Slidelayout Growth Hexagon Chart PPT ThemesBusiness PPT templates-These high quality powerpoint pre-designed slides and powerpoint templates have been carefully created by our professional team to help you impress your audience. All slides have been created and are 100% editable in powerpoint. Each and every property of any graphic - color, size, orientation, shading, outline etc. can be modified to help you build an effective powerpoint presentation. Any text can be entered at any point in the powerpoint template or slide. Simply DOWNLOAD, TYPE and PRESENT!
PowerPoint Themes Business Process Chart Ppt Template
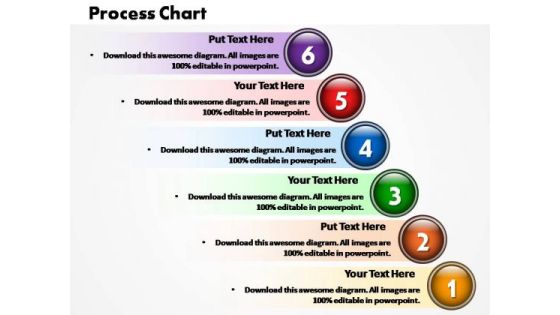
Highlight the key point in selling process with this diagram

PowerPoint Themes Business Process Chart Ppt Templates
Highlight the key point in selling process with this diagram

PowerPoint Templates Circular Flow Chart Ppt Theme
Flowchart is a simple mapping tool that shows the sequence of actions within a process. Flowchart is widely used in business, education and economic presentations to help the audience visualize the content better, or to find flaws in a process.

PowerPoint Templates Circular Flow Chart Ppt Themes
Flowchart is a simple mapping tool that shows the sequence of actions within a process. Flowchart is widely used in business, education and economic presentations to help the audience visualize the content better, or to find flaws in a process.
Project Tracking Gantt Chart Summary PDF
The following slide showcases the progress status of project tracking activities to achieve deliverables. It constitutes of weekly progress status of each project to assess the pending tasks. Showcasing this set of slides titled Project Tracking Gantt Chart Summary PDF. The topics addressed in these templates are Determine, Project, Review Design. All the content presented in this PPT design is completely editable. Download it and make adjustments in color, background, font etc. as per your unique business setting.

PowerPoint Template Growth Umbrella Chart Ppt Process
PowerPoint Template Growth Umbrella Chart PPT Process-These high quality powerpoint pre-designed slides and powerpoint templates have been carefully created by our professional team to help you impress your audience. All slides have been created and are 100% editable in powerpoint. Each and every property of any graphic - color, size, orientation, shading, outline etc. can be modified to help you build an effective powerpoint presentation. Any text can be entered at any point in the powerpoint template or slide. Simply DOWNLOAD, TYPE and PRESENT!

PowerPoint Design Chart Drug Discovery Ppt Designs
PowerPoint Design Chart drug discovery PPT Designs-These high quality powerpoint pre-designed slides and powerpoint templates have been carefully created by our professional team to help you impress your audience. All slides have been created and are 100% editable in powerpoint. Each and every property of any graphic - color, size, orientation, shading, outline etc. can be modified to help you build an effective powerpoint presentation. Any text can be entered at any point in the powerpoint template or slide. Simply DOWNLOAD, TYPE and PRESENT!
PowerPoint Presentation Chart Drug Discovery Ppt Slide
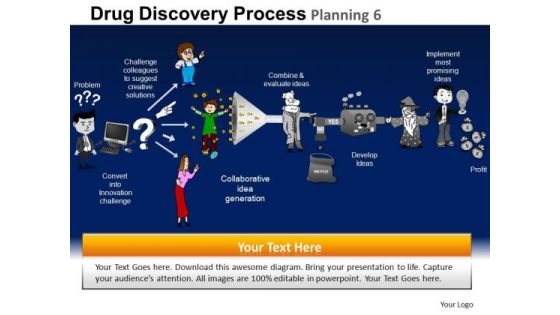
PowerPoint Presentation Chart drug discovery PPT Slide-These high quality powerpoint pre-designed slides and powerpoint templates have been carefully created by our professional team to help you impress your audience. All slides have been created and are 100% editable in powerpoint. Each and every property of any graphic - color, size, orientation, shading, outline etc. can be modified to help you build an effective powerpoint presentation. Any text can be entered at any point in the powerpoint template or slide. Simply DOWNLOAD, TYPE and PRESENT!

PowerPoint Themes Business Process Chart Ppt Design
Highlight the key point in selling process with this diagram

PowerPoint Themes Business Process Chart Ppt Designs
Highlight the key point in selling process with this diagram
PowerPoint Themes Business Process Chart Ppt Layout
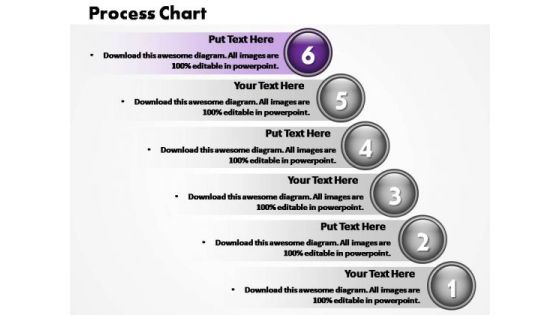
Highlight the key point in selling process with this diagram

PowerPoint Themes Business Process Chart Ppt Layouts
Highlight the key point in selling process with this diagram
PowerPoint Themes Business Process Chart Ppt Slide
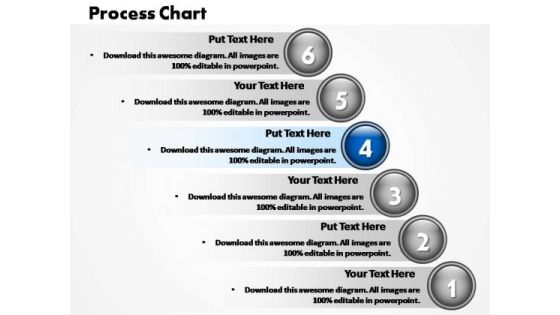
Highlight the key point in selling process with this diagram
PowerPoint Themes Business Process Chart Ppt Slides
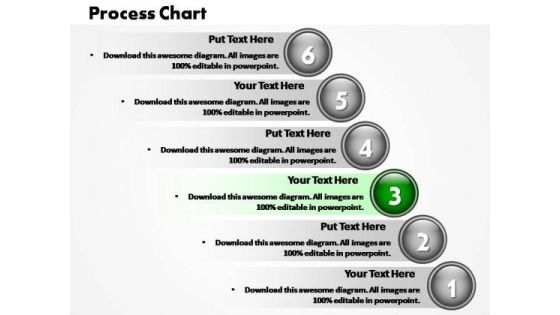
Highlight the key point in selling process with this diagram
PowerPoint Template Bridge Chart Construction Ppt Slides
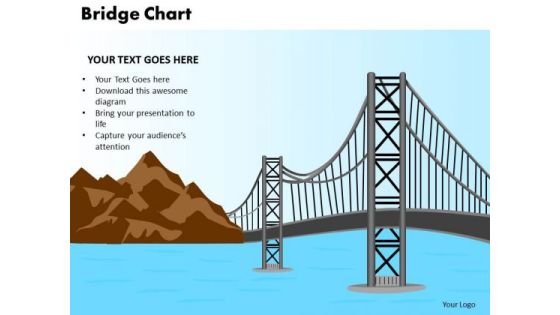
PowerPoint Template Bridge Chart Construction PPT Slides-A Bridge is a structure built to span physical obstacles such as body of water, valley, or road for the purpose of providing passage over the obstacle. Explain your plan of action to bring out likely opposing obstacles and how you intend to convert them into opportunities to achieve results. All this will enable you to share the interesting opportunities with your Audiences. This will increase the interest of the Audiences and thus will help them understand what you are trying to convey to them-PowerPoint Template Bridge Chart Construction PPT Slides-This ppt can be used for presentations relating to-Architecture, Area, Attraction, Bay, Beauty, Blue, Bridge, Cable, California, City, Cloud, Commute, Connection, Dusk, Famous, Francisco, Gate, Golden, Headlands, Historic, Historical, Illustration, Landmark, Marin, Metal, Monument
PowerPoint Templates Circular Flow Chart Ppt Design
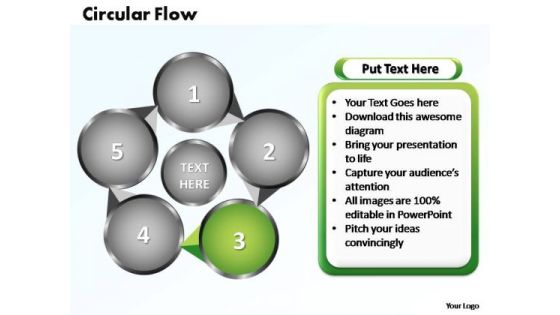
Flowchart is a simple mapping tool that shows the sequence of actions within a process. Flowchart is widely used in business, education and economic presentations to help the audience visualize the content better, or to find flaws in a process.

PowerPoint Templates Circular Flow Chart Ppt Designs
Flowchart is a simple mapping tool that shows the sequence of actions within a process. Flowchart is widely used in business, education and economic presentations to help the audience visualize the content better, or to find flaws in a process.

PowerPoint Templates Circular Flow Chart Ppt Layouts
Flowchart is a simple mapping tool that shows the sequence of actions within a process. Flowchart is widely used in business, education and economic presentations to help the audience visualize the content better, or to find flaws in a process.
PowerPoint Templates Circular Flow Chart Ppt Slide
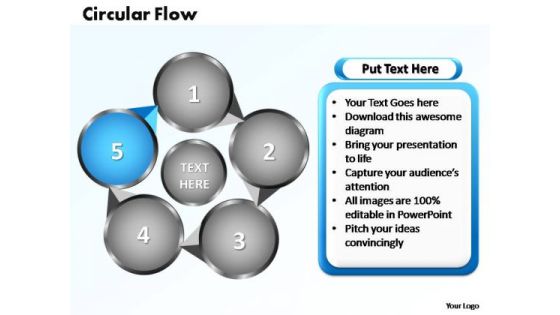
Flowchart is a simple mapping tool that shows the sequence of actions within a process. Flowchart is widely used in business, education and economic presentations to help the audience visualize the content better, or to find flaws in a process.

 Home
Home