Improvement Chart

Business Workflow Chart Vector Icons Ppt PowerPoint Presentation File Example File PDF
Presenting this set of slides with name business workflow chart vector icons ppt powerpoint presentation file example file pdf. This is a three stage process. The stages in this process are business workflow chart vector icons. This is a completely editable PowerPoint presentation and is available for immediate download. Download now and impress your audience.

Business Person With Bar Chart Vector Icon Ppt PowerPoint Presentation File Introduction PDF
Presenting this set of slides with name business person with bar chart vector icon ppt powerpoint presentation file introduction pdf. This is a two stage process. The stages in this process are business person with bar chart vector icon. This is a completely editable PowerPoint presentation and is available for immediate download. Download now and impress your audience.
Three Business Proposal Pricing Chart Template Ppt PowerPoint Presentation Icon Skills PDF
Presenting this set of slides with name three business proposal pricing chart template ppt powerpoint presentation icon skills pdf. This is a three stage process. The stages in this process are three business proposal pricing chart template. This is a completely editable PowerPoint presentation and is available for immediate download. Download now and impress your audience.

Business Statistical Chart In Four Different Colors Ppt PowerPoint Presentation Icon Layouts PDF
Presenting this set of slides with name business statistical chart in four different colors ppt powerpoint presentation icon layouts pdf. This is a four stage process. The stages in this process are business statistical chart in four different colors. This is a completely editable PowerPoint presentation and is available for immediate download. Download now and impress your audience.

Arrow Bar Chart With Four Circles Ppt PowerPoint Presentation Icon Background Images PDF
Presenting this set of slides with name arrow bar chart with four circles ppt powerpoint presentation icon background images pdf. This is a four stage process. The stages in this process are arrow bar chart with four circles. This is a completely editable PowerPoint presentation and is available for immediate download. Download now and impress your audience.
Product Differentiators Chart With Uniqueness Ppt PowerPoint Presentation Icon Slide Download PDF
Presenting this set of slides with name product differentiators chart with uniqueness ppt powerpoint presentation icon slide download pdf. This is a two stage process. The stages in this process are product differentiators chart with uniqueness. This is a completely editable PowerPoint presentation and is available for immediate download. Download now and impress your audience.
Message Mapping Chart With Main Points Ppt PowerPoint Presentation Icon Slides PDF
Presenting this set of slides with name message mapping chart with main points ppt powerpoint presentation icon slides pdf. This is a four stage process. The stages in this process are message mapping chart with main points. This is a completely editable PowerPoint presentation and is available for immediate download. Download now and impress your audience.

Chart For Alternative Cost Analysis Ppt PowerPoint Presentation Slides Icons PDF
Presenting this set of slides with name chart for alternative cost analysis ppt powerpoint presentation slides icons pdf. This is a four stage process. The stages in this process are chart for alternative cost analysis. This is a completely editable PowerPoint presentation and is available for immediate download. Download now and impress your audience.
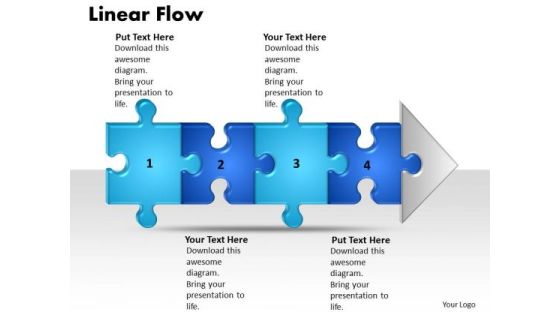
Ppt Linear Demo Create Flow Chart PowerPoint 4 Stage Style1 Templates
PPT linear demo create flow chart powerpoint 4 stage style1 Templates-This is a professional-look process steps diagram. This Process steps diagram is widely used to show sequence of actions.-PPT linear demo create flow chart powerpoint 4 stage style1 Templates-Amusement, Arrow, Board, Cardboard, Children, Deficient, Direction, Diversion, Entertainment, Game, Illustration, Image, Jigsaw, Logo, Lots, Many, Paper, Perspective, Pieces, Play, Puzzle, Vector
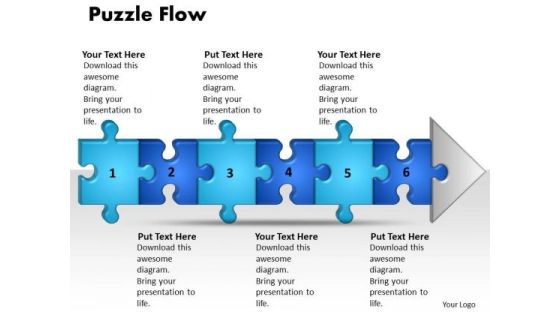
Ppt Linear Demo Create Flow Chart PowerPoint 6 Stage Style1 Templates
PPT linear demo create flow chart powerpoint 6 stage style1 Templates-This is a professional-look process steps diagram. This Process steps diagram is widely used to show sequence of actions.-PPT linear demo create flow chart powerpoint 6 stage style1 Templates-Amusement, Arrow, Board, Cardboard, Children, Deficient, Direction, Diversion, Entertainment, Game, Illustration, Image, Jigsaw, Logo, Lots, Many, Paper, Perspective, Pieces, Play, Puzzle, Vector

Product Life Cycle Chart Ppt PowerPoint Presentation Infographic Template Inspiration Cpb
Presenting this set of slides with name product life cycle chart ppt powerpoint presentation infographic template inspiration cpb. This is a four stage process. The stages in this process are product life cycle chart. This is a completely editable PowerPoint presentation and is available for immediate download. Download now and impress your audience.
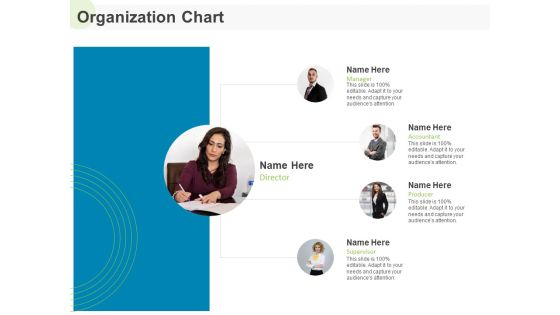
Implementing Human Resources HR Best Practices Strategy Organization Chart Ppt Ideas Files PDF
Presenting this set of slides with name implementing human resources hr best practices strategy organization chart ppt i. This is a four stage process. The stages in this process are organization chart. This is a completely editable PowerPoint presentation and is available for immediate download. Download now and impress your audience.

Selecting Appropriate Distribution Channel New Product Organization Chart Ppt Inspiration Information PDF
Presenting this set of slides with name selecting appropriate distribution channel new product organization chart ppt inspiration information pdf. This is a five stage process. The stages in this process are organization chart. This is a completely editable PowerPoint presentation and is available for immediate download. Download now and impress your audience.

Performance Benchmarking Shown With Laptop And Business Chart Ppt PowerPoint Presentation Slides Maker PDF
Presenting this set of slides with name performance benchmarking shown with laptop and business chart ppt powerpoint presentation slides maker pdf. This is a three stage process. The stages in this process are performance benchmarking shown, laptop, business chart. This is a completely editable PowerPoint presentation and is available for immediate download. Download now and impress your audience.
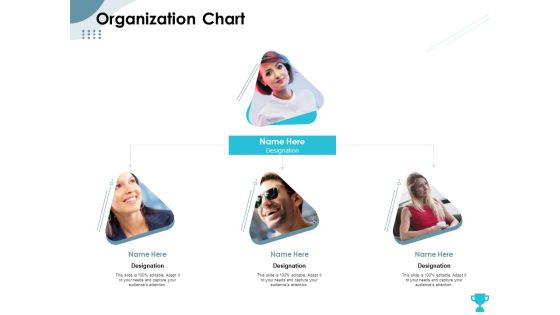
Strategies Take Your Retail Business Ahead Competition Organization Chart Structure PDF
Presenting this set of slides with name strategies take your retail business ahead competition organization chart structure pdf. This is a four stage process. The stages in this process are organization chart. This is a completely editable PowerPoint presentation and is available for immediate download. Download now and impress your audience.
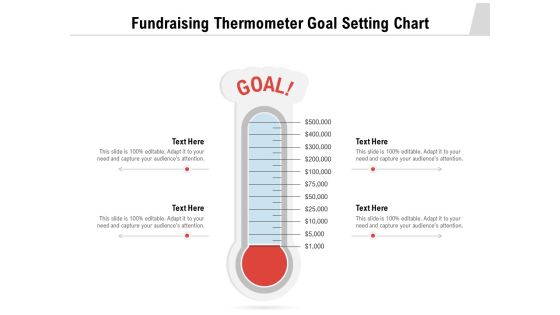
Fundraising Thermometer Goal Setting Chart Ppt PowerPoint Presentation Gallery Master Slide PDF
Presenting this set of slides with name fundraising thermometer goal setting chart ppt powerpoint presentation gallery master slide pdf. This is a one stage process. The stages in this process are fundraising thermometer goal setting chart. This is a completely editable PowerPoint presentation and is available for immediate download. Download now and impress your audience.

Circular Chart Showing Four Stages With Labels Ppt PowerPoint Presentation Gallery Format Ideas PDF
Presenting this set of slides with name circular chart showing four stages with labels ppt powerpoint presentation gallery format ideas pdf. This is a four stage process. The stages in this process are circular chart showing four stages with labels. This is a completely editable PowerPoint presentation and is available for immediate download. Download now and impress your audience.

Numbered Circular Chart With Different Colors Ppt PowerPoint Presentation Gallery Good PDF
Presenting this set of slides with name numbered circular chart with different colors ppt powerpoint presentation gallery good pdf. This is a six stage process. The stages in this process are numbered circular chart with different colors. This is a completely editable PowerPoint presentation and is available for immediate download. Download now and impress your audience.
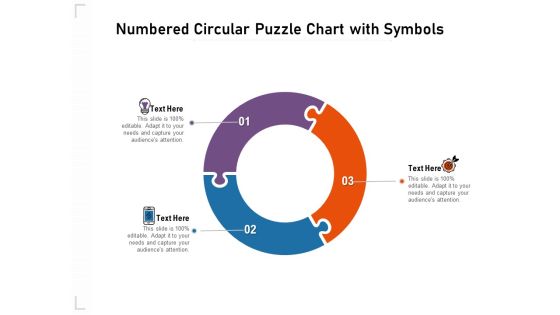
Numbered Circular Puzzle Chart With Symbols Ppt PowerPoint Presentation File Slide Download PDF
Presenting this set of slides with name numbered circular puzzle chart with symbols ppt powerpoint presentation file slide download pdf. This is a three stage process. The stages in this process are numbered circular puzzle chart with symbols. This is a completely editable PowerPoint presentation and is available for immediate download. Download now and impress your audience.

Pie Chart For Business Shareholder With Share Value Ppt PowerPoint Presentation Gallery Layout Ideas PDF
Presenting this set of slides with name pie chart for business shareholder with share value ppt powerpoint presentation gallery layout ideas pdf. This is a four stage process. The stages in this process are pie chart for business shareholder with share value. This is a completely editable PowerPoint presentation and is available for immediate download. Download now and impress your audience.

Website Performance Assessment Chart Image Ppt PowerPoint Presentation Slides Visuals PDF
Presenting this set of slides with name website performance assessment chart image ppt powerpoint presentation slides visuals pdf. This is a three stage process. The stages in this process are website performance assessment chart image. This is a completely editable PowerPoint presentation and is available for immediate download. Download now and impress your audience.
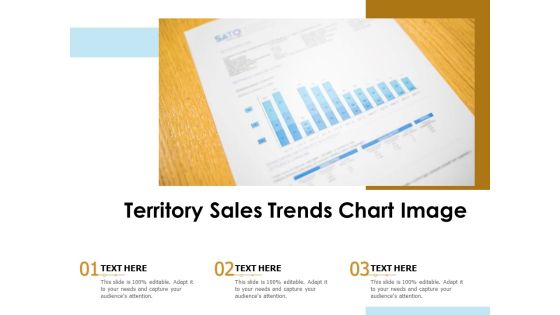
Territory Sales Trends Chart Image Ppt PowerPoint Presentation Visual Aids Infographic Template PDF
Presenting this set of slides with name territory sales trends chart image ppt powerpoint presentation visual aids infographic template pdf. This is a three stage process. The stages in this process are territory sales trends chart image. This is a completely editable PowerPoint presentation and is available for immediate download. Download now and impress your audience.
Female Officer Creating Billing Work Flow Chart Ppt PowerPoint Presentation Layouts Introduction PDF
Presenting this set of slides with name female officer creating billing work flow chart ppt powerpoint presentation layouts introduction pdf. This is a six stage process. The stages in this process are female officer creating billing work flow chart. This is a completely editable PowerPoint presentation and is available for immediate download. Download now and impress your audience.

Org Chart With Team Roles And Designations Ppt PowerPoint Presentation File Slides PDF
Presenting this set of slides with name org chart with team roles and designations ppt powerpoint presentation file slides pdf. This is a three stage process. The stages in this process are org chart with team roles and designations. This is a completely editable PowerPoint presentation and is available for immediate download. Download now and impress your audience.
Pie Chart In Magnifying Glass For Business Performance Assessment Ppt PowerPoint Presentation Gallery Infographics PDF
Presenting this set of slides with name pie chart in magnifying glass for business performance assessment ppt powerpoint presentation gallery infographics pdf. This is a three stage process. The stages in this process are pie chart in magnifying glass for business performance assessment. This is a completely editable PowerPoint presentation and is available for immediate download. Download now and impress your audience.

Items Rate Chart With Dollar Symbol Ppt PowerPoint Presentation Professional Pictures PDF
Presenting this set of slides with name items rate chart with dollar symbol ppt powerpoint presentation professional pictures pdf. This is a four stage process. The stages in this process are items rate chart with dollar symbol. This is a completely editable PowerPoint presentation and is available for immediate download. Download now and impress your audience.

Four Quadrants Scenario Assessment Chart Ppt PowerPoint Presentation Professional Visual Aids PDF
Presenting this set of slides with name four quadrants scenario assessment chart ppt powerpoint presentation professional visual aids pdf. This is a four stage process. The stages in this process are four quadrants scenario assessment chart. This is a completely editable PowerPoint presentation and is available for immediate download. Download now and impress your audience.

Linear Steps Busines Workflow Chart Ppt PowerPoint Presentation File Designs PDF
Presenting this set of slides with name linear steps busines workflow chart ppt powerpoint presentation file designs pdf. This is a five stage process. The stages in this process are linear steps busines workflow chart. This is a completely editable PowerPoint presentation and is available for immediate download. Download now and impress your audience.

Chart Showing Performance And Effectiveness Of Team Ppt PowerPoint Presentation Layouts Information PDF
Presenting this set of slides with name chart showing performance and effectiveness of team ppt powerpoint presentation layouts information pdf. This is a one stage process. The stage in this process is chart showing performance and effectiveness of team. This is a completely editable PowerPoint presentation and is available for immediate download. Download now and impress your audience.

Arrow Bar Chart With Five Circles Ppt PowerPoint Presentation Gallery Design Templates PDF
Presenting this set of slides with name arrow bar chart with five circles ppt powerpoint presentation gallery design templates pdf. This is a five stage process. The stages in this process are arrow bar chart with five circles. This is a completely editable PowerPoint presentation and is available for immediate download. Download now and impress your audience.

Arrow Bar Chart With Seven Circles Ppt PowerPoint Presentation File Formats PDF
Presenting this set of slides with name arrow bar chart with seven circles ppt powerpoint presentation file formats pdf. This is a seven stage process. The stages in this process are arrow bar chart with seven circles. This is a completely editable PowerPoint presentation and is available for immediate download. Download now and impress your audience.

Arrow Bar Chart With Six Circles Ppt PowerPoint Presentation Gallery Design Inspiration PDF
Presenting this set of slides with name arrow bar chart with six circles ppt powerpoint presentation gallery design inspiration pdf. This is a six stage process. The stages in this process are arrow bar chart with six circles. This is a completely editable PowerPoint presentation and is available for immediate download. Download now and impress your audience.

Arrow Bar Chart With Three Circles Ppt PowerPoint Presentation File Maker PDF
Presenting this set of slides with name arrow bar chart with three circles ppt powerpoint presentation file maker pdf. This is a three stage process. The stages in this process are arrow bar chart with three circles. This is a completely editable PowerPoint presentation and is available for immediate download. Download now and impress your audience.

Chart Showing Six Business Options Ppt PowerPoint Presentation File Slideshow PDF
Presenting this set of slides with name chart showing six business options ppt powerpoint presentation file slideshow pdf. This is a six stage process. The stages in this process are chart showing six business options. This is a completely editable PowerPoint presentation and is available for immediate download. Download now and impress your audience.

Business Capabilities Chart With Value And Time Ppt PowerPoint Presentation File Designs Download PDF
Presenting this set of slides with name business capabilities chart with value and time ppt powerpoint presentation file designs download pdf. This is a five stage process. The stages in this process are business capabilities chart with value and time. This is a completely editable PowerPoint presentation and is available for immediate download. Download now and impress your audience.

Business Tasks Management Workflow Chart Ppt PowerPoint Presentation File Designs PDF
Presenting this set of slides with name business tasks management workflow chart ppt powerpoint presentation file designs pdf. This is a two stage process. The stages in this process are business tasks management workflow chart. This is a completely editable PowerPoint presentation and is available for immediate download. Download now and impress your audience.
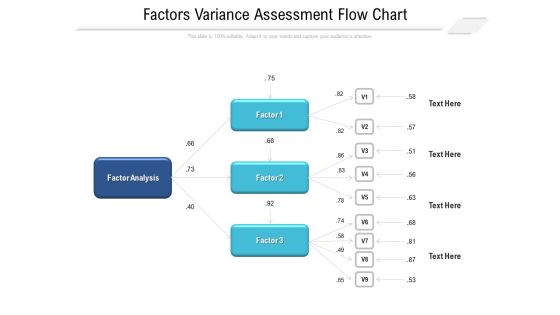
Factors Variance Assessment Flow Chart Ppt PowerPoint Presentation Gallery Example PDF
Presenting this set of slides with name factors variance assessment flow chart ppt powerpoint presentation gallery example pdf. This is a three stage process. The stages in this process are factors variance assessment flow chart. This is a completely editable PowerPoint presentation and is available for immediate download. Download now and impress your audience.
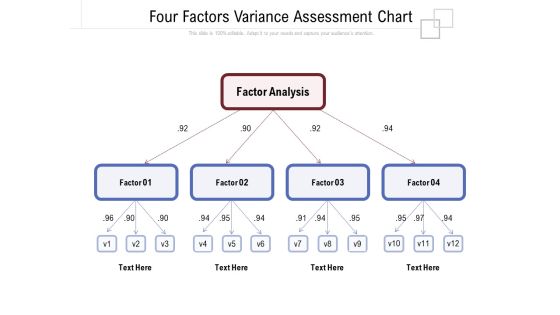
Four Factors Variance Assessment Chart Ppt PowerPoint Presentation Gallery Background Image PDF
Presenting this set of slides with name four factors variance assessment chart ppt powerpoint presentation gallery background image pdf. This is a four stage process. The stages in this process are four factors variance assessment chart. This is a completely editable PowerPoint presentation and is available for immediate download. Download now and impress your audience.
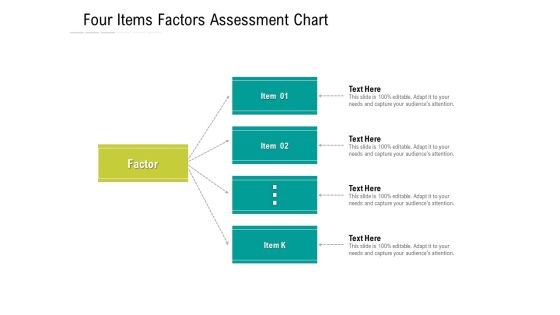
Four Items Factors Assessment Chart Ppt PowerPoint Presentation File Graphic Tips PDF
Presenting this set of slides with name four items factors assessment chart ppt powerpoint presentation file graphic tips pdf. This is a four stage process. The stages in this process are four items factors assessment chart. This is a completely editable PowerPoint presentation and is available for immediate download. Download now and impress your audience.

Two Factors Variables Assessment Chart Ppt PowerPoint Presentation File Clipart PDF
Presenting this set of slides with name two factors variables assessment chart ppt powerpoint presentation file clipart pdf. This is a two stage process. The stages in this process are two factors variables assessment chart. This is a completely editable PowerPoint presentation and is available for immediate download. Download now and impress your audience.

Fractional Section Of Set Donut Chart Project Management Business Ppt PowerPoint Presentation Complete Deck
Presenting this set of slides with name fractional section of set donut chart project management business ppt powerpoint presentation complete deck. The topics discussed in these slides are donut chart, project management, business, strategy, process. This is a completely editable PowerPoint presentation and is available for immediate download. Download now and impress your audience.

Phone Tree Template Employee Hierarchy Chart Communication Ppt PowerPoint Presentation Complete Deck
Presenting this set of slides with name phone tree template employee hierarchy chart communication ppt powerpoint presentation complete deck. The topics discussed in these slides are employee, hierarchy chart, communication, management, process. This is a completely editable PowerPoint presentation and is available for immediate download. Download now and impress your audience.
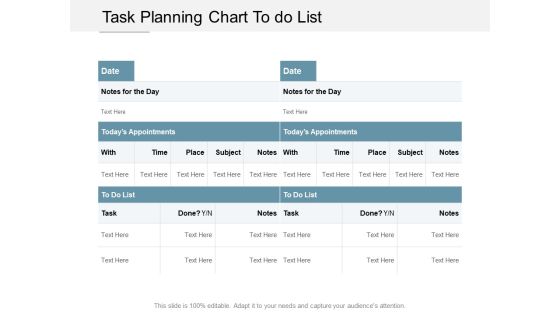
Task Planning Chart To Do List Ppt PowerPoint Presentation Infographics Picture Cpb
This is a task planning chart to do list ppt powerpoint presentation infographics picture cpb. This is a three stage process. The stages in this process are key activities, key highlights, list of activities.

Agile Process Flow Chart With In Progress And Review Ppt PowerPoint Presentation File Demonstration PDF
Presenting agile process flow chart with in progress and review ppt powerpoint presentation file demonstration pdf to dispense important information. This template comprises one stages. It also presents valuable insights into the topics including agile process flow chart with in progress and review. This is a completely customizable PowerPoint theme that can be put to use immediately. So, download it and address the topic impactfully.
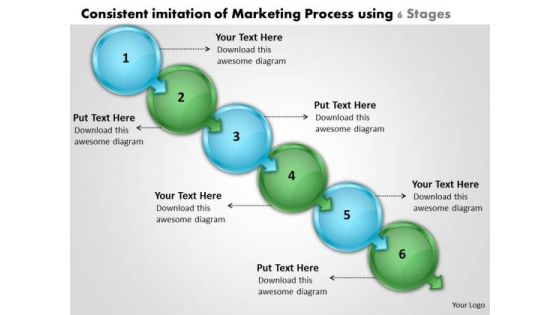
Consistent Imitation Of Marketing Process Using 6 Stages System Flow Chart PowerPoint Slides
We present our consistent imitation of marketing process using 6 stages system flow chart PowerPoint Slides.Use our Arrows PowerPoint Templates because,This is a wonderful graphics to see the smiles of happiness spread as your audience realizes the value of your words. Use our Spheres PowerPoint Templates because, It helps to churn the mixture to the right degree and pound home your views and expectations in a spectacularly grand and virtuoso fluid performance. Use our Marketing PowerPoint Templates because,You can Raise your Company stocks at the Opening Bell. Use our Business PowerPoint Templates because,This template helps to pierce through the doubts of your audience. Use our Abstract PowerPoint Templates because,Like your thoughts arrows are inherently precise and true.Use these PowerPoint slides for presentations relating to Arrow, Art, Assess, Blue, Business, Chart, Chevron, Clip, Clipart, Colorful, Compliance, Corporate, Design, Development, Diagram, Flow, Glossy, Graphic, Hierarchy, Icon, Illustration, Implement, Infographic, Levels, Marketing, Modern, Plan, Process, Shape, Shiny, Square, Stages, Vector. The prominent colors used in the PowerPoint template are Blue, Green, Blue light

Business Growth Trends Vector Icon With Rising Chart Ppt PowerPoint Presentation Gallery Designs PDF
Persuade your audience using this business growth trends vector icon with rising chart ppt powerpoint presentation gallery designs pdf. This PPT design covers three stages, thus making it a great tool to use. It also caters to a variety of topics including business growth trends vector icon with rising chart. Download this PPT design now to present a convincing pitch that not only emphasizes the topic but also showcases your presentation skills.
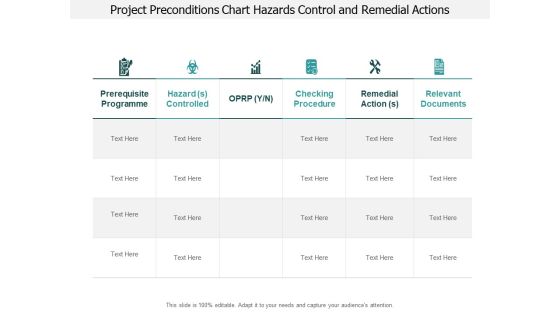
Project Preconditions Chart Hazards Control And Remedial Actions Ppt PowerPoint Presentation Pictures Show
This is a project preconditions chart hazards control and remedial actions ppt powerpoint presentation pictures show. This is a six stage process. The stages in this process are need, requirement, prerequisite.
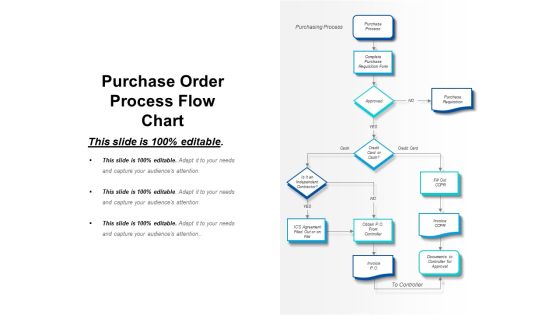
Purchase Order Process Flow Chart Ppt PowerPoint Presentation Professional Slide Download
This is a purchase order process flow chart ppt powerpoint presentation professional slide download. This is a six stage process. The stages in this process are purchasing, procurement, bidding.

Bar Chart For Business Performance Evaluation Ppt PowerPoint Presentation Infographics Professional
This is a bar chart for business performance evaluation ppt powerpoint presentation infographics professional. This is a five stage process. The stages in this process are metrics icon, kpis icon, statistics icon.

Input Process Output Chart To Analyze Impact Of Technological Change Graphics PDF
This slide covers the IPO input-process-output chart depicting the impact on consumer behavior based on the changes in technology. The purpose of this IPO chart is to analyze the advancement of technology. It includes information related to the environmental factors, consumer details, etc. Pitch your topic with ease and precision using this Input Process Output Chart To Analyze Impact Of Technological Change Graphics PDF. This layout presents information on Input External Influences, Process Consumer, Output Results. It is also available for immediate download and adjustment. So, changes can be made in the color, design, graphics or any other component to create a unique layout.

Building Innovation Capabilities And USP Detection Product Capability Assessment Gantt Chart Ppt Summary Gridlines PDF
The Schedule of the Product Capability assessment process can be shown through this Gantt chart provided in the slide. Deliver and pitch your topic in the best possible manner with this building innovation capabilities and usp detection product capability assessment gantt chart ppt summary gridlines pdf. Use them to share invaluable insights on competency identification, competency ranking, maturity assessment, map competencies, developing competencies, review and impress your audience. This template can be altered and modified as per your expectations. So, grab it now.
Money Investment Growth Chart Vector Icon Ppt PowerPoint Presentation Slides Influencers PDF
Persuade your audience using this money investment growth chart vector icon ppt powerpoint presentation slides influencers pdf. This PPT design covers three stages, thus making it a great tool to use. It also caters to a variety of topics including money investment growth chart vector icon. Download this PPT design now to present a convincing pitch that not only emphasizes the topic but also showcases your presentation skills.
Economics With Business Growth Chart Vector Icon Ppt PowerPoint Presentation File Rules PDF
Persuade your audience using this economics with business growth chart vector icon ppt powerpoint presentation file rules pdf. This PPT design covers three stages, thus making it a great tool to use. It also caters to a variety of topics including economics with business growth chart vector icon. Download this PPT design now to present a convincing pitch that not only emphasizes the topic but also showcases your presentation skills.

Growth Arrow Chart Showing Good Financial Condition Ppt PowerPoint Presentation Pictures Summary PDF
Persuade your audience using this growth arrow chart showing good financial condition ppt powerpoint presentation pictures summary pdf. This PPT design covers two stages, thus making it a great tool to use. It also caters to a variety of topics including growth arrow chart showing good financial condition. Download this PPT design now to present a convincing pitch that not only emphasizes the topic but also showcases your presentation skills.
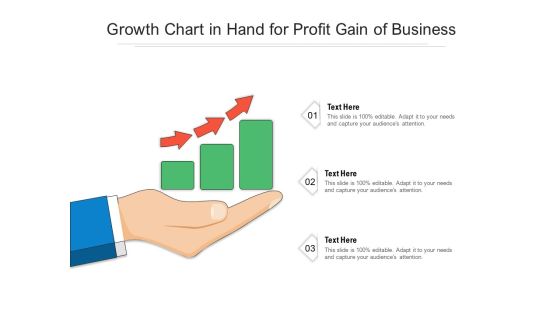
Growth Chart In Hand For Profit Gain Of Business Ppt PowerPoint Presentation File Background PDF
Persuade your audience using this growth chart in hand for profit gain of business ppt powerpoint presentation file background pdf. This PPT design covers three stages, thus making it a great tool to use. It also caters to a variety of topics including growth chart in hand for profit gain of business. Download this PPT design now to present a convincing pitch that not only emphasizes the topic but also showcases your presentation skills.
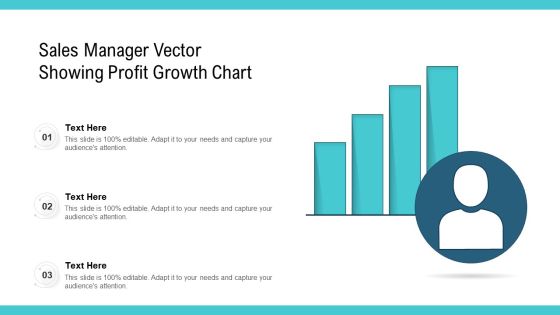
Sales Manager Vector Showing Profit Growth Chart Ppt Portfolio Inspiration PDF
Persuade your audience using this sales manager vector showing profit growth chart ppt portfolio inspiration pdf. This PPT design covers three stages, thus making it a great tool to use. It also caters to a variety of topics including sales manager vector showing profit growth chart. Download this PPT design now to present a convincing pitch that not only emphasizes the topic but also showcases your presentation skills.
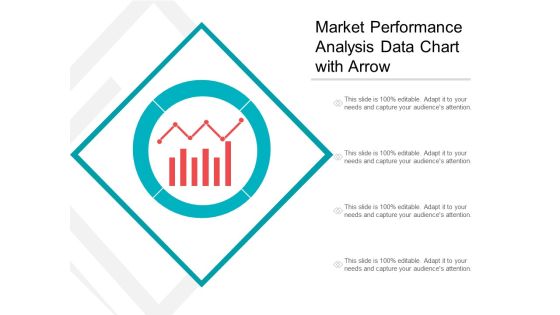
Market Performance Analysis Data Chart With Arrow Ppt PowerPoint Presentation Inspiration Graphics
This is a market performance analysis data chart with arrow ppt powerpoint presentation inspiration graphics. This is a four stage process. The stages in this process are marketing analytics, marketing performance, marketing discovery.

Bulb Or Idea Chart Ppt PowerPoint Presentation Infographic Template Design Ideas
This is a bulb or idea chart ppt powerpoint presentation infographic template design ideas. This is a one stages process. The stages in this process are bulb or idea, technology, strategy, management, planning.
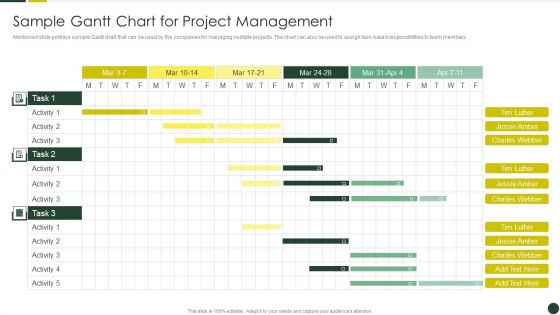
Quality Management Plan Templates Set 2 Sample Gantt Chart For Project Management Inspiration PDF
Mentioned slide portrays sample Gantt chart that can be used by the companies for managing multiple projects. The chart can also be used to assign task-based responsibilities to team members. Deliver an awe inspiring pitch with this creative Quality Management Plan Templates Set 2 Sample Gantt Chart For Project Management Inspiration PDF bundle. Topics like Quality Management, Quality Management, Baseline Performance can be discussed with this completely editable template. It is available for immediate download depending on the needs and requirements of the user.

Unit Economic Profitability Cost Volume Analysis Chart Ppt PowerPoint Presentation Styles Graphics Design
This is a unit economic profitability cost volume analysis chart ppt powerpoint presentation styles graphics design. This is a five stage process. The stages in this process are business unit profitability, profitable organization, corporate unit profitability.
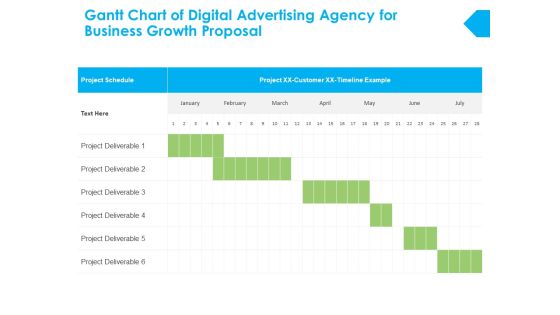
Gantt Chart Of Digital Advertising Agency For Business Growth Proposal Ppt PowerPoint Presentation Gallery Graphics
Make a highly optimized project management report using this content-ready Gantt Chart PPT Diagram. Effortless yet very clear, this layout proves a useful tool to present the professional details of a task or activity. Showcase the activities and allotted time to the business executives with this Gantt Chart PowerPoint theme. List down the column tasks in various timeframes and the activities associated with each of them here. Further, plot time allocation for various tasks, monitor their actual time and make comparisons to interpret the final progress with this well-structured Gantt Chart Excel Template. You can add all the significant details of a particular project in this chart and showcase it to all the project members so that they can participate in the overall development. Not only this but also our PPT template can help you showcase the work breakdown structure of your project.

Strategies To Enhance Project Management Process Raci Chart Showing Responsibilities Of Project Team Portrait PDF
This slide covers the RACI chart that shows responsibilities of project team members such as initiation, planning, execution, controlling and closing respective to each role. Deliver an awe inspiring pitch with this creative Strategies To Enhance Project Management Process Raci Chart Showing Responsibilities Of Project Team Portrait PDF bundle. Topics like Perform Changes Management, Plan Phase Activities, External Resources can be discussed with this completely editable template. It is available for immediate download depending on the needs and requirements of the user.
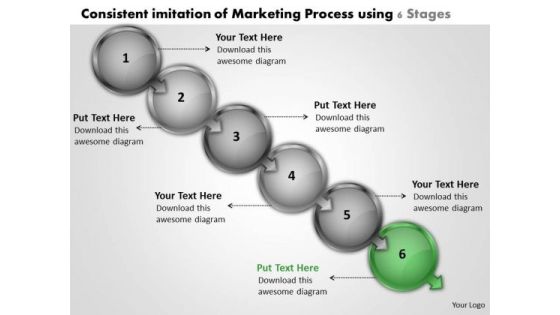
Consistent Imitation Of Marketing Process Using 6 Stages Typical Flow Chart PowerPoint Templates
We present our consistent imitation of marketing process using 6 stages typical flow chart PowerPoint templates.Use our Arrows PowerPoint Templates because, It is in your DNA to analyse possible causes to the minutest detail. Use our Spheres PowerPoint Templates because,With the help of our Slides you can Illustrate your plans to your listeners with the same accuracy. Use our Marketing PowerPoint Templates because, Customer satisfaction is a mantra of the marketplace. Building a loyal client base is an essential element of your business Use our Business PowerPoint Templates because,Your thoughts are pointed and sharp as arrows. Use our Abstract PowerPoint Templates because, This is Aesthetically designed to make a great first impression this template highlights .Use these PowerPoint slides for presentations relating to Arrow, Art, Assess, Blue, Business, Chart, Chevron, Clip, Clipart, Colorful, Compliance, Corporate, Design, Development, Diagram, Flow, Glossy, Graphic, Hierarchy, Icon, Illustration, Implement, Infographic, Levels, Marketing, Modern, Plan, Process, Shape, Shiny, Square, Stages, Vector. The prominent colors used in the PowerPoint template are Green, Gray, Black
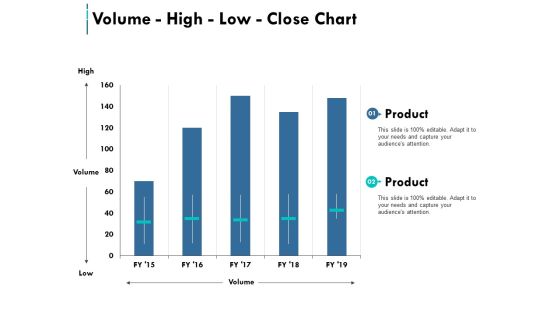
Volume High Low Close Chart Ppt PowerPoint Presentation Pictures Graphics Example
This is a volume high low close chart ppt powerpoint presentation pictures graphics example. This is a two stage process. The stages in this process are marketing, business, management.
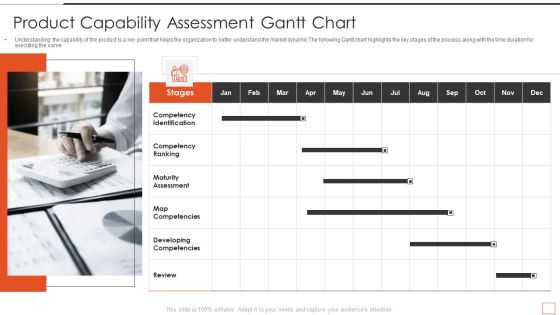
Developing New Product Messaging Canvas Determining Its USP Product Capability Assessment Gantt Chart Information PDF
Understanding the capability of the product is a key point that helps the organization to better understand the market dynamic The following Gantt chart highlights the key stages of the process along with the time duration for executing the same Presenting developing new product messaging canvas determining its usp product capability assessment gantt chart information pdf to provide visual cues and insights. Share and navigate important information on one stages that need your due attention. This template can be used to pitch topics like product capability assessment gantt chart. In addtion, this PPT design contains high resolution images, graphics, etc, that are easily editable and available for immediate download.

Data Collection And Analysis Control Chart Ppt PowerPoint Presentation Example File
This is a data collection and analysis control chart ppt powerpoint presentation example file. This is a four stage process. The stages in this process are business, strategy, marketing, bar graph, growth strategy.
Manager Analyzing Trends From Financial Modelling Chart Vector Icon Portrait PDF
Persuade your audience using this manager analyzing trends from financial modelling chart vector icon portrait pdf. This PPT design covers three stages, thus making it a great tool to use. It also caters to a variety of topics including manager analyzing trends from financial modelling chart vector icon. Download this PPT design now to present a convincing pitch that not only emphasizes the topic but also showcases your presentation skills.

Rectangle Text Boxes With Diverging Arrows Chart Circular Flow Network PowerPoint Templates
We present our rectangle text boxes with diverging arrows chart Circular Flow Network PowerPoint templates.Download our Process and Flows PowerPoint Templates because it is in your DNA to analyse possible causes to the minutest detail. Download and present our Business PowerPoint Templates because you have secured a name for yourself in the domestic market. Now the time is right to spread your reach to other countries. Present our Shapes PowerPoint Templates because you can put down your ideas and present them using our innovative templates. Use our Success PowerPoint Templates because you have come up with a brilliant breakthrough idea. you can also visualise the interest it will generate. Use our Boxes PowerPoint Templates because your findings are here to help arrive at an accurate diagnosis.Use these PowerPoint slides for presentations relating to Arrow, Blank, Chart, Diagram, Flow, Flow Chart, Illustration, Plan, Presentation, Process, Process Chart, Scheme. The prominent colors used in the PowerPoint template are Black, Green, Gray. Professionals tell us our rectangle text boxes with diverging arrows chart Circular Flow Network PowerPoint templates are Fabulous. Customers tell us our Diagram PowerPoint templates and PPT Slides are Magical. Use our rectangle text boxes with diverging arrows chart Circular Flow Network PowerPoint templates will impress their bosses and teams. The feedback we get is that our Chart PowerPoint templates and PPT Slides are designed to make your presentations professional. Professionals tell us our rectangle text boxes with diverging arrows chart Circular Flow Network PowerPoint templates are Youthful. Presenters tell us our Plan PowerPoint templates and PPT Slides will help you be quick off the draw. Just enter your specific text and see your points hit home.
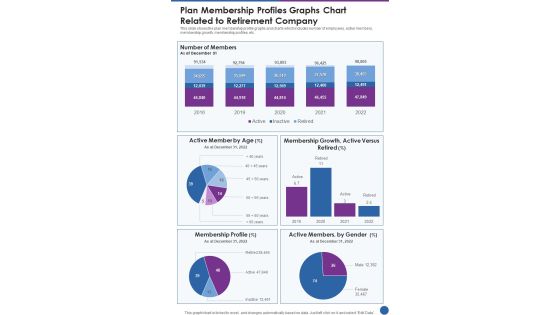
Plan Membership Profiles Graphs Chart Related To Retirement Company One Pager Documents
This slide shows the plan membership profile graphs and charts which includes number of employees, active members, membership growth, membership profiles, etc. Presenting you a fantastic Plan Membership Profiles Graphs Chart Related To Retirement Company One Pager Documents. This piece is crafted on hours of research and professional design efforts to ensure you have the best resource. It is completely editable and its design allow you to rehash its elements to suit your needs. Get this Plan Membership Profiles Graphs Chart Related To Retirement Company One Pager Documents A4 One-pager now.

9 Arrows Describing Nine Steps Ppt Flow Chart Creator Online PowerPoint Templates
We present our 9 arrows describing nine steps ppt flow chart creator online PowerPoint templates.Use our Arrows PowerPoint Templates because this diagram has the unique ability to drive home your ideas and show how they mesh to guarantee success. Download and present our Business PowerPoint Templates because your thoughts are pointed and sharp as arrows. Download and present our Competition PowerPoint Templates because you will be able to Highlight the various ways in which we can maintain its efficiency. Download our Design PowerPoint Templates because this slide shows each path to the smallest detail. Use our Shapes PowerPoint Templates because it shows you the vision of a desired destination and the best road to take to reach that goal.Use these PowerPoint slides for presentations relating to arrow, arrows, block, business, chart, design, development, diagram, direction, element, flow, flowchart, graph, linear, management, organization, process, program, section, sign, solution, symbol. The prominent colors used in the PowerPoint template are Blue, Gray, Black. Professionals tell us our 9 arrows describing nine steps ppt flow chart creator online PowerPoint templates are Fancy. The feedback we get is that our chart PowerPoint templates and PPT Slides are Vintage. We assure you our 9 arrows describing nine steps ppt flow chart creator online PowerPoint templates are Romantic. Customers tell us our chart PowerPoint templates and PPT Slides are Multicolored. Presenters tell us our 9 arrows describing nine steps ppt flow chart creator online PowerPoint templates are Cheerful. People tell us our design PowerPoint templates and PPT Slides are Adorable.

Product Demand Grid Chart With Increase In Sales Volume Ppt Slides Tips PDF
Persuade your audience using this product demand grid chart with increase in sales volume ppt slides tips pdf. This PPT design covers four stages, thus making it a great tool to use. It also caters to a variety of topics including product demand grid chart with increase in sales volume. Download this PPT design now to present a convincing pitch that not only emphasizes the topic but also showcases your presentation skills.
Revenue Cycle Management Flow Chart Ppt PowerPoint Presentation Outline Designs Cpb
Presenting this set of slides with name revenue cycle management flow chart ppt powerpoint presentation outline designs cpb. This is an editable Powerpoint three stages graphic that deals with topics like revenue cycle management flow chart to help convey your message better graphically. This product is a premium product available for immediate download and is 100 percent editable in Powerpoint. Download this now and use it in your presentations to impress your audience.
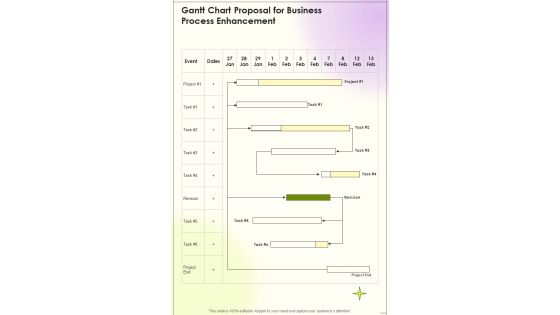
Gantt Chart Proposal For Business Process Enhancement One Pager Sample Example Document
Presenting you an exemplary Gantt Chart Proposal For Business Process Enhancement One Pager Sample Example Document. Our one pager comprises all the must have essentials of an inclusive document. You can edit it with ease, as its layout is completely editable. With such freedom, you can tweak its design and other elements to your requirements. Download this Gantt Chart Proposal For Business Process Enhancement One Pager Sample Example Document brilliant piece now.
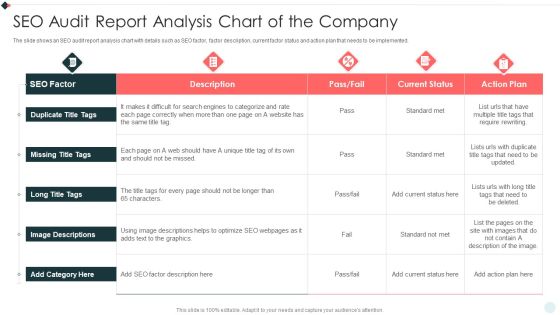
SEO Audit Summary To Increase SEO Audit Report Analysis Chart Of The Company Template PDF
The slide shows an SEO audit report analysis chart with details such as SEO factor, factor description, current factor status and action plan that needs to be implemented. Deliver an awe inspiring pitch with this creative SEO Audit Summary To Increase SEO Audit Report Analysis Chart Of The Company Template PDF bundle. Topics like Current Status, Action Plan, SEO Factor can be discussed with this completely editable template. It is available for immediate download depending on the needs and requirements of the user.

Volume Open High Low Close Chart Ppt PowerPoint Presentation Infographics Guide
This is a volume open high low close chart ppt powerpoint presentation infographics guide. This is a two stage process. The stages in this process are close, high, volume, low, open, product.
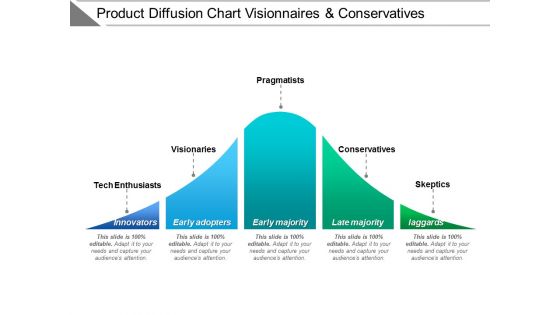
Product Diffusion Chart Visionaries And Conservatives Ppt PowerPoint Presentation Model Clipart
This is a product diffusion chart visionaries and conservatives ppt powerpoint presentation model clipart. This is a five stage process. The stages in this process are adoption curve, crossing the chasm, hype cycle.
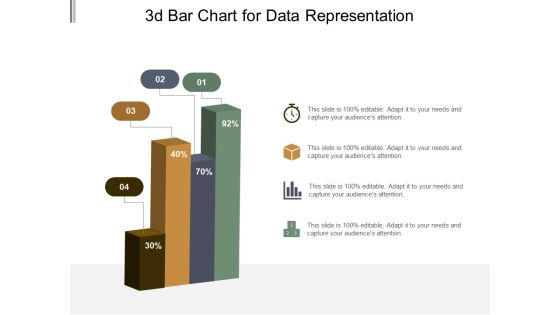
3D Bar Chart For Data Representation Ppt PowerPoint Presentation Model Graphic Tips
This is a 3d bar chart for data representation ppt powerpoint presentation model graphic tips. This is a four stage process. The stages in this process are art, colouring, paint brush.

3D Bar Chart For Technical Analysis Ppt PowerPoint Presentation Summary Visuals
This is a 3d bar chart for technical analysis ppt powerpoint presentation summary visuals. This is a five stage process. The stages in this process are art, colouring, paint brush.
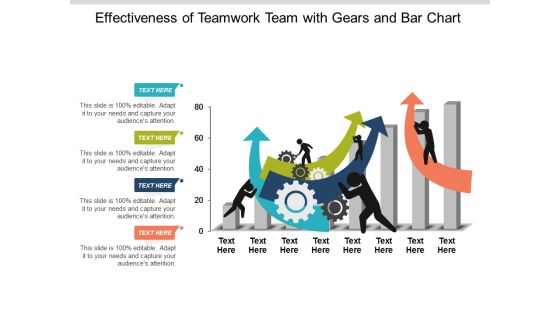
Effectiveness Of Teamwork Team With Gears And Bar Chart Ppt Powerpoint Presentation Ideas Information
This is a effectiveness of teamwork team with gears and bar chart ppt powerpoint presentation ideas information. This is a four stage process. The stages in this process are team performance, member performance, group performance.
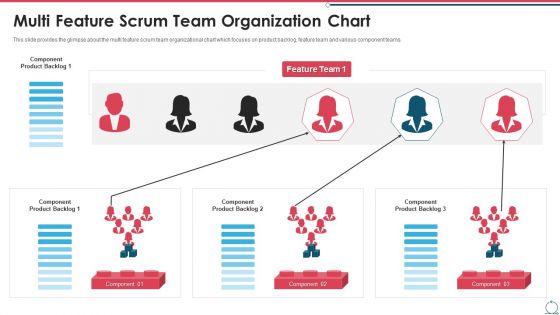
Building An Agile Development Scrum Team Multi Feature Scrum Team Organization Chart Summary PDF
This slide provides the glimpse about the multi feature scrum team organizational chart which focuses on product backlog, feature team and various component teams. This is a building an agile development scrum team multi feature scrum team organization chart summary pdf template with various stages. Focus and dispense information on three stages using this creative set, that comes with editable features. It contains large content boxes to add your information on topics like multi feature scrum team organization chart. You can also showcase facts, figures, and other relevant content using this PPT layout. Grab it now.

Building An Agile Development Scrum Team Scrum Organization Chart For Cross Functional Teams Mockup PDF
This slide provides the glimpse about the cross functional teams scrum organization chart which focuses on different teams and front end, back end and quality analysts. This is a building an agile development scrum team scrum organization chart for cross functional teams mockup pdf template with various stages. Focus and dispense information on one stages using this creative set, that comes with editable features. It contains large content boxes to add your information on topics like scrum organization chart for cross functional teams. You can also showcase facts, figures, and other relevant content using this PPT layout. Grab it now.

Gantt Chart For Statistical Evaluation Of Research Discovery Proposal One Pager Sample Example Document
Presenting you an exemplary Gantt Chart For Statistical Evaluation Of Research Discovery Proposal One Pager Sample Example Document. Our one pager comprises all the must have essentials of an inclusive document. You can edit it with ease, as its layout is completely editable. With such freedom, you can tweak its design and other elements to your requirements. Download this Gantt Chart For Statistical Evaluation Of Research Discovery Proposal One Pager Sample Example Document brilliant piece now.

Ppt Slide Bar Graph For Time Dependent Process Chart Consulting Firms
Land The Idea With Our PPT Slide bar graph for time dependent process chart consulting firms Powerpoint Templates. Help It Grow With Your Thoughts. Cover The Compass With Our Business Plan Powerpoint Templates. Your Ideas Will Be Acceptable To All.

Competitive Analysis Template 8 Matrix Chart Ppt PowerPoint Presentation Designs Download
This is a competitive analysis template 8 matrix chart ppt powerpoint presentation designs download. This is a six stage process. The stages in this process are product quality, product fidelity, after sales service, customer service, price, shipping speed.

Decision Making Flow Chart Icon With Arrows Ppt Layouts Graphics Design PDF
Persuade your audience using this Decision Making Flow Chart Icon With Arrows Ppt Layouts Graphics Design PDF. This PPT design covers four stages, thus making it a great tool to use. It also caters to a variety of topics including Decision Making, Flow Chart, Icon With Arrows. Download this PPT design now to present a convincing pitch that not only emphasizes the topic but also showcases your presentation skills.
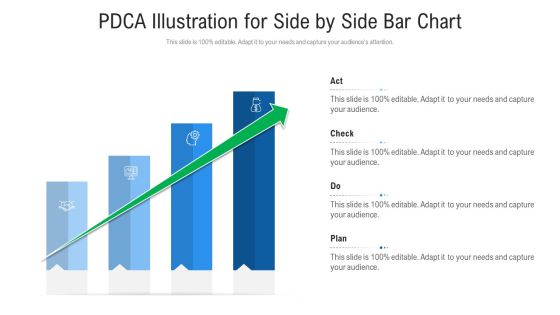
Pdca Illustration For Side By Side Bar Chart Ppt PowerPoint Presentation Gallery Maker PDF
Presenting pdca illustration for side by side bar chart ppt powerpoint presentation gallery maker pdf to provide visual cues and insights. Share and navigate important information on four stages that need your due attention. This template can be used to pitch topics like pdca illustration for side by side bar chart. In addtion, this PPT design contains high resolution images, graphics, etc, that are easily editable and available for immediate download.
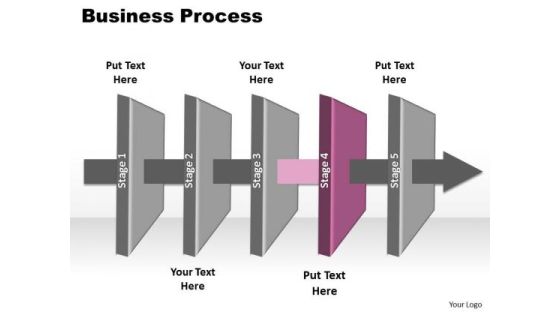
Ppt 5 Layers Marketing Forging Process PowerPoint Slides Chart 4 Templates
PPT 5 layers marketing forging process powerpoint slides chart 4 Templates-This PowerPoint Diagram shows you the 3d Horizontal Representation to explain Internet Marketing. It consists of Five Layers explaining fourth here. It imitates advertise, barter, display, exchange, merchandise, offer for sale, retail, vend, wholesale etc.-PPT 5 layers marketing forging process powerpoint slides chart 4 Templates-3d, arrow, art, business, chart, chevron, clip, clipart, colorful, compliance, corporate, design, development, diagram, executive, flow, glossy, graph, graphic, green, hierarchy, icon, illustration, implement, infographic, levels, marketing, modern, orange, org, organization, organize, pink, plan, process, red, review, set, shadow, shape, shiny, square, stages, vector
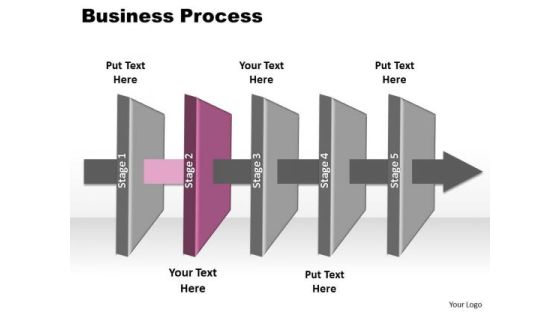
Ppt 5 Layers Social Network PowerPoint Presentation Process Chart 2 Templates
PPT 5 layers social network powerpoint presentation process chart 2 Templates-This PowerPoint Diagram shows you the 3d Horizontal Illustration to explain Social Networking. It consists of Five Layers explaining second here. It imitates advertise, barter, display, exchange, merchandise, offer for sale, retail, vend, wholesale etc.-PPT 5 layers social network powerpoint presentation process chart 2 Templates-3d, arrow, art, assess, blue, business, chart, chevron, clipart, colorful, compliance, corporate, design, development, diagram, flow, glossy, graph, graphic, icon, illustration, levels, marketing, modern, orange, organization, plan, process, review, set, shadow, shape, shiny, square, stages, vector
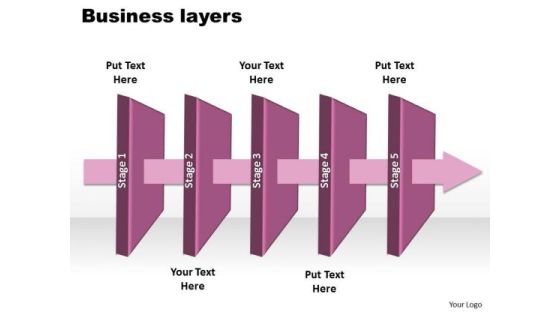
Ppt 5 Layers World Business Presentation Layouts PowerPoint Free Process Chart Templates
PPT 5 layers world business presentation layouts powerpoint free process chart Templates-This PowerPoint Diagram shows you the 3d Sequential Illustration to explain World Business. It consists of Five Layers. It imitates advertise, barter, display, exchange, merchandise, offer for sale, retail, vend, wholesale etc.-PPT 5 layers world business presentation layouts powerpoint free process chart Templates-3d, arrow, art, assess, blue, business, chart, chevron, clipart, colorful, compliance, corporate, design, development, diagram, flow, glossy, graph, graphic, icon, illustration, levels, marketing, modern, orange, organization, plan, process, review, set, shadow, shape, shiny, square, stages, vector
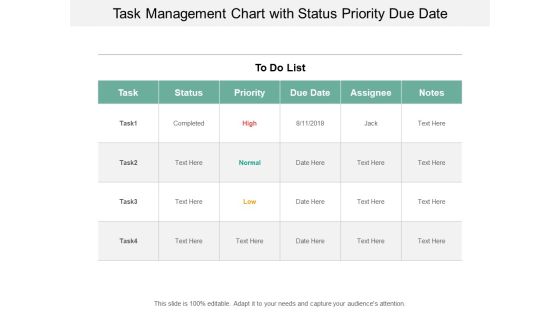
Task Management Chart With Status Priority Due Date Ppt PowerPoint Presentation Slides Format Ideas Cpb
This is a task management chart with status priority due date ppt powerpoint presentation slides format ideas cpb. This is a six stage process. The stages in this process are key activities, key highlights, list of activities.
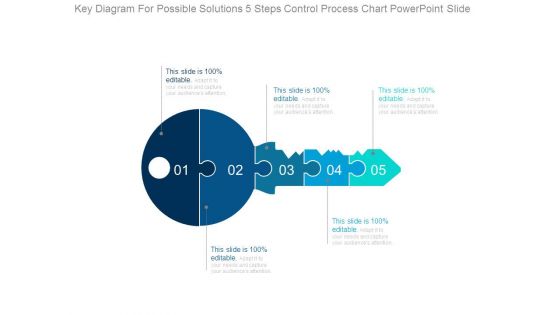
Key Diagram For Possible Solutions 5 Steps Control Process Chart Powerpoint Slide
This is a key diagram for possible solutions 5 steps control process chart powerpoint slide. This is a five stage process. The stages in this process are puzzles, business, problem, solution, game pieces, key.

Monthly Task Management Gantt Chart Ppt Powerpoint Presentation Outline Example File
This is a monthly task management gantt chart ppt powerpoint presentation outline example file. This is a three stage process. The stages in this process are new product development, new product launch, introducing new product.

Concentric Sphere Chart Slide Growth Hacking For Small Business Ppt Ideas Designs PDF
Persuade your audience using this concentric sphere chart slide growth hacking for small business ppt ideas designs pdf. This PPT design covers five stages, thus making it a great tool to use. It also caters to a variety of topics including concentric sphere chart slide growth hacking for small business. Download this PPT design now to present a convincing pitch that not only emphasizes the topic but also showcases your presentation skills.
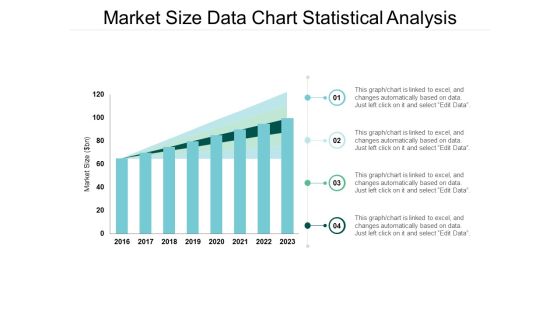
Market Size Data Chart Statistical Analysis Ppt Powerpoint Presentation Model Format
This is a market size data chart statistical analysis ppt powerpoint presentation model format. The topics discussed in this diagram are market growth, market opportunity, market profitability. This is a completely editable PowerPoint presentation, and is available for immediate download.
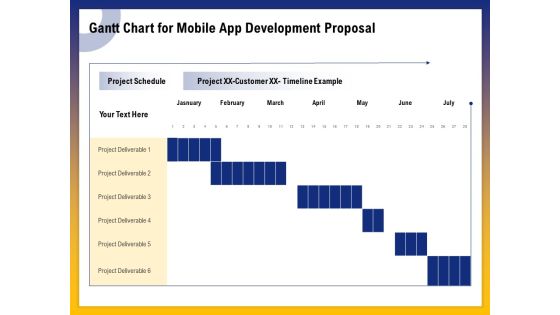
Phone Application Buildout Gantt Chart For Mobile App Development Proposal Ppt PowerPoint Presentation Gallery Vector PDF
Make a highly optimized project management report using this content-ready Gantt Chart PPT Diagram. Effortless yet very clear, this layout proves a useful tool to present the professional details of a task or activity. Showcase the activities and allotted time to the business executives with this Gantt Chart PowerPoint theme. List down the column tasks in various timeframes and the activities associated with each of them here. Further, plot time allocation for various tasks, monitor their actual time and make comparisons to interpret the final progress with this well-structured Gantt Chart Excel Template. You can add all the significant details of a particular project in this chart and showcase it to all the project members so that they can participate in the overall development. Not only this but also our PPT template can help you showcase the work breakdown structure of your project.
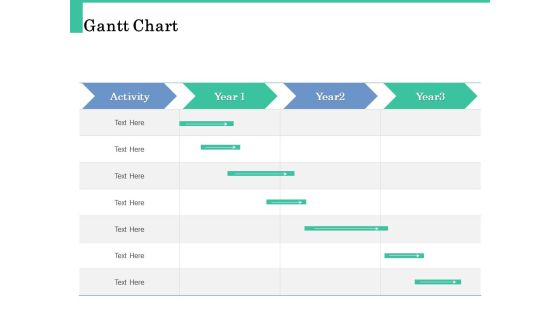
How A Corporate Life Coach Can Help Develop Your Company Gantt Chart Topics PDF
Make a highly optimized project management report using this content-ready Gantt Chart PPT Diagram. Effortless yet very clear, this layout proves a useful tool to present the professional details of a task or activity. Showcase the activities and allotted time to the business executives with this Gantt Chart PowerPoint theme. List down the column tasks in various timeframes and the activities associated with each of them here. Further, plot time allocation for various tasks, monitor their actual time and make comparisons to interpret the final progress with this well-structured Gantt Chart Excel Template. You can add all the significant details of a particular project in this chart and showcase it to all the project members so that they can participate in the overall development. Not only this but also our PPT template can help you showcase the work breakdown structure of your project.

IT Software Development And IT Operation Developer Organization Chart Portrait PDF
The following slide highlights the IT DevOps developer organization chart which shows base infrastructure, higher order, and business aligned capabilities. Presenting IT Software Development And IT Operation Developer Organization Chart Portrait PDF to dispense important information. This template comprises four stages. It also presents valuable insights into the topics including Market Facing Systems, Business Aligned Capabilities, Business Aligned Capabilities. This is a completely customizable PowerPoint theme that can be put to use immediately. So, download it and address the topic impactfully.
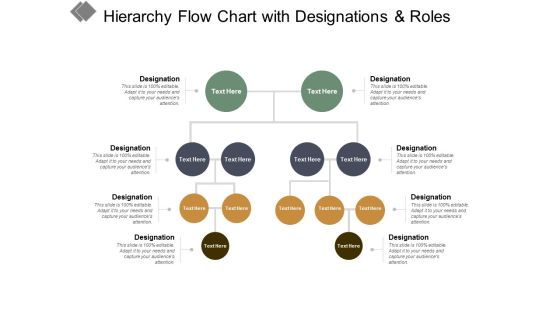
Hierarchy Flow Chart With Designations And Roles Ppt PowerPoint Presentation Styles Format Ideas
This is a hierarchy flow chart with designations and roles ppt powerpoint presentation styles format ideas. This is a four stage process. The stages in this process are business ownership, family business, owned business.

Cpm Chart For Project Management Ppt PowerPoint Presentation Portfolio Background Image
This is a cpm chart for project management ppt powerpoint presentation portfolio background image. This is a eleven stage process. The stages in this process are critical path method, critical path analysis, cpm.
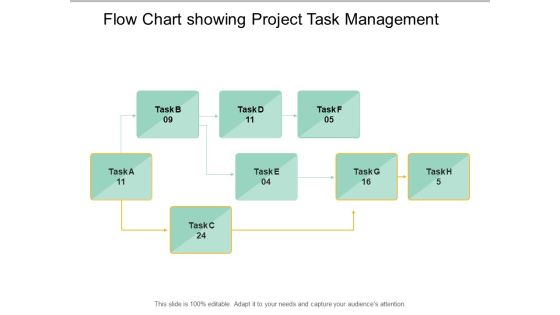
Flow Chart Showing Project Task Management Ppt PowerPoint Presentation Styles Smartart
This is a flow chart showing project task management ppt powerpoint presentation styles smartart. This is a eight stage process. The stages in this process are critical path method, critical path analysis, cpm.
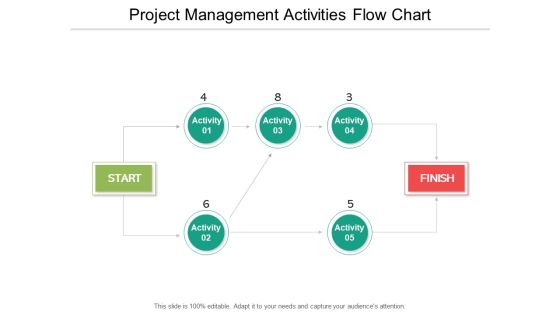
Project Management Activities Flow Chart Ppt PowerPoint Presentation File Example File
This is a project management activities flow chart ppt powerpoint presentation file example file. This is a seven stage process. The stages in this process are critical path method, critical path analysis, cpm.
operating system application gantt chart for ios apps proposal ppt icon introduction pdf
Make a highly optimized project management report using this content-ready Gantt Chart PPT Diagram. Effortless yet very clear, this layout proves a useful tool to present the professional details of a task or activity. Showcase the activities and allotted time to the business executives with this Gantt Chart PowerPoint theme. List down the column tasks in various timeframes and the activities associated with each of them here. Further, plot time allocation for various tasks, monitor their actual time and make comparisons to interpret the final progress with this well-structured Gantt Chart Excel Template. You can add all the significant details of a particular project in this chart and showcase it to all the project members so that they can participate in the overall development. Not only this but also our PPT template can help you showcase the work breakdown structure of your project.
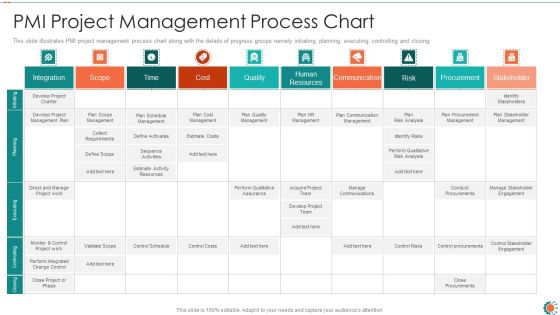
PMI Project Management Process Chart Ppt Infographic Template Graphics Download PDF
This slide illustrates PMI project management process chart along with the details of progress groups namely initiating, planning, executing, controlling and closing. Deliver and pitch your topic in the best possible manner with this pmi project management process chart ppt infographic template graphics download pdf. Use them to share invaluable insights on qualitative, assurance, management and impress your audience. This template can be altered and modified as per your expectations. So, grab it now.
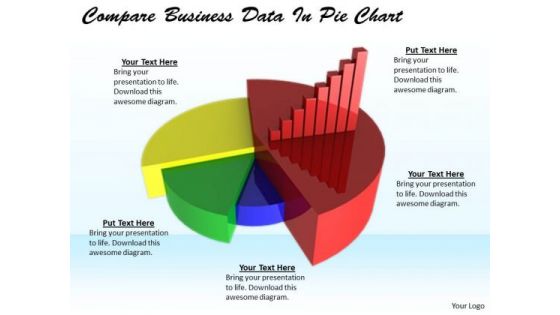
Stock Photo Develop Business Strategy Compare Data Pie Chart Stock Images
All for one and one for all. Our stock photo develop business strategy compare data pie chart stock images are all for you. Get things done on a war footing. Our marketing are excellent accelerators.

Gantt Chart For Sales Growth Proposal One Pager Sample Example Document
Presenting you an exemplary Gantt Chart For Sales Growth Proposal One Pager Sample Example Document. Our one-pager comprises all the must-have essentials of an inclusive document. You can edit it with ease, as its layout is completely editable. With such freedom, you can tweak its design and other elements to your requirements. Download this Gantt Chart For Sales Growth Proposal One Pager Sample Example Document brilliant piece now.

HR Plan Gantt Chart With Employee Name And Task Details Ppt PowerPoint Presentation Outline Graphics Pictures
Make a highly optimized project management report using this content-ready Gantt Chart PPT Diagram. Effortless yet very clear, this layout proves a useful tool to present the professional details of a task or activity. Showcase the activities and allotted time to the business executives with this Gantt Chart PowerPoint theme. List down the column tasks in various timeframes and the activities associated with each of them here. Further, plot time allocation for various tasks, monitor their actual time and make comparisons to interpret the final progress with this well-structured Gantt Chart Excel Template. You can add all the significant details of a particular project in this chart and showcase it to all the project members so that they can participate in the overall development. Not only this but also our PPT template can help you showcase the work breakdown structure of your project.

Construction Effective And Efficient Project Management Using Gantt Chart Ppt PowerPoint Presentation File Model PDF
This slide shows the Gantt chart which depicts the project management process for construction which further focuses on inspecting the project quality, building clear plan, removing self welfare activities, installing machinery, testing, etc. Showcasing this set of slides titled construction effective and efficient project management using gantt chart ppt powerpoint presentation file model pdf. The topics addressed in these templates are construction effective and efficient project management using gantt chart. All the content presented in this PPT design is completely editable. Download it and make adjustments in color, background, font etc. as per your unique business setting.

Consulting Diagram 3d Circular Process Cycle Diagram Chart 10 Stages Design 2 Business Diagram
Get The Domestics Right With Our Consulting Diagram 3d Circular Process Cycle Diagram Chart 10 Stages Design 2 Business Diagram Powerpoint Templates. Create The Base For Thoughts To Grow.
Input Process Output Chart For Evaluating And Selecting Supplier Icons PDF
This slide depicts the IPO input-process-output chart used to select supplier. The purpose of this IPO chart is to take make or buy decision depending on the resources required in an organization. It includes information related to the materials, supplier bids, etc. Persuade your audience using this Input Process Output Chart For Evaluating And Selecting Supplier Icons PDF. This PPT design covers Four stages, thus making it a great tool to use. It also caters to a variety of topics including Processing Activities, Outputs, Clients. Download this PPT design now to present a convincing pitch that not only emphasizes the topic but also showcases your presentation skills.
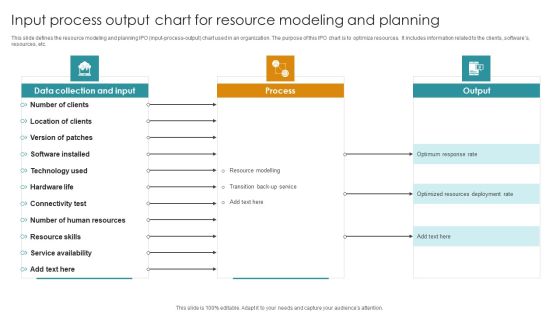
Input Process Output Chart For Resource Modeling And Planning Background PDF
This slide defines the resource modeling and planning IPO input-process-output chart used in an organization. The purpose of this IPO chart is to optimize resources. It includes information related to the clients, softwares, resources, etc. Showcasing this set of slides titled Input Process Output Chart For Resource Modeling And Planning Background PDF. The topics addressed in these templates are Data Collection And Input, Process, Output. All the content presented in this PPT design is completely editable. Download it and make adjustments in color, background, font etc. as per your unique business setting.
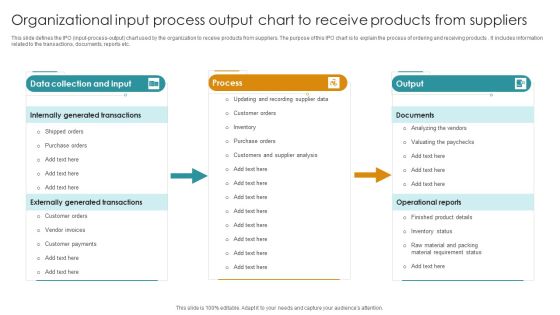
Organizational Input Process Output Chart To Receive Products From Suppliers Topics PDF
This slide defines the IPO input-process-output chart used by the organization to receive products from suppliers. The purpose of this IPO chart is to explain the process of ordering and receiving products . It includes information related to the transactions, documents, reports etc. Pitch your topic with ease and precision using this Organizational Input Process Output Chart To Receive Products From Suppliers Topics PDF. This layout presents information on Data Collection And Input, Process, Output. It is also available for immediate download and adjustment. So, changes can be made in the color, design, graphics or any other component to create a unique layout.
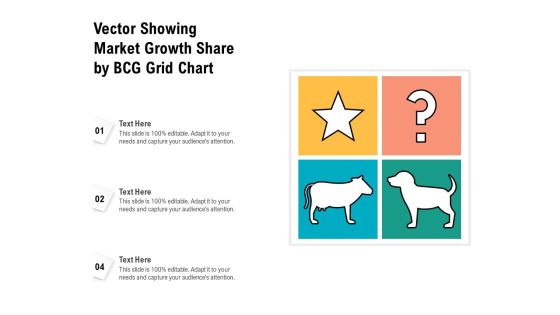
Vector Showing Market Growth Share By BCG Grid Chart Ppt PowerPoint Presentation Gallery Graphic Images PDF
Persuade your audience using this vector showing market growth share by bcg grid chart ppt powerpoint presentation gallery graphic images pdf. This PPT design covers three stages, thus making it a great tool to use. It also caters to a variety of topics including vector showing market growth share by bcg grid chart. Download this PPT design now to present a convincing pitch that not only emphasizes the topic but also showcases your presentation skills.
Vector Showing Flow Chart For Process Control Ppt PowerPoint Presentation Model Graphics Example PDF
Persuade your audience using this vector showing flow chart for process control ppt powerpoint presentation model graphics example pdf. This PPT design covers three stages, thus making it a great tool to use. It also caters to a variety of topics including vector showing flow chart for process control. Download this PPT design now to present a convincing pitch that not only emphasizes the topic but also showcases your presentation skills.

Internet Marketing Playbook Brand Voice Chart For Launching The New Product Template PDF
This slide illustrates brand voice chart of the company covering voice characteristics along with description.. Voice characteristics covered in the chart are authentic, passionate, helpful etc. Deliver and pitch your topic in the best possible manner with this Internet Marketing Playbook Brand Voice Chart For Launching The New Product Template PDF. Use them to share invaluable insights on Voice Characteristics Authentic, Passionate Innovation Solution, Customer Needs Provide and impress your audience. This template can be altered and modified as per your expectations. So, grab it now.
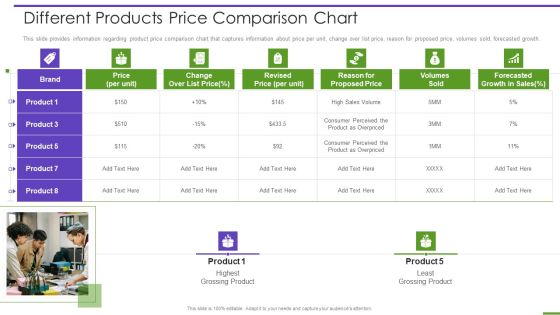
Marketing Playbook To Maximize ROI Different Products Price Comparison Chart Graphics PDF
This slide provides information regarding product price comparison chart that captures information about price per unit, change over list price, reason for proposed price, volumes sold, forecasted growth. This is a marketing playbook to maximize roi different products price comparison chart graphics pdf template with various stages. Focus and dispense information on two stages using this creative set, that comes with editable features. It contains large content boxes to add your information on topics like different products price comparison chart. You can also showcase facts, figures, and other relevant content using this PPT layout. Grab it now.

Data Collection And Analysis Control Chart Ppt PowerPoint Presentation Model Backgrounds
This is a data collection and analysis control chart ppt powerpoint presentation model backgrounds. This is a two stage process. The stages in this process are business, marketing, strategy, finance, analysis.
Experimental Control Pie Chart With Dollar Symbol Ppt Powerpoint Presentation Infographics Background Images
This is a experimental control pie chart with dollar symbol ppt powerpoint presentation infographics background images. This is a four stage process. The stages in this process are exploratory, experimental, investigational.
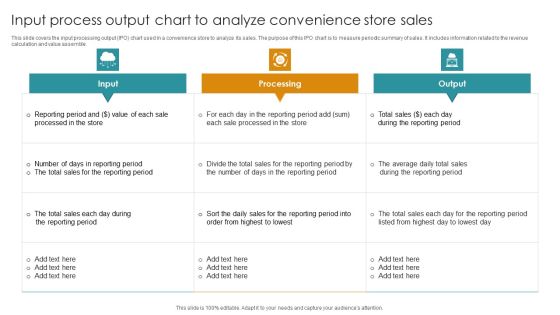
Input Process Output Chart To Analyze Convenience Store Sales Microsoft PDF
This slide covers the input processing output IPO chart used in a convenience store to analyze its sales. The purpose of this IPO chart is to measure periodic summary of sales. It includes information related to the revenue calculation and value assemble. Pitch your topic with ease and precision using this Input Process Output Chart To Analyze Convenience Store Sales Microsoft PDF. This layout presents information on Input, Processing, Output. It is also available for immediate download and adjustment. So, changes can be made in the color, design, graphics or any other component to create a unique layout.

Developing HR Process Flow Eligibility Criteria Chart For Employee Benefits Sample PDF
This slide shows the eligibility criteria chart for employee benefits which includes assignment category such as full-time regular, temporary, part-time regular and irregular, etc.Deliver and pitch your topic in the best possible manner with this Developing HR Process Flow Eligibility Criteria Chart For Employee Benefits Sample PDF. Use them to share invaluable insights on Disability Insurance, Educational Assistance, Dental Plans and impress your audience. This template can be altered and modified as per your expectations. So, grab it now.

Hand Illustration 2 Stages Process Flow Chart For Manufacturing PowerPoint Slides
We present our hand illustration 2 stages process flow chart for manufacturing PowerPoint Slides. Use our Symbol PowerPoint Templates because; illustrate how each element flows seamlessly onto the next stage. Use our Business PowerPoint Templates because, Marketing Strategy Business Template: - maximizing sales of your product is the intended destination. Use our Metaphor PowerPoint Templates because, the structure of our templates allows you to effectively highlight the key issues concerning the growth of your business. Use our Abstract PowerPoint Templates because, you have some hits, you had some misses. Use our Process and Flows PowerPoint Templates because, you have the moves to sway the market. Use these PowerPoint slides for presentations relating to Collinear, Description using hands steps, Business, Collection, Connection, Cursor, Decoration, Design, Dimensional, Direction, Element, Icon, Illustration, Information, Modern, Motion, Paper, Perspective, Plastic, Pointer, Pointing, Process, Recycle, Recycling, Reflective, Set, Shape, Shiny, Sign, Symbol, Technology. The prominent colors used in the PowerPoint template are Blue, Blue navy, Gray

Bar Chart With Person Standing On Right Side Ppt PowerPoint Presentation File Portrait PDF
Persuade your audience using this bar chart with person standing on right side ppt powerpoint presentation file portrait pdf. This PPT design covers three stages, thus making it a great tool to use. It also caters to a variety of topics including bar chart with person standing on right side. Download this PPT design now to present a convincing pitch that not only emphasizes the topic but also showcases your presentation skills.

Vector Illustrating Person With Upward Moving Chart In Hand Ppt PowerPoint Presentation File Background PDF
Persuade your audience using this vector illustrating person with upward moving chart in hand ppt powerpoint presentation file background pdf. This PPT design covers three stages, thus making it a great tool to use. It also caters to a variety of topics including vector illustrating person with upward moving chart in hand. Download this PPT design now to present a convincing pitch that not only emphasizes the topic but also showcases your presentation skills.
Mediclaim Process Flow Chart With Icons Ppt Powerpoint Presentation Outline Templates
This is a mediclaim process flow chart with icons ppt powerpoint presentation outline templates. This is a five stage process. The stages in this process are insurance claim process, insurance claim steps, insurance claim procedure.
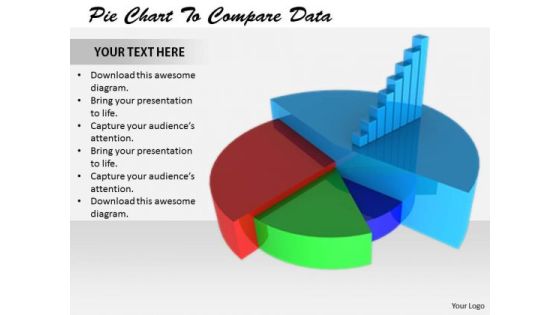
Stock Photo Corporate Business Strategy Pie Chart To Compare Data Best
Our stock photo corporate business strategy pie chart to compare data best ensure the force is with you. They enhance the energy in you. Our marketing help ideas come into force. They encourage the audience to commence action.

Business Model Strategy 3d Team Meeting Around Pie Chart Character Models
Touch Base With Our Business Model Strategy 3d Team Meeting Around Pie Chart Character Models Powerpoint Templates. Review Your Growth With Your Audience. Take A Deep Dive With Our leadership Powerpoint Templates. Get Into The Nitti Gritty Of It All.
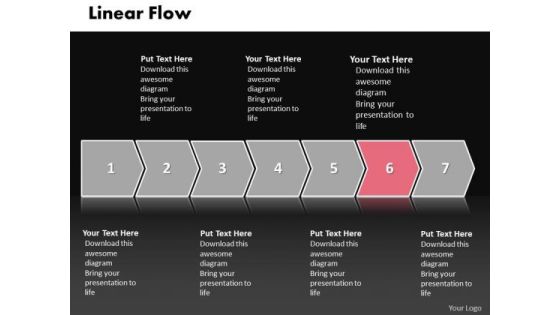
Ppt Linear Demo Create Flow Chart PowerPoint Illustration Steps Of Strategy Templates
PPT linear demo create flow chart powerpoint illustration steps of strategy Templates-This PowerPoint of Linear Arrow Diagram consist of seven stages which are constructed using effective color and design to make it more attractive and good looking. Original thinking is the need of the hour. This Diagram provides the means to project your views.-PPT linear demo create flow chart powerpoint illustration steps of strategy Templates-3d, Arrow, Background, Banner, Business, Chart, Colorful, Diagram, Direction, Element, Financial, Flow, Gradient, Illustration, Isolated, Mirrored, Placeholder, Presentation, Process, Steps
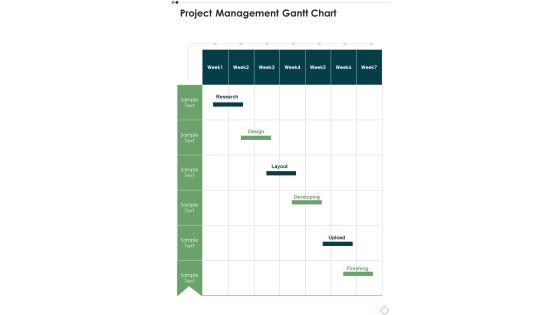
Project Development Planning Template Project Management Gantt Chart One Pager Sample Example Document
Presenting you an exemplary Project Development Planning Template Project Management Gantt Chart One Pager Sample Example Document. Our one pager comprises all the must have essentials of an inclusive document. You can edit it with ease, as its layout is completely editable. With such freedom, you can tweak its design and other elements to your requirements. Download this Project Development Planning Template Project Management Gantt Chart One Pager Sample Example Document brilliant piece now.
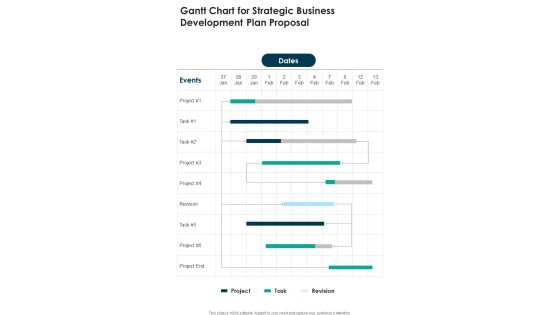
Gantt Chart For Strategic Business Development Plan Proposal One Pager Sample Example Document
Presenting you an exemplary Gantt Chart For Strategic Business Development Plan Proposal One Pager Sample Example Document. Our one-pager comprises all the must-have essentials of an inclusive document. You can edit it with ease, as its layout is completely editable. With such freedom, you can tweak its design and other elements to your requirements. Download this Gantt Chart For Strategic Business Development Plan Proposal One Pager Sample Example Document brilliant piece now.
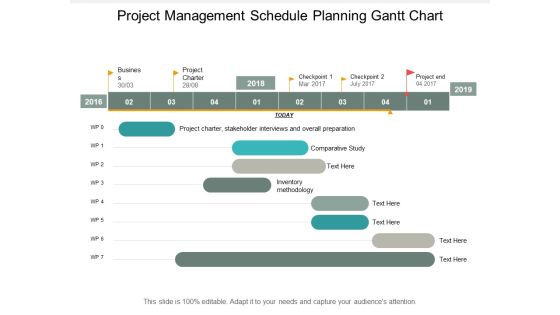
Project Management Schedule Planning Gantt Chart Ppt PowerPoint Presentation Outline Graphics Design
This is a project management schedule planning gantt chart ppt powerpoint presentation outline graphics design. This is a eight stage process. The stages in this process are work package timeline, work package roadmap, tasks package timelines.

Collinear Description Using Hands 5 Steps Best Flow Chart PowerPoint Slides
We present our collinear description using hands 5 steps best flow chart PowerPoint Slides. Use our Symbol PowerPoint Templates because; represent the progress in our lives. Use our Business PowerPoint Templates because; Outline your targets to your team. Use our Metaphor PowerPoint Templates because, to take your team soaring to the pinnacle they crave. Use our Abstract PowerPoint Templates because; educate your team and the attention you have paid. Use our Process and Flows PowerPoint Templates because, transmit your thoughts via our slides and prod your team to action. Use these PowerPoint slides for presentations relating to Collinear, Description using hands 5 steps, Business, Collection, Connection, Cursor, Decoration, Design, Dimensional, Direction, Element, Icon, Illustration, Information, Modern, Motion, Paper, Perspective, Plastic, Pointer, Pointing, Process, Recycle, Recycling, Reflective, Set, Shape, Shiny, Sign, Symbol, Technology. The prominent colors used in the PowerPoint template are Blue, Purple, and White

Application Development Freelance Proposal Gantt Chart One Pager Sample Example Document
Presenting you an exemplary Application Development Freelance Proposal Gantt Chart One Pager Sample Example Document. Our one pager comprises all the must have essentials of an inclusive document. You can edit it with ease, as its layout is completely editable. With such freedom, you can tweak its design and other elements to your requirements. Download this Application Development Freelance Proposal Gantt Chart One Pager Sample Example Document brilliant piece now.
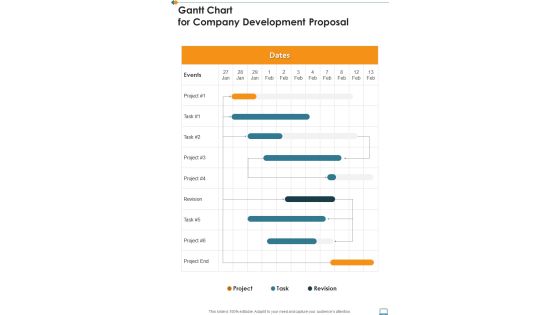
Gantt Chart For Company Development Proposal One Pager Sample Example Document
Presenting you an exemplary Gantt Chart For Company Development Proposal One Pager Sample Example Document. Our one pager comprises all the must have essentials of an inclusive document. You can edit it with ease, as its layout is completely editable. With such freedom, you can tweak its design and other elements to your requirements. Download this Gantt Chart For Company Development Proposal One Pager Sample Example Document brilliant piece now.
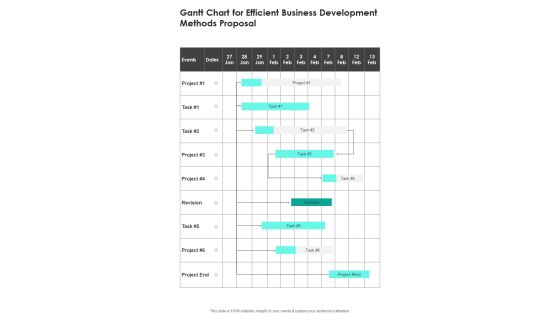
Gantt Chart For Efficient Business Development Methods Proposal One Pager Sample Example Document
Presenting you an exemplary Gantt Chart For Efficient Business Development Methods Proposal One Pager Sample Example Document. Our one pager comprises all the must have essentials of an inclusive document. You can edit it with ease, as its layout is completely editable. With such freedom, you can tweak its design and other elements to your requirements. Download this Gantt Chart For Efficient Business Development Methods Proposal One Pager Sample Example Document brilliant piece now.
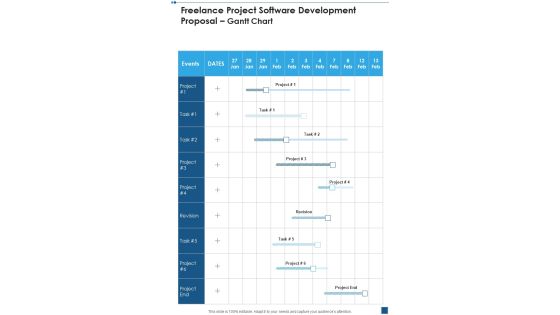
Freelance Project Software Development Proposal Gantt Chart One Pager Sample Example Document
Presenting you an exemplary Freelance Project Software Development Proposal Gantt Chart One Pager Sample Example Document. Our one-pager comprises all the must-have essentials of an inclusive document. You can edit it with ease, as its layout is completely editable. With such freedom, you can tweak its design and other elements to your requirements. Download this Freelance Project Software Development Proposal Gantt Chart One Pager Sample Example Document brilliant piece now.
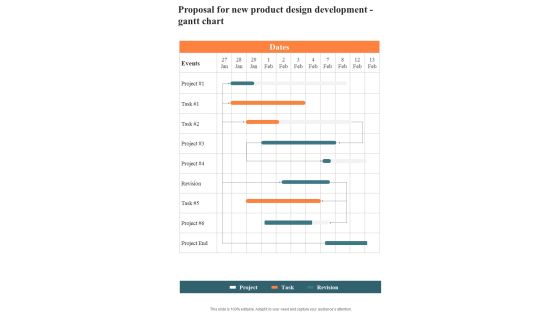
Proposal For New Product Design Development Gantt Chart One Pager Sample Example Document
Presenting you an exemplary Proposal For New Product Design Development Gantt Chart One Pager Sample Example Document. Our one-pager comprises all the must-have essentials of an inclusive document. You can edit it with ease, as its layout is completely editable. With such freedom, you can tweak its design and other elements to your requirements. Download this Proposal For New Product Design Development Gantt Chart One Pager Sample Example Document brilliant piece now.

New Product Development Proposal Gantt Chart One Pager Sample Example Document
Presenting you an exemplary New Product Development Proposal Gantt Chart One Pager Sample Example Document. Our one-pager comprises all the must-have essentials of an inclusive document. You can edit it with ease, as its layout is completely editable. With such freedom, you can tweak its design and other elements to your requirements. Download this New Product Development Proposal Gantt Chart One Pager Sample Example Document brilliant piece now.
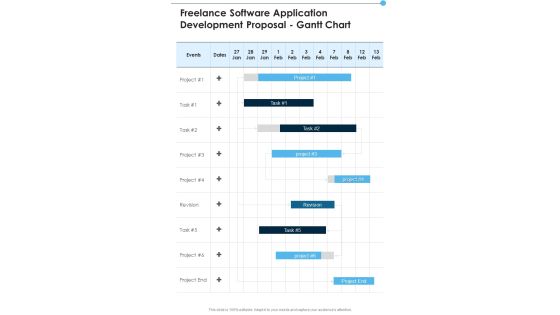
Freelance Software Application Development Proposal Gantt Chart One Pager Sample Example Document
Presenting you an exemplary Freelance Software Application Development Proposal Gantt Chart One Pager Sample Example Document. Our one-pager comprises all the must-have essentials of an inclusive document. You can edit it with ease, as its layout is completely editable. With such freedom, you can tweak its design and other elements to your requirements. Download this Freelance Software Application Development Proposal Gantt Chart One Pager Sample Example Document brilliant piece now.

Food Industry Services Development Proposal Gantt Chart One Pager Sample Example Document
Presenting you an exemplary Food Industry Services Development Proposal Gantt Chart One Pager Sample Example Document. Our one pager comprises all the must have essentials of an inclusive document. You can edit it with ease, as its layout is completely editable. With such freedom, you can tweak its design and other elements to your requirements. Download this Food Industry Services Development Proposal Gantt Chart One Pager Sample Example Document brilliant piece now.
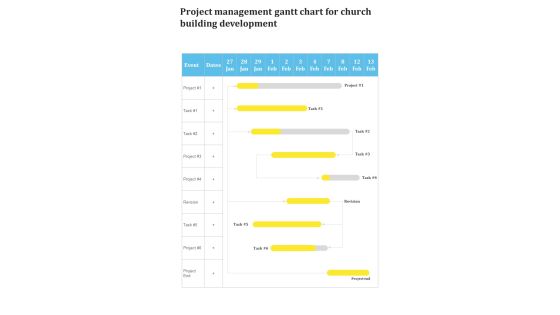
Project Management Gantt Chart For Church Building Development One Pager Sample Example Document
Presenting you an exemplary Project Management Gantt Chart For Church Building Development One Pager Sample Example Document. Our one-pager comprises all the must-have essentials of an inclusive document. You can edit it with ease, as its layout is completely editable. With such freedom, you can tweak its design and other elements to your requirements. Download this Project Management Gantt Chart For Church Building Development One Pager Sample Example Document brilliant piece now.

Bar Chart Showing Consumer Adoption Patterns Ppt Powerpoint Presentation Outline Professional
This is a bar chart showing consumer adoption patterns ppt powerpoint presentation outline professional. The topics discussed in this diagram are customer service, customer success, customer adoption. This is a completely editable PowerPoint presentation, and is available for immediate download.
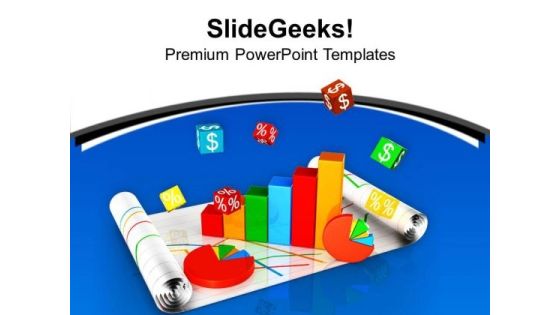
Bar And Pie Chart For Result Analysis PowerPoint Templates Ppt Backgrounds For Slides 0513
Our Great Team Has Conjured Up A Web Of business Power Point Templates. Use Them To String Together Your Glistening Ideas. Think Of It And Be Sure We Have It. Our pie charts Power Point Templates Offer You The Widest Possible Range Of Options.
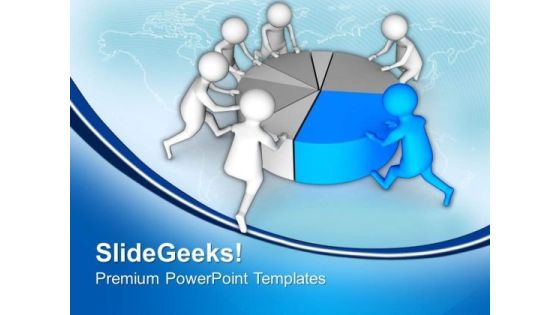
Teamwork To Make A Pie Chart PowerPoint Templates Ppt Backgrounds For Slides 0713
Dress up your views with our Teamwork_To_Make_A_Pie_Chart_PowerPoint_Templates_PPT_Backgrounds_For_Slides. Deliver your ideas with aplomb. Dribble away with our People PowerPoint Templates. Score a goal with your ideas. Drill it in with our Pie Charts PowerPoint Templates. Embed your message into the minds of your audience.

Agile Software Development Process It Follow Up Progress By Using Burn-Down Chart Mockup PDF
This slide provides the glimpse about the next sprint planning and tracking which focuses on task name, owner, estimated time and planned or actual estimation along with a daily calendar. Deliver an awe inspiring pitch with this creative agile software development process it follow up progress by using burn-down chart mockup pdf bundle. Topics like follow up progress by using burn down chart can be discussed with this completely editable template. It is available for immediate download depending on the needs and requirements of the user.
Stock Photo Pie Chart And Bar Graph On Web PowerPoint Slide
This image is designed with pie chart and bar graph on web. Use this diagram to explain your strategy to co-ordinate activities. Deliver amazing presentations to mesmerize your audience.
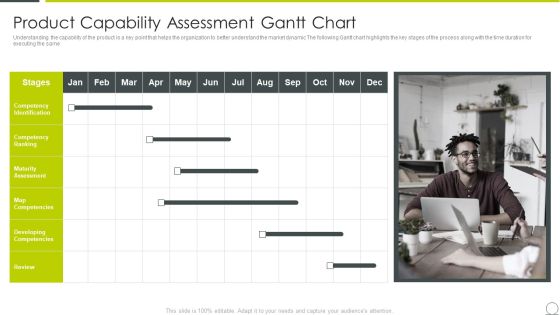
Examining Product Characteristics Brand Messaging Product Capability Assessment Gantt Chart Pictures PDF
Understanding the capability of the product is a key point that helps the organization to better understand the market dynamic The following Gantt chart highlights the key stages of the process along with the time duration for executing the same This is a examining product characteristics brand messaging product capability assessment gantt chart pictures pdf template with various stages. Focus and dispense information on one stages using this creative set, that comes with editable features. It contains large content boxes to add your information on topics like product capability assessment gantt chart. You can also showcase facts, figures, and other relevant content using this PPT layout. Grab it now.
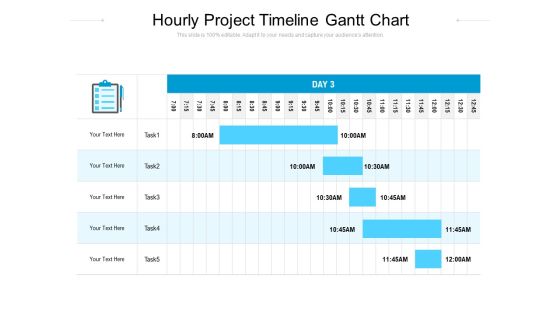
Task Hourly Schedule Gantt Chart Ppt PowerPoint Presentation Portfolio Examples PDF
Make a highly optimized project management report using this content-ready Gantt Chart PPT Diagram. Effortless yet very clear, this layout proves a useful tool to present the professional details of a task or activity. Showcase the activities and allotted time to the business executives with this Gantt Chart PowerPoint theme. List down the column tasks in various timeframes and the activities associated with each of them here. Further, plot time allocation for various tasks, monitor their actual time and make comparisons to interpret the final progress with this well-structured Gantt Chart Excel Template. You can add all the significant details of a particular project in this chart and showcase it to all the project members so that they can participate in the overall development. Not only this but also our PPT template can help you showcase the work breakdown structure of your project.

Client Onboarding Process Flow Chart Ppt PowerPoint Presentation Infographic Template Elements Cpb Pdf
Presenting this set of slides with name client onboarding process flow chart ppt powerpoint presentation infographic template elements cpb pdf. This is an editable Powerpoint three stages graphic that deals with topics like client onboarding process flow chart to help convey your message better graphically. This product is a premium product available for immediate download and is 100 percent editable in Powerpoint. Download this now and use it in your presentations to impress your audience.

Concentric Sphere Chart Diagram For Seven Elements Of A Marketing Plan Ppt Styles Display PDF
Persuade your audience using this concentric sphere chart diagram for seven elements of a marketing plan ppt styles display pdf. This PPT design covers seven stages, thus making it a great tool to use. It also caters to a variety of topics including concentric sphere chart diagram for seven elements of a marketing plan. Download this PPT design now to present a convincing pitch that not only emphasizes the topic but also showcases your presentation skills.

Succession Planning Modelling Chart Ppt PowerPoint Presentation Visual Aids Background Images
This is a succession planning modelling chart ppt powerpoint presentation visual aids background images. This is a three stage process. The stages in this process are compare, marketing, business, management, planning.

3d Illustration Of Business Success Chart With Arrow PowerPoint Templates And PowerPoint Themes 0912
3d Illustration Of Business Success Chart with Arrow PowerPoint Templates And PowerPoint Themes 0912-Microsoft Powerpoint Templates and Background with business success with arrow-Business success with arrow, finance, marketing, success, arrows, business
E Commerce Website Development Flow Chart Icon Ppt Styles Layout Ideas PDF
Persuade your audience using this E Commerce Website Development Flow Chart Icon Ppt Styles Layout Ideas PDF. This PPT design covers three stages, thus making it a great tool to use. It also caters to a variety of topics including E Commerce, Website Development, Flow Chart, Icon. Download this PPT design now to present a convincing pitch that not only emphasizes the topic but also showcases your presentation skills.
EEO Complaint Process Flow Chart Ppt PowerPoint Presentation Outline Cpb Pdf
Presenting this set of slides with name eeo complaint process flow chart ppt powerpoint presentation outline cpb pdf. This is an editable Powerpoint four stages graphic that deals with topics like eeo complaint process flow chart to help convey your message better graphically. This product is a premium product available for immediate download and is 100 percent editable in Powerpoint. Download this now and use it in your presentations to impress your audience.
Order Invoice Process Flow Chart Ppt PowerPoint Presentation Outline Tips Cpb Pdf
Presenting this set of slides with name order invoice process flow chart ppt powerpoint presentation outline tips cpb pdf. This is an editable Powerpoint four stages graphic that deals with topics like order invoice process flow chart to help convey your message better graphically. This product is a premium product available for immediate download and is 100 percent editable in Powerpoint. Download this now and use it in your presentations to impress your audience.

Monthly Timeline Gantt Chart With Task Names Ppt PowerPoint Presentation File Ideas
This is a monthly timeline gantt chart with task names ppt powerpoint presentation file ideas. This is a twelve stage process. The stages in this process are agenda, schedule, timetable.

Five Phases PMP Process Chart With Knowledge Areas Ppt Ideas Infographic Template PDF
Mentioned slide portrays project management process chart along with the details about knowledge areas namely project integration management, scope management, schedule management, quality and risk management. Deliver an awe inspiring pitch with this creative five phases pmp process chart with knowledge areas ppt ideas infographic template pdf bundle. Topics like management, planning, scope can be discussed with this completely editable template. It is available for immediate download depending on the needs and requirements of the user.

Market Development Matrix Chart Ppt PowerPoint Presentation Styles Example Introduction Cpb
Presenting this set of slides with name market development matrix chart ppt powerpoint presentation styles example introduction cpb. This is an editable Powerpoint five stages graphic that deals with topics like market development matrix chart to help convey your message better graphically. This product is a premium product available for immediate download and is 100 percent editable in Powerpoint. Download this now and use it in your presentations to impress your audience.

Accounting Record Book With Pie Chart And Statistics Icon Ppt PowerPoint Presentation Outline Layouts PDF
Presenting accounting record book with pie chart and statistics icon ppt powerpoint presentation outline layouts pdf to dispense important information. This template comprises three stages. It also presents valuable insights into the topics including accounting record book with pie chart and statistics icon. This is a completely customizable PowerPoint theme that can be put to use immediately. So, download it and address the topic impactfully.
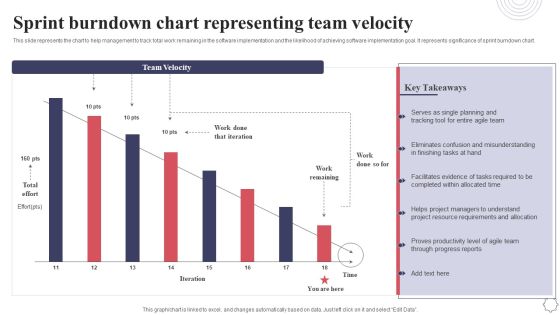
Sprint Burndown Chart Representing Team Velocity Application Deployment Project Plan Ideas PDF
This slide represents the chart to help management to track total work remaining in the software implementation and the likelihood of achieving software implementation goal. It represents significance of sprint burndown chart. Here you can discover an assortment of the finest PowerPoint and Google Slides templates. With these templates, you can create presentations for a variety of purposes while simultaneously providing your audience with an eye catching visual experience. Download Sprint Burndown Chart Representing Team Velocity Application Deployment Project Plan Ideas PDF to deliver an impeccable presentation. These templates will make your job of preparing presentations much quicker, yet still, maintain a high level of quality. Slidegeeks has experienced researchers who prepare these templates and write high quality content for you. Later on, you can personalize the content by editing the Sprint Burndown Chart Representing Team Velocity Application Deployment Project Plan Ideas PDF.

Data Collection And Analysis Flow Chart Ppt PowerPoint Presentation Outline Graphics
This is a data collection and analysis flow chart ppt powerpoint presentation outline graphics. This is a five stage process. The stages in this process are business, management, planning, strategy, marketing.
Business Diagram Pie Chart With Icons For Result Analysis Presentation Template
This business slide contains graphics of pie chart with business icons. Download this impressive diagram to present marketing performance measurement. This image slide is best to present your newer thoughts.
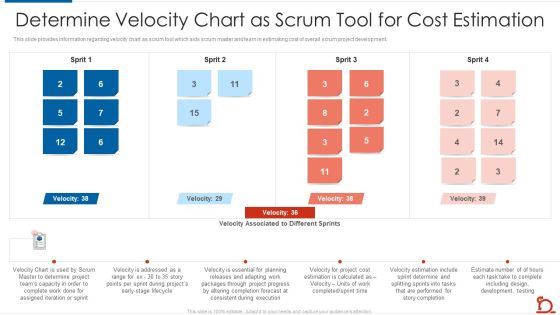
Determine Velocity Chart As Scrum Tool For Cost Estimation Brochure PDF
This slide provides information regarding velocity chart as scrum tool which aids scrum master and team in estimating cost of overall scrum project development. Deliver an awe inspiring pitch with this creative determine velocity chart as scrum tool for cost estimation brochure pdf bundle. Topics like associated, planning, progress, project can be discussed with this completely editable template. It is available for immediate download depending on the needs and requirements of the user.
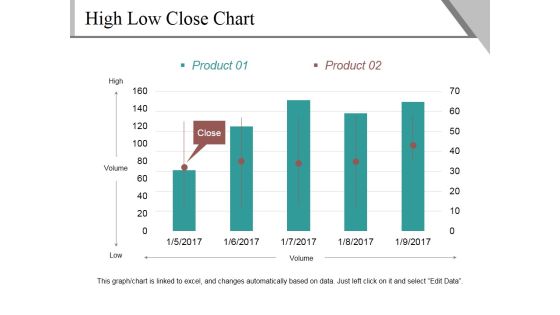
High Low Close Chart Template 2 Ppt PowerPoint Presentation Outline Show
This is a high low close chart template 2 ppt powerpoint presentation outline show. This is a five stage process. The stages in this process are high, volume, low, close, product.

Business Investment Management Flow Chart Ppt PowerPoint Presentation Outline Example Topics
This is a business investment management flow chart ppt powerpoint presentation outline example topics. This is a three stage process. The stages in this process are investment, funding, private equity, venture capital.
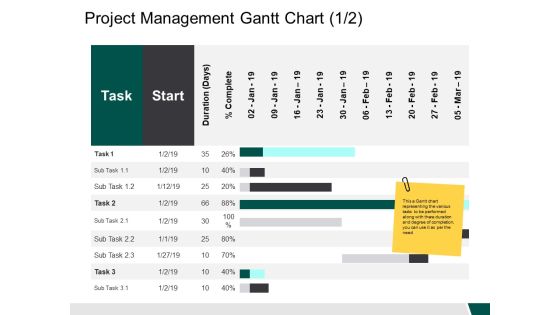
Project Management Gantt Chart Start Ppt PowerPoint Presentation Outline Example Introduction
This is a project management gantt chart start ppt powerpoint presentation outline example introduction. This is a two stage process. The stages in this process are business, management, strategy, analysis, marketing.
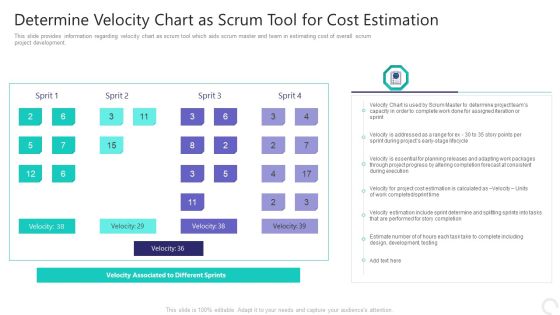
Determine Velocity Chart As Scrum Tool For Cost Estimation Slides PDF
This slide provides information regarding velocity chart as scrum tool which aids scrum master and team in estimating cost of overall scrum project development. Deliver an awe inspiring pitch with this creative determine velocity chart as scrum tool for cost estimation slides pdf bundle. Topics like velocity is essential, through project progress, velocity estimation can be discussed with this completely editable template. It is available for immediate download depending on the needs and requirements of the user.

Heating Ventilation And Air Conditioning Installation Gantt Chart For HAVC Services Proposal Ppt Slides Icon PDF
Make a highly optimized project management report using this content-ready Gantt Chart PPT Diagram. Effortless yet very clear, this layout proves a useful tool to present the professional details of a task or activity. Showcase the activities and allotted time to the business executives with this Gantt Chart PowerPoint theme. List down the column tasks in various timeframes and the activities associated with each of them here. Further, plot time allocation for various tasks, monitor their actual time and make comparisons to interpret the final progress with this well-structured Gantt Chart Excel Template. You can add all the significant details of a particular project in this chart and showcase it to all the project members so that they can participate in the overall development. Not only this but also our PPT template can help you showcase the work breakdown structure of your project.

Business Diagram Business Men With Pie Chart And Percentage Presentation Template
This business diagram has been designed with graphic of business people and pie chart with percentage. This diagram is designed to depict team meeting on financial matter. This diagram offers a way for your audience to visually conceptualize the process.
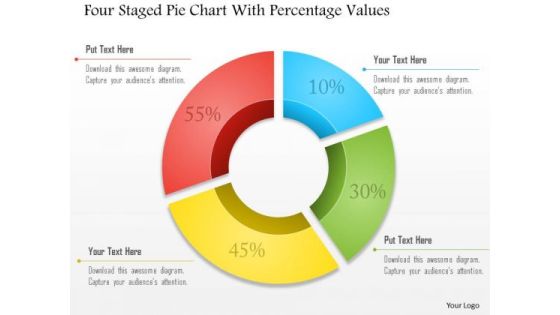
Business Diagram Four Staged Pie Chart With Percentage Values Presentation Template
Four staged pie chart and percentage values are used to design this business slide. Download this diagram to make business and financial reports. Use our above diagram to express information in a visual way.

Step Arrow Procedure 3 Stages Po Process Flow Chart PowerPoint Slides
We present our step arrow procedure 3 stages po process flow chart PowerPoint Slides.Download and present our Arrows PowerPoint Templates because you have the ideas to develop the teams vision of where they need to be in the future. Download and present our Symbol PowerPoint Templates because this diagram helps you to light up enthusiasm in your team like dream emerge.ge. Download and present our Marketing PowerPoint Templates because it gives you really bright ideas. Download and present our Leadership PowerPoint Templates because you have what it takes to grow. Use our Process and Flows PowerPoint Templates because there is a crucial aspect that requires extra attention.Use these PowerPoint slides for presentations relating to Arrow, Arrows Block, Business, Chart, Design, Development, Diagram, Direction, Element, Flow, Flowchart, Graph, Linear, Management, Organization, Process, Program, Section, Sign, Solution, Symbol. The prominent colors used in the PowerPoint template are Blue, Green, Black. Customers tell us our step arrow procedure 3 stages po process flow chart PowerPoint Slides will save the presenter time. The feedback we get is that our Development PowerPoint templates and PPT Slides are Multicolored. Professionals tell us our step arrow procedure 3 stages po process flow chart PowerPoint Slides are Majestic. People tell us our Chart PowerPoint templates and PPT Slides are Fancy. Customers tell us our step arrow procedure 3 stages po process flow chart PowerPoint Slides are Cheerful. Professionals tell us our Diagram PowerPoint templates and PPT Slides are Fun.

Gantt Chart For Pipeline Operator Proposal Ppt PowerPoint Presentation Styles Slide Portrait
Make a highly optimized project management report using this content-ready Gantt Chart PPT Diagram. Effortless yet very clear, this layout proves a useful tool to present the professional details of a task or activity. Showcase the activities and allotted time to the business executives with this Gantt Chart PowerPoint theme. List down the column tasks in various timeframes and the activities associated with each of them here. Further, plot time allocation for various tasks, monitor their actual time and make comparisons to interpret the final progress with this well-structured Gantt Chart Excel Template. You can add all the significant details of a particular project in this chart and showcase it to all the project members so that they can participate in the overall development. Not only this but also our PPT template can help you showcase the work breakdown structure of your project.

Gantt Chart For HVAC Services Proposal Ppt PowerPoint Presentation Layouts Structure PDF
Make a highly optimized project management report using this content-ready Gantt Chart PPT Diagram. Effortless yet very clear, this layout proves a useful tool to present the professional details of a task or activity. Showcase the activities and allotted time to the business executives with this Gantt Chart PowerPoint theme. List down the column tasks in various timeframes and the activities associated with each of them here. Further, plot time allocation for various tasks, monitor their actual time and make comparisons to interpret the final progress with this well-structured Gantt Chart Excel Template. You can add all the significant details of a particular project in this chart and showcase it to all the project members so that they can participate in the overall development. Not only this but also our PPT template can help you showcase the work breakdown structure of your project.
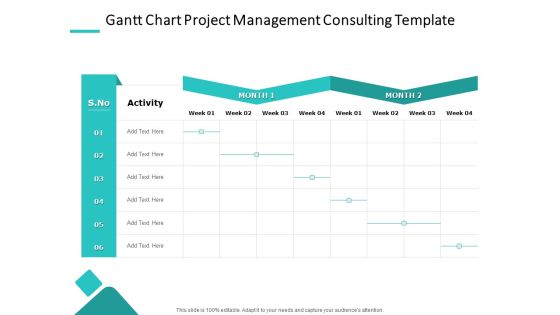
Gantt Chart Project Management Consulting Template Ppt PowerPoint Presentation Layouts Clipart Images PDF
Make a highly optimized project management report using this content-ready Gantt Chart PPT Diagram. Effortless yet very clear, this layout proves a useful tool to present the professional details of a task or activity. Showcase the activities and allotted time to the business executives with this Gantt Chart PowerPoint theme. List down the column tasks in various timeframes and the activities associated with each of them here. Further, plot time allocation for various tasks, monitor their actual time and make comparisons to interpret the final progress with this well-structured Gantt Chart Excel Template. You can add all the significant details of a particular project in this chart and showcase it to all the project members so that they can participate in the overall development. Not only this but also our PPT template can help you showcase the work breakdown structure of your project.

Enterprise Capabilities Training Gantt Chart Ppt PowerPoint Presentation Pictures Introduction PDF
Make a highly optimized project management report using this content-ready Gantt Chart PPT Diagram. Effortless yet very clear, this layout proves a useful tool to present the professional details of a task or activity. Showcase the activities and allotted time to the business executives with this Gantt Chart PowerPoint theme. List down the column tasks in various timeframes and the activities associated with each of them here. Further, plot time allocation for various tasks, monitor their actual time and make comparisons to interpret the final progress with this well-structured Gantt Chart Excel Template. You can add all the significant details of a particular project in this chart and showcase it to all the project members so that they can participate in the overall development. Not only this but also our PPT template can help you showcase the work breakdown structure of your project.

SEO Proposal Template Gantt Chart For Website Ranking Proposal Ppt PowerPoint Presentation File Layout PDF
Make a highly optimized project management report using this content-ready Gantt Chart PPT Diagram. Effortless yet very clear, this layout proves a useful tool to present the professional details of a task or activity. Showcase the activities and allotted time to the business executives with this Gantt Chart PowerPoint theme. List down the column tasks in various timeframes and the activities associated with each of them here. Further, plot time allocation for various tasks, monitor their actual time and make comparisons to interpret the final progress with this well-structured Gantt Chart Excel Template. You can add all the significant details of a particular project in this chart and showcase it to all the project members so that they can participate in the overall development. Not only this but also our PPT template can help you showcase the work breakdown structure of your project.

Primary Healthcare Implementation Service Gantt Chart For Implementing Primary Health Care Proposal Information PDF
Make a highly optimized project management report using this content-ready Gantt Chart PPT Diagram. Effortless yet very clear, this layout proves a useful tool to present the professional details of a task or activity. Showcase the activities and allotted time to the business executives with this Gantt Chart PowerPoint theme. List down the column tasks in various timeframes and the activities associated with each of them here. Further, plot time allocation for various tasks, monitor their actual time and make comparisons to interpret the final progress with this well-structured Gantt Chart Excel Template. You can add all the significant details of a particular project in this chart and showcase it to all the project members so that they can participate in the overall development. Not only this but also our PPT template can help you showcase the work breakdown structure of your project.
PMP Process Chart With Knowledge Area Ppt Icon Layout Ideas PDF
Following slide displays project management process chart along with the details about knowledge areas namely project integration management, scope management, schedule management, quality and risk management. Deliver and pitch your topic in the best possible manner with this pmp procedure chart it poste it notes ppt portfolio guidelines pdf. Use them to share invaluable insights on management, integration, schedule and impress your audience. This template can be altered and modified as per your expectations. So, grab it now.

Concentric Sphere Chart Illustration For Lead Generation In Digital Marketing Ppt Outline Files PDF
Persuade your audience using this concentric sphere chart illustration for lead generation in digital marketing ppt outline files pdf. This PPT design covers three stages, thus making it a great tool to use. It also caters to a variety of topics including concentric sphere chart illustration for lead generation in digital marketing. Download this PPT design now to present a convincing pitch that not only emphasizes the topic but also showcases your presentation skills.
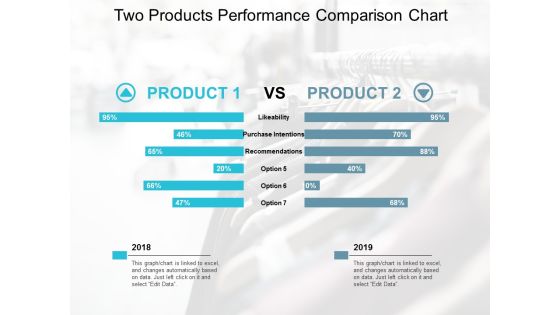
Two Products Performance Comparison Chart Ppt Powerpoint Presentation Outline Design Inspiration
This is a two products performance comparison chart ppt powerpoint presentation outline design inspiration. The topics discussed in this diagram are product differentiation, product comparison, brand differentiation. This is a completely editable PowerPoint presentation, and is available for immediate download.

Business Proposal To Upgrade Operating System Gantt Chart One Pager Sample Example Document
Presenting you an exemplary Business Proposal To Upgrade Operating System Gantt Chart One Pager Sample Example Document. Our one-pager comprises all the must-have essentials of an inclusive document. You can edit it with ease, as its layout is completely editable. With such freedom, you can tweak its design and other elements to your requirements. Download this Business Proposal To Upgrade Operating System Gantt Chart One Pager Sample Example Document brilliant piece now.
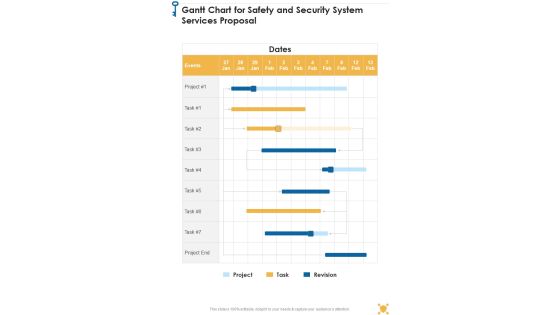
Gantt Chart For Safety And Security System Services Proposal One Pager Sample Example Document
Presenting you an exemplary Gantt Chart For Safety And Security System Services Proposal One Pager Sample Example Document. Our one-pager comprises all the must-have essentials of an inclusive document. You can edit it with ease, as its layout is completely editable. With such freedom, you can tweak its design and other elements to your requirements. Download this Gantt Chart For Safety And Security System Services Proposal One Pager Sample Example Document brilliant piece now.
 Home
Home