Icons

Pricing Research Flow Chart Ppt Sample Download
This is a pricing research flow chart ppt sample download. This is a three stage process. The stages in this process are price customers are waiting to pay, price dictated by competition, optimal price, price for sustainability.

Professional Brand Management Chart Powerpoint Slides
This is a professional brand management chart powerpoint slides. This is a four stage process. The stages in this process are branding strategies, line extension, brand extension, new brands, multi branding.
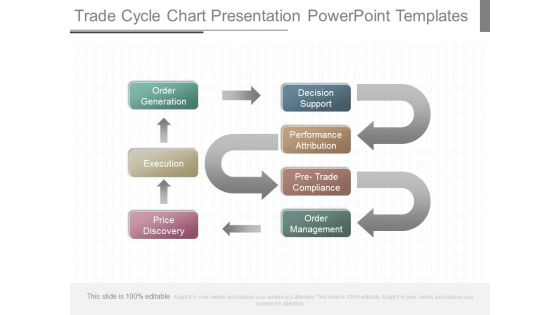
Trade Cycle Chart Presentation Powerpoint Templates
This is a trade cycle chart presentation powerpoint templates. This is a four stage process. The stages in this process are order generation, execution, price discovery, decision support, performance attribution, pre trade compliance, order management.

Brand Equity Flow Chart Powerpoint Slides
This is a brand equity flow chart powerpoint slides. This is a five stage process. The stages in this process are brand equity, brand awareness, perceived quality, brand association, brand loyalty.

Governance Growth System Chart Example Of Ppt
This is a governance growth system chart example of ppt. This is a four stage process. The stages in this process are accountable government, solid institution, political system, socio economic growth, governance.

Financial Marketing Solutions Chart Presentation Ideas
This is a financial marketing solutions chart presentation ideas. This is a eight stage process. The stages in this process are direct deposits, e commerce, prepaid cards, bill payments, money orders, small loans, mobile transaction, international money transfer.
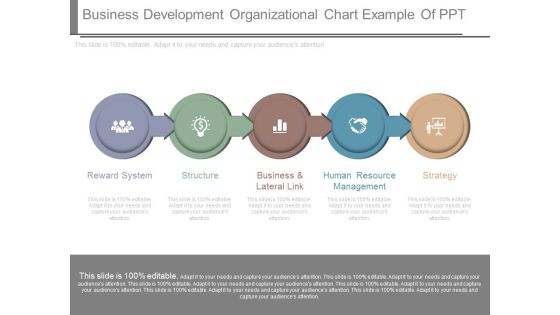
Business Development Organizational Chart Example Of Ppt
This is a business development organizational chart example of ppt. This is a five stage process. The stages in this process are reward system, structure, business and lateral link, human resource management, strategy.

Market Research Methodology Chart Template Ppt Sample
This is a market research methodology chart template ppt sample. This is a five stage process. The stages in this process are industry expertise, proprietary contacts, surveys, industry events, management access.

Financial Logistics Pyramid Chart Presentation Ideas
This is a financial logistics pyramid chart presentation ideas. This is a five stage process. The stages in this process are advice, risk management, liquidity management, cash flow management, payments and receivables.
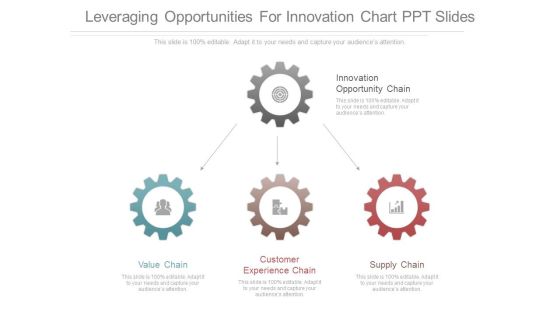
Leveraging Opportunities For Innovation Chart Ppt Slides
This is a leveraging opportunities for innovation chart ppt slides. This is a four stage process. The stages in this process are innovation opportunity chain, value chain, customer experience chain, supply chain.

Brand Building Circle Chart Ppt Example
This is a brand building circle chart ppt example. This is a seven stage process. The stages in this process are long term perspective, positioning, quality, well blended communication, credibility, internal marketing, repositioning, brand building.

Market Research Data Collection Chart Presentation
This is a market research data collection chart presentation. This is a five stage process. The stages in this process are concept testing, customer satisfaction, pricing research, market segmentation, awareness usage.
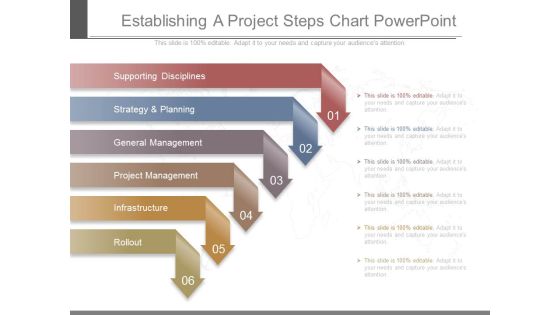
Establishing A Project Steps Chart Powerpoint
This is a establishing a project steps chart powerpoint. This is a six stage process. The stages in this process are supporting disciplines, strategy and planning, general management, project management, infrastructure, rollout.

Financial Investments Pie Chart Design Powerpoint Show
This is a financial investments pie chart design powerpoint show. This is a eight stage process. The stages in this process are stocks, real estate, mutual funds, precious metal, bonds, art, collectibles, antiques.

Organizational Management System Chart Powerpoint Guide
This is a organizational management system chart powerpoint guide. This is a four stage process. The stages in this process are governance, visibility, collaboration, flexibility, control, people, process, technology.
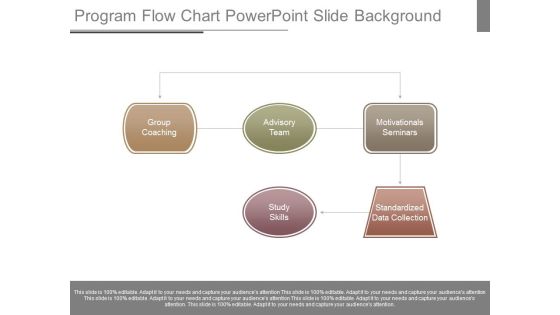
Program Flow Chart Powerpoint Slide Background
This is a program flow chart powerpoint slide background. This is a five stage process. The stages in this process are group coaching, advisory team, study skills, motivationals seminars, standardized data collection.

Gap Analysis Process Chart Powerpoint Slide Introduction
This is a gap analysis process chart powerpoint slide introduction. This is a four stage process. The stages in this process are bridging the gap, gap identification, future state needs and vision, current state assessment.
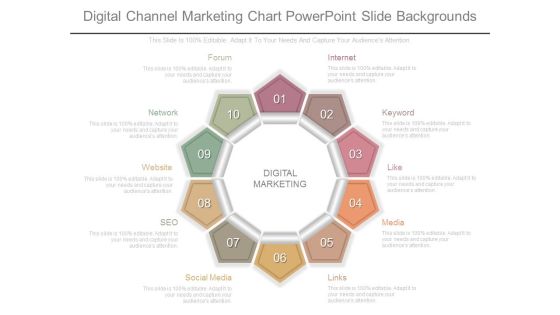
Digital Channel Marketing Chart Powerpoint Slide Backgrounds
This is a digital channel marketing chart powerpoint slide backgrounds. This is a ten stage process. The stages in this process are digital marketing, internet, keyword, like, media, links, social media, seo, website, network, forum.
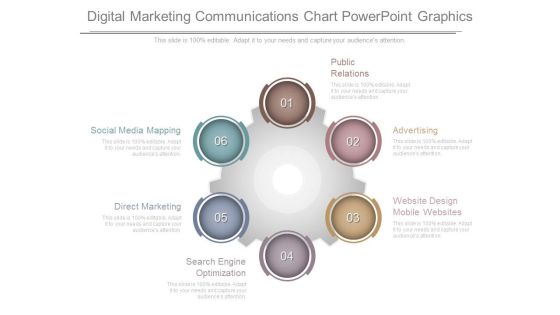
Digital Marketing Communications Chart Powerpoint Graphics
This is a digital marketing communications chart powerpoint graphics. This is a six stage process. The stages in this process are public relations, advertising, website design mobile websites, search engine optimization, direct marketing, social media mapping.

Consumer Purchase Process Flow Chart Powerpoint Ideas
This is a consumer purchase process flow chart powerpoint ideas. This is a five stage process. The stages in this process are information search, evaluation of options, purchase of decision, post purchase, problem or need recognition.

Customer Engagement Touch Points Chart Ppt Sample
This is a customer engagement touch points chart ppt sample. This is a seven stage process. The stages in this process are research, consider and evaluate, awareness, formal rfp, use and service, buy, loyalty repurchase.

Goal Chart Layout Example Of Ppt Presentation
This is a goal chart layout example of ppt presentation. This is a seven stage process. The stages in this process are clear description, how to measure, can i do it, level of effort, start end date, smart goal, research.

Ecommerce Order Fulfillment Process Chart Ppt Slides
This is a ecommerce order fulfillment process chart ppt slides. This is a three stage process. The stages in this process are completely meet demand, fulfill at minimal cost, deliver at promised time.

Customer Awareness Process Flow Chart Ppt Slides
This is a customer awareness process flow chart ppt slides. This is a eight stage process. The stages in this process are preference, loyalty, advertising, personal selling, awareness, purchase, public relations, direct marketing.

Business Telecommunication Process Flow Chart Powerpoint Slides
This is a business telecommunication process flow chart powerpoint slides. This is a eight stage process. The stages in this process are business opportunity, market analysis, new product development, costing and projection, product support, marketing, sales and distribution, product evaluation.
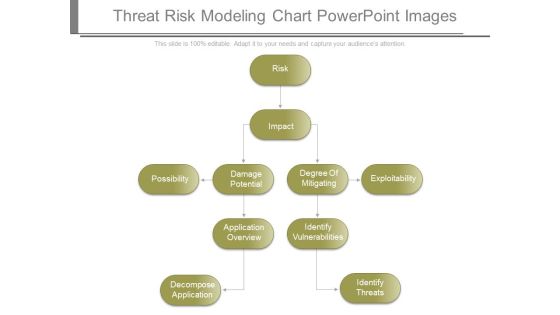
Threat Risk Modeling Chart Powerpoint Images
This is a threat risk modeling chart powerpoint images. This is a five stage process. The stages in this process are risk, impact, possibility, damage potential, degree of mitigating, exploitability, application overview, identify vulnerabilities, decompose application, identify threats.

Employee Management Cycle Chart Powerpoint Templates
This is a employee management cycle chart powerpoint templates. This is a seven stage process. The stages in this process are succession planning, performance management, training and development, recruitment, on boarding, attendance, appraisal.

Cycle Process Flow Chart Powerpoint Show
This is a cycle process flow chart powerpoint show. This is a six stage process. The stages in this process are sales and marketing, bidding process, requirements analysis, sale of good, production of goods, purchase of raw materials.

Operational Support Chart Presentation Powerpoint Slides
This is a operational support chart presentation powerpoint slides. This is a five stage process. The stages in this process are regulatory strategy, project management, regulatory operations, network of expert, quality, real regularly.
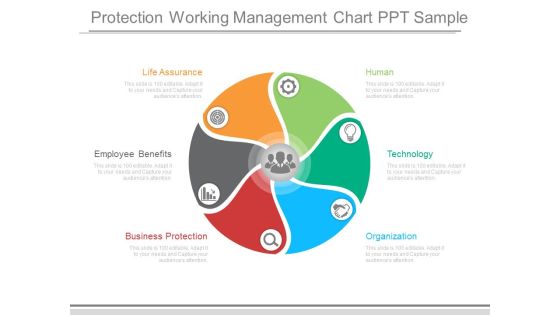
Protection Working Management Chart Ppt Sample
This is a protection working management chart ppt sample. This is a six stage process. The stages in this process are life assurance, employee benefits, business protection, human, technology, organization.
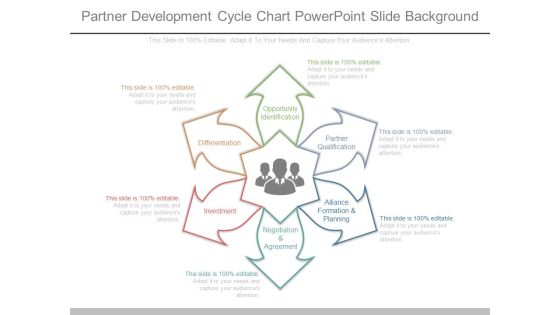
Partner Development Cycle Chart Powerpoint Slide Background
This is a partner development cycle chart powerpoint slide background. This is a six stage process. The stages in this process are opportunity identification, partner qualification, alliance formation and planning, negotiation and agreement, investment, differentiation.
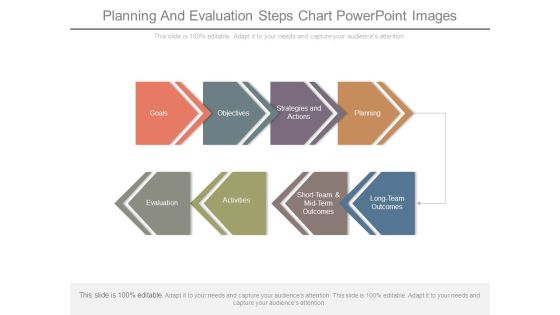
Planning And Evaluation Steps Chart Powerpoint Images
This is a planning and evaluation steps chart powerpoint images. This is a eight stage process. The stages in this process are goals, objectives, strategies and actions, planning, evaluation, activities, short team and mid term outcomes, long team outcomes.

Sales Channel Strategy Chart Powerpoint Show
This is a sales channel strategy chart powerpoint show. This is a four stage process. The stages in this process are channel integration, better offer, channel selection, more front of mind.

Gantt Chart Scheduling Example Powerpoint Slide Backgrounds
This is a gantt chart scheduling example powerpoint slide backgrounds. This is a eight stage process. The stages in this process are website, decision tree, procedure, cash, mind map, testing, celebrating, construction.
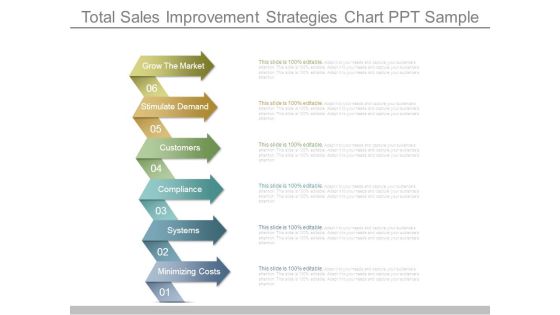
Total Sales Improvement Strategies Chart Ppt Sample
This is a total sales improvement strategies chart ppt sample. This is a six stage process. The stages in this process are grow the market, stimulate demand, customers, compliance, systems, minimizing costs.

Management Information System Chart Powerpoint Slide Download
This is a management information system chart powerpoint slide download. This is a six stage process. The stages in this process are technology, generate order, check credit, people, ship product, sales.

Procurement Flow Chart Presentation Powerpoint Example
This is a procurement flow chart presentation powerpoint example. This is a four stage process. The stages in this process are procurement, epayments, order products and services, receive products.
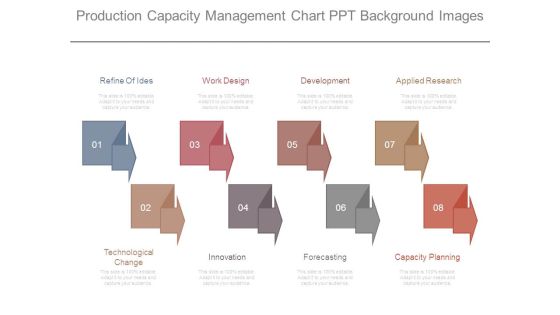
Production Capacity Management Chart Ppt Background Images
This is a production capacity management chart ppt background images. This is a eight stage process. The stages in this process are refine of ides, work design, development, applied research, technological change, innovation, forecasting, capacity planning.
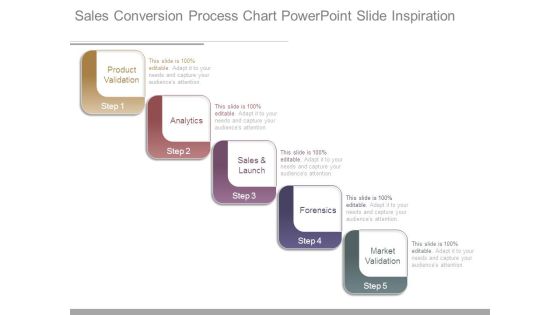
Sales Conversion Process Chart Powerpoint Slide Inspiration
This is a sales conversion process chart powerpoint slide inspiration. This is a five stage process. The stages in this process are product validation, analytics, sales and launch, forensics, market validation.

Consumer Buying Decision Process Chart Powerpoint Show
This is a consumer buying decision process chart powerpoint show. This is a six stage process. The stages in this process are purchase decision, information search, post purchase behavior, need recognition, brand beliefs, degree of importance.

Conversion Funnel Optimization Chart Powerpoint Idea
This is a conversion funnel optimization chart powerpoint idea. This is a seven stage process. The stages in this process are viewers, question, website visitors, sales, interest, purchase, qualified inquiries.
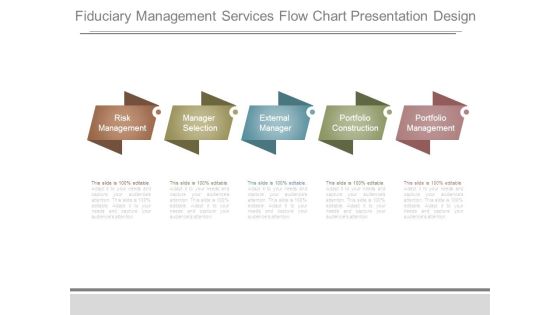
Fiduciary Management Services Flow Chart Presentation Design
This is a fiduciary management services flow chart presentation design. This is a five stage process. The stages in this process are risk management, manager selection, external manager, portfolio construction, portfolio management.

Application System Administration Chart Powerpoint Slides
This is a application system administration chart powerpoint slides. This is a seven stage process. The stages in this process are human user, memory management, scheduler, application software, operating system, file system management, device drivers.

International Portfolio Functions Chart Ppt Examples Professional
This is a international portfolio functions chart ppt examples professional. This is a five stage process. The stages in this process are value, tools for cash, human capital, alignment, balance.

Marchandise Management System Chart Ppt Sample
This is a marchandise management system chart ppt sample. This is a seven stage process. The stages in this process are payment management, inspection, marketing, sourcing, channel management, financial management, orders.
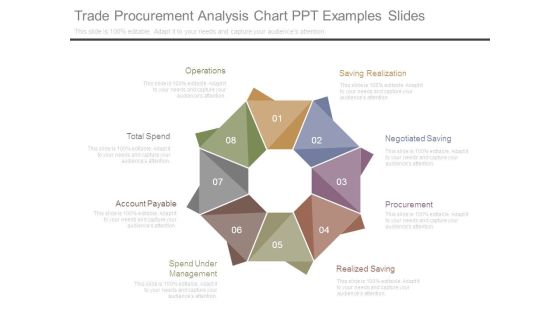
Trade Procurement Analysis Chart Ppt Examples Slides
This is a trade procurement analysis chart ppt examples slides. This is a eight stage process. The stages in this process are operations, total spend, account payable, spend under management, realized saving, procurement, negotiated saving, saving realization.

Marketing Potency Management Chart Ppt Slide Show
This is a marketing potency management chart ppt slide show. This is a five stage process. The stages in this process are viable to business, product, people, process, feasible to implement.

Category Management Training Chart Ppt Slides Styles
This is a category management training chart ppt slides styles. This is a four stage process. The stages in this process are category prioritization and assessment, result tracking and reporting, category strategy development, supplier relationship.

Corporate Leadership Skills Chart Presentation Design
This is a corporate leadership skills chart presentation design. This is a six stage process. The stages in this process are planning and organization, social adjustment, advance financial frameworks, management fundamentals, dynamism, strategic skill.

Customer Satisfaction Information Chart Ppt Templates
This is a customer satisfaction information chart ppt templates. This is a six stage process. The stages in this process are customer loyalty, quality assurance, timely delivery, reasonable price, customer expectations, customer satisfaction.

Continuous Market Research Chart Presentation Visuals
This is a continuous market research chart presentation visuals. This is a nine stage process. The stages in this process are opportunity, purchase behavior, past experience, needs wants, word of mouth, external comms, advertising, media consumption, communication.
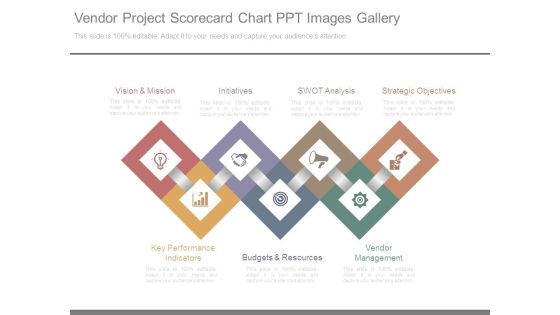
Vendor Project Scorecard Chart Ppt Images Gallery
This is a vendor project scorecard chart ppt images gallery. This is a seven stage process. The stages in this process are vision and mission, initiatives, swot analysis, strategic objectives, vendor management, budgets and resources, key performance indicators.

Web Based Charting Template Powerpoint Shapes
This is a web based charting template powerpoint shapes. This is a five stage process. The stages in this process are rss to email, inspiration, other blogs, freebies, graphic design.

Business Solutions Development Chart Powerpoint Slide Show
This is a business solutions development chart powerpoint slide show. This is a six stage process. The stages in this process are business value, resource leveraging, strategic positioning, developing people, creativity and innovation, focus on performance.

Architecture Development Method Chart Powerpoint Presentation
This is a architecture development method chart powerpoint presentation. This is a ten stage process. The stages in this process are strategic roadmap, current state, requirements, initial planning, deployment, analysis and design, evaluation, future state, architecture vision, business case.
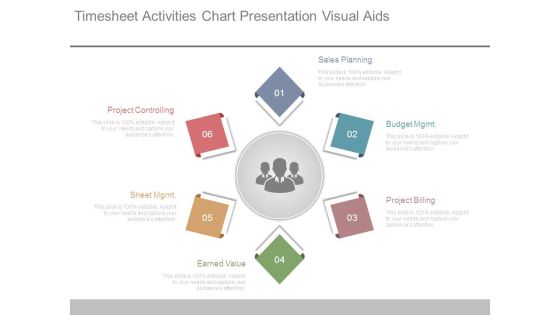
Timesheet Activities Chart Presentation Visual Aids
This is a timesheet activities chart presentation visual aids. This is a six stage process. The stages in this process are sales planning, budget mgmt, project billing, earned value, sheet mgmt, project controlling.

Partner Development Cycle Chart Ppt Model
This is a partner development cycle chart ppt model. This is a eight stage process. The stages in this process are opportunity identification, refinement, partner qualification, negotiation and agreement, stewardship, implementation and management, performance review, preparation.
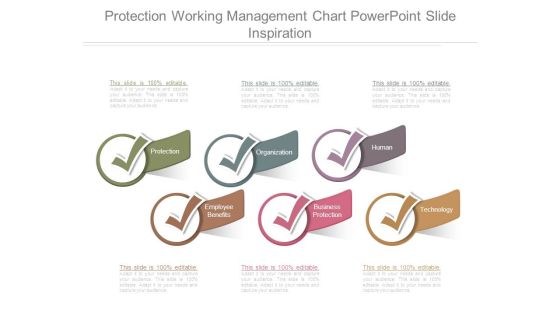
Protection Working Management Chart Powerpoint Slide Inspiration
This is a protection working management chart powerpoint slide inspiration. This is a six stage process. The stages in this process are protection, organization, human, employee benefits, business protection, technology.

Employee Life Cycle Chart Powerpoint Templates Microsoft
This is a employee life cycle chart powerpoint templates microsoft. This is a six stage process. The stages in this process are training, appraisal, payroll run, attendance, separation, manage performance.

Business To Business Sales Chart Presentation Images
This is a business to business sales chart presentation images. This is a six stage process. The stages in this process are your business, marketing, reactive existing customers, culture, reach new customers, sales.
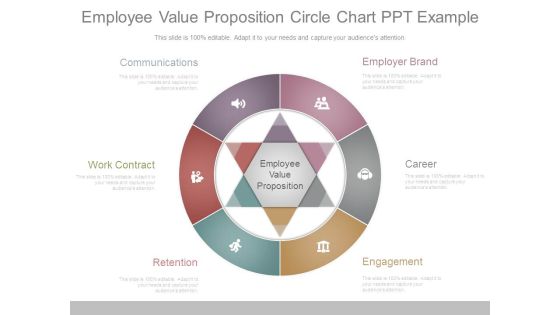
Employee Value Proposition Circle Chart Ppt Example
This is a employee value proposition circle chart ppt example. This is a six stage process. The stages in this process are employer brand, career, engagement, retention, work contract, communications.

Business Economic Cycle Chart Ppt Templates
This is a business economic cycle chart ppt templates. This is a four stage process. The stages in this process are economic prosperity, falling prices, economic depression, rising prices.
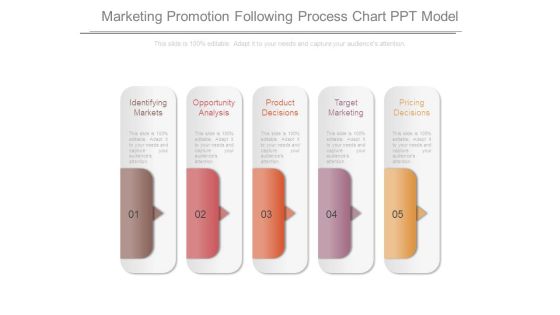
Marketing Promotion Following Process Chart Ppt Model
This is a marketing promotion following process chart ppt model. This is a five stage process. The stages in this process are identifying markets, opportunity analysis, product decisions, target marketing, pricing decisions.

Key Communications Activities Chart Layout Powerpoint Slides
This is a key communications activities chart layout powerpoint slides. This is a five stage process. The stages in this process are start of project, cost effective, equal and inclusive, clearly branded, end of project.

Business Assessment Ppt Chart Powerpoint Slides Show
This is a business assessment ppt chart powerpoint slides show. This is a six stage process. The stages in this process are mission, goals, objectives, outcomes, result analysis, action.
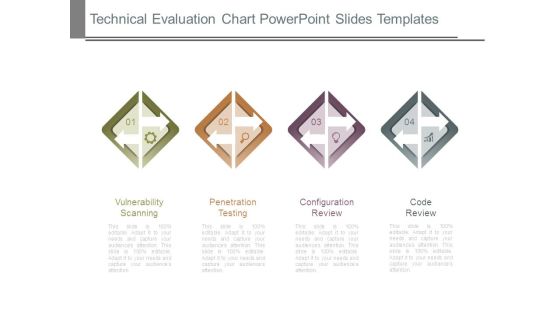
Technical Evaluation Chart Powerpoint Slides Templates
This is a technical evaluation chart powerpoint slides templates. This is a four stage process. The stages in this process are vulnerability scanning, penetration testing, configuration review, code review.
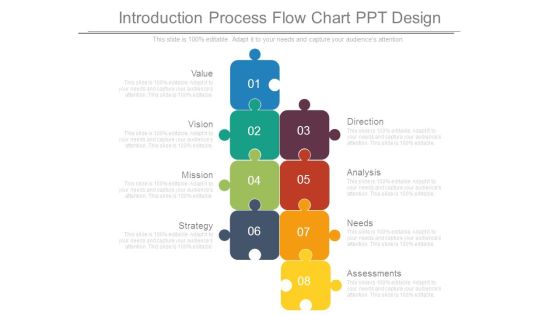
Introduction Process Flow Chart Ppt Design
This is a introduction process flow chart ppt design. This is a eight stage process. The stages in this process are value, vision, mission, strategy, assessments, needs, analysis, direction.

Workforce Management Example Chart Powerpoint Templates Microsoft
This is a workforce management example chart powerpoint templates microsoft. This is a six stage process. The stages in this process are staff planning, staff tracking, job opportunities, staff training, staff transition.

Project Issues Description Chart Powerpoint Slide Graphics
This is a project issues description chart powerpoint slide graphics. This is a seven stage process. The stages in this process are issue description, reported on, reported by, owner, severity, priority, status.

Customer Use Cases Infogarphic Chart Ppt Slide
This is a customer use cases infogarphic chart ppt slide. This is a five stage process. The stages in this process are medical and healthcare, transportation and mobility, industrial and commercial, logistics and networking, defence and aerospace.

Project Issues Infogarphic Chart Ppt Examples Slides
This is a project issues infogarphic chart ppt examples slides. This is a seven stage process. The stages in this process are issue description, reported on, reported by, owner, severity, priority, status.

Competitive Analysis Table Chart Powerpoint Guide
This is a competitive analysis table chart powerpoint guide. This is a twelve stage process. The stages in this process are jan,feb, mar, apr, may, jun, jul, aug, sep, oct, nov, dec.

Partner Sales Cloud Infographic Chart Powerpoint Graphics
This is a partner sales cloud infographic chart powerpoint graphics. This is a six stage process. The stages in this process are news and events, marketing literature, sales tools, channel incentives, product promotions, deal registration.
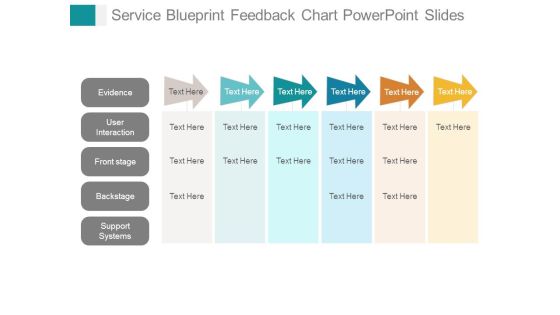
Service Blueprint Feedback Chart Powerpoint Slides
This is a service blueprint feedback chart powerpoint slides. This is a six stage process. The stages in this process are evidence, user interaction, front stage, backstage, support systems.
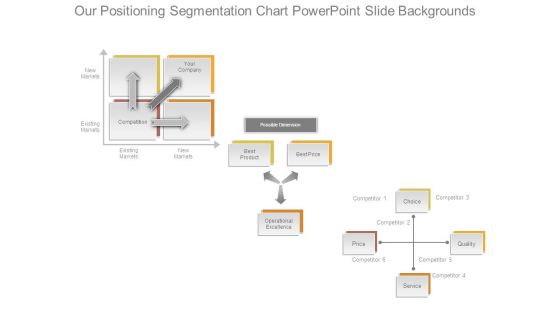
Our Positioning Segmentation Chart Powerpoint Slide Backgrounds
This is a our positioning segmentation chart powerpoint slide backgrounds. This is a three stage process. The stages in this process are new markets, existing markets, your company, competition, possible dimension, best product, operational excellence, service, price, choice.
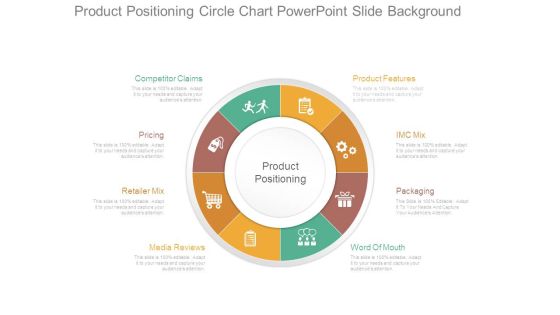
Product Positioning Circle Chart Powerpoint Slide Background
This is a product positioning circle chart powerpoint slide background. This is a eight stage process. The stages in this process are competitor claims, pricing, retailer mix, media reviews, product positioning, product features, imc mix, packaging, word of mouth.
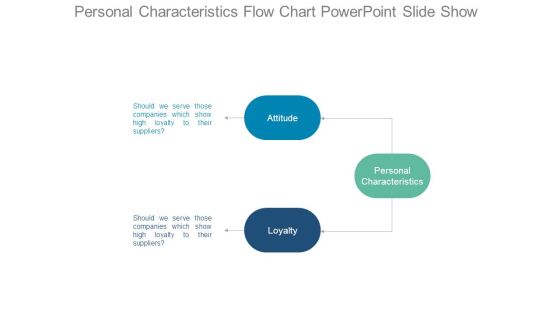
Personal Characteristics Flow Chart Powerpoint Slide Show
This is a personal characteristics flow chart powerpoint slide show. This is a three stage process. The stages in this process are should we serve those companies which show high loyalty to their suppliers, attitude, loyalty, personal characteristics.
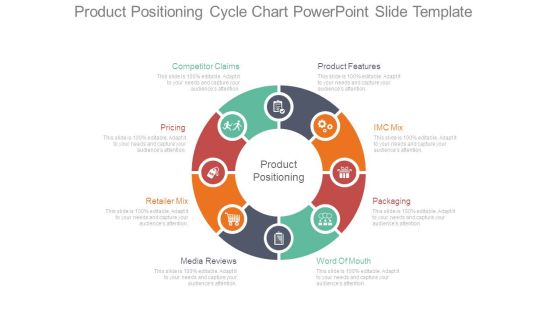
Product Positioning Cycle Chart Powerpoint Slide Template
This is a product positioning cycle chart powerpoint slide template. This is a eight stage process. The stages in this process are product features, imc mix, packaging, word of mouth, media reviews, retailer mix, pricing, competitor claims, product positioning.
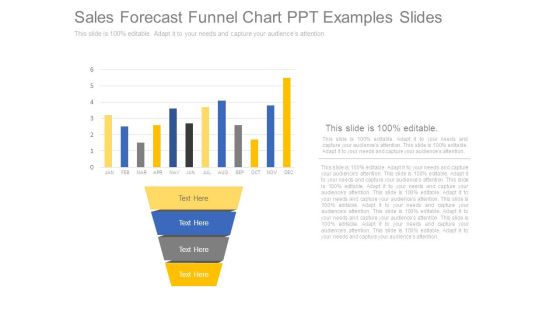
Sales Forecast Funnel Chart Ppt Examples Slides
This is a sales forecast funnel chart ppt examples slides. This is a four stage process. The stages in this process are jan, feb, mar, apr, may, jun, jul, aug, sep, oct, nov, dec.
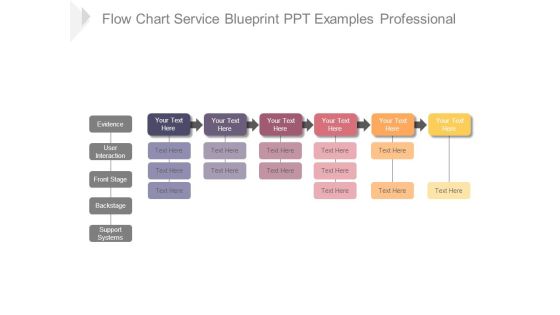
Flow Chart Service Blueprint Ppt Examples Professional
This is a flow chart service blueprint ppt examples professional. This is a six stage process. The stages in this process are evidence, user interaction, front stage, backstage, support systems.

Service Improvement Plan Pie Chart Ppt Infographics
This is a service improvement plan pie chart ppt infographics. This is a four stage process. The stages in this process are service improvement plan, business, strategy, marketing, management.

Competitive Analysis Matrix Chart Ppt Samples Download
This is a competitive analysis matrix chart ppt samples download. This is a six stage process. The stages in this process are competitor, jan, feb, mar, apr, may, jun, jul, aug, sep, oct, nov, dec.

Sales Deal Steps Funnel Chart Ppt Templates
This is a sales deal steps funnel chart ppt templates. This is a eight stage process. The stages in this process are discovery, pre qualification, qualification, solution design, evaluation, decision, negotiation, closed.

Six Sigma Strands Chart Ppt Examples Slides
This is a six sigma strands chart ppt examples slides. This is a six stage process. The stages in this process are bottom line, trained individuals, data driven approach, customer focused, project by project, engagement, benefits of six sigma.
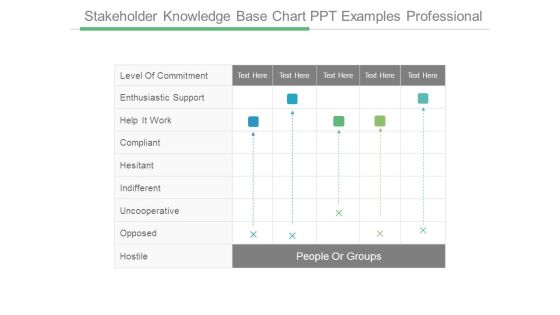
Stakeholder Knowledge Base Chart Ppt Examples Professional
This is a stakeholder knowledge base chart ppt examples professional. This is a five stage process. The stages in this process are people or groups, level of commitment, enthusiastic support, help it work, compliant, hesitant, indifferent, uncooperative, opposed, hostile.
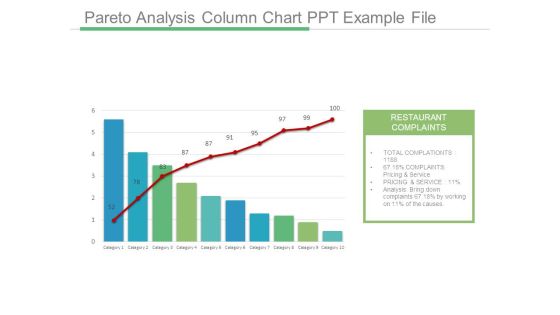
Pareto Analysis Column Chart Ppt Example File
This is a pareto analysis column chart ppt example file. This is a ten stage process. The stages in this process are restaurant complaints, total complaints, complaints pricing and service, pricing and service, analysis bring down complaints, category.

Sipoc Process Infogarphic Chart Powerpoint Slide Influencers
This is a sipoc process infogarphic chart powerpoint slide influencers. This is a five stage process. The stages in this process are suppliers, input, process, output, customer, start, finish, sipoc.
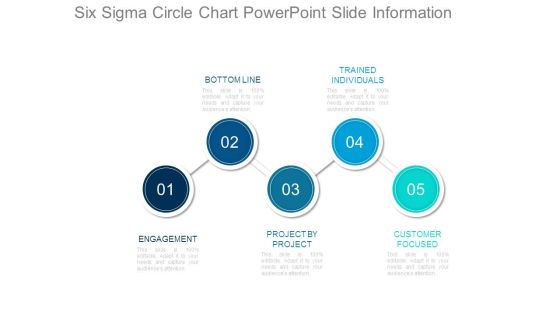
Six Sigma Circle Chart Powerpoint Slide Information
This is a six sigma circle chart powerpoint slide information. This is a five stage process. The stages in this process are bottom line, trained individuals, engagement, project by project, customer focused.
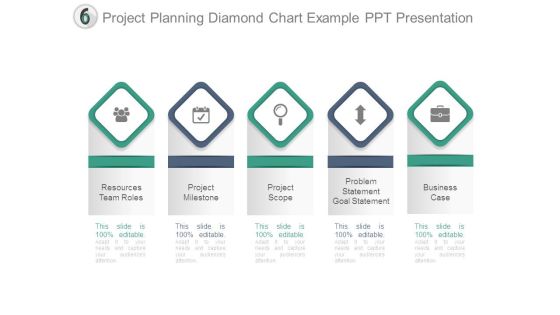
Project Planning Diamond Chart Example Ppt Presentation
This is a project planning diamond chart example ppt presentation. This is a five stage process. The stages in this process are resources team roles, project milestone, project scope, problem statement goal statement, business case.
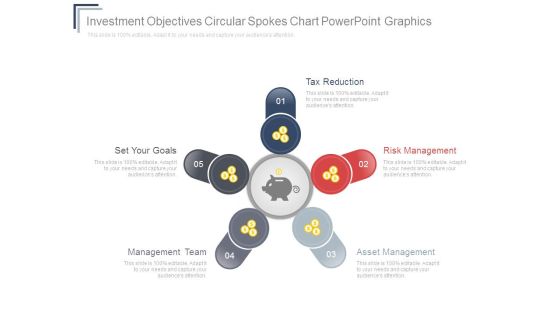
Investment Objectives Circular Spokes Chart Powerpoint Graphics
This is a investment objectives circular spokes chart powerpoint graphics. This is a five stage process. The stages in this process are tax reduction, set your goals, management team, asset management, risk management.
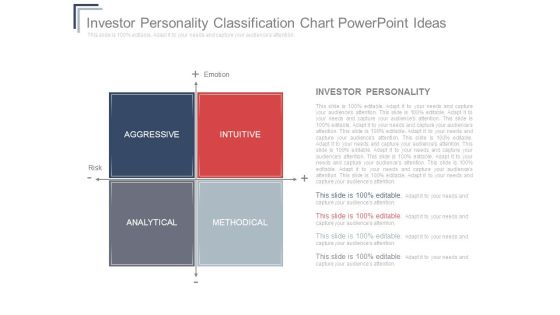
Investor Personality Classification Chart Powerpoint Ideas
This is a investor personality classification chart powerpoint ideas. This is a four stage process. The stages in this process are aggressive, intuitive, analytical, methodical, emotion, risk, investor personality.
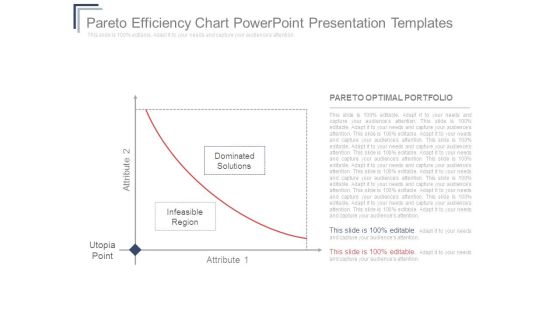
Pareto Efficiency Chart Powerpoint Presentation Templates
This is a pareto efficiency chart powerpoint presentation templates. This is a two stage process. The stages in this process are attribute 2, utopia, point, infeasible region, dominated, solutions, attribute 1, pareto optimal portfolio.

Risk Return Chart Ppt Slide Template
This is a risk return chart ppt slide template. This is a four stage process. The stages in this process are probability of technical success, bread and butter, pearls, oysters.
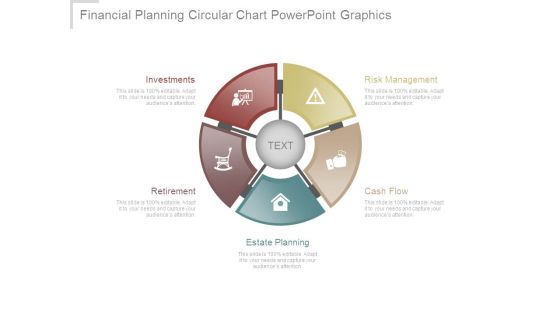
Financial Planning Circular Chart Powerpoint Graphics
This is a financial planning circular chart powerpoint graphics. This is a five stage process. The stages in this process are risk management, cash flow, estate planning, retirement, investments.
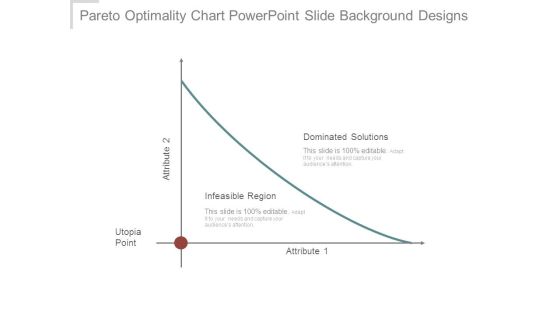
Pareto Optimality Chart Powerpoint Slide Background Designs
This is a pareto optimality chart powerpoint slide background designs. This is a one stage process. The stages in this process are dominated solutions, infeasible region, utopia point, attribute.
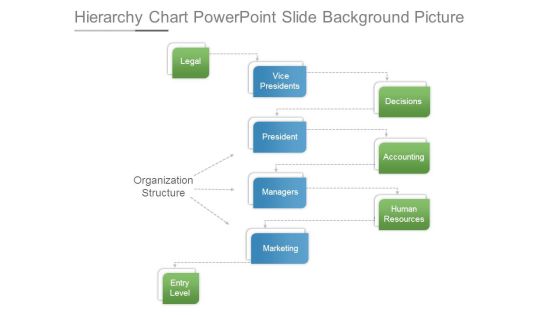
Hierarchy Chart Powerpoint Slide Background Picture
This is a hierarchy chart powerpoint slide background picture. This is a eight stage process. The stages in this process are organization structure, legal, vice presidents, decisions, president, managers, marketing, accounting, human resources, entry level.

Business Model Canvas Chart Ppt Images
This is a business model canvas chart ppt images. This is a five stage process. The stages in this process are key partners, key activities, value propositions, customer relationships, customer segments, key resources, channels, cost structure, revenue streams.
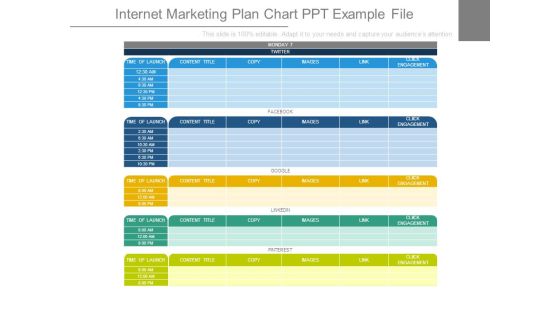
Internet Marketing Plan Chart Ppt Example File
This is a internet marketing plan chart ppt example file. This is a five stage process. The stages in this process are monday, twitter, time of launch, content title, copy, images, link, click engagement, face book, google, linkedin, pinterest.

Customer Experience Survey Chart Powerpoint Templates Download
This is a customer experience survey chart powerpoint templates download. This is a four stage process. The stages in this process are satisfy unstated, customer needs, achieve customer delight, meet basic, customer requirements.

Company Positioning Charts Dashboard Ppt Background Template
This is a company positioning charts dashboard ppt background template. This is a four stage process. The stages in this process are possible dimension, best product, best price, operational excellence, choice, service, quality, competition, your company.
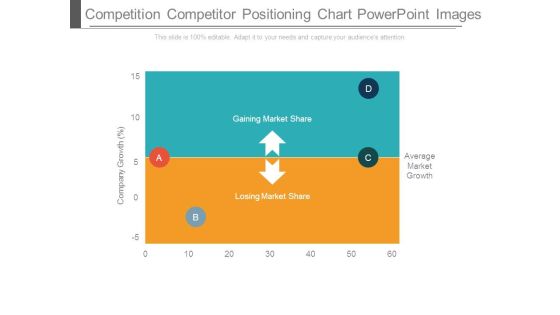
Competition Competitor Positioning Chart Powerpoint Images
This is a competition competitor positioning chart powerpoint images. This is a four stage process. The stages in this process are gaining market share, losing market share, average market growth, company growth.

Organizational Design Chart Ppt Samples Download
This is a organizational design chart ppt samples download. This is a five stage process. The stages in this process are owners, stockholders and shareholders, board of directors president, chief, executive officer ceo, senior vice president.

Digital Marketing Roadmap Gantt Chart Ppt Slide
This is a digital marketing roadmap gantt chart ppt slide. This is a five stage process. The stages in this process are content, paid organic search, email marketing, social media.

Business Model Canvas Chart Example Ppt Presentation
This is a business model canvas chart example ppt presentation. This is a five stage process. The stages in this process are key partners, key activities, value propositions, customer relationships, customer segments, key resources, channels, cost structure, revenue streams.

Business Strategy Process Steps Chart Powerpoint Slides
This is a business strategy process steps chart powerpoint slides. This is a six stage process. The stages in this process are goals, mission, value, vision, strategy, action plan.

New Business Model Chart Presentation Powerpoint Example
This is a new business model chart presentation powerpoint example. This is a five stage process. The stages in this process are key partners, key activities, value propositions, customer, relationships, customer segments, key resources, channels, cost structure, revenue streams.

Customer Revenue Statistical Chart Powerpoint Templates Microsoft
This is a customer revenue statistical chart powerpoint templates microsoft. This is a ten stage process. The stages in this process are email, display retargeting, comparison shopping, display, affiliates, inbound free links, brand organic search, brand paid search.

Workforce Performance Comparison Chart Powerpoint Slides Templates
This is a workforce performance comparison chart powerpoint slides templates. This is a two stage process. The stages in this process are customer focus, accountability, service excellence, problem solving, continuous improvement, collaborative conflict resolution.
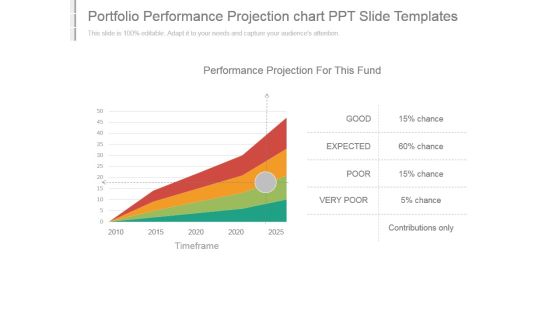
Portfolio Performance Projection Chart Ppt Slide Templates
This is a portfolio performance projection chart ppt slide templates. This is a four stage process. The stages in this process are performance projection for this fund, good, expected, poor, very poor, contributions only, timeframe.
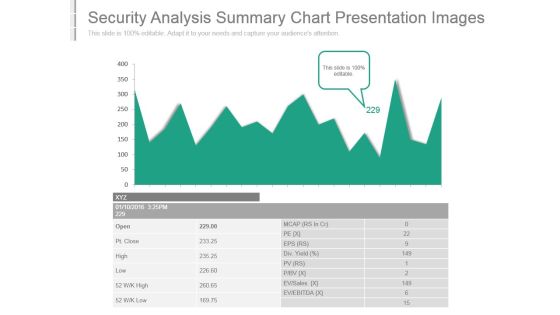
Security Analysis Summary Chart Presentation Images
This is a security analysis summary chart presentation images. This is a one stage process. The stages in this process are ev ebitda, ev sales, div yield, open, pt close, high, low, mcap, eps.
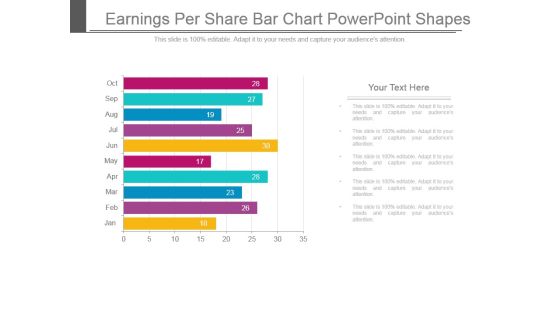
Earnings Per Share Bar Chart Powerpoint Shapes
This is a earnings per share bar chart powerpoint shapes. This is a ten stage process. The stages in this process are jan, feb, mar, apr, may, jun, jul, aug, sep, oct.
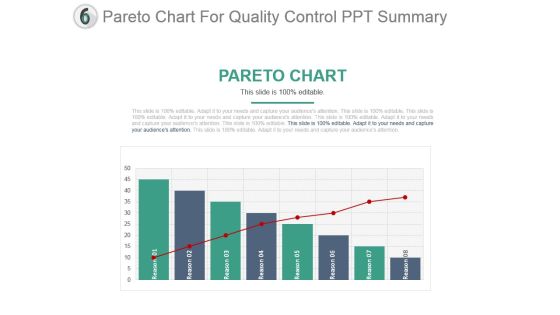
Pareto Chart For Quality Control Ppt Summary
This is a pareto chart for quality control ppt summary. This is a eight stage process. The stages in this process are business, success, marketing, strategy, growth, graphic design.

Competitor Analysis Chart Ppt PowerPoint Presentation Visuals
This is a competitor analysis chart ppt powerpoint presentation visuals. This is a five stage process. The stages in this process are revenue, profit, market share, main activity, number of employee, product quality.

Activity Planning Chart Ppt PowerPoint Presentation Designs
This is a activity planning chart ppt powerpoint presentation designs. This is a seven stage process. The stages in this process are sun, mon, tue, wed, thru, fri, sat.
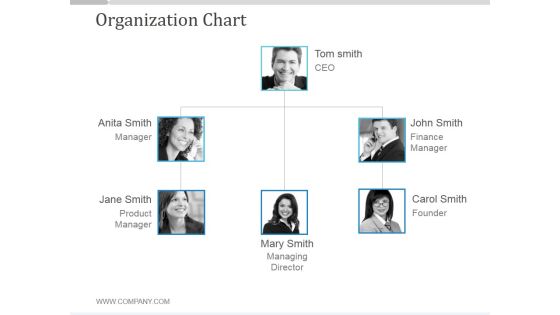
Organization Chart Ppt PowerPoint Presentation Backgrounds
This is a organization chart ppt powerpoint presentation backgrounds. This is a three stage process. The stages in this process are tom smith ceo, john smith finance manager, john smith finance manager, john smit finance manager.

Hierarchy Chart Ppt PowerPoint Presentation Ideas
This is a hierarchy chart ppt powerpoint presentation ideas. This is a three stage process. The stages in this process are peter smith, anita dross, carol taren, marry dsouza, even worsen.
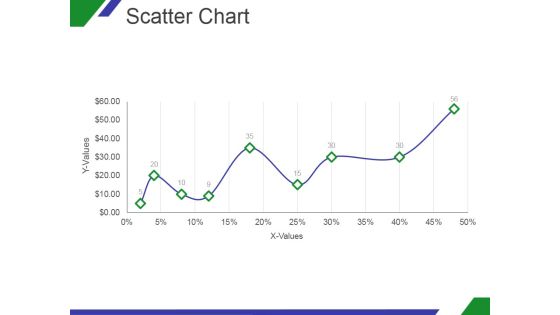
Scatter Chart Ppt PowerPoint Presentation Designs Download
This is a scatter chart ppt powerpoint presentation designs download. This is a nine stage process. The stages in this process are x values, y values, graph, growth, success.

Stacked Line Chart Ppt PowerPoint Presentation Shapes
This is a stacked line chart ppt powerpoint presentation shapes. This is a two stage process. The stages in this process are product, profit in thousands, finance, analysis, growth.

Bar Chart Ppt PowerPoint Presentation Background Designs
This is a bar chart ppt powerpoint presentation background designs. This is a twelve stage process. The stages in this process are bar graph, finance, marketing, strategy, analysis, investment.

Column Chart Ppt PowerPoint Presentation Background Designs
This is a column chart ppt powerpoint presentation background designs. This is a two stage process. The stages in this process are bar graph, finance, marketing, strategy, analysis, business.

Combo Chart Ppt PowerPoint Presentation Infographics Infographics
This is a combo chart ppt powerpoint presentation infographics infographics. This is a three stage process. The stages in this process are bar graph, growth, finance, marketing, strategy, business.
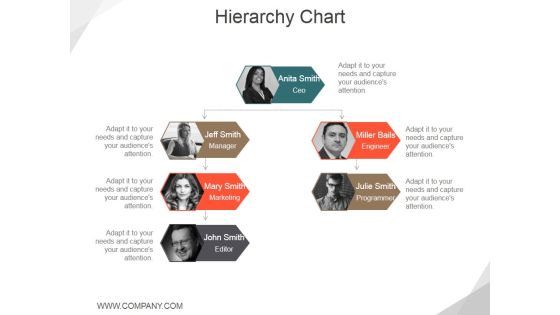
Hierarchy Chart Ppt PowerPoint Presentation Outline Ideas
This is a hierarchy chart ppt powerpoint presentation outline ideas. This is a two stage process. The stages in this process are anita smith ceo, jeff smith manager, miller bails engineer.
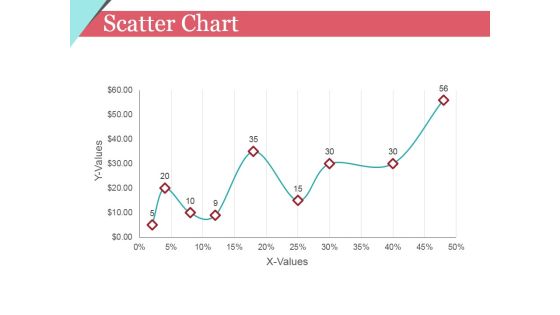
Scatter Chart Ppt PowerPoint Presentation Model Template
This is a scatter chart ppt powerpoint presentation model template. This is a nine stage process. The stages in this process are x values, y values, graph, growth, success.
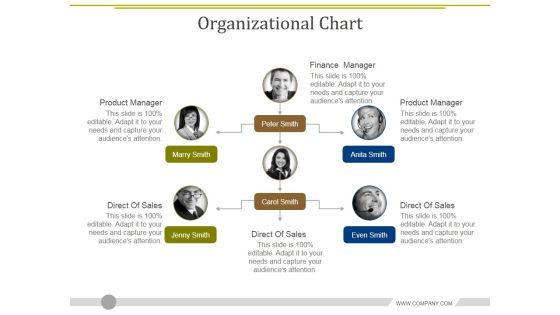
Organizational Chart Ppt PowerPoint Presentation Layouts Demonstration
This is a organizational chart ppt powerpoint presentation layouts demonstration. This is a six stage process. The stages in this process are finance manager, product manager, direct of sales, direct of sales, direct of sales.
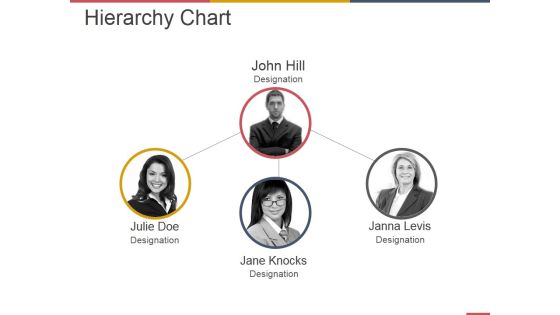
Hierarchy Chart Ppt PowerPoint Presentation Model Maker
This is a hierarchy chart ppt powerpoint presentation model maker. This is a four stage process. The stages in this process are business, strategy, marketing, communication, work management, teamwork.
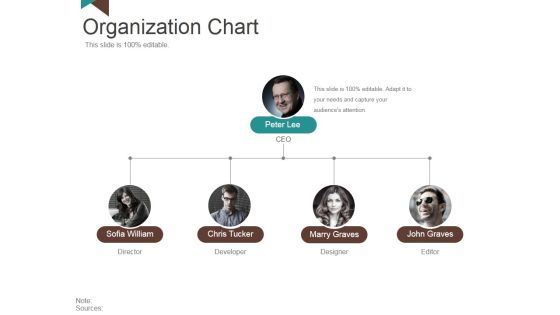
Organization Chart Ppt PowerPoint Presentation Styles Outfit
This is a organization chart ppt powerpoint presentation styles outfit. This is a four stage process. The stages in this process are peter lee, sofia william, chris tucker, marry graves, john graves.

Combo Chart Ppt PowerPoint Presentation Inspiration Images
This is a combo chart ppt powerpoint presentation inspiration images. This is a three stage process. The stages in this process are market size, in years, growth rate, product.
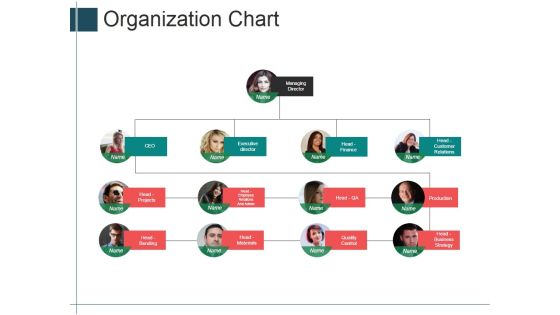
Organization Chart Ppt PowerPoint Presentation Portfolio Shapes
This is a organization chart ppt powerpoint presentation portfolio shapes. This is a four stage process. The stages in this process are managing director, executive director, head finance, head projects.
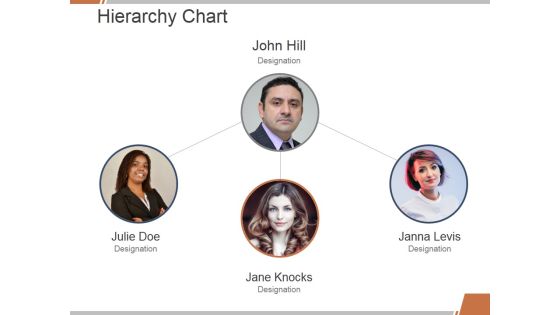
Hierarchy Chart Ppt PowerPoint Presentation Summary Deck
This is a hierarchy chart ppt powerpoint presentation summary deck. This is a three stage process. The stages in this process are john hill, julie doe, jane knocks, janna levis.

Combo Chart Ppt PowerPoint Presentation Summary Ideas
This is a combo chart ppt powerpoint presentation summary ideas. This is a eight stage process. The stages in this process are market size, growth rate, product, in years.

Area Chart Ppt PowerPoint Presentation Professional Designs
This is a area chart ppt powerpoint presentation professional designs. This is a two stage process. The stages in this process are in percentage, product, in years, strategy, business, marketing.

Line Chart Ppt PowerPoint Presentation Layouts Professional
This is a line chart ppt powerpoint presentation layouts professional. This is a two stage process. The stages in this process are in percentage, product, in years, strategy, marketing, business.
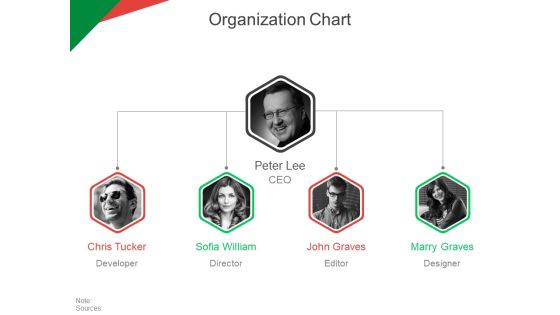
Organization Chart Ppt PowerPoint Presentation Ideas Tips
This is a organization chart ppt powerpoint presentation ideas tips. This is a four stage process. The stages in this process are peter lee, john graves, marry graves, sofia william, chris tucker.
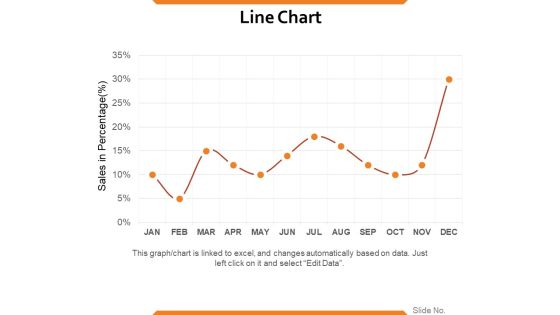
Line Chart Ppt PowerPoint Presentation Summary Samples
This is a line chart ppt powerpoint presentation summary samples. This is a one stage process. The stages in this process are sales in percentage, percentage, business, marketing, strategy.

Combo Chart Ppt PowerPoint Presentation Outline Model
This is a combo chart ppt powerpoint presentation outline model. This is a eight stage process. The stages in this process are market size, growth rate, growth, success, graph.

Area Chart Ppt PowerPoint Presentation Pictures Files
This is a area chart ppt powerpoint presentation pictures files. This is a two stage process. The stages in this process are product, sales, in percentage, financial year, business.

Scatter Chart Ppt PowerPoint Presentation Summary Visuals
This is a scatter chart ppt powerpoint presentation summary visuals. This is a eight stage process. The stages in this process are product, profit in sales, in percentage, finance, business.
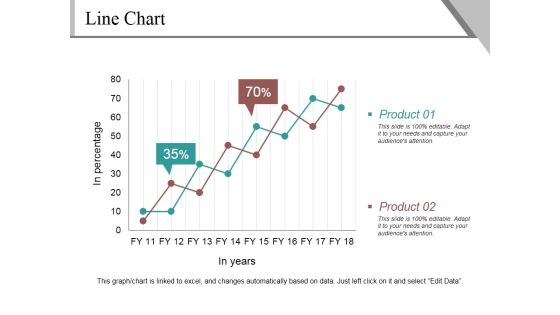
Line Chart Ppt PowerPoint Presentation Infographics Example
This is a line chart ppt powerpoint presentation infographics example. This is a two stage process. The stages in this process are product, in percentage, in years, finance, growth.

Line Chart Ppt PowerPoint Presentation Layouts Example
This is a line chart ppt powerpoint presentation layouts example. This is a two stage process. The stages in this process are sales in percentage, product, financial years, growth, success.
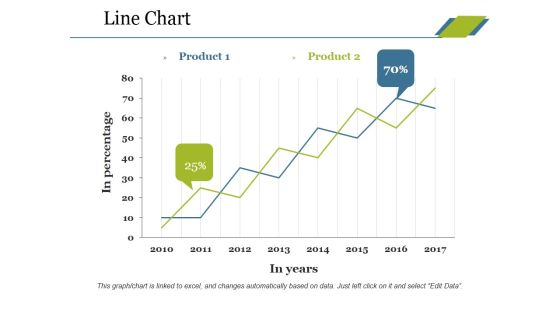
Line Chart Ppt PowerPoint Presentation Professional Tips
This is a line chart ppt powerpoint presentation professional tips. This is a two stage process. The stages in this process are product, in percentage, in years, growth, success.

Line Chart Ppt PowerPoint Presentation Slides Ideas
This is a line chart ppt powerpoint presentation slides ideas. This is a two stage process. The stages in this process are product, in percentage, in years, growth, success.

Line Chart Ppt PowerPoint Presentation Show Guide
This is a line chart ppt powerpoint presentation show guide. This is a two stage process. The stages in this process are product, sales in percentage, financial years, growth, success.

Organization Chart Ppt PowerPoint Presentation Gallery Ideas
This is a organization chart ppt powerpoint presentation gallery ideas. This is a four stage process. The stages in this process are managing director, ceo, head projects, head bending.

Combo Chart Ppt PowerPoint Presentation Show Deck
This is a combo chart ppt powerpoint presentation show deck. This is a three stage process. The stages in this process are growth rate, market size, product, bar graph, growth.

Line Chart Ppt PowerPoint Presentation Slides Mockup
This is a line chart ppt powerpoint presentation slides mockup. This is a two stage process. The stages in this process are in percentage, in years, product, growth, success.

Bar Chart Ppt PowerPoint Presentation Outline Backgrounds
This is a bar chart ppt powerpoint presentation outline backgrounds. This is a one stage process. The stages in this process are sales in percentage, financial years, product, bar graph, finance.

Bar Chart Ppt PowerPoint Presentation Ideas Deck
This is a bar chart ppt powerpoint presentation ideas deck. This is a two stage process. The stages in this process are product, in percentage, in years, financial, business.
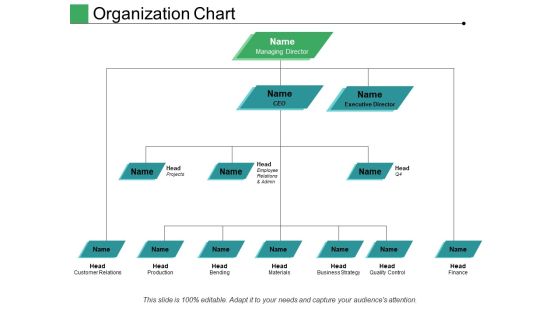
Organization Chart Ppt PowerPoint Presentation Pictures Structure
This is a organization chart ppt powerpoint presentation pictures structure. This is a three stage process. The stages in this process are managing director, executive director, head, ceo, finance.
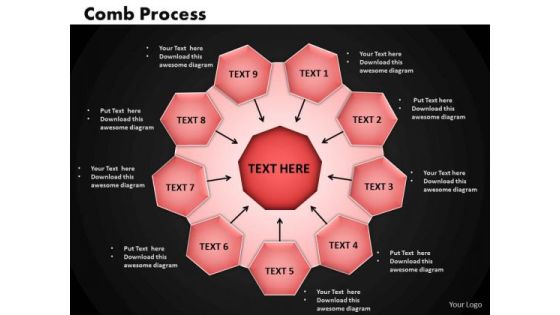
Business Circle Charts PowerPoint Templates Marketing Comb Process Ppt Slides
Business Circle Charts PowerPoint Templates Marketing Comb Process PPT Slides-Precision is what the users demand and seek for in a market that is getting increasingly complex. use this diagram to expalin this complex marketing process-Business Circle Charts PowerPoint Templates Marketing Comb Process PPT Slides-This template can be used for presentations relating to Abstract, Backdrop, Background, Biology, Cell, Chemistry, Computer, Connections, Construction, Design, Digital, Futuristic, Geometric, Graphic, Grid, Hexagon, Holes, Honeycomb, Illustration, Mesh, Modern, Network, Organization, Pattern, Rows, Science, Shape, Structure
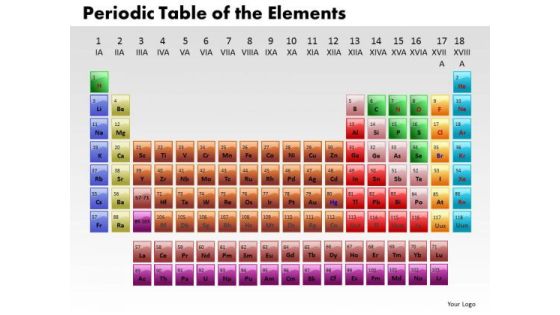
Business Circle Charts PowerPoint Templates Marketing Periodic Table Ppt Slides
Business Circle Charts PowerPoint Templates Marketing periodic table PPT Slides-Whether you manage people, projects or events this perodic table diagrams will meet your all needs. So bring the power of clear, visual communication to your everyday work.. -Business Circle Charts PowerPoint Templates Marketing periodic table PPT Slides-This template can be used for presentations relating to Actinoids, Atom, Atomic, Chemistry, Electrons, Element, Helium, Hydrogen, Lanthanoids, Liquid, Molecule, Noble, Periodic, Physics, Plutonium, Quantum, Radium, Science, Scientific, Solid, Symbol, Table
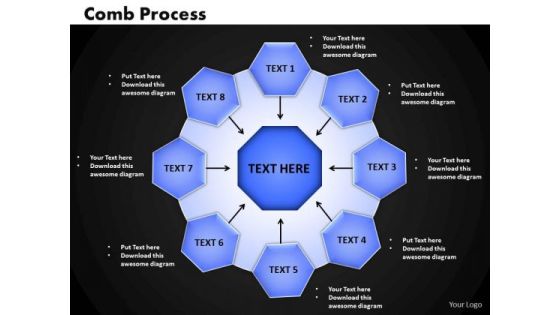
Business Circle Charts PowerPoint Templates Strategy Comb Process Ppt Slides
Business Circle Charts PowerPoint Templates Strategy Comb Process PPT Slides-Precision is what the users demand and seek for in a market that is getting increasingly complex. use this comb diagram to expalin complex business strategies-Business Circle Charts PowerPoint Templates Strategy Comb Process PPT Slides-This template can be used for presentations relating to Abstract, Backdrop, Background, Biology, Cell, Chemistry, Computer, Connections, Construction, Design, Digital, Futuristic, Geometric, Graphic, Grid, Hexagon, Holes, Honeycomb, Illustration, Mesh, Modern, Network, Organization, Pattern, Rows, Science, Shape, Structure
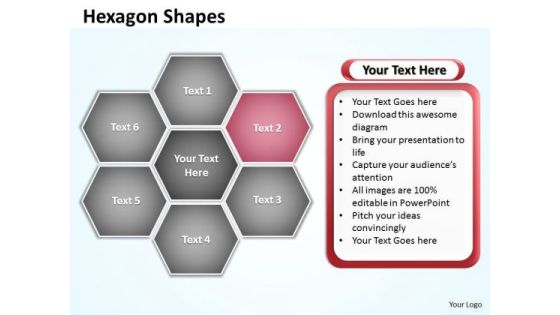
Ppt Hexagon Angles Shaped Chart Editable PowerPoint Templates 2007
PPT hexagon angles shaped chart editable powerpoint templates 2007-Use this Hexagon diagram to explain complex and difficult business strategic planning & staff development. This is an amazing tool to ensure that strategic planning sessions contribute to teambuilding, and are interesting too.-PPT hexagon angles shaped chart editable powerpoint templates 2007-Abstract, Background, Design, Digital, Elements, Graphic, Grey, Hexagon, Illustration, Light, Modern, Perspective, Triangles, Shapes, Shiny, Style, Technology, Template, Vector, Vertical, Virtual, Wallpaper, Web
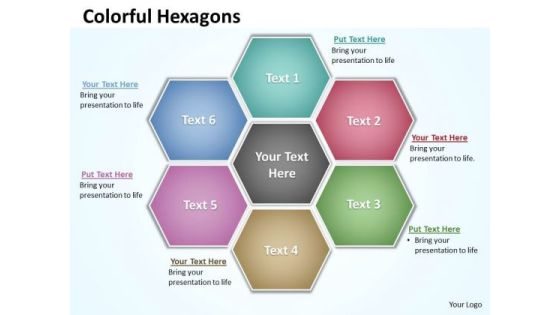
Ppt Hexagon Shapes Chart Presentation PowerPoint Tips Free Download Templates
PPT hexagon shapes chart presentation powerpoint tips free download Templates-This Hexagon diagram is a graphical illustration of the relationships between and among sets of data, groups of objects. . Present your views using this innovative slide and be assured of leaving a lasting impression.-PPT hexagon shapes chart presentation powerpoint tips free download Templates-Abstract, Background, Design, Digital, Elements, Graphic, Grey, Hexagon, Illustration, Light, Modern, Perspective, Triangles, Shapes, Shiny, Style, Technology, Template, Vector, Vertical, Virtual, Wallpaper, Web

Business Diagram With Dollars Money PowerPoint Templates And PowerPoint Themes 1012
Visually support your Microsoft office PPT Presentation with our above template illustrating a business diagram on stack of dollars. This image represents the concept of financial analysis. This image has been conceived to enable you to emphatically communicate your ideas in your Business PPT presentations on finance, market, investment and success. Create captivating presentations to deliver comparative and weighted arguments.

Round Implementation Of 5 Steps Involved Process Create Flow Chart PowerPoint Templates
We present our round implementation of 5 steps involved process create flow chart PowerPoint templates.Use our Circle Charts PowerPoint Templates because,You have some hits, you had some misses. Use our Arrows PowerPoint Templates because,There are a bucketful of brilliant ideas swirling around within your group. Use our Design PowerPoint Templates because, Some opportunities are bound to be highly profitable for you to follow up. Use our Shapes PowerPoint Templates because, This helps you to put all your brilliant views to your audience. Use our Process and Flows PowerPoint Templates because,You can Explain the contribution of each of the elements and how they provide impetus to the next phase.Use these PowerPoint slides for presentations relating to 3d, abstract, around, arrows, blue, border, business, center, circle, circular, concept, connections, copy, curve, cycle, directions, distribution, illustration, management, middle, objects, pieces, plan, pointing, process, recycle, rounded, shadows, space, system. The prominent colors used in the PowerPoint template are Yellow, Gray, Black

Business Diagram Laptop Made With Puzzle For Text Display Presentation Template
This Power Point template slide has been crafted with graphic of laptop which is made with puzzles. This PPT slide contains the concept of text representation. Use this PPT slide for business data representation.

Business Diagram Different Modern Network Serial Audio Connection Plugs Ppt Slide
This PowerPoint template has been designed with graphic of different modern network audio connection plugs. These plugs are used to display network connection. Use this slide for your audio connection related topics in any technical presentation.
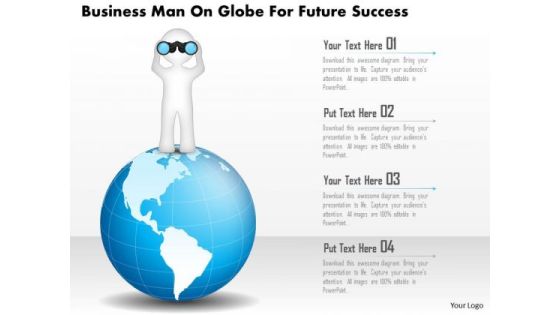
Business Diagram Business Man On Globe For Future Success Presentation Template
Concept of business vision can be explained with this business slide. It contains graphics of 3d man standing on globe looking through binoculars. Grab the attention of your listeners with this slide.

Digital Promotional Five Year Transformation Swimlane Roadmap Themes
A cohesive work plan is essential for achieving the desired target. Communicate your vision and lay a firm ground in front of your audience with our PowerPoint layout. Align your project milestones, budgets, deliverables, deadlines, and all the requisite information for a dynamic presentation by employing this amazingly designed digital promotional five year transformation swimlane roadmap themes. Maximize team efficiency and streamline a work plan efficiently by introducing our ready made roadmap PowerPoint theme. You can quickly establish coordination between different activities across the organization and present an insight to your colleagues by utilizing this useful business tool. Color code specific tasks, prioritize, and keep a close eye on the deadlines with the help of our eye catchy PowerPoint template. Download our digital promotional five year transformation swimlane roadmap themes for excelling at productive management.

Online Digital Promotional Six Months Transformation Roadmap Themes
A cohesive work plan is essential for achieving the desired target. Communicate your vision and lay a firm ground in front of your audience with our PowerPoint layout. Align your project milestones, budgets, deliverables, deadlines, and all the requisite information for a dynamic presentation by employing this amazingly designed online digital promotional six months transformation roadmap themes. Maximize team efficiency and streamline a work plan efficiently by introducing our ready made roadmap PowerPoint theme. You can quickly establish coordination between different activities across the organization and present an insight to your colleagues by utilizing this useful business tool. Color code specific tasks, prioritize, and keep a close eye on the deadlines with the help of our eye catchy PowerPoint template. Download our online digital promotional six months transformation roadmap themes for excelling at productive management.

Combo Chart Ppt PowerPoint Presentation Gallery Mockup
This is a clustered column ppt powerpoint presentation portfolio good. This is a three stage process. The stages in this process are business, marketing, strategy, finance, planning.
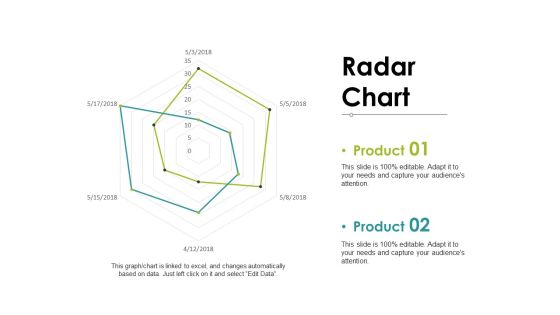
Radar Chart Ppt PowerPoint Presentation Ideas Mockup
This is a stacked column ppt powerpoint presentation pictures layouts. This is a two stage process. The stages in this process are business, marketing, planning, finance, strategy.
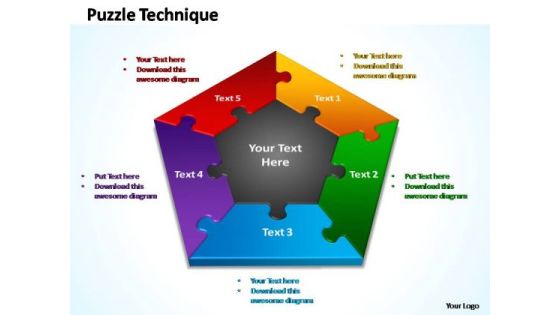
PowerPoint Slide Chart Puzzle Technique Ppt Design
PowerPoint Slide Chart Puzzle Technique PPT Design-The basic stages are in place. Various threads are joining up and being stitched together providing necessary strength Now you have to take the last leap. Illustrate your ideas and imprint them in the minds of your team with this template. Feel the buzz as they comprehend your plan to get the entire act together. Watch their eyes light up with enthusiasm as they see the dream emerge.-PowerPoint Slide Chart Puzzle Technique PPT Design
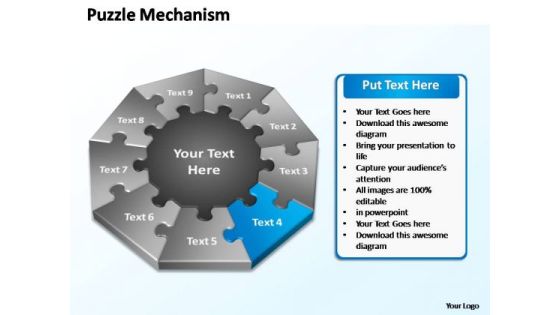
PowerPoint Layout Chart Puzzle Mechanism Ppt Slide
PowerPoint Layout Chart Puzzle Mechanism PPT Slide-The basic stages are in place. Various threads are joining up and being stitched together providing necessary strength Now you have to take the last leap. Illustrate your ideas and imprint them in the minds of your team with this template. Feel the buzz as they comprehend your plan to get the entire act together. Watch their eyes light up with enthusiasm as they see the dream emerge.-PowerPoint Layout Chart Puzzle Mechanism PPT Slide
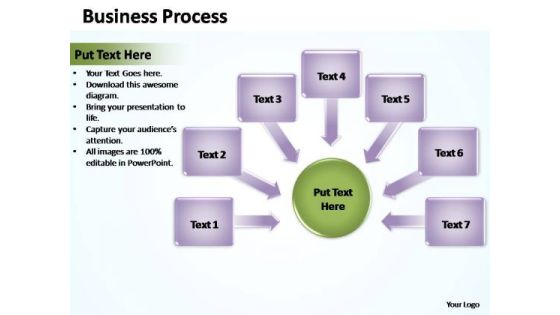
PowerPoint Layouts Chart Business Process Ppt Designs
PowerPoint Layouts Chart Business Process PPT Designs-The template offers an excellent background to build up the various stages of your business process. Bullet-point your thoughts and ideas to profitably accomplish every step of every stage along the way. Give them an overview of your capability and insight into the minute details of the overall picture highlighting the the interdependence at every operational level.-PowerPoint Layouts Chart Business Process PPT Designs
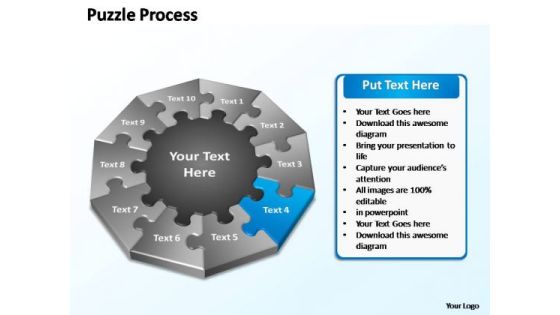
PowerPoint Presentation Chart Puzzle Business Ppt Template
PowerPoint Presentation Chart Puzzle Business PPT Template-The basic stages are in place. Various threads are joining up and being stitched together providing necessary strength Now you have to take the last leap. Illustrate your ideas and imprint them in the minds of your team with this template. Feel the buzz as they comprehend your plan to get the entire act together. Watch their eyes light up with enthusiasm as they see the dream emerge.-PowerPoint Presentation Chart Puzzle Business PPT Template

PowerPoint Designs List Chart Ppt Template
PowerPoint Designs List Chart PPT Template-Use to awesome List and text boxes powerpoint templates to create awesome marketing and sales priority lists or any other types of lists.-PowerPoint Designs List Chart PPT Template-3d, Adhesive, Appliance, Background, Big, Blank, Blue, Chrome, Classic, Clean, Closed, Cold, Cool, Cooler, Copyspace, Design, Domestic, Door, Equipment, Freezer, Fridge, Handle, Household, Illustration, Kitchen, Large, List, Memo, Message, Metal, Nobody, Note, Object

Company Product Sales Forecast Chart Download PDF
This slide shows the Product sales forecast table with Product names along with price per unit and total units sold for the current as well as the projected period till the year 2023. Deliver an awe inspiring pitch with this creative company product sales forecast chart download pdf bundle. Topics like company product sales forecast chart can be discussed with this completely editable template. It is available for immediate download depending on the needs and requirements of the user.

Employee Career Growth Progression Chart Download Pdf
This slide covers the employee career growth chart which focuses on job grades, salary bands, job titles of a marketing team. Deliver an awe inspiring pitch with this creative employee career growth progression chart download pdf bundle. Topics like marketing, strategist, social media can be discussed with this completely editable template. It is available for immediate download depending on the needs and requirements of the user.

Testing Agile Scrum Organizational Chart Clipart PDF
This slide provides the glimpse about the testing agile enterprise organization structure which focuses on portfolio, program and team along with team members details. Deliver an awe inspiring pitch with this creative testing agile scrum organizational chart clipart pdf bundle. Topics like testing agile scrum organizational chart can be discussed with this completely editable template. It is available for immediate download depending on the needs and requirements of the user.
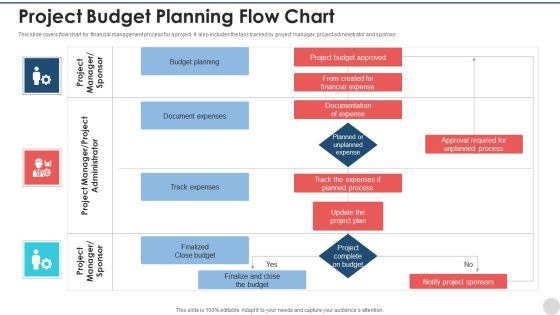
Project Budget Planning Flow Chart Inspiration PDF
This slide covers flow chart for financial management process for a project. It also includes the task tracked by project manager, project administrator and sponsor. Showcasing this set of slides titled project budget planning flow chart inspiration pdf. The topics addressed in these templates are budget planning, document expenses, track expenses, finalized close budget. All the content presented in this PPT design is completely editable. Download it and make adjustments in color, background, font etc. as per your unique business setting.

Employee Rewards Incentive Programs Chart Slides PDF
This slide represents employee rewards incentive policy charts illustrating cash incentive, performance incentive, sales commission, awards and profit sharing plan. Pitch your topic with ease and precision using this Employee Rewards Incentive Programs Chart Slides PDF. This layout presents information on Sales Commission, Team Performance, Individual Performance. It is also available for immediate download and adjustment. So, changes can be made in the color, design, graphics or any other component to create a unique layout.

Project Management Implementation Management Chart Microsoft PDF
This slide project management implementation planning chart illustrating project area such as project management, project planning, status update, infrastructure etc that helps in over viewing tasks and estimating a project. Showcasing this set of slides titled Project Management Implementation Management Chart Microsoft PDF. The topics addressed in these templates are Retail, Finance, System. All the content presented in this PPT design is completely editable. Download it and make adjustments in color, background, font etc. as per your unique business setting.
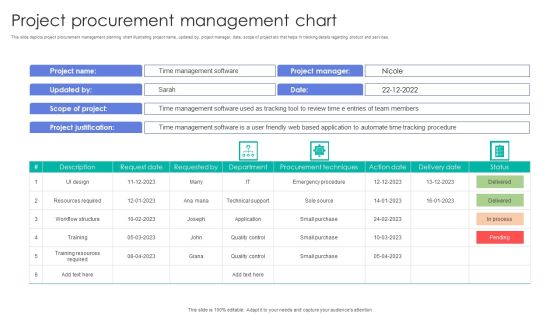
Project Procurement Management Chart Elements PDF
This slide depicts project procurement management planning chart illustrating project name, updated by, project manager, date, scope of project etc that helps in tracking details regarding product and services. Showcasing this set of slides titled Project Procurement Management Chart Elements PDF. The topics addressed in these templates are Design, Resources Required, Quality Control. All the content presented in this PPT design is completely editable. Download it and make adjustments in color, background, font etc. as per your unique business setting.

Lesson Learned Procedure Gantt Chart Topics PDF
This slide showcases the lesson learned process Gantt chart for projects, to conduct and save lessons learned. It also includes project name , date , future work , issues , etc. Showcasing this set of slides titled Lesson Learned Procedure Gantt Chart Topics PDF. The topics addressed in these templates are SEARCH TASKS, Gantt, Workload. All the content presented in this PPT design is completely editable. Download it and make adjustments in color, background, font etc. as per your unique business setting.

Business Bar Graph Arrow Success PowerPoint Themes And PowerPoint Slides 0511
Microsoft PowerPoint Theme and Slide with a business chart/graph showing the decline of the financial money market
Dollar Gold Coin Hanging Finance PowerPoint Themes And PowerPoint Slides 0611
Microsoft PowerPoint Theme and Slide with the dollar gold coin hanging on to growth chart market arrow
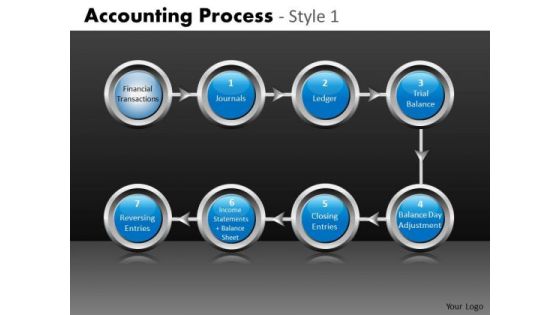
Editable Process Flow Charts 7 Stages PowerPoint Slides
Editable Process Flow Charts 7 Stages PowerPoint Slides-These high quality powerpoint pre-designed slides and powerpoint templates have been carefully created by our professional team to help you impress your audience. All slides have been created and are 100% editable in powerpoint. Each and every property of any graphic - color, size, orientation, shading, outline etc. can be modified to help you build an effective powerpoint presentation. Any text can be entered at any point in the powerpoint template or slide. Simply DOWNLOAD, TYPE and PRESENT! These PowerPoint presentation slides can be used to represent themes relating to -

Digital Currency Trading Guide Five Year Roadmap Themes
We present our digital currency trading guide five year roadmap themes. This PowerPoint layout is easy to edit so you can change the font size, font type, color, and shape conveniently. In addition to this, the PowerPoint layout is Google Slides compatible, so you can share it with your audience and give them access to edit it. Therefore, download and save this well researched digital currency trading guide five year roadmap themes in different formats like PDF, PNG, and JPG to smoothly execute your business plan.
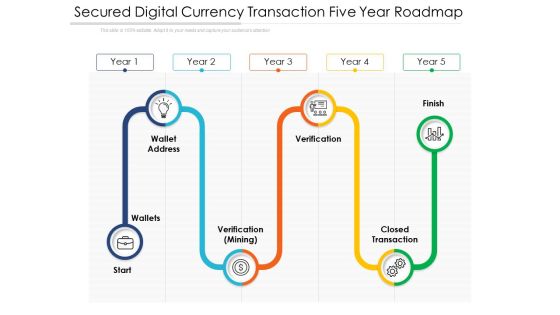
Secured Digital Currency Transaction Five Year Roadmap Themes
We present our secured digital currency transaction five year roadmap themes. This PowerPoint layout is easy to edit so you can change the font size, font type, color, and shape conveniently. In addition to this, the PowerPoint layout is Google Slides compatible, so you can share it with your audience and give them access to edit it. Therefore, download and save this well researched secured digital currency transaction five year roadmap themes in different formats like PDF, PNG, and JPG to smoothly execute your business plan.


 Continue with Email

 Home
Home


