Icons

Human Capital Metrics With Employee Turnover Rate Ppt File Mockup PDF
This graph or chart is linked to excel, and changes automatically based on data. Just left click on it and select Edit Data. Showcasing this set of slides titled Human Capital Metrics With Employee Turnover Rate Ppt File Mockup PDF. The topics addressed in these templates are Employee Turnover Rate, Turnover Rate Division, Turnover Rate Year, Over Year. All the content presented in this PPT design is completely editable. Download it and make adjustments in color, background, font etc. as per your unique business setting.
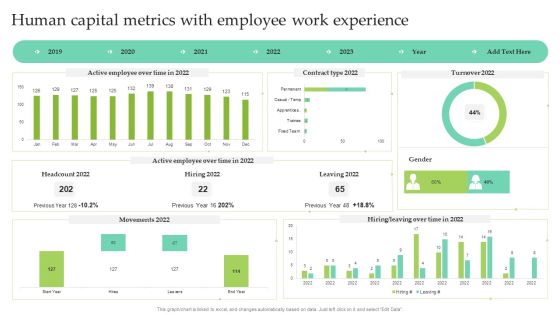
Human Capital Metrics With Employee Work Experience Ppt Show Images PDF
This graph or chart is linked to excel, and changes automatically based on data. Just left click on it and select Edit Data. Pitch your topic with ease and precision using this Human Capital Metrics With Employee Work Experience Ppt Show Images PDF. This layout presents information on Active Employee, Over Time, Contract Type 2022, Leaving 2022. It is also available for immediate download and adjustment. So, changes can be made in the color, design, graphics or any other component to create a unique layout.
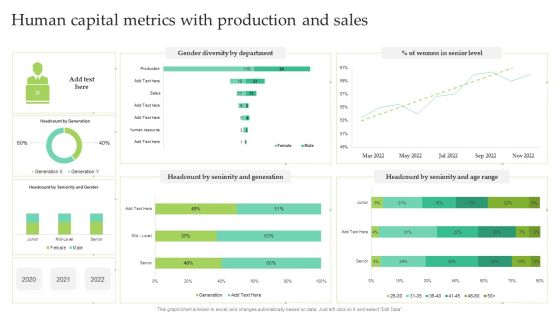
Human Capital Metrics With Production And Sales Ppt Infographic Template Summary PDF
This graph or chart is linked to excel, and changes automatically based on data. Just left click on it and select Edit Data. Showcasing this set of slides titled Human Capital Metrics With Production And Sales Ppt Infographic Template Summary PDF. The topics addressed in these templates are Women Senior Level, Gender Diversity Department, Seniority And Generation. All the content presented in this PPT design is completely editable. Download it and make adjustments in color, background, font etc. as per your unique business setting.

Architecture Engineering Planning Services Company EBITDA And Margin Guidelines PDF
This slide highlights the earnings before interest, taxes, depreciation, and amortization of the architecture company which showcases five year data through combination chart. This Architecture Engineering Planning Services Company EBITDA And Margin Guidelines PDF from Slidegeeks makes it easy to present information on your topic with precision. It provides customization options, so you can make changes to the colors, design, graphics, or any other component to create a unique layout. It is also available for immediate download, so you can begin using it right away. Slidegeeks has done good research to ensure that you have everything you need to make your presentation stand out. Make a name out there for a brilliant performance.

Architecture Engineering Planning Services Company Total Projects Completed In 2022 Formats PDF
This slide highlights the total projects completed by architecture company through pie chart. It includes data of residential single and multi family homes, commercial, public, interiors, small projects and heritage projects. Find a pre designed and impeccable Architecture Engineering Planning Services Company Total Projects Completed In 2022 Formats PDF. The templates can ace your presentation without additional effort. You can download these easy to edit presentation templates to make your presentation stand out from others. So, what are you waiting for Download the template from Slidegeeks today and give a unique touch to your presentation.
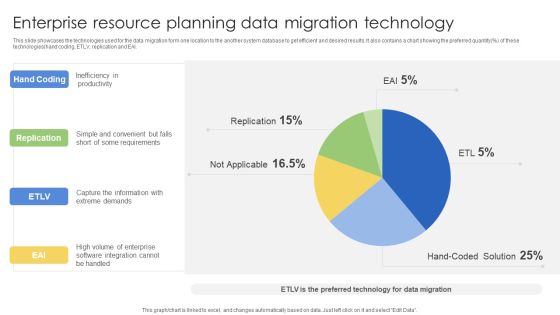
Enterprise Resource Planning Data Migration Technology Ppt Pictures Layout PDF
This slide showcases the technologies used for the data migration form one location to the another system database to get efficient and desired results. It also contains a chart showing the preferred quantity percent of these technologies hand coding, ETLV, replication and EAI. Showcasing this set of slides titled Enterprise Resource Planning Data Migration Technology Ppt Pictures Layout PDF. The topics addressed in these templates are Hand Coding, Replication, ETLV, EAI. All the content presented in this PPT design is completely editable. Download it and make adjustments in color, background, font etc. as per your unique business setting.

Software Development Project Weekly Status Update Summary Document Inspiration PDF
This slide represents a dashboard showing the weekly status of the software development projects of the IT department. It represents pie chart showing failed login rate, status of projects and aborted connects. Pitch your topic with ease and precision using this Software Development Project Weekly Status Update Summary Document Inspiration PDF. This layout presents information on High Failed, Login Rate, Abort Connects, Failed Login. It is also available for immediate download and adjustment. So, changes can be made in the color, design, graphics or any other component to create a unique layout.

How Much Funds Have We Raised Inbound Marketing Business Fundraising Elevator Guidelines PDF
Purpose of the following slide is to show the total amount of funds required by the organization , the provided pie chart displays the utilization of these funds. Want to ace your presentation in front of a live audience Our How Much Funds Have We Raised Inbound Marketing Business Fundraising Elevator Guidelines PDF can help you do that by engaging all the users towards you. Slidegeeks experts have put their efforts and expertise into creating these impeccable powerpoint presentations so that you can communicate your ideas clearly. Moreover, all the templates are customizable, and easy-to-edit and downloadable. Use these for both personal and commercial use.

Evaluation Of Risk Factor Influencing Sales Performance Inspiration PDF
This slide depicts the major factors that influences the sales performance of a company. It includes pie chart with weightage showing initial risks like shortage of raw material, increase in price. Pitch your topic with ease and precision using this Evaluation Of Risk Factor Influencing Sales Performance Inspiration PDF. This layout presents information on Production Cost, Customer Shift, Risk Influencing. It is also available for immediate download and adjustment. So, changes can be made in the color, design, graphics or any other component to create a unique layout.
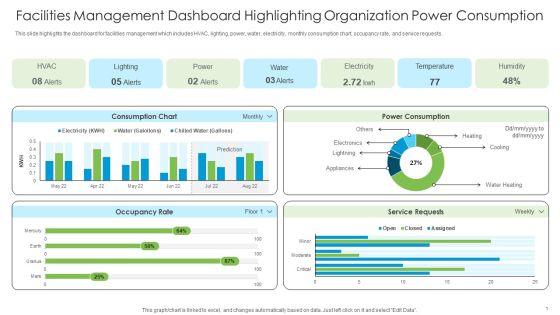
Facilities Management Dashboard Highlighting Organization Power Consumption Sample PDF
This slide highlights the dashboard for facilities management which includes HVAC, lighting, power, water, electricity, monthly consumption chart, occupancy rate, and service requests.From laying roadmaps to briefing everything in detail, our templates are perfect for you. You can set the stage with your presentation slides. All you have to do is download these easy-to-edit and customizable templates. Facilities Management Dashboard Highlighting Organization Power Consumption Sample PDF will help you deliver an outstanding performance that everyone would remember and praise you for. Do download this presentation today.

Brand Awareness Plan Dashboard Showing Digital Marketing Performance Sample PDF
This graph or chart is linked to excel, and changes automatically based on data. Just left click on it and select Edit Data. The best PPT templates are a great way to save time, energy, and resources. Slidegeeks have 100 percent editable powerpoint slides making them incredibly versatile. With these quality presentation templates, you can create a captivating and memorable presentation by combining visually appealing slides and effectively communicating your message. Download Brand Awareness Plan Dashboard Showing Digital Marketing Performance Sample PDF from Slidegeeks and deliver a wonderful presentation.

Brand Awareness Plan Product Marketing Dashboard For Pay Per Click Campaign Template PDF
This graph or chart is linked to excel, and changes automatically based on data. Just left click on it and select Edit Data. Get a simple yet stunning designed Brand Awareness Plan Product Marketing Dashboard For Pay Per Click Campaign Template PDF. It is the best one to establish the tone in your meetings. It is an excellent way to make your presentations highly effective. So, download this PPT today from Slidegeeks and see the positive impacts. Our easy-to-edit Brand Awareness Plan Product Marketing Dashboard For Pay Per Click Campaign Template PDF can be your go-to option for all upcoming conferences and meetings. So, what are you waiting for Grab this template today.

Brand Equity Valuation Of Top 10 IT Companies Ppt Portfolio Rules PDF
This slide showcase top 10 information technology companies brand value comparison chart understanding their position in market. It includes elements such as companies name, brand value, and key insights. Pitch your topic with ease and precision using this Brand Equity Valuation Of Top 10 IT Companies Ppt Portfolio Rules PDF. This layout presents information on Highest Market Value, Total Value, Brand Valuation. It is also available for immediate download and adjustment. So, changes can be made in the color, design, graphics or any other component to create a unique layout.

Facilities Management Dashboard Highlighting Organization Power Consumption Background PDF
This slide highlights the dashboard for facilities management which includes HVAC, lighting, power, water, electricity, monthly consumption chart, occupancy rate, and service requests. This Facilities Management Dashboard Highlighting Organization Power Consumption Background PDF from Slidegeeks makes it easy to present information on your topic with precision. It provides customization options, so you can make changes to the colors, design, graphics, or any other component to create a unique layout. It is also available for immediate download, so you can begin using it right away. Slidegeeks has done good research to ensure that you have everything you need to make your presentation stand out. Make a name out there for a brilliant performance.

Organizing Security Awareness Major Statistics Of Cyber Security Awareness Formats PDF
This graph or chart is linked to excel, and changes automatically based on data. Just left click on it and select Edit Data. Welcome to our selection of the Organizing Security Awareness Major Statistics Of Cyber Security Awareness Formats PDF. These are designed to help you showcase your creativity and bring your sphere to life. Planning and Innovation are essential for any business that is just starting out. This collection contains the designs that you need for your everyday presentations. All of our PowerPoints are 100 percent editable, so you can customize them to suit your needs. This multi-purpose template can be used in various situations. Grab these presentation templates today.

Financial Business Application Development Playbook Pictures PDF
If you are looking for a format to display your unique thoughts, then the professionally designed Financial Business Application Development Playbook Pictures PDF is the one for you. You can use it as a Google Slides template or a PowerPoint template. Incorporate impressive visuals, symbols, images, and other charts. Modify or reorganize the text boxes as you desire. Experiment with shade schemes and font pairings. Alter, share or cooperate with other people on your work. Download Financial Business Application Development Playbook Pictures PDF and find out how to give a successful presentation. Present a perfect display to your team and make your presentation unforgettable.

Car Types Used In Usa Stacked Percentage Graph Sample PDF
This slide shows car use percentage chart in USA to compare vehicle buying decisions. It includes types of cars and car use percentage. Pitch your topic with ease and precision using this Car Types Used In Usa Stacked Percentage Graph Sample PDF. This layout presents information on Limited Space In City, Less Parking Space, Easy To Commute. It is also available for immediate download and adjustment. So, changes can be made in the color, design, graphics or any other component to create a unique layout.

Insurance Policy Usage Stacked Percentage Graph Template PDF
This slide illustrates use of insurance policy types percentage chart in USA to determine total number of insurances taken. It includes cities and insurance policy percentage. Pitch your topic with ease and precision using this Insurance Policy Usage Stacked Percentage Graph Template PDF. This layout presents information on Motor Vehicle Policies, More Population, Migration Of People. It is also available for immediate download and adjustment. So, changes can be made in the color, design, graphics or any other component to create a unique layout.
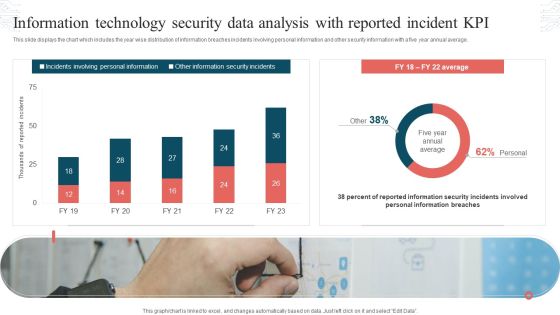
Information Technology Security Data Analysis With Reported Incident KPI Download PDF
This slide displays the chart which includes the year wise distribution of information breaches incidents involving personal information and other security information with a five year annual average. Showcasing this set of slides titled Information Technology Security Data Analysis With Reported Incident KPI Download PDF. The topics addressed in these templates are Incidents Involving, Personal Information, Other Information, Security Incidents. All the content presented in this PPT design is completely editable. Download it and make adjustments in color, background, font etc. as per your unique business setting.

Project Progress Dashboard With Timeline And Budget Mockup PDF
This slide covers the tasks to be given and their status whether they are completed or on hold , progressing and overdue. It also includes the task priority chart, budget and pending items with task timeline. Pitch your topic with ease and precision using this Project Progress Dashboard With Timeline And Budget Mockup PDF. This layout presents information on Task Timeline, Project Status, Pending Items. It is also available for immediate download and adjustment. So, changes can be made in the color, design, graphics or any other component to create a unique layout.
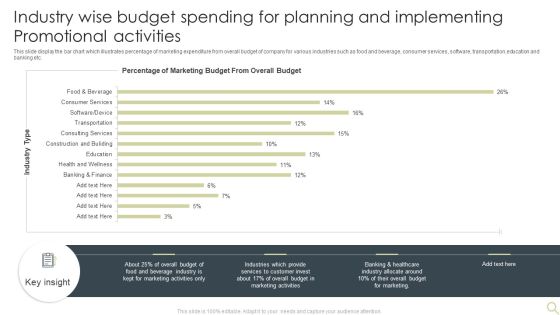
Industry Wise Budget Spending For Planning And Implementing Promotional Activities Introduction PDF
This slide display the bar chart which illustrates percentage of marketing expenditure from overall budget of company for various industries such as food and beverage, consumer services, software, transportation,education and banking etc. Showcasing this set of slides titled Industry Wise Budget Spending For Planning And Implementing Promotional Activities Introduction PDF. The topics addressed in these templates are Marketing, Beverage Industry, Budget. All the content presented in this PPT design is completely editable. Download it and make adjustments in color, background, font etc. as per your unique business setting.

Strategic FM Services Facilities Management Dashboard Highlighting Organization Power Consumption Brochure PDF
This slide highlights the dashboard for facilities management which includes HVAC, lighting, power, water, electricity, monthly consumption chart, occupancy rate, and service requests. Make sure to capture your audiences attention in your business displays with our gratis customizable Strategic FM Services Facilities Management Dashboard Highlighting Organization Power Consumption Brochure PDF. These are great for business strategies, office conferences, capital raising or task suggestions. If you desire to acquire more customers for your tech business and ensure they stay satisfied, create your own sales presentation with these plain slides.
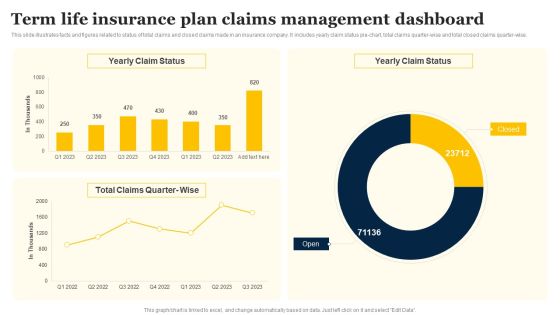
Term Life Insurance Plan Claims Management Dashboard Portrait PDF
This slide illustrates facts and figures related to status of total claims and closed claims made in an insurance company. It includes yearly claim status pie-chart, total claims quarter-wise and total closed claims quarter-wise. Pitch your topic with ease and precision using this Term Life Insurance Plan Claims Management Dashboard Portrait PDF. This layout presents information on Yearly Claim Status, Total Claims, Quarter Wise. It is also available for immediate download and adjustment. So, changes can be made in the color, design, graphics or any other component to create a unique layout.

Monetary Planning And Evaluation Guide Forecasting The Revenue And Growth Of Organization Ppt Slides Outline PDF
The following slide outlines a comprehensive chart highlighting the estimated company revenue. The forecasted revenue is shown from 2023 to 2025 with key highlights. Make sure to capture your audiences attention in your business displays with our gratis customizable Monetary Planning And Evaluation Guide Forecasting The Revenue And Growth Of Organization Ppt Slides Outline PDF. These are great for business strategies, office conferences, capital raising or task suggestions. If you desire to acquire more customers for your tech business and ensure they stay satisfied, create your own sales presentation with these plain slides.

Companys Promotional Budget Analysis Client Acquisition Techniques To Boost Sales Guidelines PDF
The slides shows promotional budget breakup traditional advertising, digital marketing, other promotional activities of the company by month. Further, it represents the annual budget breakup through a pie chart. Boost your pitch with our creative Companys Promotional Budget Analysis Client Acquisition Techniques To Boost Sales Guidelines PDF. Deliver an awe-inspiring pitch that will mesmerize everyone. Using these presentation templates you will surely catch everyones attention. You can browse the ppts collection on our website. We have researchers who are experts at creating the right content for the templates. So you do not have to invest time in any additional work. Just grab the template now and use them.

Monthly KPI Work Performance Monitoring By Category Microsoft PDF
This slide shows the monthly key performance indicators report on various categories with a line chart . the categories includes financial, customer success , new business activities, HR and other metrics. Pitch your topic with ease and precision using this Monthly KPI Work Performance Monitoring By Category Microsoft PDF. This layout presents information on Metrics, Financial, Customer Success. It is also available for immediate download and adjustment. So, changes can be made in the color, design, graphics or any other component to create a unique layout.

Actual Vs Budgeted Gross And Net Revenue Comparison Report Sample PDF
This slide covers a profitability dashboard for analyzing gross margin and net profit metrics. It includes evaluation charts such as actual vs budgeted gross profit, net profit, trends, variance analysis table for the selected month and year. Pitch your topic with ease and precision using this Actual Vs Budgeted Gross And Net Revenue Comparison Report Sample PDF. This layout presents information on Gross Profit, Net Profit, Budget. It is also available for immediate download and adjustment. So, changes can be made in the color, design, graphics or any other component to create a unique layout.

Support Center Report On Customer Executive Performance Evaluation Background PDF
This slide signifies the call center KPI dashboard on customer support executive performance. It includes daily and weekly volume, CSAT score, pie chart on service level agreement. Pitch your topic with ease and precision using this Support Center Report On Customer Executive Performance Evaluation Background PDF. This layout presents information on Weekly Call Volume, Response Time, Service Level Agreement. It is also available for immediate download and adjustment. So, changes can be made in the color, design, graphics or any other component to create a unique layout.

Support Center Report On Customer Support Executive Performance Sample PDF
This slide signifies the pie chart on performance of customer support executive in call centre. It includes the name of various employee and the strategies they implemented for there achievement. Showcasing this set of slides titled Support Center Report On Customer Support Executive Performance Sample PDF. The topics addressed in these templates are Use Of Personalise Telecalling, Provide Good Customer Service, Provide Offers And Discounts. All the content presented in this PPT design is completely editable. Download it and make adjustments in color, background, font etc. as per your unique business setting.

Support Center Report With Activity And Statistics Guidelines PDF
This slide signifies the report on call centre with activities and statistics. It includes agent activity sum, pie chart based on group calls, abandonment rate, service level and average queue time. Pitch your topic with ease and precision using this Support Center Report With Activity And Statistics Guidelines PDF. This layout presents information on Support Center Report, Activity And Statistics. It is also available for immediate download and adjustment. So, changes can be made in the color, design, graphics or any other component to create a unique layout.

Prevention Of Information Key Statistics Showing The Impact Of Security Awareness Infographics PDF
This graph or chart is linked to excel, and changes automatically based on data. Just left click on it and select Edit Data. This modern and well-arranged Prevention Of Information Key Statistics Showing The Impact Of Security Awareness Infographics PDF provides lots of creative possibilities. It is very simple to customize and edit with the Powerpoint Software. Just drag and drop your pictures into the shapes. All facets of this template can be edited with Powerpoint, no extra software is necessary. Add your own material, put your images in the places assigned for them, adjust the colors, and then you can show your slides to the world, with an animated slide included.

360 Degree Marketing Strategy Budget With Deadline Topics PDF
This slide covers different marketing channels and their budget. The purpose of this template is to monitor business performance and create financial stability. It includes elements such as marketing channel, channel budget and allocation pie chart, assigned person and deadline. Showcasing this set of slides titled 360 Degree Marketing Strategy Budget With Deadline Topics PDF. The topics addressed in these templates are Marketing Channel Tactics, Budget Channel, Assigned Person. All the content presented in this PPT design is completely editable. Download it and make adjustments in color, background, font etc. as per your unique business setting.

Recruitment Requisition Departmental Performance Report Sheet Demonstration PDF
Following slide illustrates hiring performance chart utilized by organizations to identify planned and spent budget along with time to fill requisitions. This slide provides data regarding various departments, planned and filled requisitions, salary budget, average days, etc. Pitch your topic with ease and precision using this Recruitment Requisition Departmental Performance Report Sheet Demonstration PDF. This layout presents information on Recruitment Requisition, Departmental Performance, Report Sheet. It is also available for immediate download and adjustment. So, changes can be made in the color, design, graphics or any other component to create a unique layout.

Improving Corporate Performance Sales Opportunity Monitoring Dashboard Portrait PDF
This graph or chart is linked to excel, and changes automatically based on data. Just left click on it and select Edit Data. Welcome to our selection of the Improving Corporate Performance Sales Opportunity Monitoring Dashboard Portrait PDF. These are designed to help you showcase your creativity and bring your sphere to life. Planning and Innovation are essential for any business that is just starting out. This collection contains the designs that you need for your everyday presentations. All of our PowerPoints are 100 percent editable, so you can customize them to suit your needs. This multi-purpose template can be used in various situations. Grab these presentation templates today.

Product And Services Promotion Major Goals Of Social Media Marketing Slides PDF
This graph or chart is linked to excel, and changes automatically based on data. Just left click on it and select Edit Data. From laying roadmaps to briefing everything in detail, our templates are perfect for you. You can set the stage with your presentation slides. All you have to do is download these easy-to-edit and customizable templates. Product And Services Promotion Major Goals Of Social Media Marketing Slides PDF will help you deliver an outstanding performance that everyone would remember and praise you for. Do download this presentation today.

Product And Services Promotion Marketing Performance Dashboard With Advertisement Graphics PDF
This graph or chart is linked to excel, and changes automatically based on data. Just left click on it and select Edit Data. Slidegeeks is here to make your presentations a breeze with Product And Services Promotion Marketing Performance Dashboard With Advertisement Graphics PDF With our easy-to-use and customizable templates, you can focus on delivering your ideas rather than worrying about formatting. With a variety of designs to choose from, youre sure to find one that suits your needs. And with animations and unique photos, illustrations, and fonts, you can make your presentation pop. So whether youre giving a sales pitch or presenting to the board, make sure to check out Slidegeeks first.

Product Marketing And Awareness Programs Major Goals Of Social Media Marketing Mockup PDF
This graph or chart is linked to excel, and changes automatically based on data. Just left click on it and select Edit Data. Find a pre-designed and impeccable Product Marketing And Awareness Programs Major Goals Of Social Media Marketing Mockup PDF. The templates can ace your presentation without additional effort. You can download these easy-to-edit presentation templates to make your presentation stand out from others. So, what are you waiting for Download the template from Slidegeeks today and give a unique touch to your presentation.
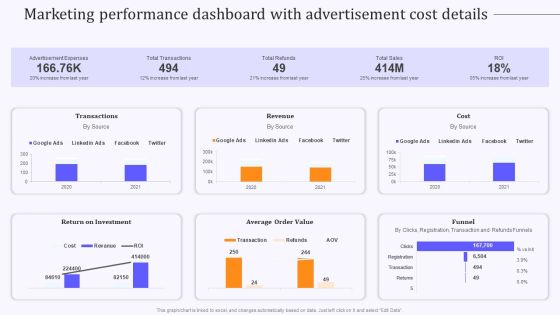
Product Marketing And Awareness Programs Marketing Performance Dashboard Information PDF
This graph or chart is linked to excel, and changes automatically based on data. Just left click on it and select Edit Data. Slidegeeks is one of the best resources for PowerPoint templates. You can download easily and regulate Product Marketing And Awareness Programs Marketing Performance Dashboard Information PDF for your personal presentations from our wonderful collection. A few clicks is all it takes to discover and get the most relevant and appropriate templates. Use our Templates to add a unique zing and appeal to your presentation and meetings. All the slides are easy to edit and you can use them even for advertisement purposes.
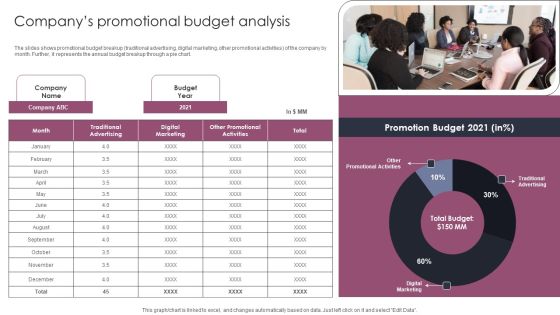
Companys Promotional Budget Analysis Stages To Develop Demand Generation Tactics Pictures PDF
The slides shows promotional budget breakup traditional advertising, digital marketing, other promotional activities of the company by month. Further, it represents the annual budget breakup through a pie chart. Slidegeeks is one of the best resources for PowerPoint templates. You can download easily and regulate Companys Promotional Budget Analysis Stages To Develop Demand Generation Tactics Pictures PDF for your personal presentations from our wonderful collection. A few clicks is all it takes to discover and get the most relevant and appropriate templates. Use our Templates to add a unique zing and appeal to your presentation and meetings. All the slides are easy to edit and you can use them even for advertisement purposes.
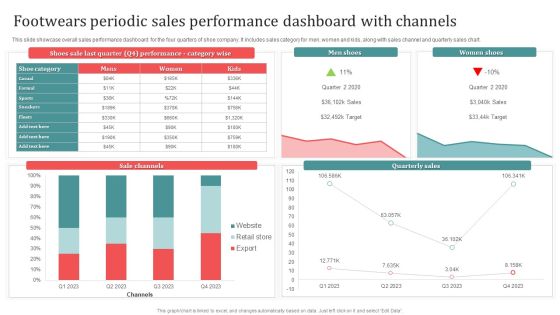
Footwears Periodic Sales Performance Dashboard With Channels Download PDF
This slide showcase overall sales performance dashboard for the four quarters of shoe company. It includes sales category for men, women and kids, along with sales channel and quarterly sales chart. Showcasing this set of slides titled Footwears Periodic Sales Performance Dashboard With Channels Download PDF. The topics addressed in these templates are Men Shoes, Women Shoes, Sale Channels. All the content presented in this PPT design is completely editable. Download it and make adjustments in color, background, font etc. as per your unique business setting.

Product Marketing For Generating Product Marketing Dashboard With Sales Trend Designs PDF
This graph or chart is linked to excel, and changes automatically based on data. Just left click on it and select Edit Data. From laying roadmaps to briefing everything in detail, our templates are perfect for you. You can set the stage with your presentation slides. All you have to do is download these easy-to-edit and customizable templates. Product Marketing For Generating Product Marketing Dashboard With Sales Trend Designs PDF will help you deliver an outstanding performance that everyone would remember and praise you for. Do download this presentation today.

Implementing Digital Marketing Leading Social Media Platforms Used By Retailers In 2022 Structure PDF
This graph or chart is linked to excel, and changes automatically based on data. Just left click on it and select Edit Data. From laying roadmaps to briefing everything in detail, our templates are perfect for you. You can set the stage with your presentation slides. All you have to do is download these easy-to-edit and customizable templates. Implementing Digital Marketing Leading Social Media Platforms Used By Retailers In 2022 Structure PDF will help you deliver an outstanding performance that everyone would remember and praise you for. Do download this presentation today.

Engaging Employees Strategic Selecting Best Method To Collect Employee Feedback Formats PDF
This slide showcases why surveys are the best method to collect employee feedback. It includes elements such as pie chart showing best method used by companies to collect employee feedback and why surveys are best.Boost your pitch with our creative Engaging Employees Strategic Selecting Best Method To Collect Employee Feedback Formats PDF. Deliver an awe-inspiring pitch that will mesmerize everyone. Using these presentation templates you will surely catch everyones attention. You can browse the ppts collection on our website. We have researchers who are experts at creating the right content for the templates. So you dont have to invest time in any additional work. Just grab the template now and use them.

Comprehensive Guide For Launch Sales By Lead Source Performance Indicator Inspiration PDF
This graph or chart is linked to excel, and changes automatically based on data. Just left click on it and select Edit Data. The Comprehensive Guide For Launch Sales By Lead Source Performance Indicator Inspiration PDF is a compilation of the most recent design trends as a series of slides. It is suitable for any subject or industry presentation, containing attractive visuals and photo spots for businesses to clearly express their messages. This template contains a variety of slides for the user to input data, such as structures to contrast two elements, bullet points, and slides for written information. Slidegeeks is prepared to create an impression.

Comprehensive Guide To Enhance Competitive Landscape Analysis Based On Market Ideas PDF
Mentioned pie chart illustrates companys global and domestic market share. Company A has a larger market share in both the global and domestic markets. If your project calls for a presentation, then Slidegeeks is your go-to partner because we have professionally designed, easy-to-edit templates that are perfect for any presentation. After downloading, you can easily edit Comprehensive Guide To Enhance Competitive Landscape Analysis Based On Market Ideas PDF and make the changes accordingly. You can rearrange slides or fill them with different images. Check out all the handy templates.
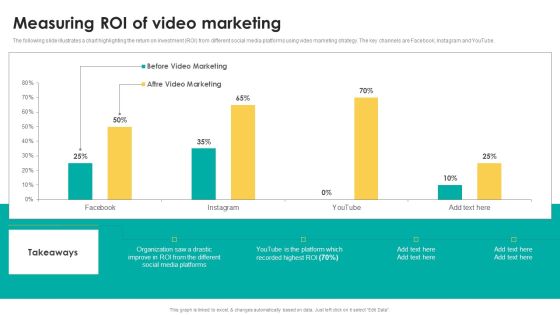
Measuring Roi Of Video Marketing Download PDF
The following slide illustrates a chart highlighting the return on investment ROI from different social media platforms using video marketing strategy. The key channels are Facebook, Instagram and YouTube. From laying roadmaps to briefing everything in detail, our templates are perfect for you. You can set the stage with your presentation slides. All you have to do is download these easy to edit and customizable templates. Measuring Roi Of Video Marketing Download PDF will help you deliver an outstanding performance that everyone would remember and praise you for. Do download this presentation today.

Dashboard To Monitor Business Process Outsourcing Performance Based On Industry Standards Infographics PDF
This slide depicts the dashboard to monitor performance of business process outsourcing enterprise with reference to industry standards. The key elements covered in the slide are total calls, average answer speed, abandon rate, average calls per minute and agent performanc. Showcasing this set of slides titled Dashboard To Monitor Business Process Outsourcing Performance Based On Industry Standards Infographics PDF. The topics addressed in these templates are Industry Standards, Chart By Agent, Call Abandon Rate, Total Calls. All the content presented in this PPT design is completely editable. Download it and make adjustments in color, background, font etc. as per your unique business setting.
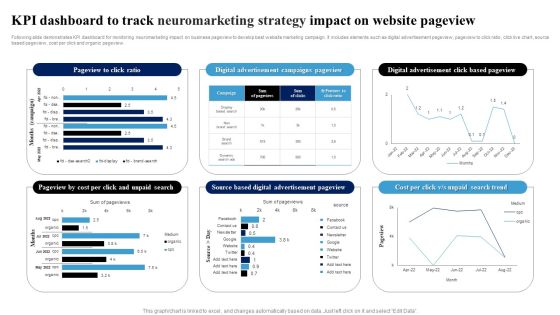
KPI Dashboard To Track Neuromarketing Strategy Impact On Website Pageview Ppt Model Templates PDF
Following slide demonstrates KPI dashboard for monitoring neuromarketing impact on business pageview to develop best website marketing campaign. It includes elements such as digital advertisement pageview, pageview to click ratio, click live chart, source based pageview, cost per click and organic pageview. Showcasing this set of slides titled KPI Dashboard To Track Neuromarketing Strategy Impact On Website Pageview Ppt Model Templates PDF. The topics addressed in these templates are Digital Advertisement, Campaigns Pageview, Click Based Pageview. All the content presented in this PPT design is completely editable. Download it and make adjustments in color, background, font etc. as per your unique business setting.
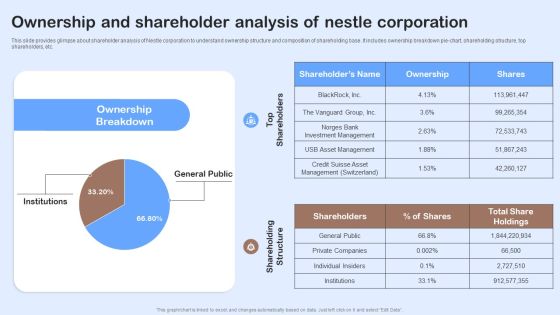
Nestle Performance Management Report Ownership And Shareholder Analysis Of Nestle Brochure PDF
This slide provides glimpse about shareholder analysis of Nestle corporation to understand ownership structure and composition of shareholding base. It includes ownership breakdown pie-chart, shareholding structure, top shareholders, etc. Boost your pitch with our creative Nestle Performance Management Report Ownership And Shareholder Analysis Of Nestle Brochure PDF. Deliver an awe-inspiring pitch that will mesmerize everyone. Using these presentation templates you will surely catch everyones attention. You can browse the ppts collection on our website. We have researchers who are experts at creating the right content for the templates. So you do not have to invest time in any additional work. Just grab the template now and use them.
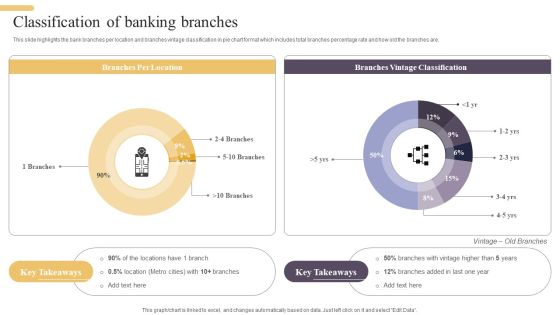
Improving Digital Banking Operations And Services Framework Classification Of Banking Branches Brochure PDF
This slide highlights the bank branches per location and branches vintage classification in pie chart format which includes total branches percentage rate and how old the branches are. Take your projects to the next level with our ultimate collection of Improving Digital Banking Operations And Services Framework Classification Of Banking Branches Brochure PDF. Slidegeeks has designed a range of layouts that are perfect for representing task or activity duration, keeping track of all your deadlines at a glance. Tailor these designs to your exact needs and give them a truly corporate look with your own brand colors they will make your projects stand out from the rest.
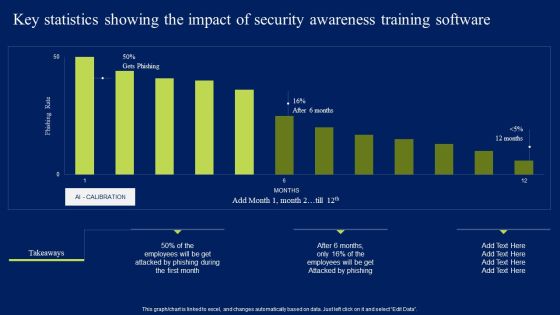
Key Statistics Showing The Impact Of Security Awareness Training Software Elements PDF
This graph or chart is linked to excel, and changes automatically based on data. Just left click on it and select Edit Data. Slidegeeks is one of the best resources for PowerPoint templates. You can download easily and regulate Key Statistics Showing The Impact Of Security Awareness Training Software Elements PDF for your personal presentations from our wonderful collection. A few clicks is all it takes to discover and get the most relevant and appropriate templates. Use our Templates to add a unique zing and appeal to your presentation and meetings. All the slides are easy to edit and you can use them even for advertisement purposes.
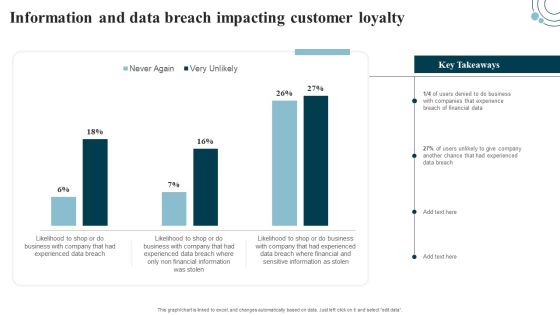
Developing IT Security Strategy Information And Data Breach Impacting Customer Loyalty Template PDF
This graph or chart is linked to excel, and changes automatically based on data. Just left click on it and select edit data. Get a simple yet stunning designed Developing IT Security Strategy Information And Data Breach Impacting Customer Loyalty Template PDF. It is the best one to establish the tone in your meetings. It is an excellent way to make your presentations highly effective. So, download this PPT today from Slidegeeks and see the positive impacts. Our easy-to-edit Developing IT Security Strategy Information And Data Breach Impacting Customer Loyalty Template PDF can be your go-to option for all upcoming conferences and meetings. So, what are you waiting for Grab this template today.
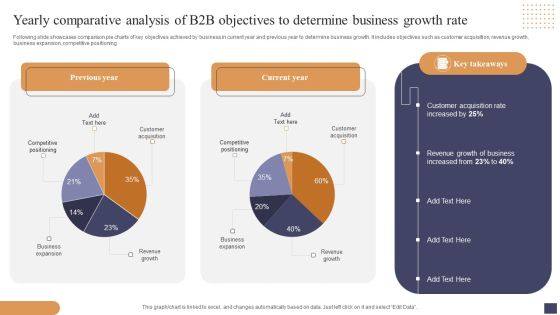
Yearly Comparative Analysis Of B2b Objectives To Determine Business Growth Rate Mockup PDF
Following slide showcases comparison pie charts of key objectives achieved by business in current year and previous year to determine business growth. It includes objectives such as customer acquisition, revenue growth, business expansion, competitive positioning. Showcasing this set of slides titled Yearly Comparative Analysis Of B2b Objectives To Determine Business Growth Rate Mockup PDF. The topics addressed in these templates are Customer Acquisition, Revenue Growth Business, Business Expansion. All the content presented in this PPT design is completely editable. Download it and make adjustments in color, background, font etc. as per your unique business setting.
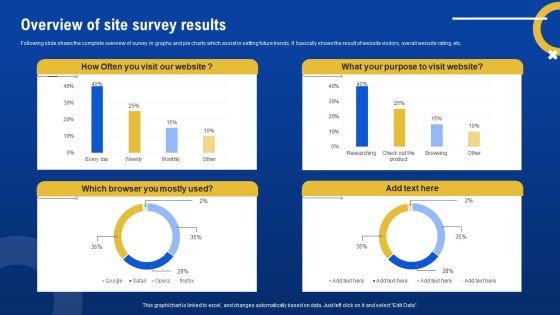
Overview Of Site Survey Results Survey SS
Following slide shows the complete overview of survey in graphs and pie charts which assist in setting future trends. It basically shows the result of website visitors, overall website rating, etc. Pitch your topic with ease and precision using this Overview Of Site Survey Results Survey SS. This layout presents information on Overview, Site Survey Results. It is also available for immediate download and adjustment. So, changes can be made in the color, design, graphics or any other component to create a unique layout.

Clustered Column Comprehensive Plan For IT And Business Integration Brochure PDF
If you are looking for a format to display your unique thoughts, then the professionally designed Clustered Column Comprehensive Plan For IT And Business Integration Brochure PDF is the one for you. You can use it as a Google Slides template or a PowerPoint template. Incorporate impressive visuals, symbols, images, and other charts. Modify or reorganize the text boxes as you desire. Experiment with shade schemes and font pairings. Alter, share or cooperate with other people on your work. Download Clustered Column Comprehensive Plan For IT And Business Integration Brochure PDF and find out how to give a successful presentation. Present a perfect display to your team and make your presentation unforgettable.

Robotic Automation In Workplace Top Industrial Robot Manufacturing Companies Ideas PDF
If you are looking for a format to display your unique thoughts, then the professionally designed Robotic Automation In Workplace Top Industrial Robot Manufacturing Companies Ideas PDF is the one for you. You can use it as a Google Slides template or a PowerPoint template. Incorporate impressive visuals, symbols, images, and other charts. Modify or reorganize the text boxes as you desire. Experiment with shade schemes and font pairings. Alter, share or cooperate with other people on your work. Download Robotic Automation In Workplace Top Industrial Robot Manufacturing Companies Ideas PDF and find out how to give a successful presentation. Present a perfect display to your team and make your presentation unforgettable.
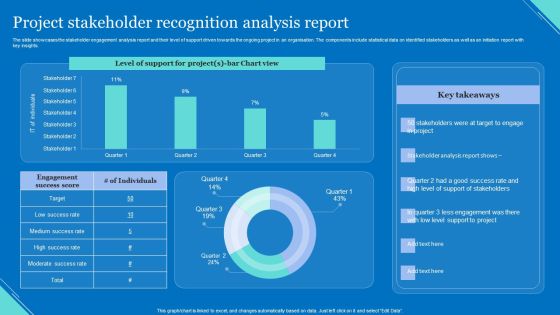
Project Stakeholder Recognition Analysis Report Elements PDF
The slide showcases the stakeholder engagement analysis report and their level of support driven towards the ongoing project in an organisation. The components include statistical data on identified stakeholders as well as an initiation report with key insights. Showcasing this set of slides titled Project Stakeholder Recognition Analysis Report Elements PDF. The topics addressed in these templates are Level Support, Chart View, Support Stakeholders. All the content presented in this PPT design is completely editable. Download it and make adjustments in color, background, font etc. as per your unique business setting.
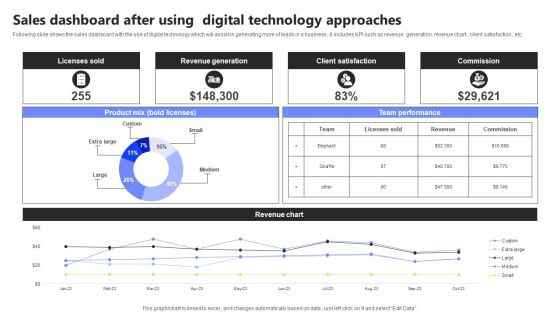
Sales Dashboard After Using Digital Technology Approaches Infographics PDF
Following slide shows the sales dashboard with the use of digital technology which will assist in generating more of leads in a business . It includes KPI such as revenue generation, revenue chart , client satisfaction , etc. Showcasing this set of slides titled Sales Dashboard After Using Digital Technology Approaches Infographics PDF. The topics addressed in these templates are Licenses Sold, Revenue Generation, Client Satisfaction. All the content presented in this PPT design is completely editable. Download it and make adjustments in color, background, font etc. as per your unique business setting.
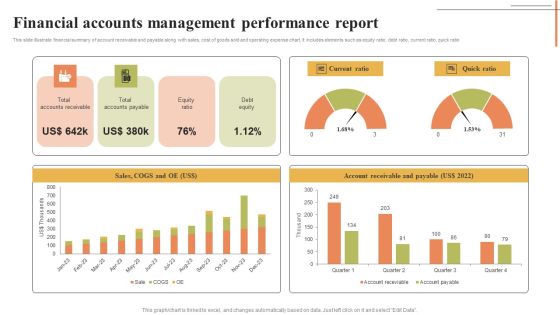
Financial Accounts Management Performance Report Mockup PDF
This slide illustrate financial summary of account receivable and payable along with sales, cost of goods sold and operating expense chart. It includes elements such as equity ratio, debt ratio, current ratio, quick ratio. Showcasing this set of slides titled Financial Accounts Management Performance Report Mockup PDF. The topics addressed in these templates are Current Ratio, Quick Ratio, Account Receivable Payable. All the content presented in this PPT design is completely editable. Download it and make adjustments in color, background, font etc. as per your unique business setting.
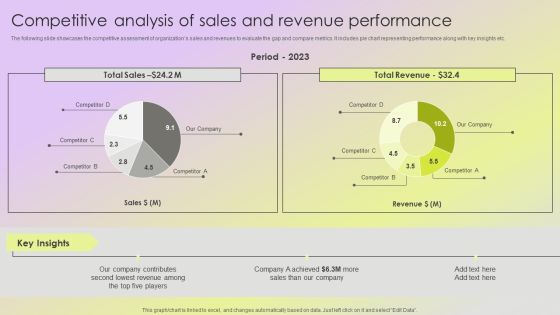
Mitigating Sales Risks With Strategic Action Planning Competitive Analysis Of Sales And Revenue Performance Slides PDF
The following slide showcases the competitive assessment of organizations sales and revenues to evaluate the gap and compare metrics. It includes pie chart representing performance along with key insights etc. Find a pre designed and impeccable Mitigating Sales Risks With Strategic Action Planning Competitive Analysis Of Sales And Revenue Performance Slides PDF. The templates can ace your presentation without additional effort. You can download these easy to edit presentation templates to make your presentation stand out from others. So, what are you waiting for Download the template from Slidegeeks today and give a unique touch to your presentation.

Competitive Analysis Of Sales And Revenue Performance Elements PDF
The following slide showcases the competitive assessment of organizations sales and revenues to evaluate the gap and compare metrics. It includes pie chart representing performance along with key insights etc. Take your projects to the next level with our ultimate collection of Competitive Analysis Of Sales And Revenue Performance Elements PDF. Slidegeeks has designed a range of layouts that are perfect for representing task or activity duration, keeping track of all your deadlines at a glance. Tailor these designs to your exact needs and give them a truly corporate look with your own brand colors they will make your projects stand out from the rest.
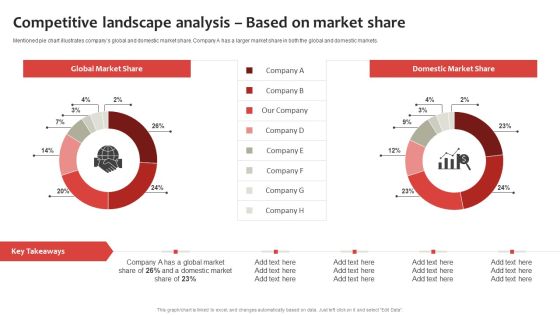
Strategic Plan To Establish And Promote Brand Awareness Competitive Landscape Analysis Based Mockup PDF
Mentioned pie chart illustrates companys global and domestic market share. Company A has a larger market share in both the global and domestic markets. Boost your pitch with our creative Strategic Plan To Establish And Promote Brand Awareness Campaign Sessions And Conversion Structure PDF. Deliver an awe-inspiring pitch that will mesmerize everyone. Using these presentation templates you will surely catch everyones attention. You can browse the ppts collection on our website. We have researchers who are experts at creating the right content for the templates. So you do not have to invest time in any additional work. Just grab the template now and use them.

Competitive Analysis Of Sales And Revenue Performance Designs PDF
The following slide showcases the competitive assessment of organizations sales and revenues to evaluate the gap and compare metrics. It includes pie chart representing performance along with key insights etc. Take your projects to the next level with our ultimate collection of Competitive Analysis Of Sales And Revenue Performance Designs PDF. Slidegeeks has designed a range of layouts that are perfect for representing task or activity duration, keeping track of all your deadlines at a glance. Tailor these designs to your exact needs and give them a truly corporate look with your own brand colors they will make your projects stand out from the rest.

Competitive Analysis Of Sales And Revenue Performance Information PDF
The following slide showcases the competitive assessment of organizations sales and revenues to evaluate the gap and compare metrics. It includes pie chart representing performance along with key insights etc. Slidegeeks is one of the best resources for PowerPoint templates. You can download easily and regulate Competitive Analysis Of Sales And Revenue Performance Information PDF for your personal presentations from our wonderful collection. A few clicks is all it takes to discover and get the most relevant and appropriate templates. Use our Templates to add a unique zing and appeal to your presentation and meetings. All the slides are easy to edit and you can use them even for advertisement purposes.
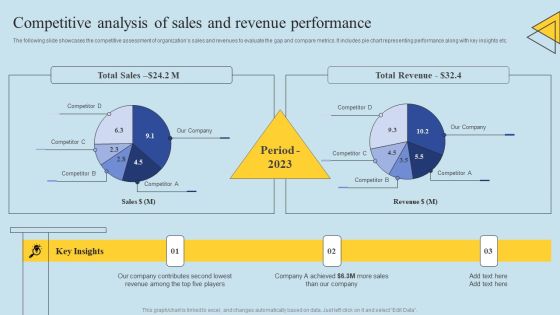
Determining Risks In Sales Administration Procedure Competitive Analysis Of Sales And Revenue Introduction PDF
The following slide showcases the competitive assessment of organizations sales and revenues to evaluate the gap and compare metrics. It includes pie chart representing performance along with key insights etc. Make sure to capture your audiences attention in your business displays with our gratis customizable Determining Risks In Sales Administration Procedure Competitive Analysis Of Sales And Revenue Introduction PDF. These are great for business strategies, office conferences, capital raising or task suggestions. If you desire to acquire more customers for your tech business and ensure they stay satisfied, create your own sales presentation with these plain slides.
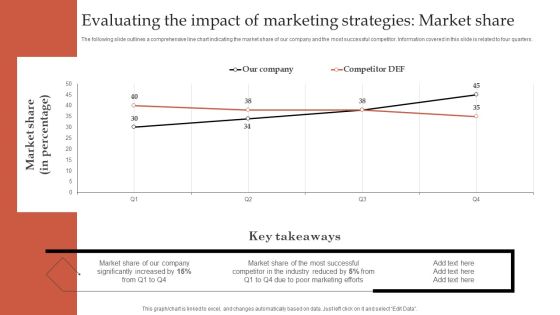
Formulating Robust Branding Strategies To Effectively Combat Evaluating The Impact Of Market Share Sample PDF
The following slide outlines a comprehensive line chart indicating the market share of our company and the most successful competitor. Information covered in this slide is related to four quarters. Boost your pitch with our creative Formulating Robust Branding Strategies To Effectively Combat Evaluating The Impact Of Market Share Sample PDF. Deliver an awe-inspiring pitch that will mesmerize everyone. Using these presentation templates you will surely catch everyones attention. You can browse the ppts collection on our website. We have researchers who are experts at creating the right content for the templates. So you do not have to invest time in any additional work. Just grab the template now and use them.
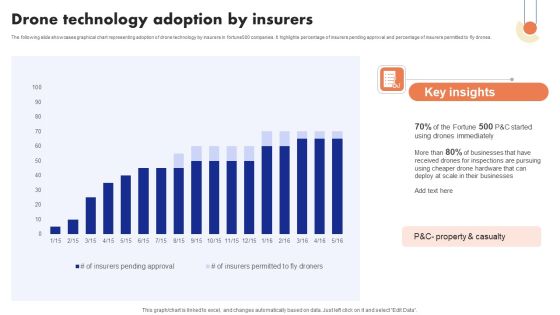
Implementation Of Digital Advancement Techniques Drone Technology Adoption Ideas PDF
The following slide showcases graphical chart representing adoption of drone technology by insurers in fortune500 companies. It highlights percentage of insurers pending approval and percentage of insurers permitted to fly drones. Slidegeeks is one of the best resources for PowerPoint templates. You can download easily and regulate Implementation Of Digital Advancement Techniques Drone Technology Adoption Ideas PDF for your personal presentations from our wonderful collection. A few clicks is all it takes to discover and get the most relevant and appropriate templates. Use our Templates to add a unique zing and appeal to your presentation and meetings. All the slides are easy to edit and you can use them even for advertisement purposes.

Implementation Of Digital Advancement Techniques Efficiency Gains Using Drones Pictures PDF
The following slide showcases graphical chart representing efficiency of using drone technology in insurance sector as compared to traditional methods for on site inspections. It highlights comparison of time taken in manual process and with drone. Want to ace your presentation in front of a live audience Our Implementation Of Digital Advancement Techniques Efficiency Gains Using Drones Pictures PDF can help you do that by engaging all the users towards you. Slidegeeks experts have put their efforts and expertise into creating these impeccable powerpoint presentations so that you can communicate your ideas clearly. Moreover, all the templates are customizable, and easy to edit and downloadable. Use these for both personal and commercial use.
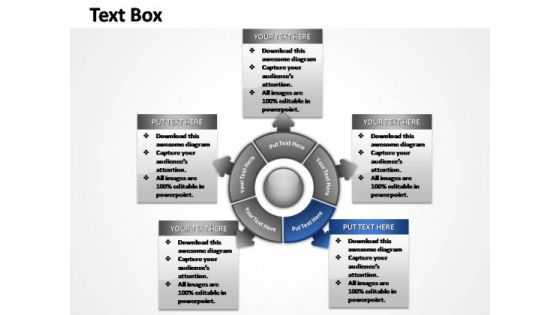
PowerPoint Slides Growth Steps Ppt Presentation
This chart visualize the of process steps, reoccurrences and components or of your company structure or product features.
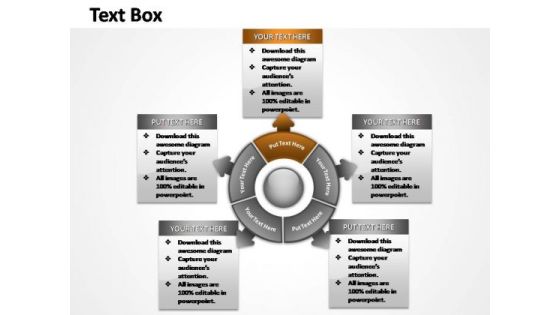
PowerPoint Slides Sales Steps Ppt Process
This chart visualize the of process steps, reoccurrences and components or of your company structure or product features.
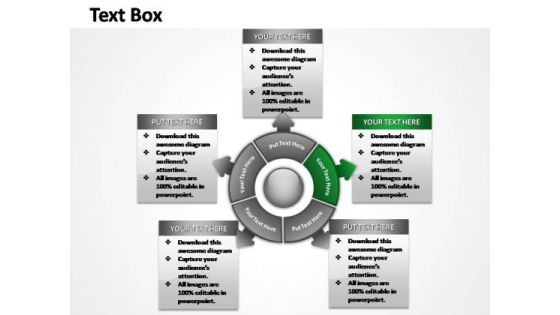
PowerPoint Slide Leadership Steps Ppt Slide
This chart visualize the of process steps, reoccurrences and components or of your company structure or product features.
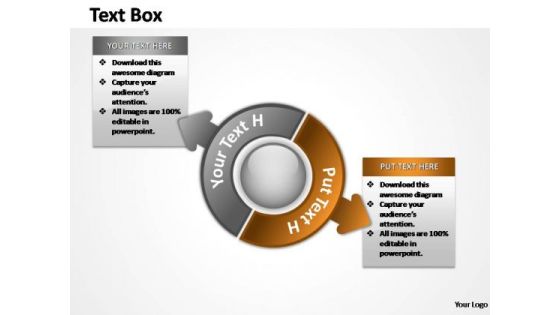
PowerPoint Slides Sales Steps Ppt Slide Designs
Circular business process chart assist you in creating your project roadmap with different ways, interim goals and project steps.
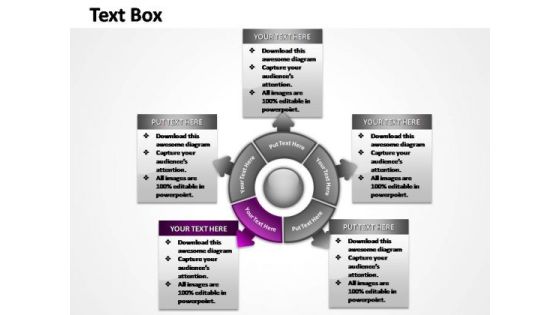
PowerPoint Template Business Steps Ppt Slides
This chart visualize the of process steps, reoccurrences and components or of your company structure or product features.
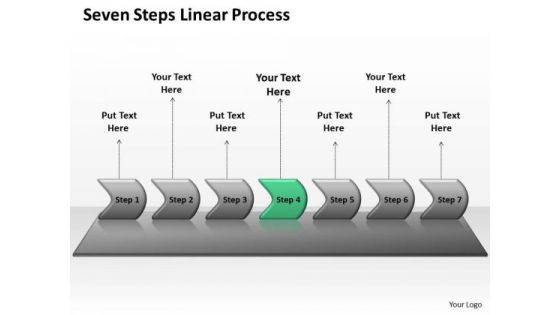
Sales Ppt Background Seven PowerPoint Slide Numbers Linear Process 5 Image
We present our sales PPT Background seven PowerPoint slide numbers linear Process 5 Image. Use our Arrows PowerPoint Templates because, but you have had fair success in helping victims fight the disease. Use our Business PowerPoint Templates because, Marketing Strategy Business Template:- Maximizing sales of your product is the intended destination. Use our Marketing PowerPoint Templates because, hence this diagram has the unique ability to drive home your ideas and show how they mesh to guarantee success. Use our Technology PowerPoint Templates because; illustrate these thoughts with this slide. Use our Process and flows PowerPoint Templates because, Use them to your advantage to priorities your ideas. Use these PowerPoint slides for presentations relating to Algorithm, arrow, arrow chart, business, chart, color, connection, development, diagram, direction, flow chart, flow diagram, flowchart, kind of diagram, linear, linear diagram, management, motion, organization, plan, process, process arrows, process chart, process diagram, process flow, program, sign, solution, strategy, symbol, technology. The prominent colors used in the PowerPoint template are Green, Gray, and White
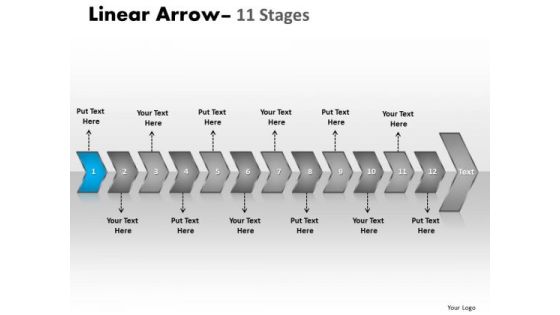
Business PowerPoint Template Chronological Representation Of 12 Arrows Ppt Image
We present our Business PowerPoint template chronological representation of 12 arrows ppt Image. Use our Arrows PowerPoint Templates because, Timelines Template: - Getting it done may not be enough. Use our Process and Flows PowerPoint Templates because, Will surely see the all making the grade. Use our Business PowerPoint Templates because, Marketing Strategy Business Template: - Maximizing sales of your product is the intended destination. Use our Marketing PowerPoint Templates because, Individual components well researched and understood in their place. Use our Shapes PowerPoint Templates because; educate your listeners on the means to keep it ticking over. Use these PowerPoint slides for presentations relating to Algorithm, Arrow, Chart, Block, Diagram, Business, Chart, Connection, Design, Development, Diagram, Direction, Element, Flow, Chart, Flow, Diagram, Flowchart, Graph, Kind, Of, Diagram, Linear, Diagram, Management, Model, Module, Motion, Organization, Plan, Process, Arrows, Process, Chart, Process, Diagram, Process, Flow, Program, Section, Segment, Set, Sign, Solution, Strategy, Symbol, Technology. The prominent colors used in the PowerPoint template are Blue, Gray, and Black
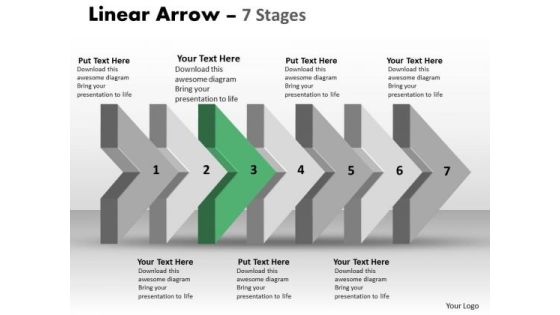
Ppt Template 3d Arrow Representing Constant Steps Working With Slide Numbers 4 Image
We present our PPT template 3d arrow representing constant steps working with slide numbers 4 Image. Use our Arrows PowerPoint Templates because, are the tools that helped most of us evolve. Use our Business PowerPoint Templates because, Marketing Strategy Business Template:- Maximizing sales of your product is the intended destination. Use our Marketing PowerPoint Templates because, have always been a source of inspiration for us all. Use our Success PowerPoint Templates because, explain the relevance of the different layers and stages in getting down to your core competence, ability and desired result. Use our Process and Flows PowerPoint Templates because, designed to help bullet-point your views and thoughts. Use these PowerPoint slides for presentations relating to Algorithm, Arrow, Arrow, Chart, Block, Diagram, Business, Chart, Connection, Design, Development, Diagram, Direction, Element, Flow, Flow, Chart, Flow, Diagram, Flowchart, Graph, Kind, Of, Diagram, Linear, Linear, Diagram, Management, Organization, Process, Process, Arrows, Process, Chart, Process, Diagram, Process, Flow, Program, Section, Segment, Set, Sign, Solution, Strategy, Symbol. The prominent colors used in the PowerPoint template are Green, Gray, and White

Ppt Template 3d Arrow Representing Constant Steps Working With Slide Numbers 5 Image
We present our PPT template 3d arrow representing constant steps working with slide numbers 5 Image. Use our Arrows PowerPoint Templates because, Brilliant ideas are your forte. Use our Business PowerPoint Templates because, Timelines Template: - Getting it done may not be enough. Use our Marketing PowerPoint Templates because, Weak Links & Chains: - Chain reactions and the element of teamwork add value to your efforts. Use our Success PowerPoint Templates because; demonstrate how they contribute to the larger melting pot. Use our Process and Flows PowerPoint Templates because, Our PowerPoint templates designed for your ideas to sell. Use these PowerPoint slides for presentations relating to Algorithm, Arrow, Arrow, Chart, Block, Diagram, Business, Chart, Connection, Design, Development, Diagram, Direction, Element, Flow, Flow, Chart, Flow, Diagram, Flowchart, Graph, Kind, Of, Diagram, Linear, Linear, Diagram, Management, Organization, Process, Process, Arrows, Process, Chart, Process, Diagram, Process, Flow, Program, Section, Segment, Set, Sign, Solution, Strategy, Symbol. The prominent colors used in the PowerPoint template are Blue, Gray, and White
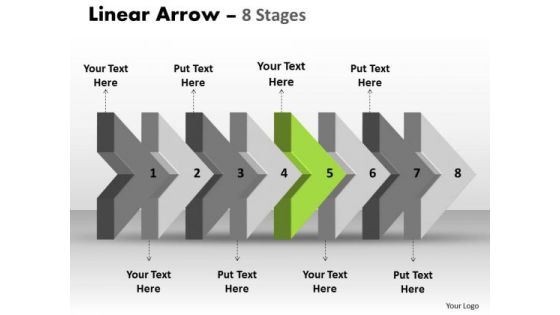
Ppt Template 3d Arrow Representing Eight Later Steps 6 Image
We present our PPT template 3d arrow representing eight later steps 6 Image. Use our Arrows PowerPoint Templates because, you have the plans ready for them to absorb and understand. Use our Business PowerPoint Templates because, Marketing Strategy Business Template: - Maximizing sales of your product is the intended destination. Use our Marketing PowerPoint Templates because; Use our template to illustrate what you say. Use our Success PowerPoint Templates because, Vision Ave Future St Template:- There was a vision of a desired destination and the best road to take to reach that goal. Use our Process and Flows PowerPoint Templates because; Use our creative template to lay down your views. Use these PowerPoint slides for presentations relating to Algorithm, Arrow, Arrow, Chart, Block, Diagram, Business, Chart, Connection, Design, Development, Diagram, Direction, Element, Flow, Flow, Chart, Flow, Diagram, Flowchart, Graph, Kind, Of, Diagram, Linear, Linear, Diagram, Management, Organization, Process, Process, Arrows, Process, Chart, Process, Diagram, Process, Flow, Program, Section, Segment, Set, Sign, Solution, Strategy, Symbol. The prominent colors used in the PowerPoint template are Green, Gray, and White
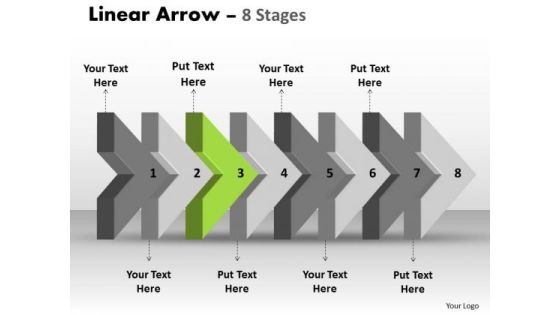
Ppt Template 3d Arrow Representing Eight Later Steps Time Management PowerPoint 4 Design
We present our PPT template 3d arrow representing eight later Steps time management PowerPoint 4 design. Use our Arrows PowerPoint Templates because, Demonstrate how they all combine to form the final product. Use our Business PowerPoint Templates because, Marketing Strategy Business Template:- Maximizing sales of your product is the intended destination. Use our Marketing PowerPoint Templates because; Highlight the key components of your entire manufacturing/ business process. Use our Success PowerPoint Templates because, illustrate the means to prevent or control them using our imaginative templates. Use our Process and Flows PowerPoint Templates because, Clarity of thought has been the key to your growth. Use these PowerPoint slides for presentations relating to Algorithm, Arrow, Arrow, Chart, Block, Diagram, Business, Chart, Connection, Design, Development, Diagram, Direction, Element, Flow, Flow, Chart, Flow, Diagram, Flowchart, Graph, Kind, Of, Diagram, Linear, Linear, Diagram, Management, Organization, Process, Process, Arrows, Process, Chart, Process, Diagram, Process, Flow, Program, Section, Segment, Set, Sign, Solution, Strategy, Symbol. The prominent colors used in the PowerPoint template are Green, Gray, and White
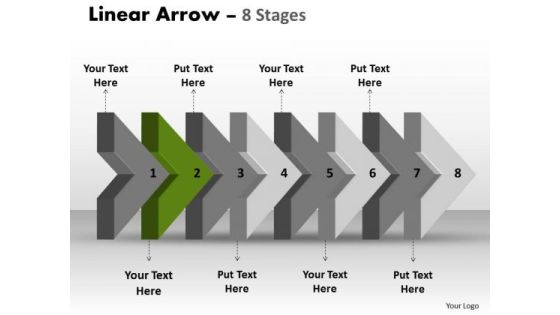
Ppt Template 3d Arrow Representing Eight Later Steps Time Management PowerPoint Design
We present our PPT template 3d arrow representing eight later Steps time management PowerPoint design. Use our Arrows PowerPoint Templates because; amplify on this basic corporate concept and forefront the benefits of overlapping processes to arrive at common goals. Use our Business PowerPoint Templates because, Marketing Strategy Business Template: - Maximizing sales of your product is the intended destination. Use our Marketing PowerPoint Templates because, you have it all down to a T. Use our Success PowerPoint Templates because, you have the right arrows in your quiver. Use our Process and Flows PowerPoint Templates because, our cleverly selected background hues are guaranteed to achieve this aim. Use these PowerPoint slides for presentations relating to Algorithm, Arrow, Arrow, Chart, Block, Diagram, Business, Chart, Connection, Design, Development, Diagram, Direction, Element, Flow, Flow, Chart, Flow, Diagram, Flowchart, Graph, Kind, Of, Diagram, Linear, Linear, Diagram, Management, Organization, Process, Process, Arrows, Process, Chart, Process, Diagram, Process, Flow, Program, Section, Segment, Set, Sign, Solution, Strategy, Symbol. The prominent colors used in the PowerPoint template are Green dark, Gray, White
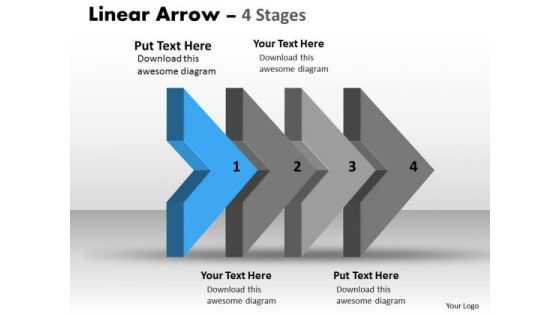
Ppt Template 3d Illustration Of Four Stages Marketing PowerPoint Backgrounds Plan 2 Design
We present our PPT template 3d illustration of four stages marketing PowerPoint backgrounds plan 2 designs. Use our Arrows PowerPoint Templates because; emphasize the benefits of healthy food habits and lifestyles in respect of vital organs of the human anatomy. Use our Symbol PowerPoint Templates because; Give them an overview of your capability and insight into the minute details of the overall picture highlighting the interdependence at every operational level. Use our Leadership PowerPoint Templates because; Help them align their arrows to consistently be accurate. Use our Business PowerPoint Templates because, you have the product you are very confident of and are very sure it will prove immensely popular with clients all over your target areas. Use our Process and Flows PowerPoint Templates because; Use this impressive template to unravel your recipe for a mouth watering result. Use these PowerPoint slides for presentations relating to Algorithm, Arrow, Arrow, Chart, Block, Diagram, Business, Chart, Connection, Design, Development, Diagram, Direction, Element, Flow, Flow, Chart, Flow, Diagram, Flowchart, Graph, Kind, Of, Diagram, Linear, Linear, Diagram, Management, Organization, Process, Process, Arrows, Process, Chart, Process, Diagram, Process, Flow, Program, Section, Segment, Set, Sign, Solution, Strategy, Symbol. The prominent colors used in the PowerPoint template are Blue, Gray, and Black

3d Continuous Illustration 6 Stages Electrical Schematic Symbols PowerPoint Slides
We present our 3d continuous illustration 6 stages electrical schematic symbols PowerPoint Slides. Use our Arrows PowerPoint Templates because, bring these grey areas to the table and explain in detail you assessment of the need for care to ensure continued smooth progress. Use our Marketing PowerPoint Templates because; examine each brilliant thought in thorough detail highlighting all the pros and cons as minutely as possible. Use our Symbol PowerPoint Templates because; Use this template to explain the value of its wellness to human life. Use our Success PowerPoint Templates because; Now put it up there for all to see. Use our Shapes PowerPoint Templates because; unravel each one for your audience while setting key timelines as you go along. Use these PowerPoint slides for presentations relating to Algorithm, Arrow, Arrow Chart, Block, Diagram, Business, Chart, Connection, Design, Development, Diagram, Direction, Element, Flow, Flow, Chart, Flow, Diagram, Flowchart, Graph, Kind, Of, Diagram, Linear , Diagram, Management, Organization, Process, Process, Arrows, Process, Chart, Process, Diagram, Process, Flow, Program, Section, Segment, Set, Sign, Solution, Strategy, Symbol. The prominent colors used in the PowerPoint template are Red, Orange, and Green
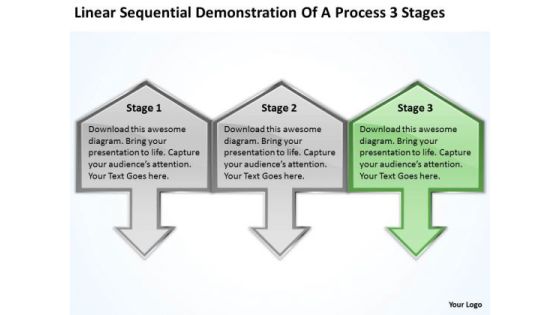
Sequential Demonstration Of Process 3 Stages Ppt Business Plans Software PowerPoint Slides
We present our sequential demonstration of process 3 stages ppt business plans software PowerPoint Slides.Download our Arrows PowerPoint Templates because motivating your team will cross all barriers. Present our Marketing PowerPoint Templates because there are different paths to gain the necessary knowledge to acheive it. Download and present our Finance PowerPoint Templates because this slide shows each path to the smallest detail. Use our Process and Flows PowerPoint Templates because you have some hits, you had some misses. Download and present our Business PowerPoint Templates because your product has established a foothold in the market. Customers are happy with the value it brings to their lives.Use these PowerPoint slides for presentations relating to Arrow, Chart, Block, Diagram, Business, Chart, Design, Development, Diagram, Direction, Element, Flow, Chart, Flow, Diagram, Flowchart, Graph, Linear, Management, Organization, Process, Arrows, Process, Chart, Process, Diagram, Process, Flow, Program, Section, Sign, Solution, Symbol. The prominent colors used in the PowerPoint template are Green, Gray, Black. People tell us our sequential demonstration of process 3 stages ppt business plans software PowerPoint Slides are Perfect. Professionals tell us our Development PowerPoint templates and PPT Slides are Dynamic. Professionals tell us our sequential demonstration of process 3 stages ppt business plans software PowerPoint Slides are Radiant. Professionals tell us our Diagram PowerPoint templates and PPT Slides are Colorful. You can be sure our sequential demonstration of process 3 stages ppt business plans software PowerPoint Slides are Ultra. Presenters tell us our Diagram PowerPoint templates and PPT Slides are Bright.

10 Stages Relationships Business Hierarchy Ppt Plan PowerPoint Slides
We present our 10 stages relationships business hierarchy ppt plan PowerPoint Slides.Present our Communication PowerPoint Templates because You can Stir your ideas in the cauldron of our PowerPoint Templates and Slides. Cast a magic spell on your audience. Use our Success PowerPoint Templates because Our PowerPoint Templates and Slides help you pinpoint your timelines. Highlight the reasons for your deadlines with their use. Download and present our Layers PowerPoint Templates because You can Be the star of the show with our PowerPoint Templates and Slides. Rock the stage with your ideas. Use our Ladders PowerPoint Templates because Our PowerPoint Templates and Slides are designed to help you succeed. They have all the ingredients you need. Use our Business PowerPoint Templates because you can Add colour to your speech with our PowerPoint Templates and Slides. Your presentation will leave your audience speechless.Use these PowerPoint slides for presentations relating to Connection, chart, isolated, department, tree, corporation, employment, red, communicating, business, concept, hierarchy, symbol, boxes, distribution, multilevel, relation, abstract, graph, relationship, interaction, division, position, ladder, group, pyramid, company, organization, manager, organized, cubes. The prominent colors used in the PowerPoint template are Black, Gray, Blue.

Semi Circular Pyramid Process 3 Stages Ppt Business Development Plans PowerPoint Slides
We present our semi circular pyramid process 3 stages ppt business development plans PowerPoint Slides.Download our Marketing PowerPoint Templates because You will get more than you ever bargained for. Download our Finance PowerPoint Templates because These PowerPoint Templates and Slides will give the updraft to your ideas. See them soar to great heights with ease. Present our Layers PowerPoint Templates because It is Aesthetically crafted by artistic young minds. Our PowerPoint Templates and Slides are designed to display your dexterity. Present our Triangles PowerPoint Templates because Our PowerPoint Templates and Slides are like the strings of a tennis racquet. Well strung to help you serve aces. Use our Pyramids PowerPoint Templates because You can Be the star of the show with our PowerPoint Templates and Slides. Rock the stage with your ideas.Use these PowerPoint slides for presentations relating to Pyramid, chart, paper, origami, compare, advertisement, sequence, step, layout, triangle, tutorial, business, concept, sign, hierarchy, presentation, glossy, bright, gradation, template, cone, data, clean, process, element, workflow, shape, modern, creative, economic, rhythm, options, shiny, futuristic, web, design, trendy, blue, text, composition, choice, info, five, version, progress, menu, information, promotion, infographics. The prominent colors used in the PowerPoint template are Green, Black, Gray.
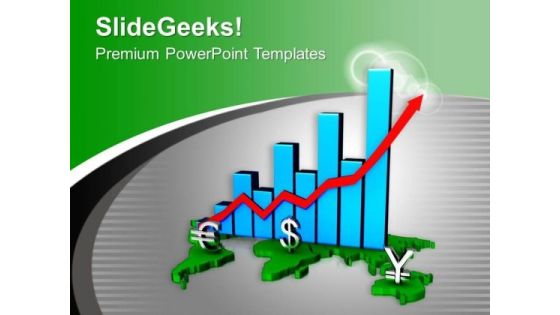
Global Business Growth Bar Graph PowerPoint Templates Ppt Backgrounds For Slides 0413
We present our Global Business Growth Bar Graph PowerPoint Templates PPT Backgrounds For Slides 0413.Download our Process and Flows PowerPoint Templates because You can Be the star of the show with our PowerPoint Templates and Slides. Rock the stage with your ideas. Download our Success PowerPoint Templates because Our PowerPoint Templates and Slides will give you great value for your money. Be assured of finding the best projection to highlight your words. Use our Business PowerPoint Templates because Your success is our commitment. Our PowerPoint Templates and Slides will ensure you reach your goal. Download and present our signs PowerPoint Templates because you should Experience excellence with our PowerPoint Templates and Slides. They will take your breath away. Download our Arrows PowerPoint Templates because Our PowerPoint Templates and Slides will let you Clearly mark the path for others to follow.Use these PowerPoint slides for presentations relating to Global profit growth charts with world, process and flows, business, success, signs, arrows. The prominent colors used in the PowerPoint template are Blue, Green, Gray.

Business Education PowerPoint Templates Business Bar Graph Data Driven Ppt Slides
Business Education PowerPoint Templates Business bar graph data driven PPT Slides-This PowerPoint slide is a data driven Columns Chart. The number of columns depend on the data.-Business Editable PowerPoint Templates Business beveled column chart PPT Slides-This ppt can be used for concepts relating to-chart,, graph, growth, investment, , market, percentage, , presentation report, results, statistics, stock, success and business.
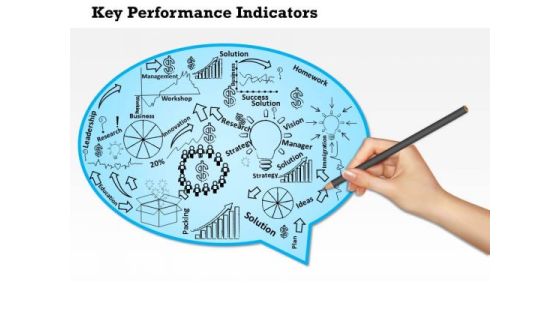
Business Diagram Key Performance Indicators Of A Company PowerPoint Ppt Presentation
Our above diagram provides framework of key performance indicators for a company. This slide contains human hand drawing some objects for terms like innovation strategy, research, solution, management and leadership. Download this diagram to make professional presentations.

Business Diagram Horizontal Process Three Stages Paper Folding Artistic Presentation Template
This business diagram has been crafted with graphic of three staged horizontal process. This PPT contains the concept of business process flow in an artistic way. Use this process flow diagram in your presentation and build a quality presentation.

Business Diagram 3d Globe With Magnifying Glass On Europe Africa Presentation Template
Concept of global environment can be explained with this diagram of globe with magnifying glass. Magnifying glass represents a deep down research approach. Get professional using this diagram to explain global issues minutely in any business or global presentations.

Business Diagram 3d Globe With Magnifying Glass On South America Presentation Template
Concept of global environment can be explained with this diagram of globe with magnifying glass. Magnifying glass represents a deep down research approach. Get professional using this diagram to explain global issues minutely in any business or global presentations.
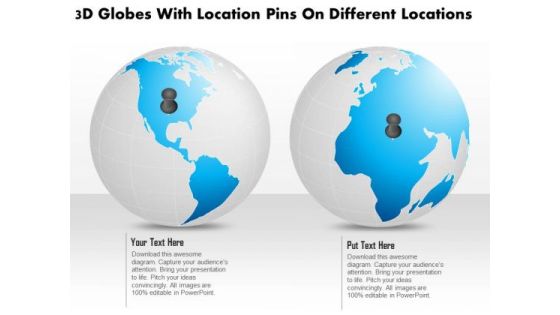
Business Diagram 3d Globes With Location Pins On Different Locations Presentation Template
This Power Point diagram slide has been designed with graphic of 3d globe pins. Pins have been used to display different locations on globe. Use this diagram for various business topics in which you have to display location of countries.

Business Diagram 3d Small Area Specific Globe With World Map Presentation Template
Concept of global environment can be explained with this diagram of small globes with world map. Get professional using this diagram to explain global issues minutely in any business or global presentations.

Business Diagram 3d World Globe Magnifying Glass On Africa Presentation Template
Concept of global environment can be explained with this diagram of globe with magnifying glass. Magnifying glass represents a deep down research approach. Get professional using this diagram to explain global issues minutely in any business or global presentations.

Business Diagram Business Temple Three Pillars Text Info Graphic Presentation Template
This business power point template has been crafted with three text pillars and business temple diagram. These pillars provide help support to roof of building. Include this useful temple diagram in your strategy and consulting presentations.

Business Diagram 4 Stage Agenda Options With Mobile Phone Presentation Template
This diagram displays 4 stage agenda with mobile phone. It contains mobile graphics to present three points of business agenda. Use this professional and customized business diagram in your PowerPoint presentations.

Business Diagram 5 Stage Agenda Coming Out Of Mobile Phone Presentation Template
This diagram displays 5 stage agenda with mobile phone. It contains mobile graphics to present three points of business agenda. Use this professional and customized business diagram in your PowerPoint presentations.

Business Diagram 6 Stage Agenda Options With Mobile Phone Presentation Template
This diagram displays 6 stage agenda with mobile phone. It contains mobile graphics to present three points of business agenda. Use this professional and customized business diagram in your PowerPoint presentations.

Business Diagram Three Steps Arrow Text Boxes Info Graphic Presentation Template
This business power point template has been crafted with graphic of arrows. This PPT diagram contains the three steps of info graphics. Use this diagram for your business presentations to display different texts.

Business Diagram 3d Warning Of Nuclear Power Production Area Presentation Template
Display the nuclear safety systems with this exclusive warning sign diagram. This diagram contains the graphic of 3d warning sign board. This image is useful for nuclear energy related topics.

Business Diagram 3d Warning Symbol Of Nuclear Energy Production Presentation Template
3D warning symbol of nuclear power production area is displayed in this power point template. This diagram contains the concept of nuclear safety systems. Use this diagram for nuclear production related topics.
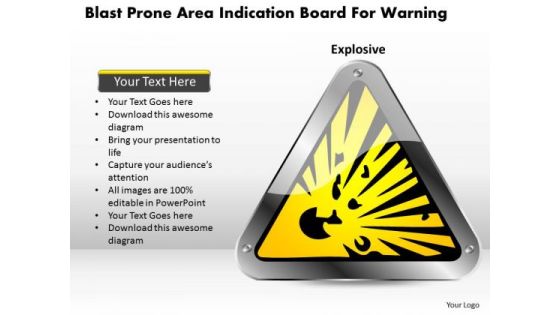
Business Diagram Blast Prone Area Indication Board For Warning Presentation Template
This Power Point template has been designed with graphic of warning symbol. This diagram contains the concept of warning sign for blast prone area. Use this diagram for warning and safety related topics.

Business Diagram Nuclear Fan For Power With Warning Sign Presentation Template
This warning sign diagram has been designed with graphic of fan. This warning sign contains the warning for nuclear power generation. Use this diagram to build a quality presentation for your viewers.

Business Diagram Red Warning Sign For Do Not Touch Presentation Template
Warning sign of do not touch has been displayed in this power point template. This diagram contains the graphic of red warning sign. Use this diagram to create a quality presentation for safety related topics.
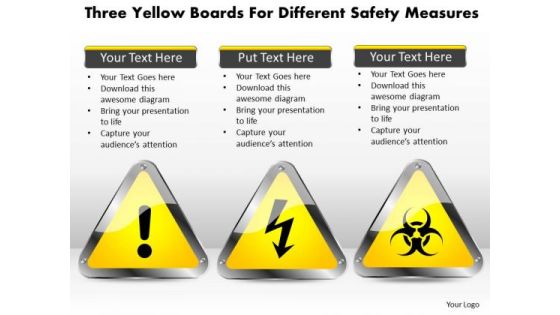
Business Diagram Three Yellow Boards For Different Safety Measures Presentation Template
Three yellow boards are used to design this PowerPoint diagram. This template contains the different safety signs. Use his diagram to learn about safety and prevention in your workplace, home, and other places.

Business Diagram Warning Sign For Nuclear Power With Stop Sign Presentation Template
This PowerPoint diagram has been designed with graphic of warning sign. This warning sign id designed to display the stop symbol. Use this diagram for safety measures and entry in nuclear area related presentations.

Business Diagram Financial Growth With Rocket And Dollar Sign Presentation Template
This business diagram has been designed with graphic of dollars and rocket. This PowerPoint diagram contains the concept of financial growth. Use this awesome slide for your business and finance related presentations.
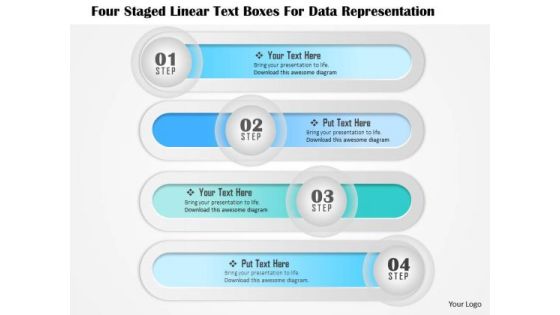
Business Diagram Four Staged Linear Text Boxes For Data Representation Presentation Template
This business diagram displays four staged linear text boxes. This diagram is suitable to depict flow of business activities or steps. Download this professional slide to present information in an attractive manner

Business Diagram Human Face With Brains Made With Puzzle Presentation Template
This business diagram has been designed with graphic of human face with brain made of puzzle pieces. This business slide contains the concept of problem solving. This diagram can be easily editable and also you can customize it.
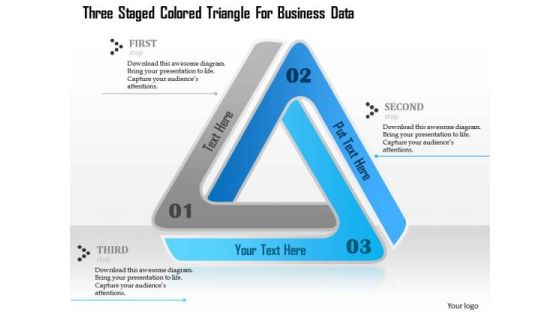
Business Diagram Three Staged Colored Triangle For Business Data Presentation Template
Three staged blue colored triangle has been used to design this business diagram. This slide contains triangle diagram to depict process flow. Use this PPT slide for your business and marketing presentations

Business Diagram Golden Silver And Gold Trophy For Champions And Gold Medal Presentation Template
This business diagram has been designed with graphic of trophies. This business slide contains the concept of success and victory. Use this diagram to present your views in a wonderful manner.
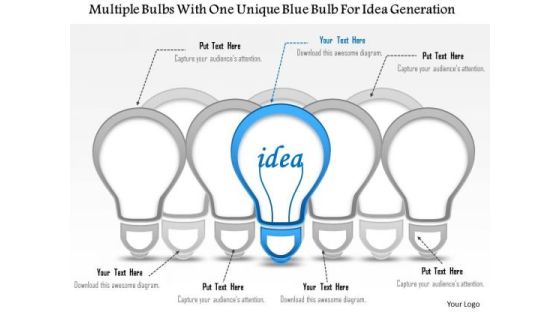
Business Diagram Multiple Bulbs With One Unique Blue Bulb For Idea Generation Presentation Template
This business diagram has been designed with multiple bulbs with one unique bulb. This diagram can be used to depict innovative business ideas. Use this slide for your business and technology based presentations.

Business Diagram Five Staged Stair Style Text Boxes For Business Agenda Presentation Template
This business diagram displays five staged linear text boxes. This diagram is suitable to depict flow of business activities or steps. Download this professional slide to present information in an attractive manner.

Business Diagram Five Vertical Arrows For Linear Data Flow Presentation Template
This business diagram displays graphic of five vertical arrows linear data flow. This business slide contains the concept of business data representation. Use this diagram to build professional presentation for your viewers.

Business Diagram Flower Style Circular Process Flow With Control Presentation Template
This business diagram displays flower style text circles. This diagram is suitable to depict flow of business activities or steps. Download this professional slide to present information in an attractive manner
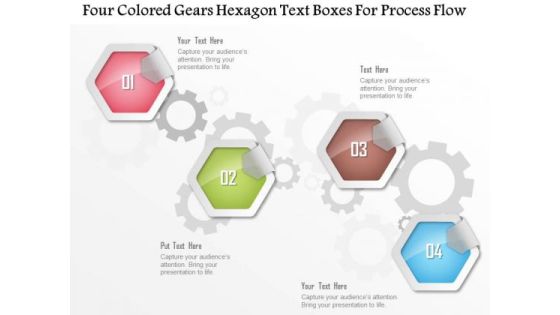
Business Diagram Four Colored Gears Hexagon Text Boxes For Process Flow Presentation Template
Four colored gears hexagon text boxes are used to design this power point template. This diagram contains hexagons for data representation. Use this diagram to display business process workflows in any presentation.
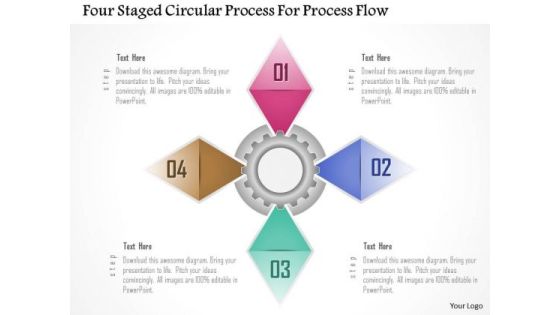
Business Diagram Four Staged Circular Process For Process Flow Presentation Template
This business diagram displays four staged circular process. This diagram is suitable to depict flow of business activities or steps. Download this professional slide to present information in an attractive manner

Business Diagram Mega Collection Of Fifteen Timeline 6 Stages Presentation Template
This business diagram has been designed with graphic of linear business timeline. This slide can be used for business planning and management. Use this diagram for your business and success milestones related presentations.
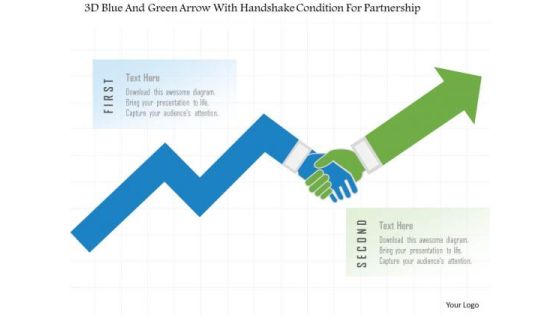
Busines Diagram 3d Blue And Green Arrow With Handshake Condition For Partnership Ppt Template
This business diagram has been designed with graphic of 3d blue and green arrow in handshake form. This business slide helps to display concept of business partnership Download this diagram to exhibit business partnership.
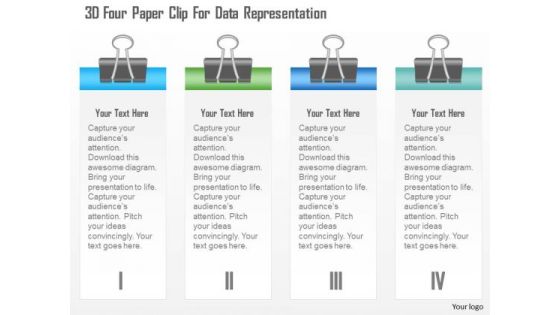
Busines Diagram 3d Four Paper Clip For Data Representation Presentation Template
This business diagram displays 3d paper clips with four text boxes. This editable text boxes diagram can be used for data representation. Use this slide to make professional presentations.

Busines Diagram 3d Mobile Phone With Text Boxes For Mobile Technology Ppt Template
This business diagram has been designed with graphic of 3d mobile phone and text boxes. This slide helps to display the concept of mobile technology. Use this diagram for mobile technology and communication related topics.

Busines Diagram 3d Pencil With Multicolor And Text Boxes Presentation Template
This business diagram displays four text boxes around a pencil. This professional slide can be used for data display in visual manner. Download this diagram for your school and education related presentations.
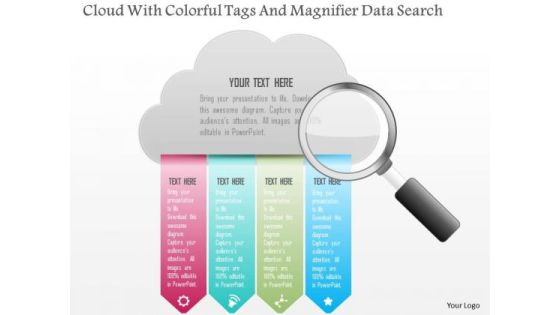
Busines Diagram Cloud With Colorful Tags And Magnifier Data Search Presentation Template
This business diagram displays graphic of colorful tags and cloud with magnifier. This slide can be used to for technology and communication related topics. Enhance the look of your presentations with this diagram.
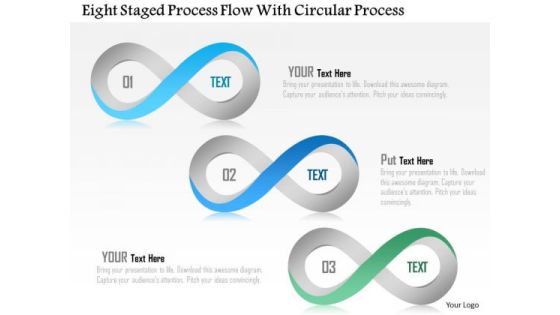
Busines Diagram Eight Staged Process Flow With Circular Process Presentation Template
This professional slide has been designed with graphic of eight staged business diagram. This slide is useful to depict business process flow. This diagram is designed by our professional team to leave long-lasting impressions on your audiences minds.
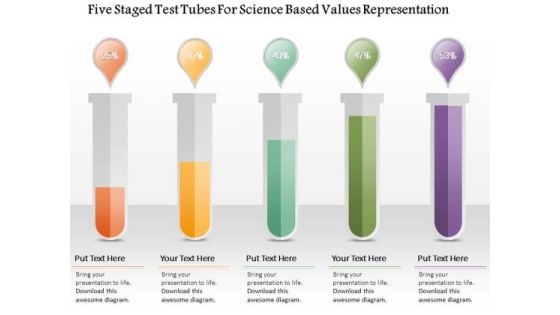
Busines Diagram Five Staged Test Tubes For Science Based Values Representation Ppt Template
Five staged test tubes are used to design this business diagram. This business slide contains the concept of value representation based on scientific data. Ideas are best expressed easily with the help of this diagram slide
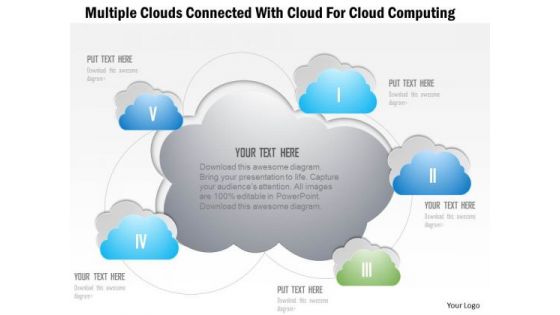
Busines Diagram Multiple Clouds Connected With Cloud For Cloud Computing Ppt Template
Multiple clouds are used to design this business diagram. This slide contains the concept of cloud connectivity and networking. Use this diagram for business and cloud technology related presentations.
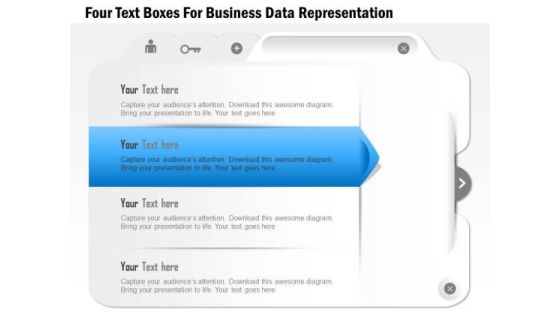
Business Diagram Four Text Boxes For Business Data Representation Presentation Template
This diagram can be used to display 4 staged business plan. Your thoughts need to be organized. This PowerPoint template contains graphics of four text boxes. Use this innovative diagram slide to build exclusive presentation.

Business Diagram 3d Bulb With Ten Stages For Idea Generation Presentation Template
This business diagram has been designed with 3d bulb with ten stages. This bulb graphic is displaying the concept of idea generation. Use this diagram to portray concepts like strategy, idea , success etc.

Business Diagram 3d Bulb With Text Boxes For Data Representation Presentation Template
This business diagram has been designed with 3d bulb with text boxes. This bulb graphic is displaying the concept of idea generation. Use this diagram to portray concepts like strategy, idea , success etc.
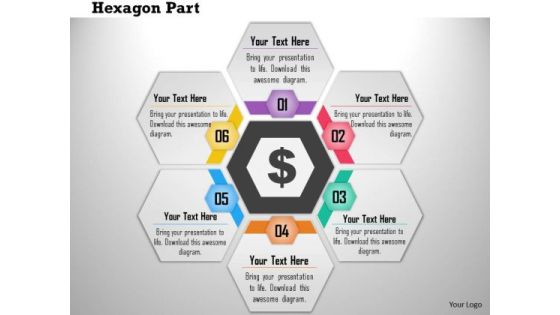
Business Diagram Six Hexagon Text Boxes In Cyclic Order Presentation Template
This PowerPoint template has been designed with graphic of six hexagon text boxes in cyclic order. This diagram can be used to depict data flow. Use this diagram to build exclusive presentation for your viewers.

Business Diagram Three Stylish Text Boxes For Business Presentation Presentation Template
Three text boxes are used to craft this power point template. This business diagram contains the concept of text representation. Use this diagram for your business and marketing related presentations.

Business Diagram 3 Vs Of Big Data Showing Challenges And Complexity Of Analysis Ppt Slide
Explain the complexity and analysis with this unique PowerPoint template. This technology diagram contains the graphic of three V's to display data complexity. Use this diagram to make professional presentations.

Business Diagram 3d Men Making Mobile Phone With Puzzle Pieces Ppt Slide
This technology diagram has been designed with graphic of 3d men making mobile phone with puzzle pieces. Use this diagram for your mobile technology and problem solving related presentations.
Business Diagram Big Data Analysis Using Magnifying Glass Analysis Ppt Slide
This unique diagram has been designed with graphic of magnifier on blue color text of bag data. This slide depicts concept of big data analysis. This professional diagram can be used for data communication and analysis related topics.
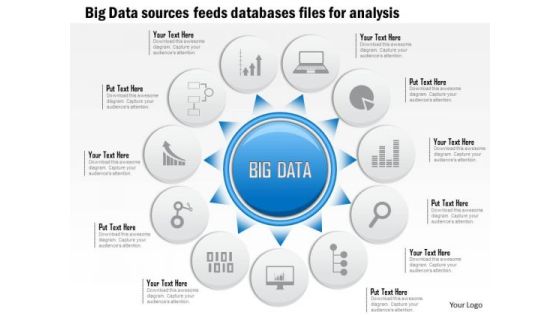
Business Diagram Big Data Sources Sensors Feeds Databases Files For Analysis Ppt Slide
This slide has been designed with graphic of circular source diagram. This diagram contains the concept of data source sensors and feeds of database files. Download this editable slide to build an exclusive presentation for your viewers.

Business Diagram Comparison Of Physical And Virtual World Explaining Virtualization Ppt Slide
Concept of comparison in between virtual and physical world has been displayed in this diagram. To display this concept we have used graphic of servers in sequential order. Download this editable diagram slide to create an impact on your viewers.
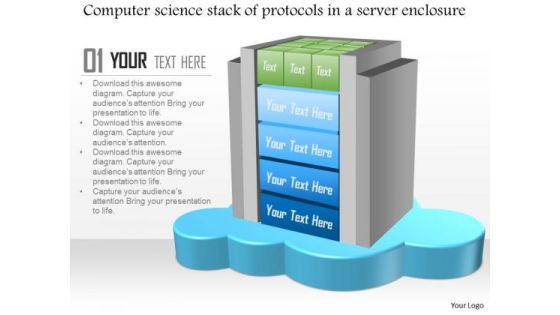
Business Diagram Computer Science Stack Of Protocols In A Server Enclosure Ppt Slide
This diagram slide has been designed with graphic of computer server. This server is displaying the stacks of protocols in a server enclosure. This diagram can be used to display protocol topics in computer science related presentations.
Business Diagram Creative Sign With Highway Sign Text Big Data Next Exit Ppt Slide
This diagram has been designed with graphic of magnifier and text boxes. These boxes are used to display creative sign and highway sign for big data analysis. This diagram can be used for data related topics in any presentation.

Business Diagram Options For As A Service Infrastructures With It As A Service Ppt Slide
This diagram slide has been designed with triangle graphic display option and service infrastructure. Explain the concept of service with this unique diagram slide. This slide is suitable for technology related presentations.

Business Diagram Saas Paas Iaas Virtual Data Cloud Centers Ppt Slide
This technical diagram has been designed with graphic of triangle. This slide contains the concept of SAAS, PAAS and IASS. This slide also helps to explain the virtual data on cloud centers. Download this diagram to make professional presentations.
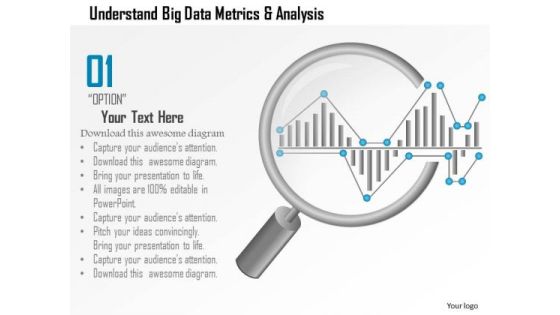
Business Diagram Understand Big Data Metrics And Analysis Showing By Magnifying Glass Ppt Slide
This PPT slide has been designed with big data metrics and magnifying glass. This diagram helps to portray concept of data analysis and data search. Download this diagram to make professional presentations.
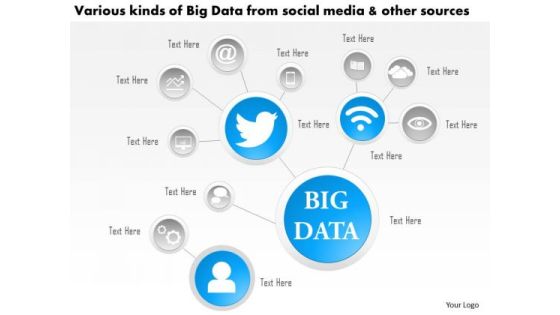
Business Diagram Various Kinds Of Big Data From Social Media And Other Sources Ppt Slide
This technology diagram contains the concept of big data analysis. This slide depicts various kinds of social media and other sources. Use this diagram for mobile and communication related presentations.
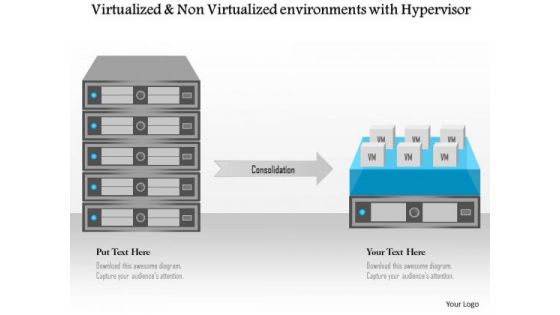
Business Diagram Virtualized And Non Vitualized Environments With Hypervisor Ppt Slide
Explain the concept of virtualized and non virtualized environments with hypervisor by using this unique diagram slide. This slide depicts the graphic of database server. This diagram may be used for networking and communication related presentations.
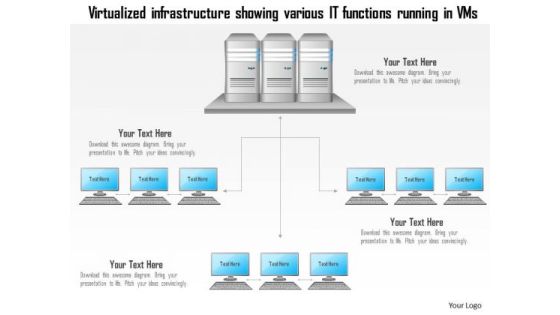
Business Diagram Virtualized Infrastructure Showing Various It Functions Running In Vms Ppt Slide
Graphic of data base server and VMS has been used to design this technology diagram. This slide contains the virtualized infrastructure for various functions. Use this diagram for technology related presentations.

Business Diagram 3d Bulb With Modern Infographics For Idea Generation Presentation Template
Our above slide displays 3d bulb with modern infographic. Download our above diagram to express information in a visual way. This diagram offers a way for your audience to visually conceptualize the process.
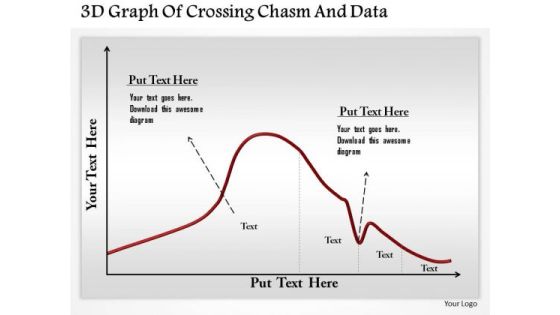
Business Diagram 3d Graph Of Crossing Chasm And Data Presentation Template
This business diagram has been designed with graphic of 3d graph. This slide contains the concept of chasm and data calculation. Use this slide to display chasm crossing condition. This business diagram adds value to your ideas.
Business Diagram 3d Human Hand Picking Gear From Multiple Gears Presentation Template
This business diagram has been designed with graphic of 3d human hand picking up gear from multiple gears. This diagram is 100 percent editable just insert the contents and your views are best expressed.
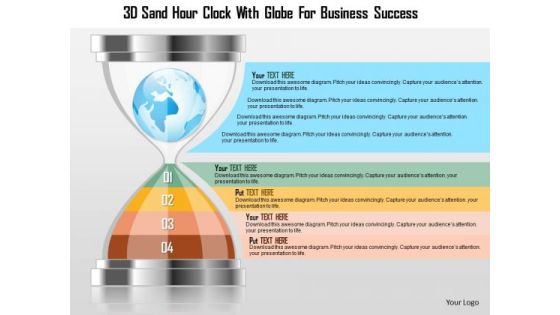
Business Diagram 3d Sand Hour Clock With Globe For Business Success Presentation Template
Graphic of 3d sand clock with globe has been used to design this business diagram. This PPT contains the concept of time management and business success. Download our above diagram to express information in a visual way.

Business Diagram Blue Foot Print Leading Black Foot Prints Leadership Presentation Template
Graphic of blue foot prints and one black foot print ahead displayed in this business slide. This business diagram depicts the concept of leadership growth and success. Download this diagram slide to make professional presentations.
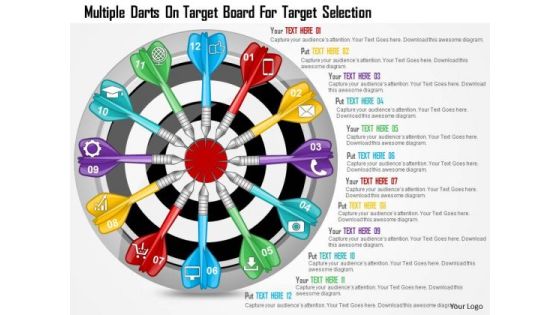
Business Diagram Multiple Darts On Target Board For Target Selection Presentation Template
Graphic of multiple darts and target board has been used to design this diagram. This diagram depicts the concept of target selection and achievement. Make your presentation more interactive with this business slide.
Business Diagram Paper Tags On Mobile Screen For Data Representation Presentation Template
This business diagram has been designed with graphic of text boxes with mobile phone. This diagram helps to depict concepts of technology and communication. Make your presentation more interactive with this business slide.
Business Diagram Five Staged Numeric Text Boxes For Data Representation PowerPoint Template
Five staged numeric text boxes diagram has been used to design this power point template. This diagram template contains the concept of data representation. Use this PPT for your business and marketing related presentations.

Business Diagram Faces In Bulb Style With Speech Bubbles Presentation Template
This business diagram has been designed with graphic of faces In bulb style with speech bubbles. This PPT contains the concept of communication, idea, and innovation. Download this diagram to make professional presentations.
Business Diagram Three Bulbs In Carton For Business Ideas Presentation Template
Our above slide displays three Bulbs In Carton For Business Ideas. Download our above diagram to express information in a visual way. This diagram offers a way for your audience to visually conceptualize the process.
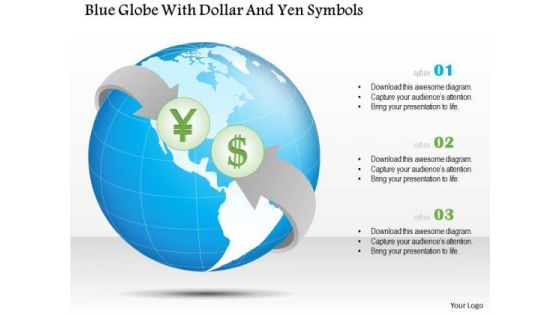
Business Diagram Blue Globe With Dollar And Yen Symbols Presentation Template
Graphic of blue globe with dollar and yen symbol has been used in this business diagram. This slide is helpful to represent topics like global economy and business. Display your strategy in your presentation with this exclusive diagram.
Business Diagram Blue Team Text With 3d Men For Business Presentation Template
Concept of teamwork and management has been displayed in this business diagram. This business slide contains the graphic of 3d men puling team text. This diagram offers a way for your audience to visually conceptualize the process.

Business Diagram Five Staged Colored Infographics For Business Data Presentation Template
Five staged colored info graphics has been used to design this PowerPoint template. Download our above diagram to express information in a visual way. This diagram offers a way for your audience to visually conceptualize the process.
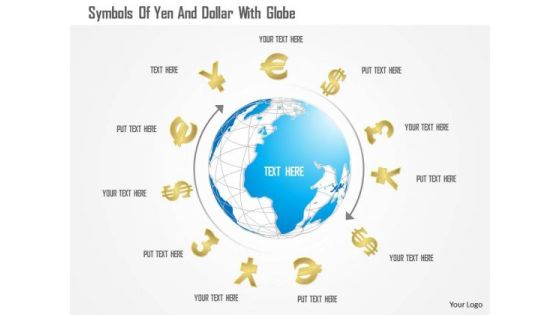
Business Diagram Symbols Of Yen And Dollar With Globe Presentation Template
Symbols of Yen and dollar around globe have been used in this business diagram. This slide is helpful to represent topics like global economy and business. Display your strategy in your presentation with this exclusive diagram.
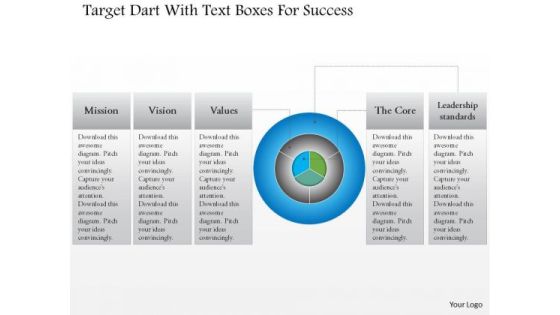
Business Diagram Target Dart With Text Boxes For Success Presentation Template
This business diagram has been designed with graphic of target dart and text boxes. This slide depicts the concept of target achievement. Display your strategy in your presentation with this exclusive diagram.

Business Diagram Team Of Business Men With One Leader For Leadership Presentation Template
This business diagram has been designed with graphic of 3d team and one leader. This diagram depicts the concept of leadership and teamwork. Use this slide to build quality presentation for your viewers.

Business Diagram Puzzles In Human Hands For Teamwork Concept Presentation Template
Graphic of puzzle in human hand has been used to design this power point template diagram. This PPT diagram contains the concept of teamwork . Use this PPT for business and marketing related presentations.
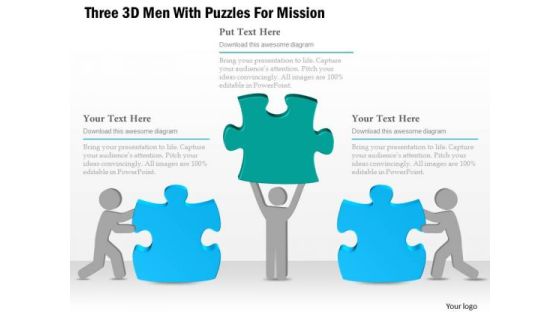
Business Diagram Three 3d Men With Puzzles For Mission Presentation Template
Three 3d men and puzzles has been used to craft this power point template diagram. This PPT diagram contains the concept of mission representation. Use this PPT for business and marketing related presentations.
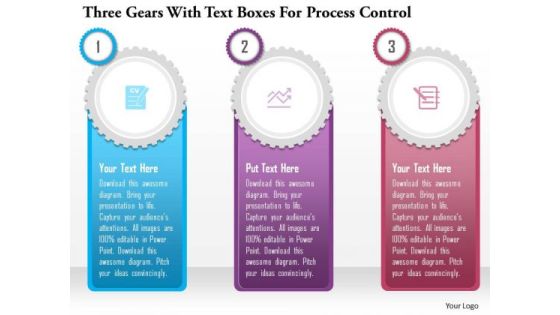
Business Diagram Three Gears With Text Boxes For Process Control Presentation Template
Graphic of three gears and text boxes has been used to design this power point template diagram. This PPT diagram contains the concept of process control. Use this PPT for marketing and business related presentations.

Business Diagram Thumb In Vertical Order With App Graphics Presentation Template
This power point template diagram has been crafted with graphic of thumb in vertical order and apps. This PPT diagram contains the concept of application analysis. Use this PPT for business presentation and get good remarks.
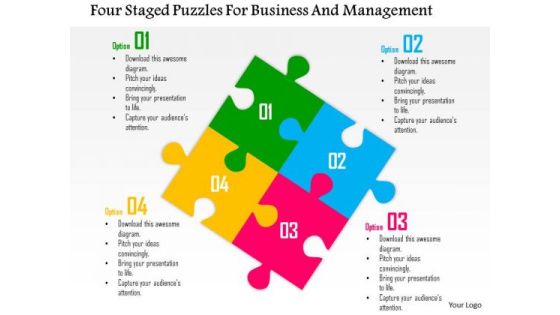
Business Diagram Four Staged Puzzles For Business And Management Presentation Template
Four staged puzzles has been used to craft this power point template. This PPT diagram contains the concept of business management. Use this PPT diagram for business presentations and get good comments.

Business Diagram Gears With Man For Management And Process Control Presentation Template
Graphic of gears with man has been used to design this power point template diagram. This PPT contains the concept of management and process control. Use this PPT diagram for business and management related presentations.

Business Diagram Globe With Bar Graph For Business Strategy Plan Presentation Template
This power point template diagram has been crafted with graphic of globe and bar graph. This PPT diagram contains the concept of business strategy and business plans for global market. Use this PPT for business and marketing related presentations.
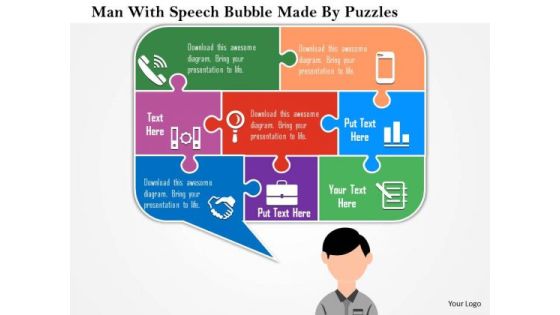
Business Diagram Man With Speech Bubble Made By Puzzles Presentation Template
This power point template has been crafted with graphic of man and speech bubble. This power point template diagram for business communication. Use this PPT diagram for business and marketing related presentations.
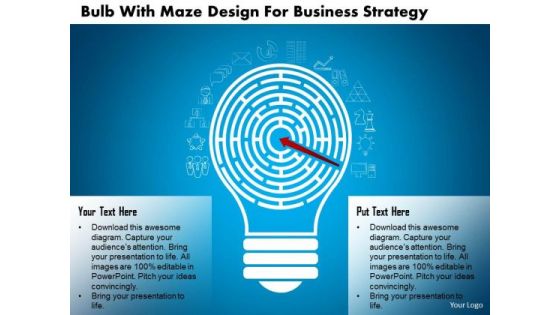
Business Diagram Bulb With Maze Design For Business Strategy Presentation Template
Our above business diagram displays graphics of bulb with maze design, this professional image helps to portray concepts like business strategy and solutions. Download this unique diagram slide to build innovative presentation.
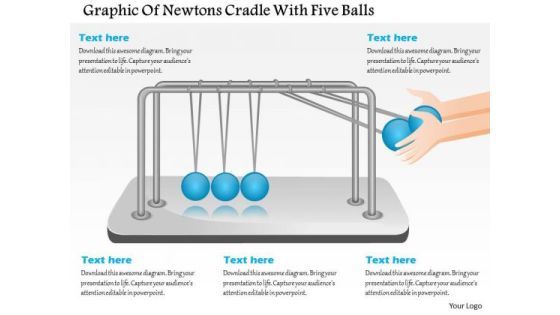
Business Diagram Design Of Newtons Cradle With Five Balls Presentation Template
This diagram displays five balls of newtons cradle with five balls. Download this diagram to depict newtons third law of action and reaction. Present your views using this innovative slide and be assured of leaving a lasting impression.

Business Diagram Two Male Face Design Bubbles For Text Representations Presentation Template
This diagram displays two face designs. You may use this image for topics related to teamwork, discussion, and exchange of thoughts. This diagram slide is best to present your newer thoughts.
Business Diagram Two Peoples With Puzzles For Different Ideas Presentation Template
This diagram displays two men with puzzles. You may use this image for topics related to teamwork, discussion, and exchange of thoughts. This diagram slide is best to present your newer thoughts.
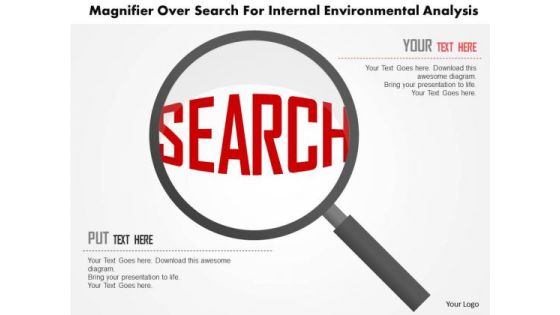
Business Diagram Magnifier Over Search For Internal Environmental Analysis Presentation Template
This business slide has been designed with magnifier on search text. You may use this unique diagram slide to depict business analysis and research. Use this diagram in your presentations to get good remarks from your viewers.

Business Diagram Green Fishes With Unique Red For Integration Strategy Presentation Template
This business slide displays graphics of green fishes with one unique red. This diagram helps to depict concept of business planning and strategy. Download this diagram slide to make professional presentations.
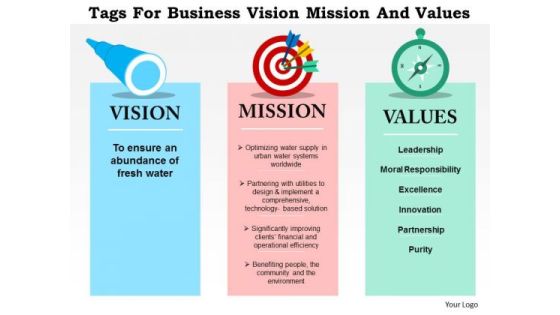
Business Diagram Tags For Business Vision Mission And Values Presentation Template
Our above business slide displays three tags. This diagram is designed to exhibit business vision, mission and values. This diagram offers a way for your audience to visually conceptualize the process.
Business Diagram Tags Of Top Seller And Premium Quality Brand Presentation Template
The above template displays a diagram of tags with top seller and premium quality. This diagram has been professionally designed to emphasize the concept of brand management. Grab center stage with this slide. Capture the attention of your audience.
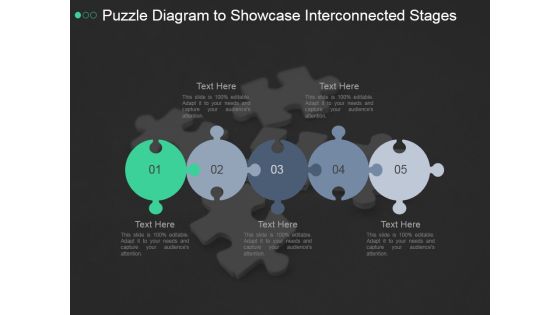
Puzzle Diagram To Showcase Interconnected Stages Ppt PowerPoint Presentation Example 2015
This is a puzzle diagram to showcase interconnected stages ppt powerpoint presentation example 2015. This is a five stage process. The stages in this process are puzzle, diagram, business, marketing, strategy, success, management.

eight stages cyclic diagram with text boxes ppt powerpoint presentation outline examples
This is a eight stages cyclic diagram with text boxes ppt powerpoint presentation outline examples. This is a eight stage process. The stages in this process are cycle diagram, circular process, cyclical process.
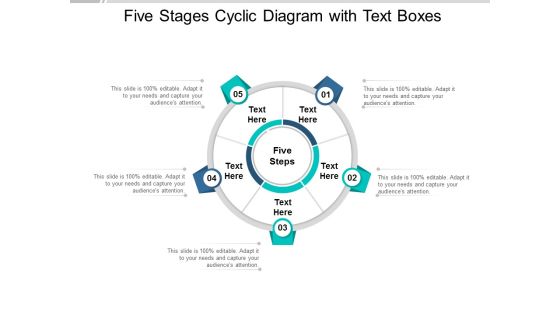
Five Stages Cyclic Diagram With Text Boxes Ppt Powerpoint Presentation Visual Aids Example File
This is a five stages cyclic diagram with text boxes ppt powerpoint presentation visual aids example file. This is a five stage process. The stages in this process are cycle diagram, circular process, cyclical process.
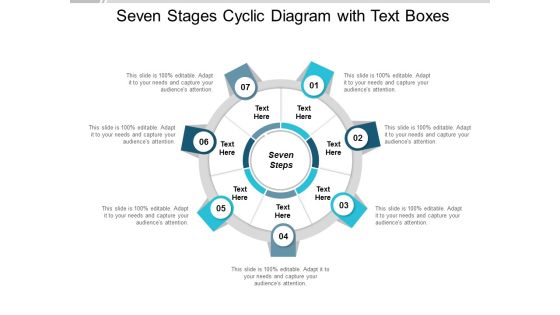
Seven Stages Cyclic Diagram With Text Boxes Ppt Powerpoint Presentation Infographic Template Gridlines
This is a seven stages cyclic diagram with text boxes ppt powerpoint presentation infographic template gridlines. This is a seven stage process. The stages in this process are cycle diagram, circular process, cyclical process.


 Continue with Email
 Sign up for an account
 Home
Home


