Guiding Principles

Stock Photo Globe On Dollars And Key PowerPoint Slide
This amazing image has been designed with globe on dollar bills with silver key. This conceptual image slide may be used to display value of dollar around the world. Accelerate the impact of your ideas using this image.

Stock Photo Globe On Dollars With Key PowerPoint Slide
This professional image slide has been designed with globe on dollar bills with golden key. This conceptual image may be used to display value of dollar around the world. Accelerate the impact of your ideas using this image.

Business Diagram Mobile Applications Vector Illustration Concept Presentation Template
As mobile have become an indispensible part of our daily lives. This amazing mobile application icons will also add great value to your ideas and presentations in the fields of telecommunications, travelling, banks and financial institutions, e-Learning etc.
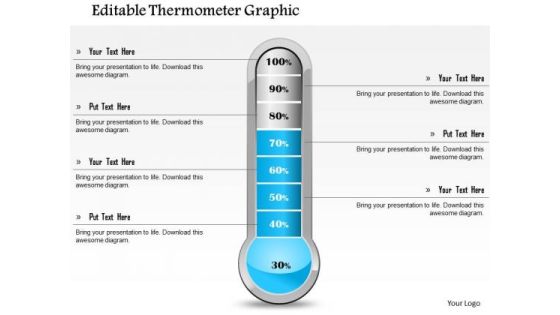
Business Framework Editable Thermometer Graphic PowerPoint Presentation
This Power Point template slide has been crafted with graphic of meter. This meter contains the max and min value. Use this PPt for your technical presentation and display your technical specifications in a graphical way.
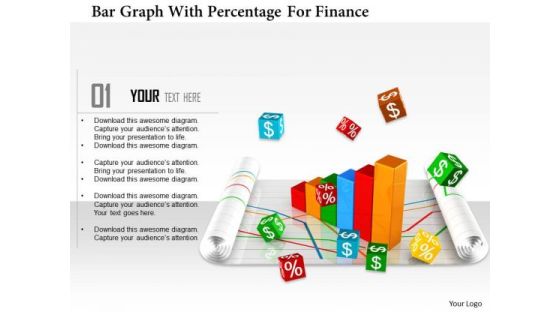
Stock Photo Bar Graph With Percentage For Finance PowerPoint Slide
This Power Point template has been designed with graphic of bar graph and percentage value. This image slide contains the concept of finance and accounting. Use this editable diagram for your business and finance related presentations.

Stock Photo Hundred Percentage Inside Lock Safety PowerPoint Slide
Concept of financial safety has been displayed in this image slide with suitable graphics. This slide has been designed with graphic of hundred percentage value and lock. Use this professional slide to make build innovative presentation on safety related topics.

Business Framework 10 Percent To 90 Percent PowerPoint Presentation
This business diagram has been designed with graphic of multiple pie graphs. This diagram slide contains the concept of result analysis with percentage values. Use this diagram to present and compare data in an impressive manner
Business Diagram Human Icons With Bubbles And Different Icons Inside PowerPoint Slide
This diagram displays graph with percentage value growth. This business slide is suitable to present and compare business data. Use this diagram to build professional presentations for your viewers.

Business Diagram Diagram For Visual Data Display Presentation Template
Four colored cylindrical bars with percentage values are used to design this power point template. This diagram slide helps to display financial data analysis. Use this diagram for your business and finance related presentations.
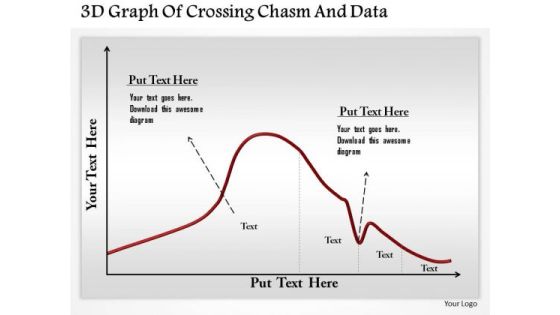
Business Diagram 3d Graph Of Crossing Chasm And Data Presentation Template
This business diagram has been designed with graphic of 3d graph. This slide contains the concept of chasm and data calculation. Use this slide to display chasm crossing condition. This business diagram adds value to your ideas.
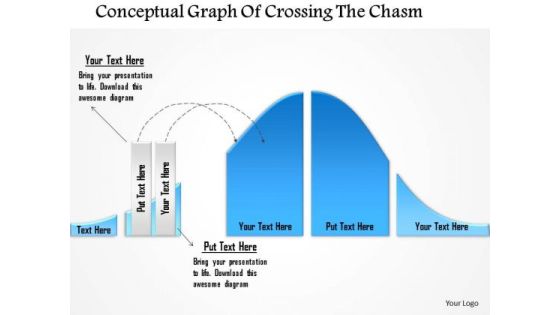
Business Diagram Conceptual Graph Of Crossing The Chasm Presentation Template
This business diagram has been designed with graphic of 3d graph. This slide contains the concept of chasm and data calculation. Use this slide to display chasm crossing condition. This business diagram adds value to your ideas.

Business Diagram Circles For Accounting Equation PowerPoint Templates
Graphic of Venn diagram with percentage value has been used to design this business diagram. These circles may also be used to depict accounting equations. Use this diagram to illustrate your thoughts and experiences to your staff.

Bottles Displaying Growth Levels PowerPoint Template
The above template displays a diagram of bottles. This diagram has been professionally designed to emphasize on concept of value stream mapping. Grab centre stage with this slide. Capture the attention of your audience.
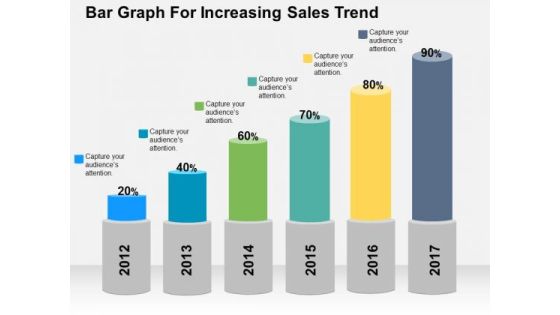
Bar Graph For Increasing Sales Trend PowerPoint Template
Deliver amazing presentations with our above template showing bar graph with percentage values. You may download this slide to depict increase in sales trends. Capture the attention of your audience using this diagram.
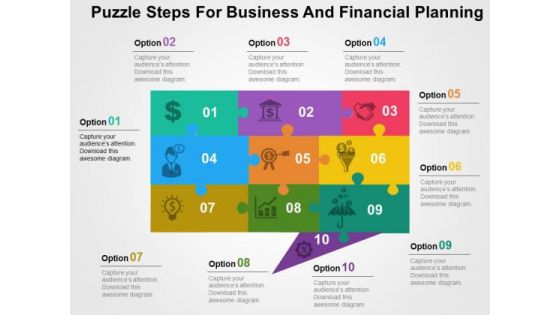
Puzzle Steps For Business And Financial Planning PowerPoint Templates
This creative slide has been designed with graphics of puzzle steps. Use this unique slide in presentations related to business and financial planning. This template adds value to your idea.

People Thoughts For Business Planning PowerPoint Templates
This creative slide has been designed with graphics of team icons. Use this unique slide in presentations related to business and financial planning. This template adds value to your idea.

Business Team Standing In Rings PowerPoint Templates
This slide contains graphics of business team standing in rings. This slide helps to portray concepts like team planning and business strategies. This PowerPoint template adds value to your presentation
Test Tubes With Financial Data In Percentage Ratio Powerpoint Slides
This PowerPoint template contains graphics of test tubes with percentage values. You may download this PPT slide design to display financial ratio analysis. You can easily customize this template to make it more unique as per your need.

Bar Graph For Statistical Analysis Powerpoint Slides
This PowerPoint template has been designed with bar chart and percentage values. You may download this PPT slide to depict statistical analysis. Add this slide to your presentation and impress your superiors.

Percentage Chart For Good Marketing Strategy Powerpoint Slides
This PowerPoint template has been designed with pie chart and percentage values. The PowerPoint template has a high quality design. You can download this PowerPoint slide to make good marketing strategy and business plans.

Four Business Option Banner Diagram Powerpoint Template
This business slide contains four option banners with business icons. This PPT diagram is suitable to present concept of profit growth value analysis. Visual effect of this diagram provides more clarity to the subject.

Seven Steps Semicircular Infographic Chart Powerpoint Template
This business slide contains four option banners with business icons. This PPT diagram is suitable to present concept of profit growth value analysis. Visual effect of this diagram provides more clarity to the subject.

Four Tags For Financial Review And Analysis Powerpoint Slides
This PowerPoint template has been designed with four tags and financial values. This PowerPoint template helps to exhibit financial review and analysis. Use this diagram slide to build an exclusive presentation.

Four Steps For Financial Data Analysis Powerpoint Slides
This PowerPoint contains four circles with percentage values. Download this diagram slide to display financial data analysis. This template is editable, You can edit text, color, shade and style of this diagram as per you need.
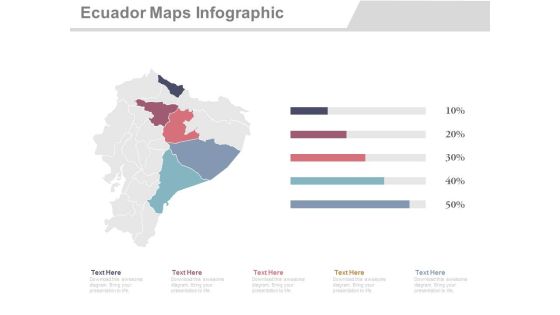
Ecuador Map With States Economic Analysis Powerpoint Slides
This PowerPoint template displays graphics of Ecuador map with different locations and percentage values. This Map template can be used in business presentations to depict economic analysis. This slide can also be used by school students for educational projects.
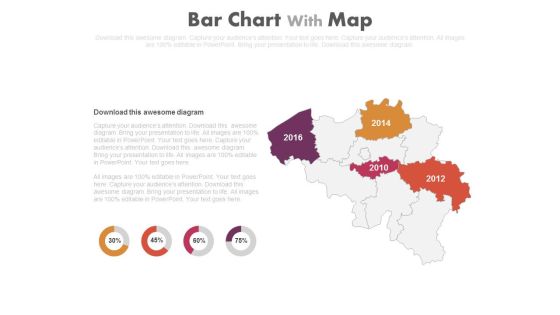
Map With Years And Percentage Charts Powerpoint Slides
This PowerPoint template displays map with years and percentage values. Our professionally designed map diagram is as an effective tool to display economic progress survey of particular areas. Above slide provide ideal backdrop to make business presentations.

Four Months Sales Statistics Chart Powerpoint Slides
This PowerPoint template has been designed with four shopping bags with percentage values. Download this PPT slide to display four months sales statistics. Add this slide to your presentation and impress your superiors.

Arrows Matrix For Business Vision Analysis Powerpoint Slides
This PowerPoint template has been designed with arrow matrix diagram. You may download this diagram slide to depict company?s vision, mission, goal and values. Add this slide to your presentation and impress your superiors.
Male Female Social Media Users Powerpoint Slides
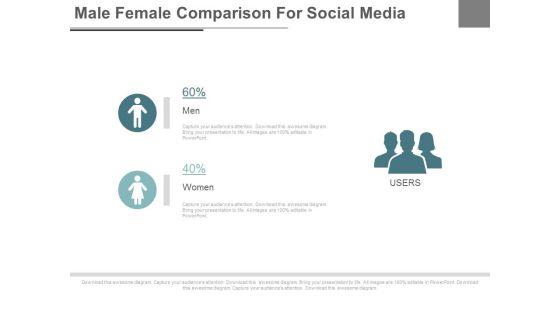
This PPT slide displays graphics of male female icons with percentage values. Use this PPT design to display male female ratios of social media users. This PowerPoint template can be customized as per requirements of business presentation.

Percentage Charts For Statistical Comparison Powerpoint Slides
This PowerPoint template has been chart of percentage values. You may download this diagram for statistical comparison and analysis. Add this PPT slide to your presentation and impress your superiors.

Bar Graph For Profit Growth Analysis Powerpoint Slides
This PowerPoint template has been designed with bar graph with percentage values. This diagram is useful to exhibit profit growth analysis. This diagram slide can be used to make impressive presentations.
Five Steps Financial Analysis Table Powerpoint Slides
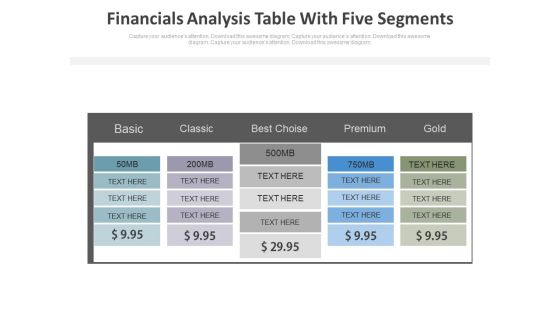
This PowerPoint template has been designed with dollar value pricing table chart. This PPT slide may be used for sample marketing proposal. Download this slide to build unique presentation.
Four Steps Pricing Option Chart Powerpoint Slides
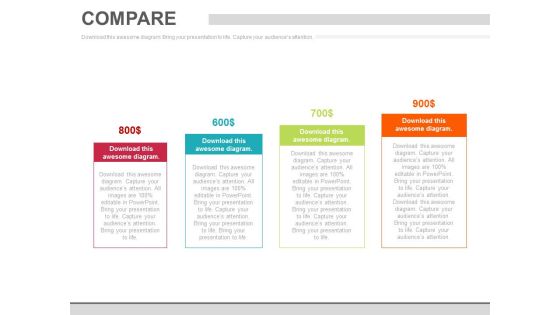
This PowerPoint template has been designed with dollar value pricing table chart. This PPT slide may be used for sample marketing proposal. Download this slide to build unique presentation.
Four Steps Pricing Table With Icons Powerpoint Slides
This PowerPoint template has been designed with dollar value pricing table chart. This PPT slide may be used for sample marketing proposal. Download this slide to build unique presentation.
Pie Charts For Relative Comparison Study Powerpoint Slides
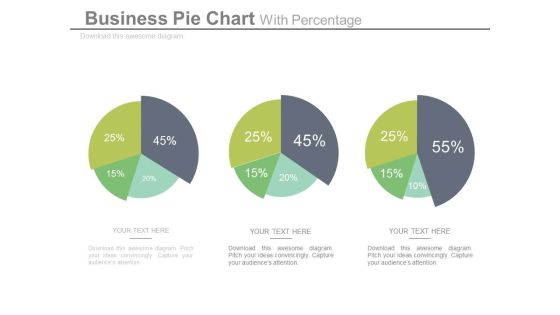
This power point template illustrates diagram of three pie charts with percentage values. This business slide can be used for relative comparison study. Present your views and ideas with this impressive slide.
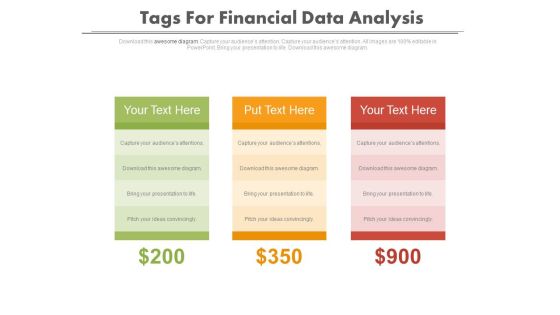
Tags For Financial Data Comparison Powerpoint Slides
Graphic of three text tag with dollar values has been used to design this power point template. This diagram may be used for financial data comparison. Use this diagram to build a professional presentation.

Map Diagram With Four Locations Powerpoint Slides
This PowerPoint template displays graphics of map diagram with four locations and percentage values. This Map template can be used in business presentations to depict economic analysis. This slide can also be used by school students for educational projects.
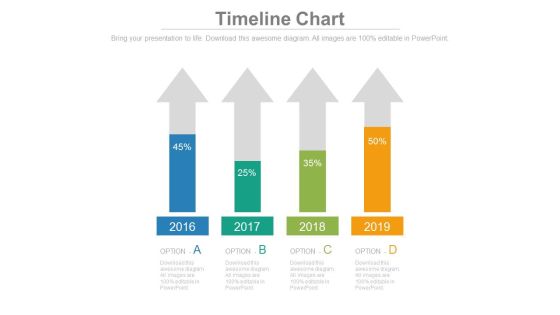
Four Arrows With Percentage Data Analysis Powerpoint Slides
This timeline template can be used for multiple purposes including financial planning, new milestones and tasks. It contains four upward arrows with percentage values. Download this PowerPoint timeline template to make impressive presentations.

Bar Graph With Increasing Percentage Flow Powerpoint Slides
This PowerPoint slide has been designed with bar graph and increasing percentage values. This diagram slide may be used to display profit growth. Prove the viability of your ideas with this professional slide.

Chart For Financial Percentage Analysis Powerpoint Slides
This PowerPoint template has been designed with financial chart with dollar icon. This PPT slide may be used to display dollar value analysis chart. Download this slide to build unique presentation.
Market Trends Chart With Percentage And Icons Powerpoint Slides
This PowerPoint template has been designed with graphics of chart with percentage values and icons. This PowerPoint template may be used to market trends and financial analysis. Prove the viability of your ideas using this impressive slide.

Skill Assessment Chart For Employee Performance Powerpoint Slides
Sliders with percentage values have been displayed in this business slide. This business diagram may be used as skill assessment chart. Download this PowerPoint template to build an exclusive presentation.

Three Person Tags With Skill Percentage Charts Powerpoint Slides
This PowerPoint template has been designed with three person?s tags with percentage values. This Info graphic diagram may be used to display team skill analysis. Download this impressive diagram to build unique presentations.

Column Chart For Financial Analysis Powerpoint Slides
This PowerPoint template has been designed with graphics of column chart with percentage values. You may use this business slide design for topics like financial analysis and planning. This PPT slide is powerful tool to describe your ideas.

Two Teams Performance Analysis Chart Powerpoint Slides
This PowerPoint template has been designed with icons of two teams with percentage values. Download this PPT slide to depict team?s performance analysis. Deliver amazing presentations to mesmerize your audience by using this PPT slide design.

Content Gap Analysis Ppt Powerpoint Presentation File Layouts
This is a content gap analysis ppt powerpoint presentation file layouts. The topics discussed in this diagram are agenda, target audiences, preferred by many, values client, strategy.This is a completely editable PowerPoint presentation, and is available for immediate download.

Seven Stages For ABC Analysis Of Stock Management Ppt PowerPoint Presentation File Microsoft PDF
Persuade your audience using this seven stages for abc analysis of stock management ppt powerpoint presentation file microsoft pdf. This PPT design covers seven stages, thus making it a great tool to use. It also caters to a variety of topics including list all items purchased and enter the unit cost, calculate the value of consumption for each item, calculate the percentage of total value represented by each item, choose cutoff points for a, b, and c, calculate the cumulative percentage of total value for each item, sort the list in descending order by total value, enter consumption quantities for each item. Download this PPT design now to present a convincing pitch that not only emphasizes the topic but also showcases your presentation skills
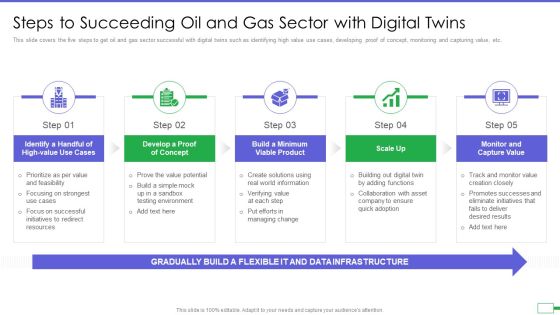
Iot And Digital Twin To Reduce Costs Post Covid Steps To Succeeding Oil And Gas Sector With Digital Slides PDF
This slide covers the five steps to get oil and gas sector successful with digital twins such as identifying high value use cases, developing proof of concept, monitoring and capturing value, etc. Presenting iot and digital twin to reduce costs post covid steps to succeeding oil and gas sector with digital slides pdf to provide visual cues and insights. Share and navigate important information on five stages that need your due attention. This template can be used to pitch topics like handful of high value use cases, develop a proof of concept, build a minimum viable product, scale up, monitor and capture value. In addtion, this PPT design contains high resolution images, graphics, etc, that are easily editable and available for immediate download.

Strategic Business Plan Effective Tools And Templates Set 2 Kotlers Pricing Strategies With Product Quality Diagrams PDF
This slide provides information regarding Kotlers Pricing Strategies which is strategic management tool which helps firms in position the product or services in context to competitors by considering different pricing strategies such as premium, high value, etc. This is a strategic business plan effective tools and templates set 2 kotlers pricing strategies with product quality diagrams pdf template with various stages. Focus and dispense information on nine stages using this creative set, that comes with editable features. It contains large content boxes to add your information on topics like premium strategy, high value strategy, overcharging strategy, mid value strategy, good value strategy. You can also showcase facts, figures, and other relevant content using this PPT layout. Grab it now.

Building Link Equity And Contributing Factors Training Ppt
This slide provides information regarding the link juice and multiple factors that determine the links actual value, such as relevancy, authoritativeness, anchor text, following, domain quality, link location and quantity on page, and HTTPS status.
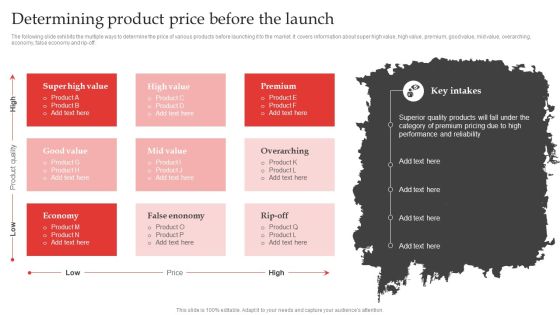
Red Ocean Technique Overcoming Competition Determining Product Price Before The Launch Inspiration PDF
The following slide exhibits the multiple ways to determine the price of various products before launching it to the market. It covers information about super high value, high value, premium, good value, mid value, overarching, economy, false economy and rip-off. Get a simple yet stunning designed Red Ocean Technique Overcoming Competition Determining Product Price Before The Launch Inspiration PDF. It is the best one to establish the tone in your meetings. It is an excellent way to make your presentations highly effective. So, download this PPT today from Slidegeeks and see the positive impacts. Our easy-to-edit Red Ocean Technique Overcoming Competition Determining Product Price Before The Launch Inspiration PDF can be your go-to option for all upcoming conferences and meetings. So, what are you waiting for. Grab this template today.

Intelligent Automation Services In Retail Industry Topics PDF
The purpose of this slide is to streamline manual and repetitive processes by automating, simplifying, and eliminating low value manual work. It helps with sales analytics, in-store planning, inventory management, and return processing. Persuade your audience using this Intelligent Automation Services In Retail Industry Topics PDF. This PPT design covers four stages, thus making it a great tool to use. It also caters to a variety of topics including Sales Analytics, Inventory Management, Returns Processing. Download this PPT design now to present a convincing pitch that not only emphasizes the topic but also showcases your presentation skills.

What Is Parallel Processing Circular Stages 7 Arrows Description PowerPoint Slide
We present our what is parallel processing circular stages 7 arrows description PowerPoint Slide.Download our Circle Charts PowerPoint Templates because It will mark the footprints of your journey. Illustrate how they will lead you to your desired destination. Download our Process and Flows PowerPoint Templates because They will Put the wind in your sails. Skim smoothly over the choppy waters of the market. Download and present our Business PowerPoint Templates because Our PowerPoint Templates and Slides will give you great value for your money. Be assured of finding the best projection to highlight your words. Download and present our Shapes PowerPoint Templates because You are working at that stage with an air of royalty. Let our PowerPoint Templates and Slides be the jewels in your crown. Present our Success PowerPoint Templates because Our PowerPoint Templates and Slides will let your team Walk through your plans. See their energy levels rise as you show them the way.Use these PowerPoint slides for presentations relating to Advertising, arrow, background, banner,blue, bookmark, card, choice, circle,concept, creative, design, flow, idea,illustration, infographic, instruction, label,layout, manual, marketing, modern, next,number, offer, one, options, order, page,paper, process, product, promotion, red,sequence, simple, step, symbol, tab, tutorial. The prominent colors used in the PowerPoint template are Green, Gray, White. Use our what is parallel processing circular stages 7 arrows description PowerPoint Slide are the best it can get when it comes to presenting. Use our banner PowerPoint templates and PPT Slides provide great value for your money. Be assured of finding the best projection to highlight your words. Presenters tell us our what is parallel processing circular stages 7 arrows description PowerPoint Slide are specially created by a professional team with vast experience. They diligently strive to come up with the right vehicle for your brilliant Ideas. PowerPoint presentation experts tell us our circle PowerPoint templates and PPT Slides provide great value for your money. Be assured of finding the best projection to highlight your words. Customers tell us our what is parallel processing circular stages 7 arrows description PowerPoint Slide provide great value for your money. Be assured of finding the best projection to highlight your words. Professionals tell us our bookmark PowerPoint templates and PPT Slides look good visually.

Social Enterprise Funding Revenue Model Ppt PowerPoint Presentation Show File Formats PDF
Presenting this set of slides with name social enterprise funding revenue model ppt powerpoint presentation show file formats pdf. This is a nine stage process. The stages in this process are recurring revenue frequency, gross and net revenue, business, example showing basic math, cash collections immediately 30 90 days, expected conversion rate to get a paid client, expected arpu, life time value of a customer. This is a completely editable PowerPoint presentation and is available for immediate download. Download now and impress your audience.

Social Enterprise Funding Revenue Streams Ppt PowerPoint Presentation Model Graphics Design PDF
Presenting this set of slides with name social enterprise funding revenue streams ppt powerpoint presentation model graphics design pdf. This is a four stage process. The stages in this process are recurring revenue frequency, gross and net revenue, business, example showing basic math, cash collections immediately 30 90 days, expected conversion rate to get a paid client, expected arpu, life time value of a customer. This is a completely editable PowerPoint presentation and is available for immediate download. Download now and impress your audience.
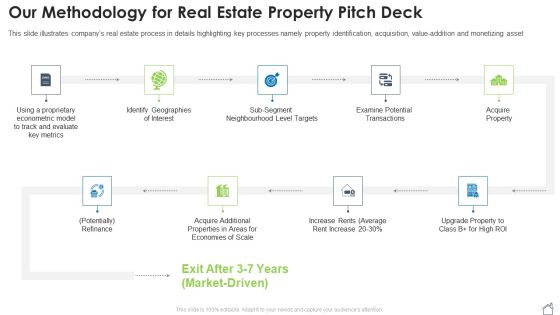
Our Methodology For Real Estate Property Pitch Deck Ppt Inspiration Portrait PDF
This slide illustrates companys real estate process in details highlighting key processes namely property identification, acquisition, value-addition and monetizing asset This is a our methodology for real estate property pitch deck ppt inspiration portrait pdf template with various stages. Focus and dispense information on nine stages using this creative set, that comes with editable features. It contains large content boxes to add your information on topics like econometric, proprietary, model, geographies, neighbourhood. You can also showcase facts, figures, and other relevant content using this PPT layout. Grab it now.
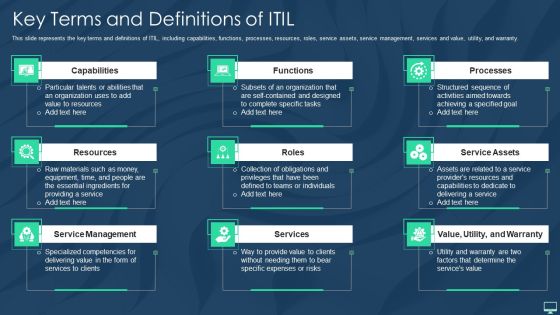
Key Terms And Definitions Of ITIL Ppt Portfolio Deck PDF
This slide represents the key terms and definitions of ITIL, including capabilities, functions, processes, resources, roles, service assets, service management, services and value, utility, and warranty. This is a key terms and definitions of itil ppt portfolio deck pdf template with various stages. Focus and dispense information on nine stages using this creative set, that comes with editable features. It contains large content boxes to add your information on topics like capabilities, resources, service management, service assets, processes. You can also showcase facts, figures, and other relevant content using this PPT layout. Grab it now.
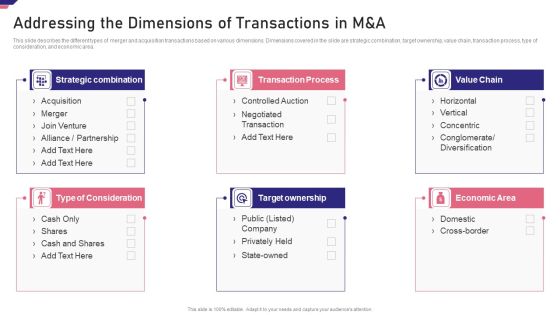
Mergers Acquisition Playbook Mergers Acquisition Playbook Addressing The Dimensions Demonstration PDF
This slide describes the different types of merger and acquisition transactions based on various dimensions. Dimensions covered in the slide are strategic combination, target ownership, value chain, transaction process, type of consideration, and economic area.This is a Mergers Acquisition Playbook Mergers Acquisition Playbook Addressing The Dimensions Demonstration PDF template with various stages. Focus and dispense information on six stages using this creative set, that comes with editable features. It contains large content boxes to add your information on topics like Strategic Combination, Transaction Process, Target Ownership You can also showcase facts, figures, and other relevant content using this PPT layout. Grab it now.

Our Methodology For Real Estate Capital Pitch Deck PowerPoint Presentation PPT Template PDF
This slide illustrates companys real estate process in details highlighting key processes namely property identification, acquisition, value addition and monetizing asset. Presenting Our Methodology For Real Estate Capital Pitch Deck PowerPoint Presentation PPT Template PDF to provide visual cues and insights. Share and navigate important information on nine stages that need your due attention. This template can be used to pitch topics like Identify Geographies, Examine Potential Transactions, Acquire Property. In addtion, this PPT design contains high resolution images, graphics, etc, that are easily editable and available for immediate download.

Our Methodology Commercial Building Capital Funding Elevator Pitch Deck Formats PDF
This slide illustrates companys real estate process in details highlighting key processes namely property identification, acquisition, value-addition and monetizing asset Presenting Our Methodology Commercial Building Capital Funding Elevator Pitch Deck Formats PDF to provide visual cues and insights. Share and navigate important information on nine stages that need your due attention. This template can be used to pitch topics like Evaluate Key Metrics, Econometric, Average. In addtion, this PPT design contains high resolution images, graphics, etc, that are easily editable and available for immediate download.
 Home
Home