Growth

Bar Graph Ppt PowerPoint Presentation Ideas Diagrams
This is a bar graph ppt powerpoint presentation ideas diagrams. This is a twelve stage process. The stages in this process are jan, feb, mar, apr, may, growth.

Area Chart Ppt PowerPoint Presentation Infographics Backgrounds
This is a area chart ppt powerpoint presentation infographics backgrounds. This is a two stage process. The stages in this process are business, marketing, chart, growth, product.

Column Chart Ppt PowerPoint Presentation Icon Graphics Pictures
This is a column chart ppt powerpoint presentation icon graphics pictures. This is a nine stage process. The stages in this process are product, growth, year, chart, management.

Bar Graph Ppt PowerPoint Presentation Pictures Graphics Pictures
This is a bar graph ppt powerpoint presentation pictures graphics pictures. This is a five stage process. The stages in this process are graph, growth, business, marketing, finance.

Cost Per Employee Ppt PowerPoint Presentation Show Designs
This is a cost per employee ppt powerpoint presentation show designs. This is a six stage process. The stages in this process are growth, business, finance, marketing, graph.

Line Chart Ppt PowerPoint Presentation Ideas Deck
This is a line chart ppt powerpoint presentation ideas deck. This is a two stage process. The stages in this process are business, marketing, finance, growth.
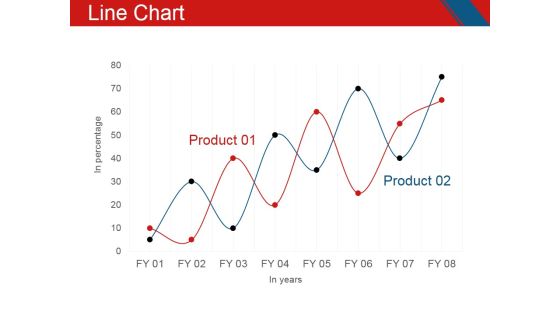
Line Chart Ppt PowerPoint Presentation File Layout
This is a line chart ppt powerpoint presentation file layout. This is a two stage process. The stages in this process are business, management, growth, product, marketing.

Column Chart Ppt Powerpoint Presentation Professional Model
This is a column chart ppt powerpoint presentation professional model. This is a two stage process. The stages in this process are product, dollars in thousands, graph, growth.

Combo Chart Ppt PowerPoint Presentation Infographics Slideshow
This is a combo chart ppt powerpoint presentation infographics slideshow. This is a three stage process. The stages in this process are business, marketing, graph, line chart, growth.

Bar Graph Ppt PowerPoint Presentation File Show
This is a bar graph ppt powerpoint presentation file show. This is a four stage process. The stages in this process are business, marketing, graph, growth, finance.

Security Analysis Ppt Powerpoint Presentation File Tips
This is a security analysis ppt powerpoint presentation file tips. This is a one stage process. The stages in this process are graph, marketing, business, growth, finance.

Area Chart Ppt PowerPoint Presentation Professional Display
This is a area chart ppt powerpoint presentation professional display. This is a two stage process. The stages in this process are business, finance, growth, strategy, marketing, analysis.

Combo Chart Ppt PowerPoint Presentation Pictures Background
This is a combo chart ppt powerpoint presentation pictures background. This is a eight stage process. The stages in this process are combo chart, growth, strategy, analysis, business.

Area Chart Ppt PowerPoint Presentation Slides Inspiration
This is a area chart ppt powerpoint presentation slides inspiration. This is a two stage process. The stages in this process are business, marketing, finance, growth, management.
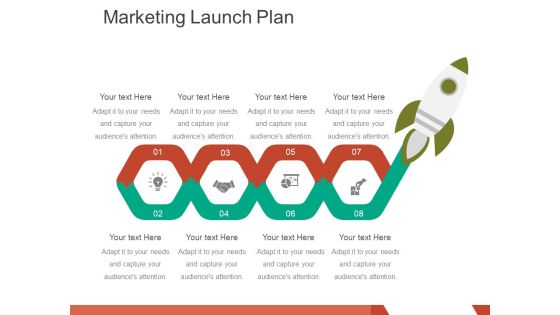
Marketing Launch Plan Ppt PowerPoint Presentation Professional Graphics
This is a marketing launch plan ppt powerpoint presentation professional graphics. This is a four stage process. The stages in this process are icons, business, management, growth.

Bar Graph Ppt PowerPoint Presentation Show Guidelines
This is a bar graph ppt powerpoint presentation show guidelines. This is a four stage process. The stages in this process are product, growth, business, finance, bar graph.

Area Chart Ppt PowerPoint Presentation Layouts Styles
This is a area chart ppt powerpoint presentation layouts styles. This is a two stage process. The stages in this process are business, marketing, strategy, planning, growth.

Scatter Chart Ppt PowerPoint Presentation Gallery Guide
This is a scatter chart ppt powerpoint presentation gallery guide. This is a one stage process. The stages in this process are profit, product, in percentage, growth, success.

Stacked Column Ppt PowerPoint Presentation Outline Information
This is a stacked column ppt powerpoint presentation outline information. This is a two stage process. The stages in this process are profit, product, bar graph, growth, success.

Clustered Column Line Ppt PowerPoint Presentation Layouts Structure
This is a clustered column line ppt powerpoint presentation layouts structure. This is a three stage process. The stages in this process are product, profit, graph, growth, success.

Scatter Chart Ppt PowerPoint Presentation Ideas Professional
This is a scatter chart ppt powerpoint presentation ideas professional. This is a one stage process. The stages in this process are product, percentage, growth, success, line graph.

Area Chart Ppt PowerPoint Presentation Model Format
This is a area chart ppt powerpoint presentation model format. This is a two stage process. The stages in this process are business, marketing, finance, graph, growth.
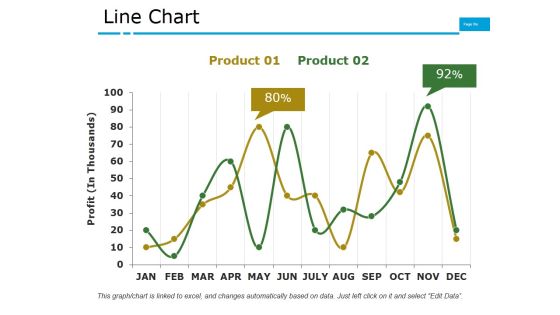
Line Chart Ppt PowerPoint Presentation File Graphics Pictures
This is a line chart ppt powerpoint presentation file graphics pictures. This is a two stage process. The stages in this process are business, marketing, finance, graph, growth.
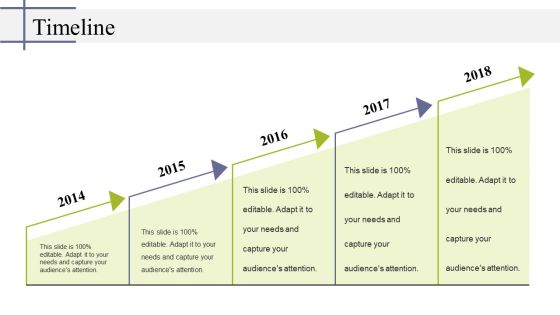
Timeline Ppt PowerPoint Presentation Model Professional
This is a timeline ppt powerpoint presentation model professional. This is a five stage process. The stages in this process are timeline, growth, analysis, process, planning, business.

Line Chart Ppt PowerPoint Presentation Model Sample
This is a line chart ppt powerpoint presentation model sample. This is a two stage process. The stages in this process are business, marketing, planning, finance, growth.

Column Chart Ppt PowerPoint Presentation Show Images
This is a column chart ppt powerpoint presentation show images. This is a two stage process. The stages in this process are product, expenditure, years, bar graph, growth.

Combo Chart Ppt PowerPoint Presentation Gallery Background Designs
This is a combo chart ppt powerpoint presentation gallery background designs. This is a two stage process. The stages in this process are business, marketing, planning, finance, growth.
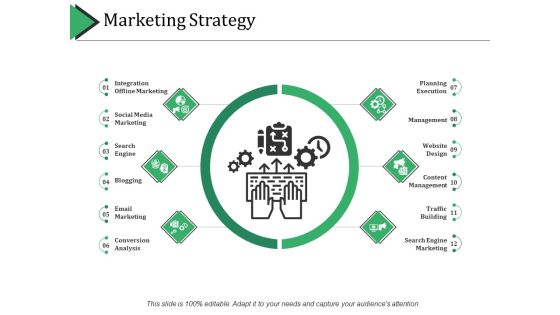
Marketing Strategy Ppt PowerPoint Presentation Summary Deck
This is a marketing strategy ppt powerpoint presentation summary deck. This is a six stage process. The stages in this process are line chart, finance, growth, strategy, business.

Column Chart Ppt PowerPoint Presentation Professional Template
This is a column chart ppt powerpoint presentation professional template. This is a two stage process. The stages in this process are product, percentage, finance, bar graph, growth.

Combo Chart Ppt PowerPoint Presentation Summary Graphics Example
This is a combo chart ppt powerpoint presentation summary graphics example. This is a three stage process. The stages in this process are product, growth, marketing.

Clustered Column Line Ppt PowerPoint Presentation Layouts
This is a clustered column line ppt powerpoint presentation layouts. This is a three stage process. The stages in this process are growth, marketing, strategy, planning, finance.

Stacked Line Chart Ppt PowerPoint Presentation Styles Graphics
This is a stacked line chart ppt powerpoint presentation styles graphics. This is a two stage process. The stages in this process are product, year, profit, percentage, growth.

Line Chart Ppt PowerPoint Presentation Model Model
This is a line chart ppt powerpoint presentation model model. This is a two stage process. The stages in this process are line chart, growth, strategy, business, analysis.

Column Chart Ppt PowerPoint Presentation Outline Background Image
This is a column chart ppt powerpoint presentation outline background image. This is a two stage process. The stages in this process are product, column chart, growth.

Column Chart Ppt PowerPoint Presentation Gallery Show
This is a column chart ppt powerpoint presentation gallery show. This is a two stage process. The stages in this process are column chart, product, year, expenditure, growth.

Comparison Ppt PowerPoint Presentation Ideas Show
This is a comparison ppt powerpoint presentation ideas show. This is a two stage process. The stages in this process are comparison, bar graph, growth, management, business.

Combo Chart Ppt PowerPoint Presentation Infographic Template Maker
This is a combo chart ppt powerpoint presentation infographic template maker. This is a three stage process. The stages in this process are business, finance, growth, investment, marketing.

Bar Graph To Show Company Sales Budget Ppt PowerPoint Presentation Sample
This is a bar graph to show company sales budget ppt powerpoint presentation sample. This is a four stage process. The stages in this process are business, finance, growth, success, marketing, arrow.

Bar Graph For Sales Revenue Over The Years Ppt PowerPoint Presentation Professional
This is a bar graph for sales revenue over the years ppt powerpoint presentation professional. This is a nine stage process. The stages in this process are business, marketing, growth, bar, years.
Stacked Column Ppt PowerPoint Presentation Icon Deck Ppt PowerPoint Presentation Pictures Infographic Template
This is a stacked column ppt powerpoint presentation icon deck ppt powerpoint presentation pictures infographic template. This is a two stage process. The stages in this process are stacked column, sales, percentage, product, growth.

Area Chart Ppt PowerPoint Presentation Ideas Icon
This is a area chart ppt powerpoint presentation ideas icon. This is a two stage process. The stages in this process are product, area chart, sales in percentage, growth, success.

Competitor Market Share And Sales Revenues Ppt PowerPoint Presentation Model Graphic Images
This is a competitor market share and sales revenues ppt powerpoint presentation model graphic images. This is a five stage process. The stages in this process are competitor, own business, growth, success.
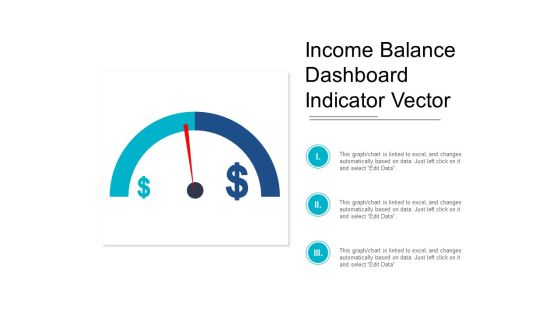
Income Balance Dashboard Indicator Vector Ppt PowerPoint Presentation Professional Diagrams
This is a income balance dashboard indicator vector ppt powerpoint presentation professional diagrams. This is a three stage process. The stages in this process are growth, increase sales, increase revenue.

Bar Chart Ppt PowerPoint Presentation Icon Information
This is a bar chart ppt powerpoint presentation icon information. This is a one stage process. The stages in this process are product, sales in percentage, financial years, bar graph, growth.
Some Quick Facts Ppt PowerPoint Presentation Layouts Icons
This is a some quick facts ppt powerpoint presentation layouts icons. This is a three stage process. The stages in this process are customers, sales growth, staff work weekly.

Clustered Column Line Ppt PowerPoint Presentation Show Influencers
This is a clustered column line ppt powerpoint presentation show influencers. This is a four stage process. The stages in this process are financial year, sales in percentage, product, growth, success.

Line Chart Ppt PowerPoint Presentation Layouts Example
This is a line chart ppt powerpoint presentation layouts example. This is a two stage process. The stages in this process are sales in percentage, product, financial years, growth, success.

Bar Diagram Ppt PowerPoint Presentation Gallery Structure
This is a bar diagram ppt powerpoint presentation gallery structure. This is a three stage process. The stages in this process are financial in years, sales in percentage, bar graph, growth, success.

Column Chart Ppt PowerPoint Presentation Layouts Tips
This is a column chart ppt powerpoint presentation layouts tips. This is a six stage process. The stages in this process are sales in percentage, financial year, bar graph, growth, success.

Bar Diagram Ppt PowerPoint Presentation Pictures Background Image
This is a bar diagram ppt powerpoint presentation pictures background image. This is a three stage process. The stages in this process are financial in years, sales in percentage, bar graph, growth, success.
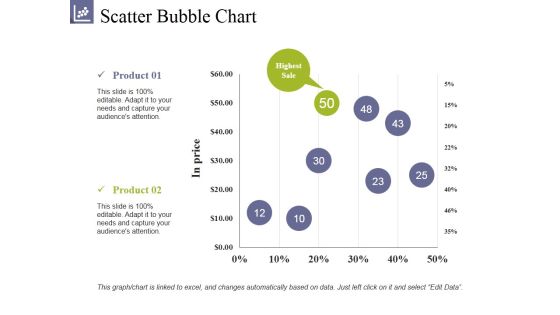
Scatter Bubble Chart Ppt PowerPoint Presentation Summary Clipart
This is a scatter bubble chart ppt powerpoint presentation summary clipart. This is a two stage process. The stages in this process are product, highest sale, in prices, growth, success.

Bar Graph Ppt PowerPoint Presentation Ideas Graphic Tips
This is a bar graph ppt powerpoint presentation ideas graphic tips. This is a three stage process. The stages in this process are financial year, sales in percentage, product, bar graph, growth.

Clustered Column Line Ppt PowerPoint Presentation Portfolio Outline
This is a clustered column line ppt powerpoint presentation portfolio outline. This is a four stage process. The stages in this process are sales in percentage, financial year, product, graph, growth.

Column Chart Ppt PowerPoint Presentation Gallery Slide Portrait
This is a column chart ppt powerpoint presentation gallery slide portrait. This is a two stage process. The stages in this process are sales in percentage, financial year, product, bar graph, growth.

Column Chart Ppt PowerPoint Presentation Ideas Vector
This is a column chart ppt powerpoint presentation ideas vector. This is a two stage process. The stages in this process are column chart, product, financial years, sales in percentage, growth.

Bubble Chart Ppt PowerPoint Presentation Infographic Template Layouts
This is a bubble chart ppt powerpoint presentation infographic template layouts. This is a two stage process. The stages in this process are bubble chart, product, sales in percentage, growth.

Column Chart Ppt PowerPoint Presentation Slides Show
This is a column chart ppt powerpoint presentation slides show. This is a two stage process. The stages in this process are column chart, product, sales in percentage, financial year, growth.

Column Chart Ppt PowerPoint Presentation Slides Visual Aids
This is a column chart ppt powerpoint presentation slides visual aids. This is a six stage process. The stages in this process are bar graph, growth, success, sales in percentage, financial year.

Line Chart Ppt PowerPoint Presentation Show Guide
This is a line chart ppt powerpoint presentation show guide. This is a two stage process. The stages in this process are product, sales in percentage, financial years, growth, success.

Bar Graph Ppt PowerPoint Presentation Portfolio Slide Portrait
This is a bar graph ppt powerpoint presentation portfolio slide portrait. This is a three stage process. The stages in this process are product, sales in percentage, bar graph, growth, success.
 Home
Home