Growth Arrows

PowerPoint Template Leadership Onion Ppt Slides
PowerPoint Template Leadership Onion PPT Slides-Some are bound to be highly profitable for you to follow up. Put all this brilliant views to your audience.-PowerPoint Template Leadership Onion PPT Slides

PowerPoint Presentation Sales Onion Ppt Slides
PowerPoint Presentation Sales Onion PPT Slides-Some are bound to be highly profitable for you to follow up. Put all this brilliant views to your audience.-PowerPoint Presentation Sales Onion PPT Slides

PowerPoint Process Diagram Onion Ppt Theme
PowerPoint Process Diagram Onion PPT Theme-Some are bound to be highly profitable for you to follow up. Put all this brilliant views to your audience.-PowerPoint Process Diagram Onion PPT Theme
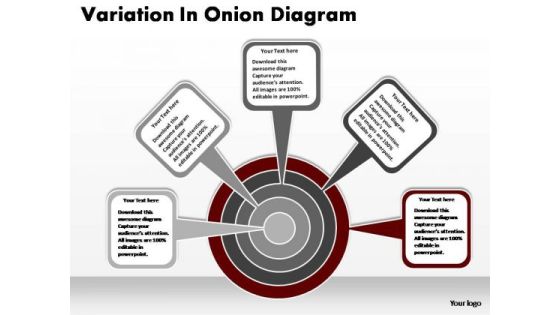
PowerPoint Process Strategy Onion Ppt Themes
PowerPoint Process Strategy Onion PPT Themes-Some are bound to be highly profitable for you to follow up. Put all this brilliant views to your audience.-PowerPoint Process Strategy Onion PPT Themes

Market And Customer Segmentation Ppt Images
This is a market and customer segmentation ppt images. This is a four stage process. The stages in this process are market and customer segmentation, identification of profit pools, brand positioning and development, customer solution pricing.

Overview Of Capital Budgeting Powerpoint Guide
This is a organizational learning models ppt example. This is a five stage process. The stages in this process are net present value, internal rate of return, profitability index, payback, discounted payback.

Cycle Of Management Accounting Tools Ppt Example Of Ppt
This is a cycle of management accounting tools ppt example of ppt. This is a four stage process. The stages in this process are balance sheet, profit and loss account, cash flow statement, fund flow statement.\n\n\n\n\n\n\n\n\n\n\n\n\n\n\n\n\n\n

Market Competitive Analysis Powerpoint Slide Deck
This is a market competitive analysis powerpoint slide deck. This is a six stage process. The stages in this process are customer analysis, true capabilities analysis, market competitive analysis, positioning and differentiating, segmenting and targeting, data mining and profiting.

E Commerce Strategy Layout Sample Diagram Powerpoint Ideas
This is a e commerce strategy layout sample diagram powerpoint ideas. This is a six stage process. The stages in this process are people and culture, the offer, infrastructure, customers, channels, profit, strategy.\n\n\n\n

Leadership Development Process Diagram Ppt Images
This is a leadership development process diagram ppt images. This is a seven stage process. The stages in this process are individual coaching, evaluation, greater profit, team training, assess needs, build rapport, set context.
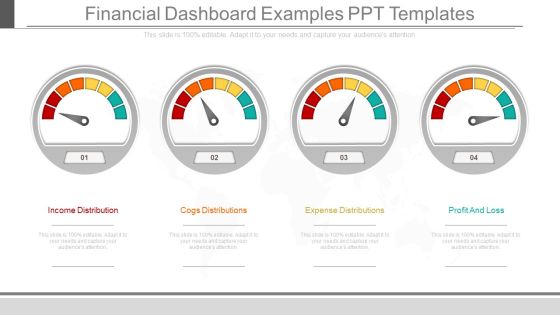
Financial Dashboard Examples Ppt Templates
This is a financial dashboard examples ppt templates. This is a four stage process. The stages in this process are income distribution, cogs distributions, expense distributions, profit and loss.
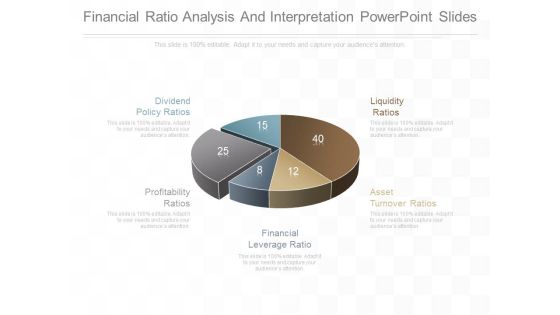
Financial Ratio Analysis And Interpretation Powerpoint Slides
This is a financial ratio analysis and interpretation powerpoint slides. This is a five stage process. The stages in this process are dividend policy ratios, profitability ratios, financial leverage ratio, asset turnover ratios, liquidity ratios.

Pricing Objectives Diagram Sample Of Ppt Presentation
This is a pricing objectives diagram sample of ppt presentation. This is a seven stage process. The stages in this process are pricing objectives, revenue maximization, profit maximization, partial cost recovery, survival, status quo, quantity leader, maximize quantity.
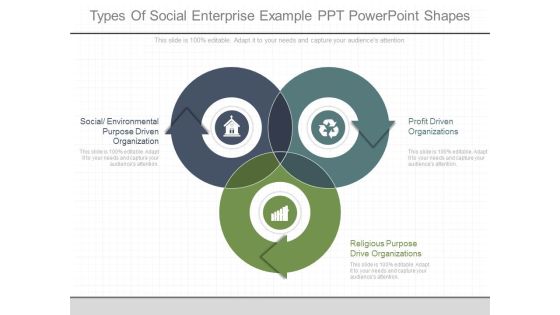
Types Of Social Enterprise Example Ppt Powerpoint Shapes
This is a types of social enterprise example ppt powerpoint shapes. This is a three stage process. The stages in this process are social environmental purpose driven organization, profit driven organizations, religious purpose drive organizations.
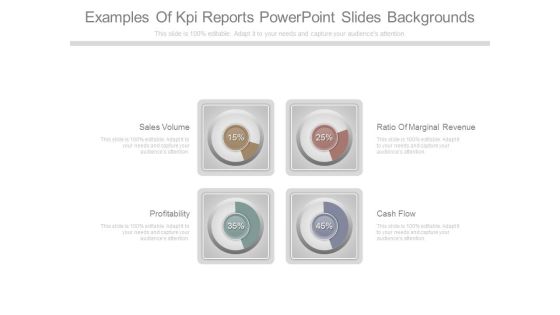
Examples Of Kpi Reports Powerpoint Slides Backgrounds
This is a examples of kpi reports powerpoint slides backgrounds. This is a four stage process. The stages in this process are sales volume, profitability, ratio of marginal revenue, cash flow.
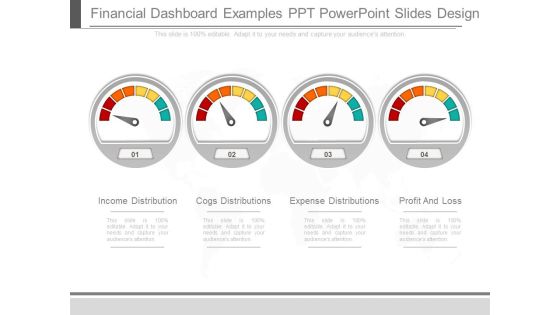
Financial Dashboard Examples Ppt Powerpoint Slides Design
This is a financial dashboard examples ppt powerpoint slides design. This is a four stage process. The stages in this process are income distribution, cogs distributions, expense distributions, profit and loss.

Factors Of Just In Time Budgeting Ppt Powerpoint Templates Download
This is a factors of just in time budgeting ppt powerpoint templates download. This is a six stage process. The stages in this process are evaluate managers, profitability index, net present value npv, discounted payback, communicate plans, control resources.
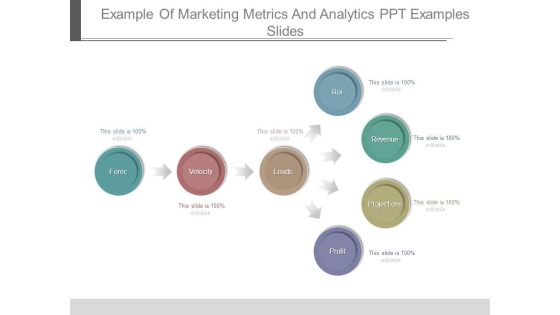
Example Of Marketing Metrics And Analytics Ppt Examples Slides
This is a example of marketing metrics and analytics ppt examples slides. This is a seven stage process. The stages in this process are forec, velocity, leads, roi, revenue, projections, profit.

Startup Advertising Template Diagram Ppt Diagrams
This is a startup advertising template diagram ppt diagrams. This is a eight stage process. The stages in this process are startup marketing, search engine optimization, investment knowledge, skills, virality in product, press, idea, profit, naming.

Payback Method Template Ppt Presentation Examples
This is a payback method template ppt presentation examples. This is a five stage process. The stages in this process are payback period, net present value, cash flows, profitability index, internal rate of return.
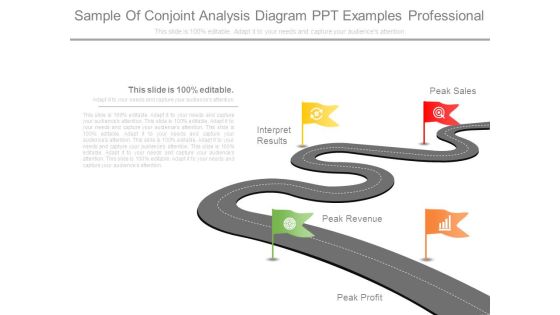
Sample Of Conjoint Analysis Diagram Ppt Examples Professional
This is a sample of conjoint analysis diagram ppt examples professional. This is a four stage process. The stages in this process are peak profit, peak revenue, interpret results, peak sales.

Tips For Effective Internal Communications Template Ppt Layout
This is a tips for effective internal communications template ppt layout. This is a five stage process. The stages in this process are informing employee, obtaining feedback, executive, strategy, profits.

Kpis And Operations Metrics Presentation Powerpoint Example
This is a kpis and operations metrics presentation powerpoint example. This is a five stage process. The stages in this process are customer class, affiliate, sales by warehouse, warehouse, profit by affiliate.
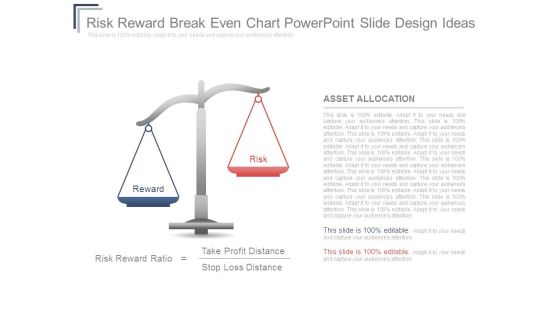
Risk Reward Breakeven Chart Powerpoint Slide Design Ideas
This is a risk reward breakeven chart powerpoint slide design ideas. This is a two stage process. The stages in this process are reward, risk, asset allocation, risk reward ratio, take profit distance, stop loss distance.

Balance Risk And Reward Example Powerpoint Slide Backgrounds
This is a balance risk and reward example powerpoint slide backgrounds. This is a two stage process. The stages in this process are reward, risk, risk reward ratio, take profit distance, stop loss distance.
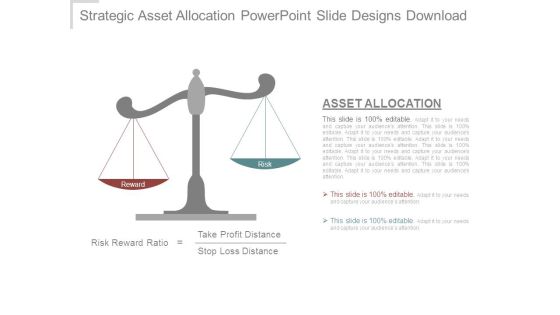
Strategic Asset Allocation Powerpoint Slide Designs Download
This is a strategic asset allocation powerpoint slide designs download. This is a two stage process. The stages in this process are reward, risk, risk reward ratio, take profit distance, stop loss distance, asset allocation.

Criteria Based Competition Comparison Table Powerpoint Slides
This is a criteria based competition comparison table powerpoint slides. This is a seven stage process. The stages in this process are revenue, profit, market share, main activity, number of employee, product quality.
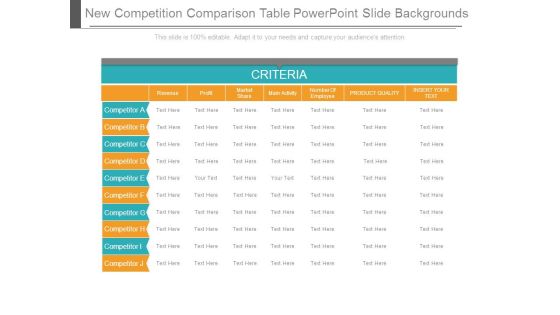
New Competition Comparison Table Powerpoint Slide Backgrounds
This is a new competition comparison table powerpoint slide backgrounds. This is a seven stage process. The stages in this process are revenue, profit, market share, main activity, number of employee, product quality, insert your text.

Financial Analysis And Management Powerpoint Slides
This is a financial analysis and management powerpoint slides. This is a eight stage process. The stages in this process are cash flow, monitoring, actionable reports, investment decision, analysis, financial, analysis and management, planning, key drivers, drive profitability.

Competition Comparison Table With New Criteria Powerpoint Ideas
This is a competition comparison table with new criteria powerpoint ideas. This is a seven stage process. The stages in this process are revenu, profit, market share, main activity, number of employee, product quality, insert your text.
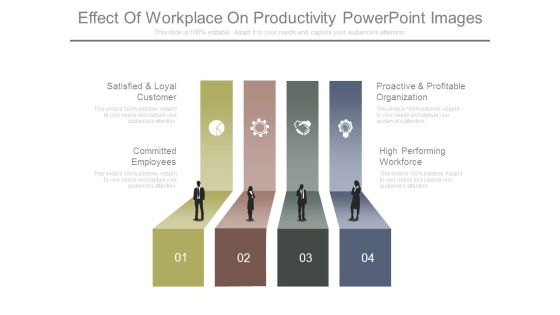
Effect Of Workplace On Productivity Powerpoint Images
This is a effect of workplace on productivity powerpoint images. This is a four stage process. The stages in this process are satisfied and loyal customer, committed employees, proactive and profitable organization, high performing workforce.

Competition Comparison Criteria Review Table Powerpoint Slide Templates Download
This is a competition comparison criteria review table powerpoint slide templates download. This is a six stage process. The stages in this process are criteria, competitor revenue, profit, market share, main activity, number of employee, product quality, insert your text.

Competitor Analysis Tools Ppt PowerPoint Presentation Example File
This is a competitor analysis tools ppt powerpoint presentation example file. This is a five stage process. The stages in this process are criteria, revenue, profit, market share, main activity, number of employee, product quality.
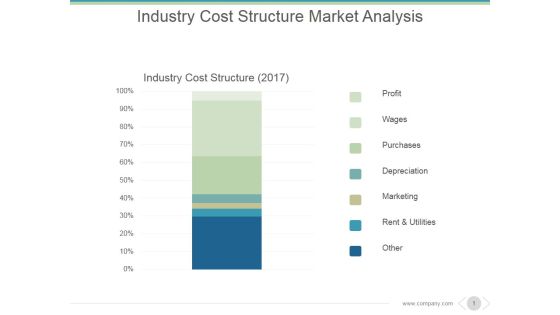
Industry Cost Structure Market Analysis Ppt PowerPoint Presentation Deck
This is a industry cost structure market analysis ppt powerpoint presentation deck. This is a seven stage process. The stages in this process are profit, wages, purchases, depreciation, marketing, rent and utilities.

Competition Comparison Table Ppt PowerPoint Presentation Outline
This is a competition comparison table ppt powerpoint presentation outline. This is a seven stage process. The stages in this process are revenue, profit, market share, main activity, number of employee, product quality.

Competitor Analysis Template Ppt PowerPoint Presentation Guidelines
This is a competitor analysis template ppt powerpoint presentation guidelines. This is a five stage process. The stages in this process are revenue, profit, market share, competitor, number of employee.

Asset Allocation Ppt PowerPoint Presentation Show
This is a asset allocation ppt powerpoint presentation show. This is a two stage process. The stages in this process are reward, risk, take profit distance, stop loss distance.

Competition Comparison Table Ppt PowerPoint Presentation Backgrounds
This is a competition comparison table ppt powerpoint presentation backgrounds. This is a seven stage process. The stages in this process are revenue, profit, market share , main activity, number of employee, product quality , insert your text.

Asset Allocation Ppt PowerPoint Presentation Design Templates
This is a asset allocation ppt powerpoint presentation design templates. This is a two stage process. The stages in this process are risk reward ratio, take profit distance, stop loss distance.
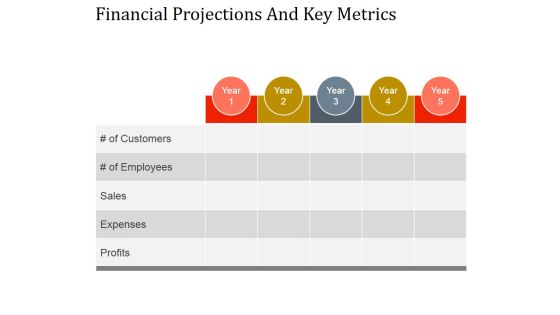
Financial Projections And Key Metrics Ppt PowerPoint Presentation Designs
This is a financial projections and key metrics ppt powerpoint presentation designs. This is a five stage process. The stages in this process are profits, expenses, sales, of employees, of customers.
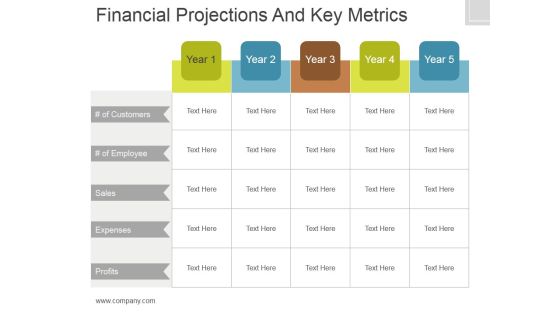
Financial Projections And Key Metrics Ppt PowerPoint Presentation Show
This is a financial projections and key metrics ppt powerpoint presentation show. This is a five stage process. The stages in this process are of customers, sales, expenses, profits.
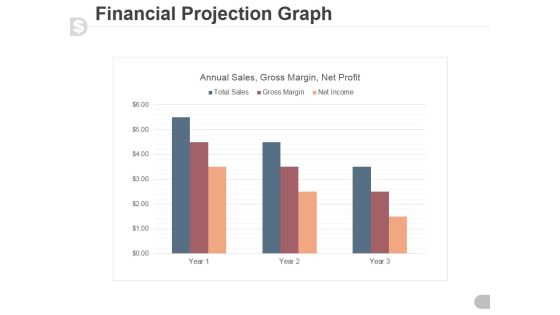
Financial Projection Graph Template 1 Ppt PowerPoint Presentation Guide
This is a financial projection graph template 1 ppt powerpoint presentation guide. This is a three stage process. The stages in this process are annual sales, gross margin, net profit.

Competitor Analysis Template Ppt PowerPoint Presentation Ideas
This is a competitor analysis template ppt powerpoint presentation ideas. This is a five stage process. The stages in this process are revenue, profit, market share, number of employee, product quality, main activity, revenue.

Asset Allocation Ppt PowerPoint Presentation Sample
This is a asset allocation ppt powerpoint presentation sample. This is a two stage process. The stages in this process are risk, reward, risk reward ratio, take profit distance.

Competitor Analysis Comparison Table Ppt PowerPoint Presentation Infographic Template Graphics
This is a competitor analysis comparison table ppt powerpoint presentation infographic template graphics. This is a seven stage process. The stages in this process are profit, revenue, market share, main activity, criteria.

Competitor Analysis Comparison Table Ppt PowerPoint Presentation Icon Designs Download
This is a competitor analysis comparison table ppt powerpoint presentation icon designs download. This is a seven stage process. The stages in this process are revenue, profit, market share, main activity, number of employee, product quality.

Competitor Analysis Comparison Table Ppt PowerPoint Presentation Infographics Design Inspiration
This is a competitor analysis comparison table ppt powerpoint presentation infographics design inspiration. This is a seven stage process. The stages in this process are revenue, profit, market share, main activity.

Key Financial Ratio Template 3 Ppt PowerPoint Presentation Slides Inspiration
This is a key financial ratio template 3 ppt powerpoint presentation slides inspiration. This is a four stage process. The stages in this process are liquidity, profitability, activity, solvency.

Financials Base Plan Ppt Powerpoint Presentation Slides Design Inspiration
This is a financials base plan ppt powerpoint presentation slides design inspiration. This is a four stage process. The stages in this process are financial summary, revenue, cost of sales, gross profit.
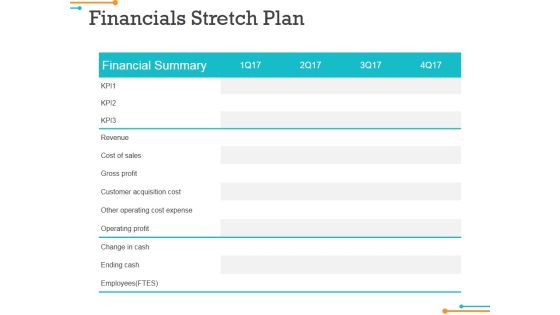
Financials Stretch Plan Ppt Powerpoint Presentation Infographics Background Image
This is a financials stretch plan ppt powerpoint presentation infographics background image. This is a four stage process. The stages in this process are financial summary, revenue, cost of sales, gross profit.

Calculating Customer Lifetime Value Clv Ppt PowerPoint Presentation Show Icon
This is a calculating customer lifetime value clv ppt powerpoint presentation show icon. This is a five stage process. The stages in this process are average acquisition cost, average customer revenue, average customer costs, average customer profit, customer retention rate.

Financials Base Plan Ppt PowerPoint Presentation Portfolio Background Designs
This is a financials base plan ppt powerpoint presentation portfolio background designs. This is a four stage process. The stages in this process are revenue, cost of sales, gross profit, customer acquisition cost, other operating cost expense.
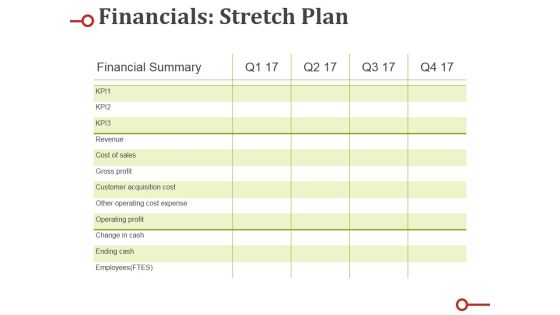
Financials Stretch Plan Ppt PowerPoint Presentation Show Designs Download
This is a financials stretch plan ppt powerpoint presentation show designs download. This is a four stage process. The stages in this process are revenue, cost of sales, gross profit, customer acquisition cost, other operating cost expense.

Financials Summary Base Plan Vs Stretch Plan Ppt PowerPoint Presentation Microsoft
This is a financials summary base plan vs stretch plan ppt powerpoint presentation microsoft. This is a three stage process. The stages in this process are revenue, cost of sales, gross profit, customer acquisition cost, other operating cost expense.

Competition Comparison Table Ppt PowerPoint Presentation Pictures File Formats
This is a competition comparison table ppt powerpoint presentation pictures file formats. This is a seven stage process. The stages in this process are revenue, profit, market share, main activity, number of employee, product quality.
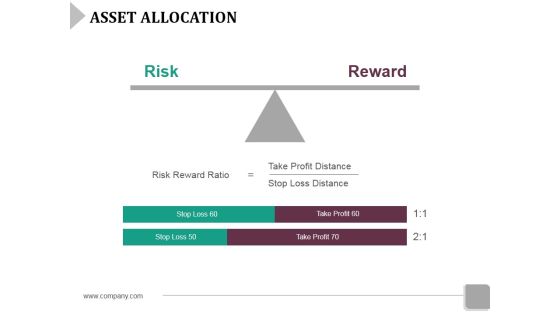
Asset Allocation Ppt PowerPoint Presentation Slides Structure
This is a asset allocation ppt powerpoint presentation slides structure. This is a two stage process. The stages in this process are risk, reward, stop loss, take profit, risk reward ratio.
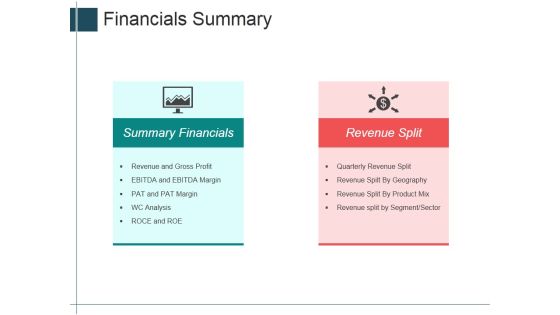
Financials Summary Ppt Powerpoint Presentation Inspiration Slides
This is a financials summary ppt powerpoint presentation inspiration slides. This is a two stage process. The stages in this process are summary financials, revenue split, icons, revenue and gross profit.
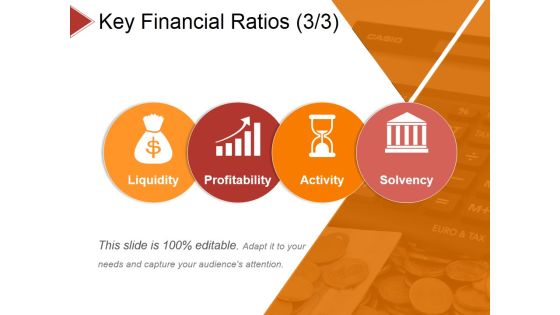
Key Financial Ratios Template 3 Ppt PowerPoint Presentation Summary Sample
This is a key financial ratios template 3 ppt powerpoint presentation summary sample. This is a four stage process. The stages in this process are liquidity, profitability, activity, solvency.

New Product Detailed Overview Ppt PowerPoint Presentation Summary Brochure
This is a new product detailed overview ppt powerpoint presentation summary brochure. This is a six stage process. The stages in this process are strategic, product advantage, market attractiveness, synergies, technical feasibility, profitability analysis.

Key Financial Ratios Template 3 Ppt PowerPoint Presentation Model Deck
This is a key financial ratios template 3 ppt powerpoint presentation model deck. This is a four stage process. The stages in this process are liquidity, profitability, activity, solvency.
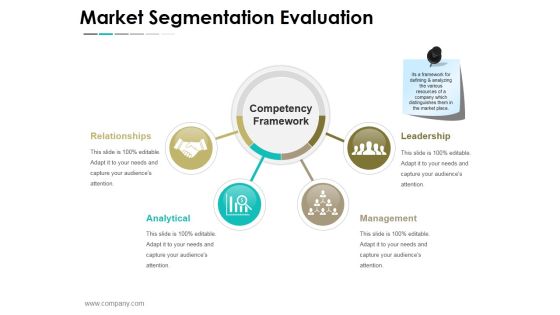
Market Segmentation Evaluation Ppt PowerPoint Presentation Layouts Images
This is a market segmentation evaluation ppt powerpoint presentation layouts images. This is a two stage process. The stages in this process are market sales, net profit, confectionary, milk products, beverages, nutrition and health care.

Competitor Analysis Ppt PowerPoint Presentation Professional Themes
This is a competitor analysis ppt powerpoint presentation professional themes. This is a six stage process. The stages in this process are revenue, profit, market share, main activity, number of employee, product quality.
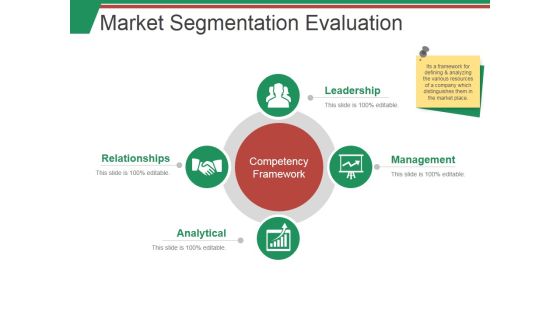
Market Segmentation Evaluation Template 1 Ppt PowerPoint Presentation Summary Smartart
This is a market segmentation evaluation template 1 ppt powerpoint presentation summary smartart. This is a two stage process. The stages in this process are market sales, net profit, beverages, milk product, nutrition.

Competitor Analysis Ppt PowerPoint Presentation Pictures Designs Download
This is a competitor analysis ppt powerpoint presentation pictures designs download. This is a six stage process. The stages in this process are revenue, profit, market share, main activity, number of employee, product quality.
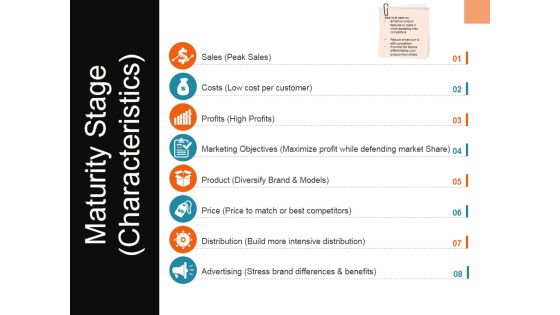
Maturity Stage Characteristics Ppt PowerPoint Presentation Slides Show
This is a maturity stage characteristics ppt powerpoint presentation slides show. This is a eight stage process. The stages in this process are sales, costs, profits, marketing objectives, product.

Competitor Analysis Ppt PowerPoint Presentation Outline Rules
This is a competitor analysis ppt powerpoint presentation outline rules. This is a seven stage process. The stages in this process are revenue, profit, market share, main activity, number of employee.

Competitor Analysis Ppt PowerPoint Presentation Show Infographics
This is a competitor analysis ppt powerpoint presentation show infographics. This is a seven stage process. The stages in this process are revenue, profit, market, share, main activity, number of employee.

Break Even Analysis Ppt PowerPoint Presentation Portfolio Clipart
This is a break even analysis ppt powerpoint presentation portfolio clipart. This is a five stage process. The stages in this process are fixed cost, variable cost, sales revenue, profit, key comments on the table, units of output.

Comparison Based On Criteria Ppt PowerPoint Presentation Outline Pictures
This is a comparison based on criteria ppt powerpoint presentation outline pictures. This is a six stage process. The stages in this process are revenue, profit, market share, main activity, number of employee.

Comparison Based On Criteria Ppt PowerPoint Presentation Icon Example Introduction
This is a comparison based on criteria ppt powerpoint presentation icon example introduction. This is a six stage process. The stages in this process are criteria, revenue, profit, market share, main activity.
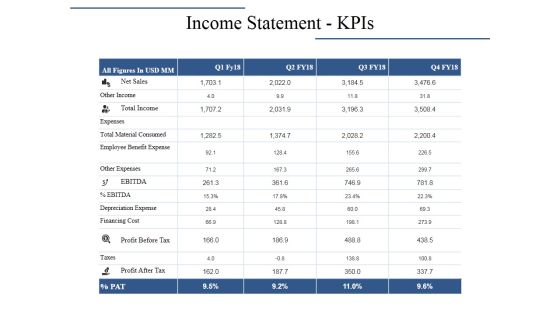
Income Statement Kpis Ppt PowerPoint Presentation Layouts Graphics Pictures
This is a income statement kpis ppt powerpoint presentation layouts graphics pictures. This is a four stage process. The stages in this process are net sales, total income, other income, profit before tax, expenses.

Sales Performance Dashboard Ppt PowerPoint Presentation Ideas Portfolio
This is a sales performance dashboard ppt powerpoint presentation ideas portfolio. This is a three stage process. The stages in this process are revenue, new customers, gross profit, customer satisfaction, sales comparison.

Sales Revenue Product Ppt PowerPoint Presentation Infographic Template Backgrounds
This is a sales revenue product ppt powerpoint presentation infographic template backgrounds. This is a three stage process. The stages in this process are product wise revenue, profit percent of total revenue, total income product.
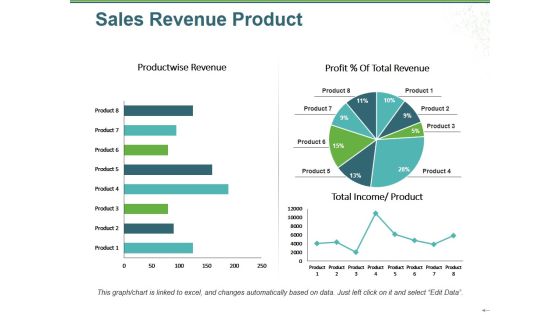
Sales Revenue Product Ppt PowerPoint Presentation Infographic Template Infographic Template
This is a sales revenue product ppt powerpoint presentation infographic template infographic template. This is a three stage process. The stages in this process are product wise revenue, total income, product, profit total revenue, pie.

Comparison Based On Criteria Ppt PowerPoint Presentation Slides Skills
This is a comparison based on criteria ppt powerpoint presentation slides skills. This is a five stage process. The stages in this process are revenue, profit, market share, main activity, number of employees, product quality.

Comparison Based On Criteria Ppt PowerPoint Presentation Show Outline
This is a comparison based on criteria ppt powerpoint presentation show outline. This is a six stage process. The stages in this process are revenue, profit, market share, main activity, number of employees.

Comparison Based On Criteria Ppt PowerPoint Presentation Show Graphics Pictures
This is a comparison based on criteria ppt powerpoint presentation show graphics pictures. This is a seven stage process. The stages in this process are competitor, revenue, profit, market share, main activity.

Comparison Based On Criteria Ppt PowerPoint Presentation Styles Picture
This is a comparison based on criteria ppt powerpoint presentation styles picture. This is a five stage process. The stages in this process are competitor, revenue, profit, criteria, market share.

Comparison Based On Criteria Ppt PowerPoint Presentation Infographic Template Layout Ideas
This is a comparison based on criteria ppt powerpoint presentation infographic template layout ideas. This is a seven stage process. The stages in this process are revenue, profit, market share, main activity, number of employees, product quality.

Comparison Based On Criteria Ppt PowerPoint Presentation Styles Designs
This is a comparison based on criteria ppt powerpoint presentation styles designs. This is a three stage process. The stages in this process are revenue, profit, market share, main activity, number of employees, product quality.

Pandl Kpis Ppt PowerPoint Presentation Gallery Display
This is a pandl kpis ppt powerpoint presentation gallery display. This is a four stage process. The stages in this process are net sales, total income, expenses, ebitda, profit after tax.
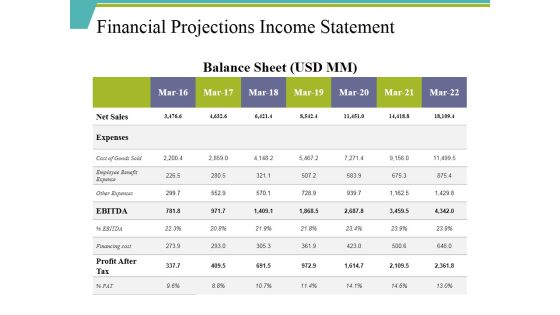
Financial Projections Income Statement Ppt PowerPoint Presentation Show Master Slide
This is a financial projections income statement ppt powerpoint presentation show master slide. This is a seven stage process. The stages in this process are net sales, expenses, profit after tax, other expenses, ebitda.

Comparison Based On Criteria Ppt PowerPoint Presentation Model Inspiration
This is a comparison based on criteria ppt powerpoint presentation model inspiration. This is a seven stage process. The stages in this process are revenue, profit, market share, number of employees, product quality.

Quarterly Budget Analysis Ppt PowerPoint Presentation Outline Background Image
This is a quarterly budget analysis ppt powerpoint presentation outline background image. This is a two stage process. The stages in this process are budget, this quarter, sales revenue, cost of sales, gross profits.

Actual Vs Target Variance Ppt PowerPoint Presentation Professional Clipart Images
This is a actual vs target variance ppt powerpoint presentation professional clipart images. This is a seven stage process. The stages in this process are cost, budget, variation, revenue, profit.

Comparison Based On Criteria Ppt PowerPoint Presentation Model Layouts
This is a comparison based on criteria ppt powerpoint presentation model layouts. This is a seven stage process. The stages in this process are revenue, profit, market share, main activity, product quality.

Forecast And Projection Ppt PowerPoint Presentation Gallery Display
This is a forecast and projection ppt powerpoint presentation gallery display. This is a four stage process. The stages in this process are revenue, expenses, purchases, project profit, budget.
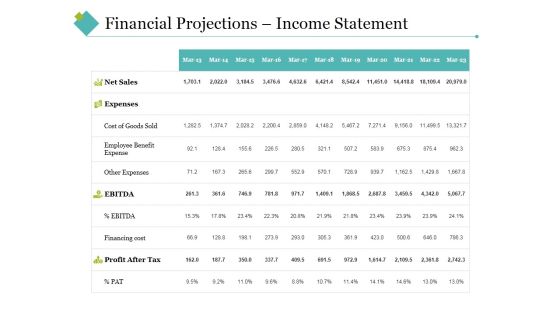
Financial Projections Income Statement Ppt PowerPoint Presentation Portfolio Clipart Images
This is a financial projections income statement ppt powerpoint presentation portfolio clipart images. This is a four stage process. The stages in this process are net sales, expenses, ebitda, profit after tax, financing cost.
Key Financial Ratios Template 2 Ppt PowerPoint Presentation Icon Background
This is a key financial ratios template 2 ppt powerpoint presentation icon background. This is a four stage process. The stages in this process are liquidity, profitability, activity, solvency.
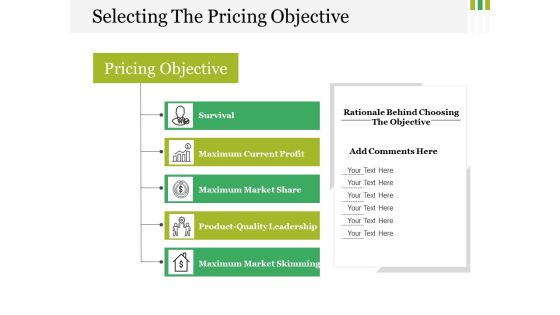
Selecting The Pricing Objective Ppt PowerPoint Presentation Portfolio Design Ideas
This is a selecting the pricing objective ppt powerpoint presentation portfolio design ideas. This is a five stage process. The stages in this process are survival, maximum current profit, maximum market share, product quality leadership, maximum market skimming.
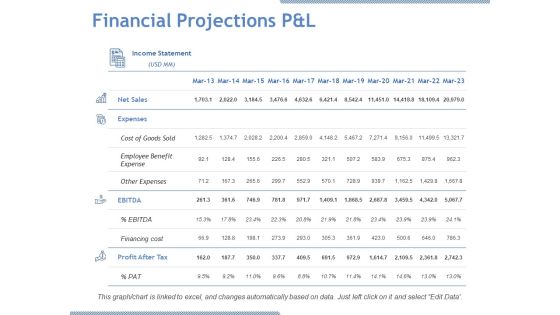
Financial Projections P And L Ppt PowerPoint Presentation Model Design Inspiration
This is a financial projections p and l ppt powerpoint presentation model design inspiration. This is a four stage process. The stages in this process are net sales, expenses, ebitda, profit after tax, cost of goods sold.

Financial Projections P And L Ppt PowerPoint Presentation Summary Backgrounds
This is a financial projections p and l ppt powerpoint presentation summary backgrounds. This is a four stage process. The stages in this process are net sales, expenses, other expenses, profit after tax, pat.
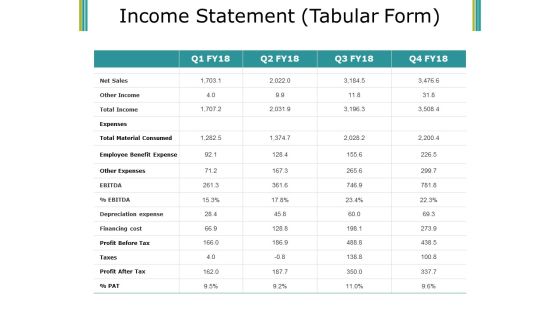
Income Statement Ppt PowerPoint Presentation Layouts Show
This is a income statement ppt powerpoint presentation layouts show. This is a four stage process. The stages in this process are net sales, expenses, total income, texas, profit after tax.

Sales Performance Dashboard Template Ppt PowerPoint Presentation Professional Elements
This is a sales performance dashboard template ppt powerpoint presentation professional elements. This is a eight stage process. The stages in this process are sales comparison, sales by product category, sales by month, brand profitability, revenue.

Executive Summary Ppt PowerPoint Presentation Layouts Clipart
This is a executive summary ppt powerpoint presentation layouts clipart. This is a seven stage process. The stages in this process are revenue, profits, operational cost, total customers, marketing channels.

Executive Summary Ppt PowerPoint Presentation Outline Diagrams
This is a executive summary ppt powerpoint presentation outline diagrams. This is a two stage process. The stages in this process are revenue, profits, operational cost, total customers, marketing channels.
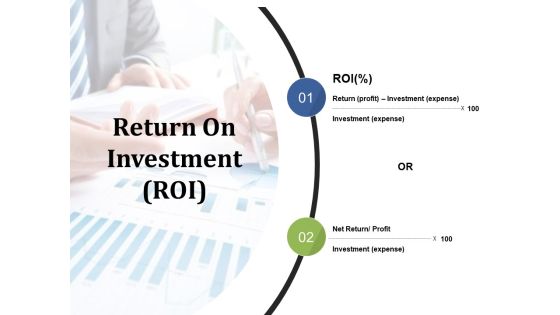
Return On Investment Ppt PowerPoint Presentation Show Gallery
This is a return on investment ppt powerpoint presentation show gallery. This is a two stage process. The stages in this process are return, investment, net return, profit, expense.

Establish Brand Loyalty Category Ppt PowerPoint Presentation Summary Template
This is a establish brand loyalty category ppt powerpoint presentation summary template. This is a four stage process. The stages in this process are category, profitability loyalty, loyalty strategy, management, strategy.
Financials Summary Stretch Plan Ppt PowerPoint Presentation Icon Shapes
This is a financials summary stretch plan ppt powerpoint presentation icon shapes. This is a five stage process. The stages in this process are operating profit, customer acquisition cost, change in cash.
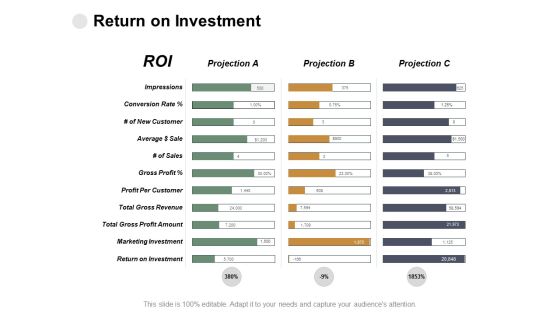
Return On Investment Impressions Ppt PowerPoint Presentation Infographics Background
This is a return on investment impressions ppt powerpoint presentation infographics background. This is a three stage process. The stages in this process are gross profit, marketing investment, impressions, returns on investment.
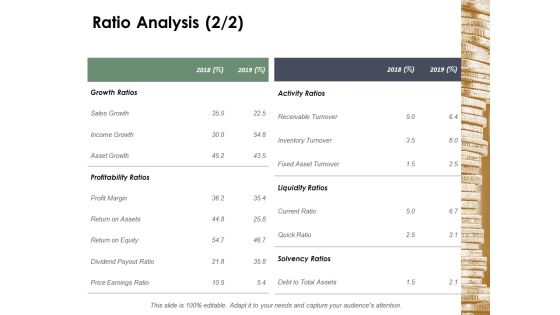
Ratio Analysis Activity Ratios Ppt Powerpoint Presentation Show Example File
This is a ratio analysis activity ratios ppt powerpoint presentation show example file. This is a six stage process. The stages in this process are liquidity ratios, solvency ratios, profitability ratios, efficiency ratios, coverage ratios.
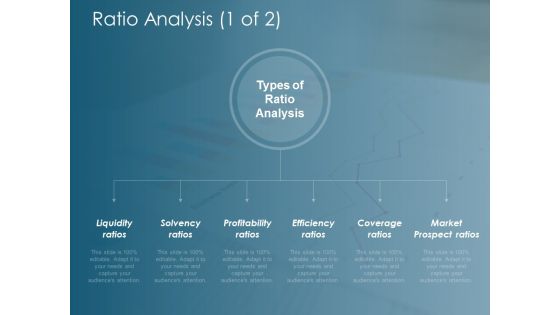
Ratio Analysis Solvency Ratios Ppt Powerpoint Presentation Professional Rules
This is a ratio analysis solvency ratios ppt powerpoint presentation professional rules. This is a six stage process. The stages in this process are ratio analysis, liquidity ratios, solvency ratios, profitability ratios, efficiency ratios.

Clustered Bar Finance Ppt Powerpoint Presentation Ideas Themes
This is a clustered bar finance ppt powerpoint presentation ideas themes. This is a three stage process. The stages in this process are clustered bar, product, in percentage, years, profit.
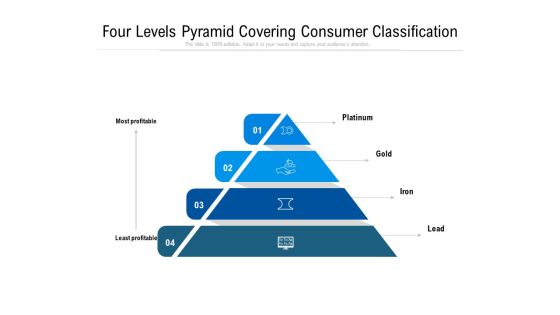
four levels pyramid covering consumer classification ppt powerpoint presentation gallery sample pdf
Persuade your audience using this four levels pyramid covering consumer classification ppt powerpoint presentation gallery sample pdf. This PPT design covers four stages, thus making it a great tool to use. It also caters to a variety of topics including platinum, gold, iron, lead, most profitable, least profitable. Download this PPT design now to present a convincing pitch that not only emphasizes the topic but also showcases your presentation skills.

Debt Funding Investment Pitch Deck Companys Interest Coverage Ratio Table Portrait PDF
This is a debt funding investment pitch deck companys interest coverage ratio table portrait pdf template with various stages. Focus and dispense information on one stage using this creative set, that comes with editable features. It contains large content boxes to add your information on topics like sales revenue, gross profit, operating profit, earnings before taxes, interest coverage ratio. You can also showcase facts, figures, and other relevant content using this PPT layout. Grab it now.
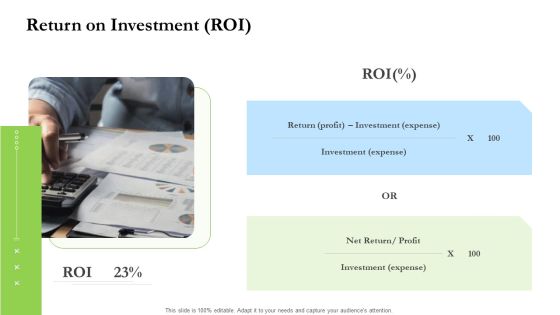
Project Performance Metrics Return On Investment ROI Ppt Summary Graphics Pictures PDF
Presenting project performance metrics return on investment roi ppt summary graphics pictures pdf to provide visual cues and insights. Share and navigate important information on one stage that need your due attention. This template can be used to pitch topics like return profit investment expense, investment expense, net return or profit, investment expense. In addtion, this PPT design contains high resolution images, graphics, etc, that are easily editable and available for immediate download.

Consolidated Statement Of Income Graphics PDF
This slide shows the consolidated statement of income which includes total revenue, cost of goods sold, gross profit, sales, etc. Presenting consolidated statement of income graphics pdf to provide visual cues and insights. Share and navigate important information on one stages that need your due attention. This template can be used to pitch topics like expenses, sales, income, revenue, gross profit. In addtion, this PPT design contains high resolution images, graphics, etc, that are easily editable and available for immediate download.
Our SIEM Companys Milestones Ppt Icon Mockup PDF
This slide provides the milestones of our company such as foundation year, revenue generation, profitability, etc. Presenting our siem companys milestones ppt icon mockup pdf to provide visual cues and insights. Share and navigate important information on six stages that need your due attention. This template can be used to pitch topics like revenue, profitability, technology. In addtion, this PPT design contains high resolution images, graphics, etc, that are easily editable and available for immediate download.
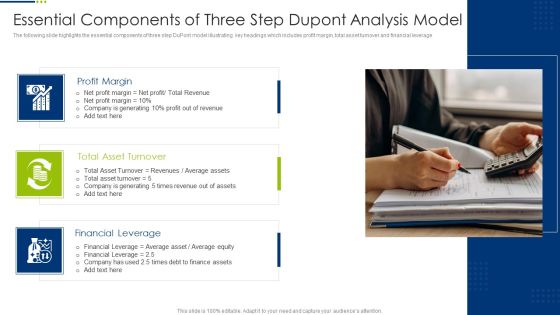
Essential Components Of Three Step Dupont Analysis Model Diagrams PDF
The following slide highlights the essential components of three step DuPont model illustrating key headings which includes profit margin, total asset turnover and financial leverage. Presenting Essential Components Of Three Step Dupont Analysis Model Diagrams PDF to dispense important information. This template comprises three stages. It also presents valuable insights into the topics including Profit Margin, Total Asset Turnover, Financial Leverage. This is a completely customizable PowerPoint theme that can be put to use immediately. So, download it and address the topic impactfully.

Revenue And Cost Comparison Matrix With Historical Results Sample PDF
This slide shows the cost and revenue related statistics of a company. It also includes gross and net profit, expenses, taxes etc. Presenting Revenue And Cost Comparison Matrix With Historical Results Sample PDF to dispense important information. This template comprises one stage. It also presents valuable insights into the topics including Expenses, Total Expenses, Gross Profit. This is a completely customizable PowerPoint theme that can be put to use immediately. So, download it and address the topic impactfully.

Company Financial Accounting Key Performance Indicators Ppt Slides PDF
This slide shows the key metrics of finance used in every organization. It includes profitability, liquidity, leverage, efficiency and valuation ratios. Presenting Company Financial Accounting Key Performance Indicators Ppt Slides PDF to dispense important information. This template comprises five stages. It also presents valuable insights into the topics including Profitability, Liquidity, Leverage. This is a completely customizable PowerPoint theme that can be put to use immediately. So, download it and address the topic impactfully.

Distribution Logistics With Operations Planning Management Ppt Outline Portrait PDF
This slide illustrates management of distribution logistics with operations planning. It includes profit center, sales and operations plan, operations, finance, sales and other functions etc. Presenting Distribution Logistics With Operations Planning Management Ppt Outline Portrait PDF to dispense important information. This template comprises six stages. It also presents valuable insights into the topics including Sales, Profit Center, Operations, Finance. This is a completely customizable PowerPoint theme that can be put to use immediately. So, download it and address the topic impactfully.
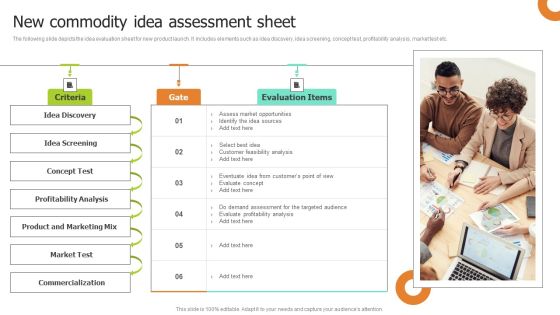
New Commodity Idea Assessment Sheet Ideas PDF
The following slide depicts the idea evaluation sheet for new product launch. It includes elements such as idea discovery, idea screening, concept test, profitability analysis, market test etc.Presenting New Commodity Idea Assessment Sheet Ideas PDF to dispense important information. This template comprises six stages. It also presents valuable insights into the topics including Profitability Analysis, Commercialization, Product Marketing. This is a completely customizable PowerPoint theme that can be put to use immediately. So, download it and address the topic impactfully.

Importance Of Analyzing Cost Time Analysis Elements PDF
This slide mentions the importance of analyzing the cost schedule performance in project management. It includes budgeting, profitability, client deadlines and opportunity costs. Presenting Importance Of Analyzing Cost Time Analysis Elements PDF to dispense important information. This template comprises four stages. It also presents valuable insights into the topics including Profitability, Client Deadlines, Opportunity Costs. This is a completely customizable PowerPoint theme that can be put to use immediately. So, download it and address the topic impactfully.

Benefits Of Property Trust Investment Introduction PDF
This slide presents various benefits of making investments in real estate properties to boost capital. It includes key advantages such as flexibility, profitability, tax efficiency and diversification.Presenting Benefits Of Property Trust Investment Introduction PDF to dispense important information. This template comprises four stages. It also presents valuable insights into the topics including Flexibility, Profitability, Tax Efficiency. This is a completely customizable PowerPoint theme that can be put to use immediately. So, download it and address the topic impactfully.
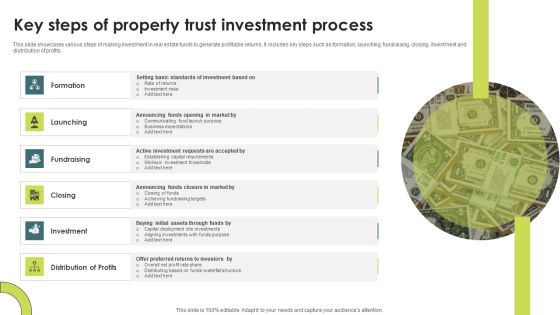
Key Steps Of Property Trust Investment Process Mockup PDF
This slide showcases various steps of making investment in real estate funds to generate profitable returns. It includes key steps such as formation, launching, fundraising, closing, investment and distribution of profits.Presenting Key Steps Of Property Trust Investment Process Mockup PDF to dispense important information. This template comprises six stages. It also presents valuable insights into the topics including Formation, Launching, Fundraising. This is a completely customizable PowerPoint theme that can be put to use immediately. So, download it and address the topic impactfully.

Market Analysis Grid Diagram For Strategic Decision Making Themes PDF
This slide showcases a matrix map to making strategic decisions by analyzing profitability impact of various programs. It includes key components like profitability and impact. Presenting Market Analysis Grid Diagram For Strategic Decision Making Themes PDF to dispense important information. This template comprises one stages. It also presents valuable insights into the topics including Family Education, Fund Development, Job Training. This is a completely customizable PowerPoint theme that can be put to use immediately. So, download it and address the topic impactfully.

Organization Strategy Diagram Ppt Slides Download
This is a organization strategy diagram ppt slides download. This is a six stage process. The stages in this process are profit formula, customer value proposition, situation analysis, deriving strategies, monitor and control, problem identification.

Financial Analysis And Planning Ppt Templates
This is a financial analysis and planning ppt templates. This is a four stage process. The stages in this process are monitoring and review, cost and profitability, strategy analysis, planning and budgeting.

Competitor Analysis Chart Ppt PowerPoint Presentation Visuals
This is a competitor analysis chart ppt powerpoint presentation visuals. This is a five stage process. The stages in this process are revenue, profit, market share, main activity, number of employee, product quality.
 Home
Home