Growth Arrows
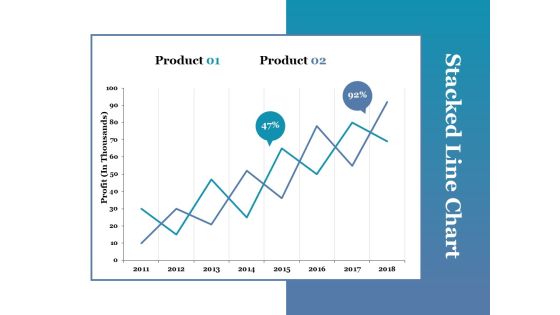
Stacked Line Chart Ppt PowerPoint Presentation Portfolio Picture
This is a stacked line chart ppt powerpoint presentation portfolio picture. This is a two stage process. The stages in this process are stacked line chart, product, profit, growth.

Competitor Revenue And Profit Ppt PowerPoint Presentation Layouts Vector
This is a competitor revenue and profit ppt powerpoint presentation layouts vector. This is a five stage process. The stages in this process are competitor, profit, revenue, bar graph, success.

Competitor Revenue And Profit Ppt PowerPoint Presentation Model Templates
This is a competitor revenue and profit ppt powerpoint presentation model templates. This is a five stage process. The stages in this process are revenue, profit, competitor, bar graph, business.

Potential Price And Profit Margins Ppt PowerPoint Presentation Design Templates
This is a potential price and profit margins ppt powerpoint presentation design templates. This is a three stage process. The stages in this process are cost item, beginning, revenue, cost of production, gross profit, gross profit margin, other income, wages.
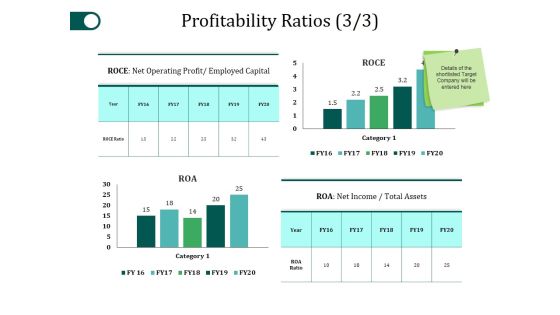
Profitability Ratios Template 3 Ppt PowerPoint Presentation Gallery Slide Portrait
This is a profitability ratios template 3 ppt powerpoint presentation gallery slide portrait. This is a four stage process. The stages in this process are category, roce, net income, business, bar graph.

Competitor Revenue And Profit Ppt PowerPoint Presentation Pictures Background Images
This is a competitor revenue and profit ppt powerpoint presentation pictures background images. This is a five stage process. The stages in this process are business, marketing, strategy, planning, finance.

Profit And Loss Break Even Analysis Ppt Sample File
This is a profit and loss break even analysis ppt sample file. This is a two stage process. The stages in this process are cost, loss, profit, fixed costs, break even point, quantity sold, units, total variable costs.
Profit Framework For Internet Business With Icons Ppt PowerPoint Presentation Portfolio Graphics Template
Presenting this set of slides with name profit framework for internet business with icons ppt powerpoint presentation portfolio graphics template. This is a seven stage process. The stages in this process are revenue generation, business, strategies. This is a completely editable PowerPoint presentation and is available for immediate download. Download now and impress your audience.

Industry Cost Structure Template 1 Ppt PowerPoint Presentation Guidelines
This is a industry cost structure template 1 ppt powerpoint presentation guidelines. This is a seven stage process. The stages in this process are profit, marketing, rent and utilities, purchases, wages, other, depreciation.
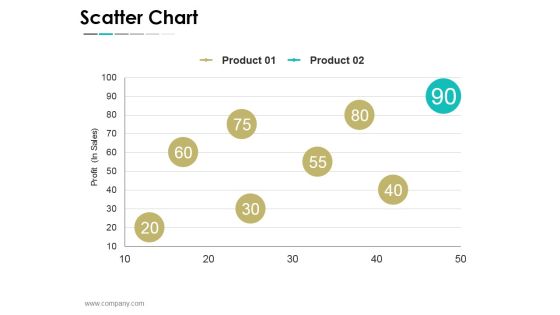
Scatter Chart Ppt PowerPoint Presentation Examples
This is a scatter chart ppt powerpoint presentation examples. This is a eight stage process. The stages in this process are business, strategy, marketing, success, profit in sales.

Projected Key Financials Template 2 Ppt PowerPoint Presentation Professional Clipart
This is a projected key financials template 2 ppt powerpoint presentation professional clipart. This is a four stage process. The stages in this process are sales, gross profit, net profit, in dollar.
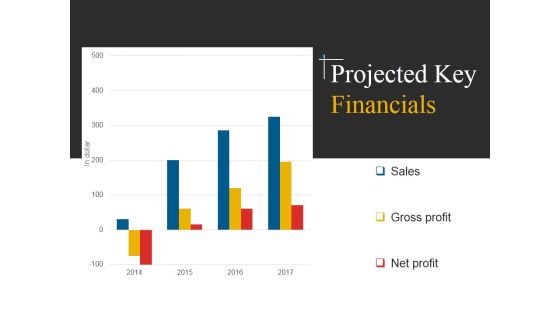
Projected Key Financials Template 2 Ppt PowerPoint Presentation Inspiration Example File
This is a projected key financials template 2 ppt powerpoint presentation inspiration example file. This is a four stage process. The stages in this process are sales, gross profit, net profit.

Projected Key Financials Template 1 Ppt PowerPoint Presentation File Portfolio
This is a projected key financials template 1 ppt powerpoint presentation file portfolio. This is a three stage process. The stages in this process are sales, gross profit, net profit.

Sales Management Framework Ppt PowerPoint Presentation Slides
This is a sales management framework ppt powerpoint presentation slides. This is a eight stage process. The stages in this process are sales, costs, profits, marketing objectives, product, price, distribution, advertising, peak sales, low costs per customer process, high profits, maximize profit while, defending market share, diversify brand and models, price to match or best, competitors, build more intensive distribution , stress brand differences and benefits.
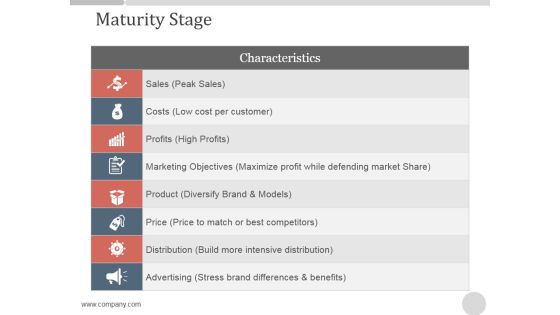
Maturity Stage Ppt PowerPoint Presentation Backgrounds
This is a maturity stage ppt powerpoint presentation backgrounds. This is a eight stage process. The stages in this process are sales peak sales, characteristics, profits high profits, marketing objectives maximize profit while defending market share, product diversify brand and models, price price to match or best competitors.

Customer Lifetime Value Curve Powerpoint Shapes
This is a customer lifetime value curve powerpoint shapes. This is a three stage process. The stages in this process are 20 percent inactive non profitable customer, 60 percent active profitable customers, 20 percent very active very profitable customers, clv.

Customer Relationship Value Ppt Slide
This is a customer relationship value ppt slide. This is a three stage process. The stages in this process are clv, lifetime value average order value x number of repeat sales x average retention time, inactive non profitable customer, active profitable customers, very active very profitable customers.

Maturity Stage With Peak Sales Condition Ppt Slide Templates
This is a maturity stage with peak sales condition ppt slide templates. This is a one stage process. The stages in this process are advertising, distribution, price, product, marketing objectives, profits, costs, sales, peak sales, low costs per customer process, high profits, maximize profit while defending market share, diversify brand and models, price to match or best competitors, build more intensive distribution, stress brand differences and benefits.

Corporate Development Teams Efforts Model Powerpoint Presentation
This is a corporate development teams efforts model powerpoint presentation. This is a seven stage process. The stages in this process are profit, direction, training, sales intelligence.

Business Model Template 1 Ppt PowerPoint Presentation Ideas Objects
This is a business model template 1 ppt powerpoint presentation ideas objects. This is a three stage process. The stages in this process are offering, monetization, sustainability market attractiveness, profit model.

Business And Financial Overview Ppt PowerPoint Presentation Inspiration Clipart Images
This is a business and financial overview ppt powerpoint presentation inspiration clipart images. This is a four stage process. The stages in this process are current key offerings, revenue by geography, current technology used, profit margin, revenue.

Decline Stage Ppt PowerPoint Presentation Inspiration Master Slide
This is a decline stage ppt powerpoint presentation inspiration master slide. This is a eight stage process. The stages in this process are sales, costs, profits, product, price.
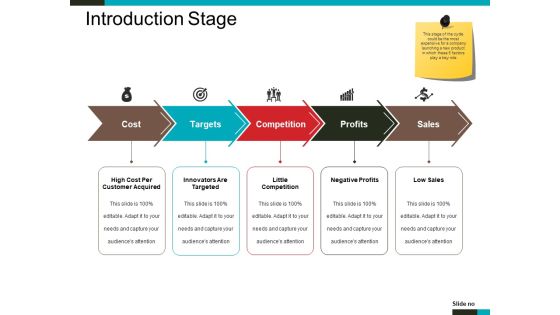
Introduction Stage Ppt PowerPoint Presentation Layouts Designs Download
This is a introduction stage ppt powerpoint presentation layouts designs download. This is a five stage process. The stages in this process are cost, targets, competition, profits, sales.
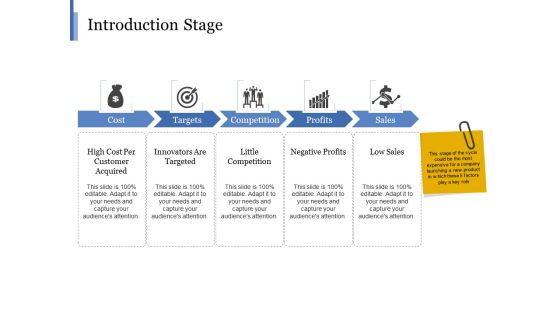
Introduction Stage Ppt PowerPoint Presentation Styles Portfolio
This is a introduction stage ppt powerpoint presentation styles portfolio. This is a five stage process. The stages in this process are cost, targets, competition, profits, sales.
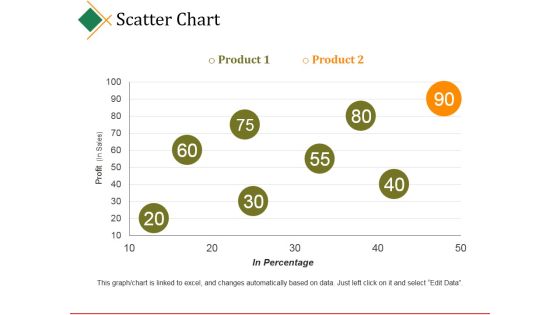
Scatter Chart Ppt PowerPoint Presentation Model
This is a scatter chart ppt powerpoint presentation model. This is a two stage process. The stages in this process are business, product, profit, in percentage, business.

Break Even Analysis Ppt PowerPoint Presentation Clipart
This is a break even analysis ppt powerpoint presentation clipart. This is a two stage process. The stages in this process are profit, loss, sales, units, total costs.
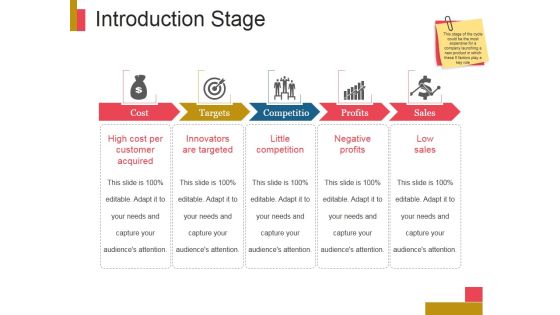
Introduction Stage Ppt PowerPoint Presentation Pictures
This is a introduction stage ppt powerpoint presentation pictures. This is a five stage process. The stages in this process are cost, targets, competition, profits, sales.

Customer Lifetime Value Clv Ppt PowerPoint Presentation Icon Professional
This is a customer lifetime value clv ppt powerpoint presentation icon professional. This is a three stage process. The stages in this process are inactive nonprofit able, customer, active profitable customers, very active very profitable customers.

Scatter Bubble Chart Ppt PowerPoint Presentation Summary Files
This is a scatter bubble chart ppt powerpoint presentation summary files. This is a six stage process. The stages in this process are product, financial year, profit, highest profit.
Scatter Bubble Chart Ppt PowerPoint Presentation Icon Elements
This is a scatter bubble chart ppt powerpoint presentation icon elements. This is a six stage process. The stages in this process are highest profit, profit, financial year, product.

Income Statement Graphical Representation Ppt PowerPoint Presentation Infographics Layouts
This is a income statement graphical representation ppt powerpoint presentation infographics layouts. This is a four stage process. The stages in this process are revenue, cogs, operating profit, net profit.
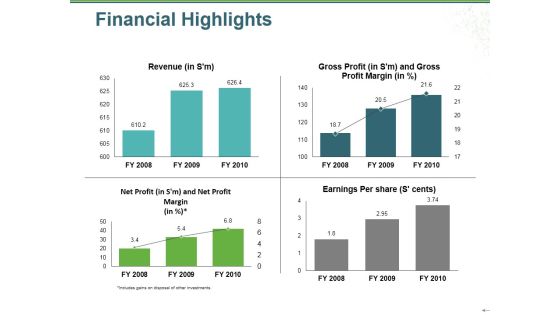
Financial Highlights Ppt PowerPoint Presentation Gallery Graphics Example
This is a financial highlights ppt powerpoint presentation gallery graphics example. This is a four stage process. The stages in this process are revenue, gross profit, net profit, earnings per share, bar graph.
Income Statement Overview Ppt PowerPoint Presentation Infographic Template Icon
This is a income statement overview ppt powerpoint presentation infographic template icon. This is a five stage process. The stages in this process are revenue, profit margin, operating profit margin.
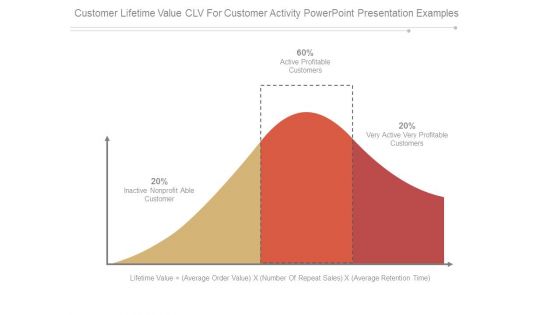
Customer Lifetime Value Clv For Customer Activity Powerpoint Presentation Examples
This is a customer lifetime value clv for customer activity powerpoint presentation examples. This is a three stage process. The stages in this process are lifetime value average order value x number of repeat sales x average retention time, inactive nonprofit able customer, active profitable customers, very active very profitable customers.

Stacked Column Ppt PowerPoint Presentation Show Slideshow
This is a stacked column ppt powerpoint presentation show slideshow. This is a nine stage process. The stages in this process are product, profit, business, marketing, graph.
Line Chart Ppt PowerPoint Presentation Icon Example
This is a line chart ppt powerpoint presentation icon example. This is a two stage process. The stages in this process are products, profit, line chart, business, marketing.
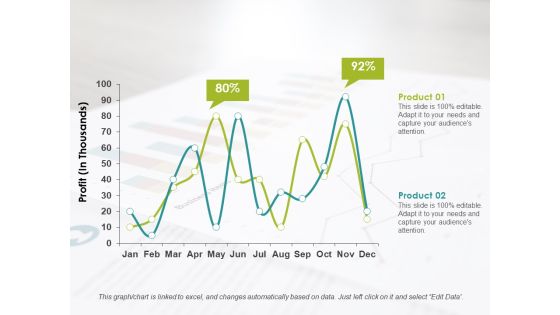
Line Chart Ppt PowerPoint Presentation Infographics Format Ideas
This is a line chart ppt powerpoint presentation infographics format ideas. This is a two stage process. The stages in this process are product, profit, business.
Internet Marketing Objectives Ppt PowerPoint Presentation Icon Images
This is a internet marketing objectives ppt powerpoint presentation icon images. This is a six stage process. The stages in this process are sales, profit, product, repeat, sales, web.
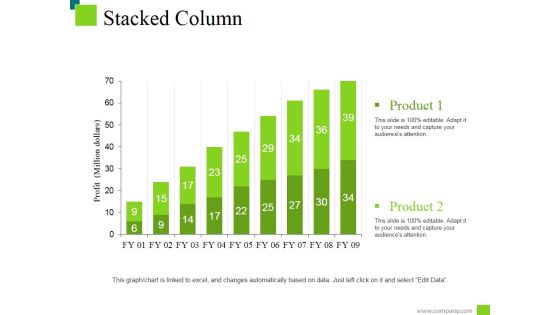
Stacked Column Ppt PowerPoint Presentation Styles Example
This is a stacked column ppt powerpoint presentation styles example. This is a two stage process. The stages in this process are product, profit, business, marketing, success.

Customer Lifetime Value Analysis Chart Example Of Ppt Presentation
This is a customer lifetime value analysis chart example of ppt presentation. This is a three stage process. The stages in this process are inactive nonprofit able customer, active profitable customers, very active very profitable customers, lifetime value, average order value, number of repeat sales, average retention time.

Customer Lifetime Value Indication Bar Chart Ppt Samples
This is a customer lifetime value indication bar chart ppt samples. This is a three stage process. The stages in this process are inactive nonprofit able customer, active profitable customers, very active very profitable customers, lifetime value, average order value, number of repeat sales, average retention time.

Customer Lifetime Value Process Curve Powerpoint Shapes
This is a customer lifetime value process curve powerpoint shapes. This is a three stage process. The stages in this process are inactive nonprofit able customer, active profitable customers, very active very profitable customers, lifetime value, average order value, number of repeat sales, average retention time.

Customer Lifetime Value Ppt PowerPoint Presentation Summary
This is a customer lifetime value ppt powerpoint presentation summary. This is a three stage process. The stages in this process are active profitable customers, very active very profitable customers, inactive nonprofit able customer.

Pandl Kpis Tabular Form Ppt PowerPoint Presentation Visual Aids
This is a pandl kpis tabular form ppt powerpoint presentation visual aids. This is a four stage process. The stages in this process are revenue, cogs, operating profit, net profit.

Customer Lifetime Value Ppt PowerPoint Presentation Summary Good
This is a customer lifetime value ppt powerpoint presentation summary good. This is a three stage process. The stages in this process are inactive nonprofit able customer, active profitable customers, very active very profitable customers.
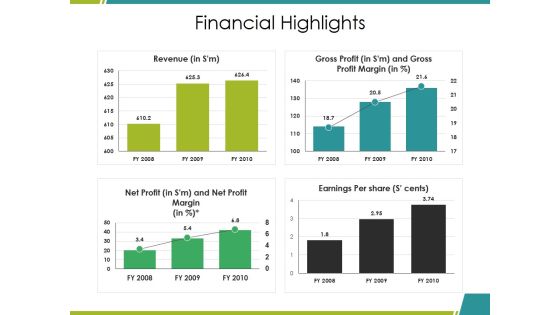
Financial Highlights Ppt PowerPoint Presentation Ideas Graphics Download
This is a financial highlights ppt powerpoint presentation ideas graphics download. This is a four stage process. The stages in this process are revenue, gross profit, net profit, earnings per share, bar graph.

P And L Kpis Template 2 Ppt PowerPoint Presentation Inspiration Grid
This is a p and l kpis template 2 ppt powerpoint presentation inspiration grid. This is a four stage process. The stages in this process are revenue, cogs, operating profit, net profit.

P And L Kpis Ppt PowerPoint Presentation Designs Download
This is a p and l kpis ppt powerpoint presentation designs download. This is a four stage process. The stages in this process are revenue, cogs, operating profit, net profit.
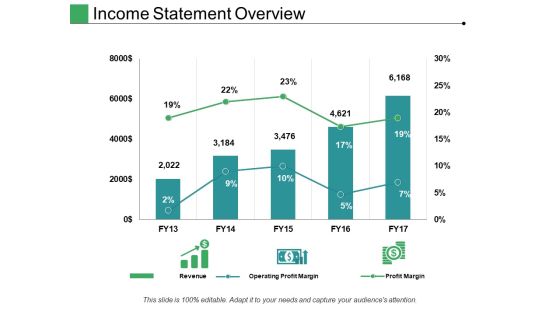
Income Statement Overview Ppt PowerPoint Presentation File Structure
This is a income statement overview ppt powerpoint presentation file structure. This is a five stage process. The stages in this process are revenue, operating profit margin, profit margin.

Current Financial Highlights Ppt PowerPoint Presentation File Demonstration
This is a current financial highlights ppt powerpoint presentation show example. This is a four stage process. The stages in this process are revenue, net profit, earnings per share, gross profit.

Break Even Analysis Ppt PowerPoint Presentation Design Templates
This is a break even analysis ppt powerpoint presentation design templates. This is a two stage process. The stages in this process are sales, break even volume, total revenue, loss, profit.

Area Stacked Ppt PowerPoint Presentation Shapes
This is a area stacked ppt powerpoint presentation shapes. This is a two stage process. The stages in this process are business, marketing, product, finance, profit.
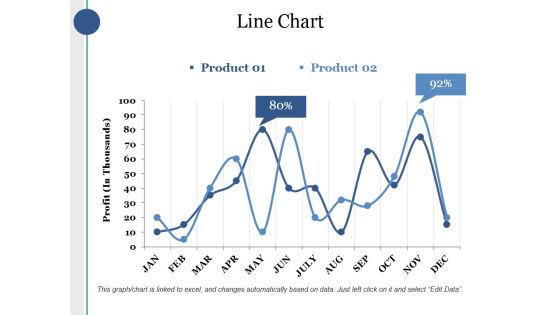
Line Chart Ppt PowerPoint Presentation Layouts Sample
This is a line chart ppt powerpoint presentation layouts sample. This is a two stage process. The stages in this process are product, profit, percentage, finance, business.

Introduction Stage Ppt PowerPoint Presentation Graphics
This is a introduction stage ppt powerpoint presentation graphics. This is a five stage process. The stages in this process are low sales, negative profits, little competition, innovators are targeted, high cost per customer acquired.
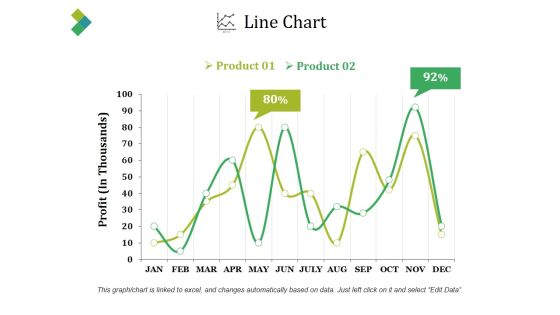
Line Chart Ppt PowerPoint Presentation Slides
This is a line chart ppt powerpoint presentation slides. This is a two stage process. The stages in this process are product, profit, percentage, finance, line chart.
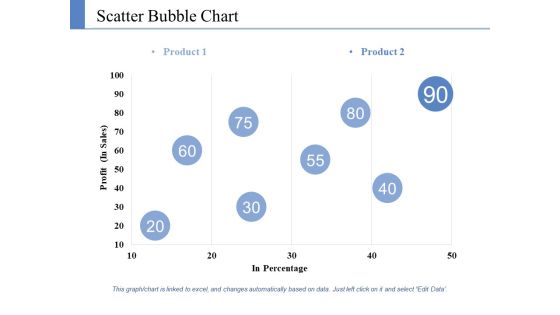
Scatter Bubble Chart Ppt PowerPoint Presentation Styles Information
This is a scatter bubble chart ppt powerpoint presentation styles information. This is a two stage process. The stages in this process are product, profit, in percentage.
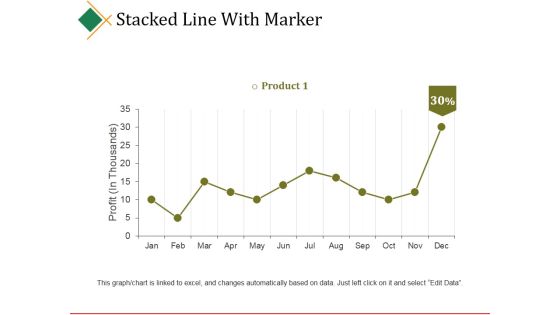
Stacked Line With Marker Ppt PowerPoint Presentation Model Graphics Download
This is a stacked line with marker ppt powerpoint presentation model graphics download. This is a twelve stage process. The stages in this process are product, profit, business, marketing, success.

Competitor Comparison Template 2 Ppt PowerPoint Presentation Show Design Ideas
This is a competitor comparison template 2 ppt powerpoint presentation show design ideas. This is a four stage process. The stages in this process are competitor, profit, revenue.

Bubble Chart Ppt PowerPoint Presentation Pictures Icons
This is a bubble chart ppt powerpoint presentation pictures icons. This is a two stage process. The stages in this process are product, profit, bubble chart.

Clustered Bar Ppt PowerPoint Presentation Slides Deck
This is a clustered bar ppt powerpoint presentation slides deck. This is a two stage process. The stages in this process are product, profit, bar graph.

Scatter Bubble Chart Ppt PowerPoint Presentation Summary Slides
This is a scatter bubble chart ppt powerpoint presentation summary slides. This is a one stage process. The stages in this process are product, profit, in percentage.

Line Chart Ppt PowerPoint Presentation Portfolio File Formats
This is a line chart ppt powerpoint presentation portfolio file formats. This is a two stage process. The stages in this process are product, profit, line chart.

Clustered Column Ppt PowerPoint Presentation Styles Templates
This is a clustered column ppt powerpoint presentation styles templates. This is a two stage process. The stages in this process are product, profit, bar graph.

Clustered Bar Ppt PowerPoint Presentation Slides Graphic Tips
This is a clustered bar ppt powerpoint presentation slides graphic tips. This is a two stage process. The stages in this process are profit, product, clustered bar.
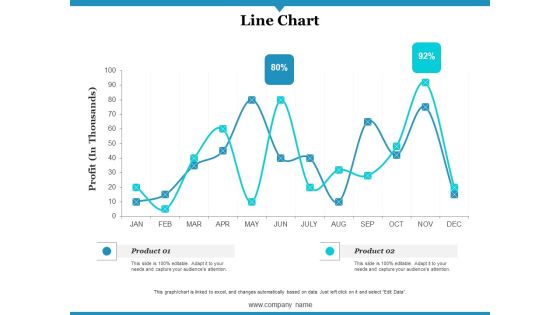
Line Chart Ppt PowerPoint Presentation Gallery Infographics
This is a line chart ppt powerpoint presentation gallery infographics. This is a two stage process. The stages in this process are profit, product, line chart.
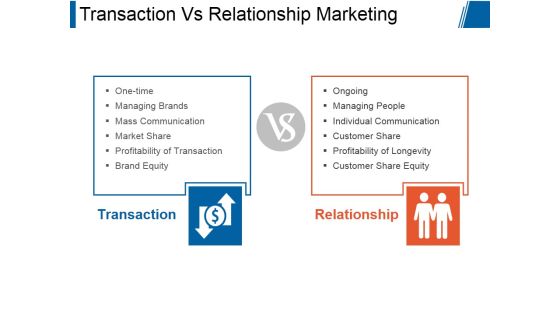
Transaction Vs Relationship Marketing Ppt PowerPoint Presentation Deck
This is a transaction vs relationship marketing ppt powerpoint presentation deck. This is a two stage process. The stages in this process are transaction, relationship, one time, managing brands, mass communication, market share, profitability of transaction, brand equity, ongoing, managing people, individual communication, customer share, profitability of longevity, customer share equity.

Current State Analysis Financial Comparison Ppt PowerPoint Presentation Inspiration Good
This is a current state analysis financial comparison ppt powerpoint presentation inspiration good. This is a five stage process. The stages in this process are revenue, profits, cash balance, competitor.

Break Even Analysis Ppt PowerPoint Presentation Model File Formats
This is a break even analysis ppt powerpoint presentation model file formats. This is a two stage process. The stages in this process are cost, loss, break even point, profit, fixed costs.

Summary Financials Revenue Ebitda Pat Ppt PowerPoint Presentation Visuals
This is a summary financials revenue ebitda pat ppt powerpoint presentation visuals. This is a three stage process. The stages in this process are revenue and gross profit, pat and pat margin, ebitda and ebitda margin.
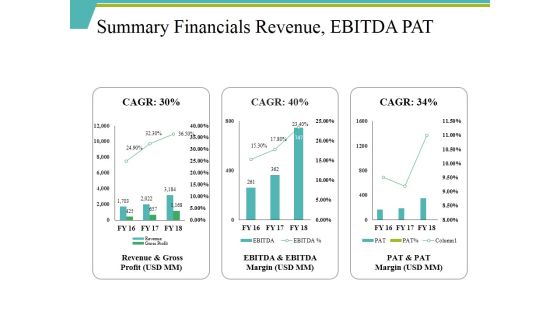
Summary Financials Revenue Ebitda Pat Ppt PowerPoint Presentation Infographic Template Smartart
This is a summary financials revenue ebitda pat ppt powerpoint presentation infographic template smartart. This is a three stage process. The stages in this process are revenue and gross profit, ebitda and ebitda, pat and pat, revenue.
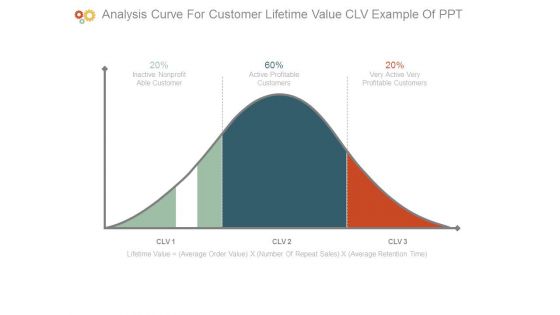
Analysis Curve For Customer Lifetime Value Clv Example Of Ppt
This is a analysis curve for customer lifetime value clv example of ppt. This is a three stage process. The stages in this process are inactive nonprofit able customer, active profitable customers, clv, lifetime value average order value x number of repeat sales x average retention time.
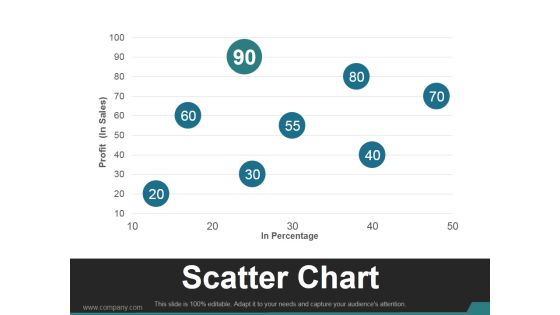
Scatter Chart Template 2 Ppt PowerPoint Presentation Slides
This is a scatter chart template 2 ppt powerpoint presentation slides. This is a eight stage process. The stages in this process are business, marketing, scatter chart, profit, management.

Line Chart Ppt PowerPoint Presentation Summary Information
This is a line chart ppt powerpoint presentation summary information. This is a two stage process. The stages in this process are business, strategy, marketing, analysis, profit million dollars.
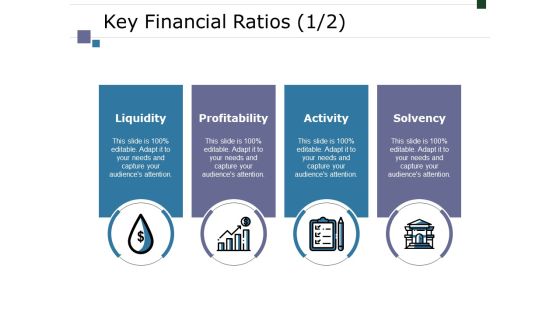
Key Financial Ratios Template 2 Ppt PowerPoint Presentation Ideas Mockup
This is a key financial ratios template 2 ppt powerpoint presentation ideas mockup. This is a four stage process. The stages in this process are liquidity, profitability, activity, solvency, business.
Key Financial Ratios Template 2 Ppt PowerPoint Presentation Icon Graphics Design
This is a key financial ratios template 2 ppt powerpoint presentation icon graphics design. This is a four stage process. The stages in this process are liquidity, profitability, activity, solvency, business.

Competitor Analysis Template 3 Ppt PowerPoint Presentation Ideas Graphic Tips
This is a competitor analysis template 3 ppt powerpoint presentation ideas graphic tips. This is a four stage process. The stages in this process are net profit margin, your company, competitor.

Selecting The Pricing Objective Ppt PowerPoint Presentation Gallery Portrait
This is a selecting the pricing objective ppt powerpoint presentation gallery portrait. This is a five stage process. The stages in this process are surveys, maximum current profit, maximum market share, product quality leadership, maximum market skimming.
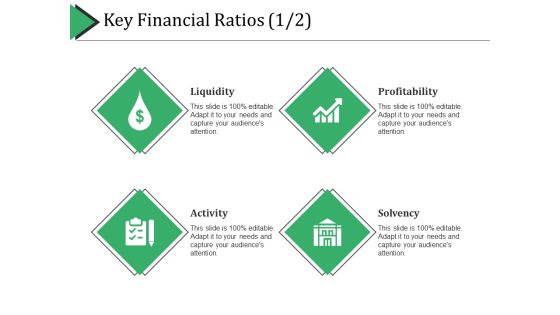
Key Financial Ratios Template 2 Ppt PowerPoint Presentation Summary Graphics Tutorials
This is a key financial ratios template 2 ppt powerpoint presentation summary graphics tutorials. This is a four stage process. The stages in this process are liquidity, profitability, activity, solvency.

Break Even Analysis Curve Powerpoint Guide
This is a break even analysis curve powerpoint guide. This is a one stage process. The stages in this process are cost, break even point, loss, profit, total variable costs, fixed costs, quality sold, units.

Financial Analysis Ratios Ppt Slide Themes
This is a financial analysis ratios ppt slide themes. This is a five stage process. The stages in this process are liquidity ratio, asset turnover ratios, financial leverage ratios, profitability ratios, dividend policy ratios.

Current State Analysis Financial Comparison Ppt Powerpoint Presentation File Graphic Tips
This is a current state analysis financial comparison ppt powerpoint presentation file graphic tips. This is a five stage process. The stages in this process are revenue, profits, cash balance.

Line Chart Ppt PowerPoint Presentation Gallery Format Ideas
This is a line chart ppt powerpoint presentation gallery format ideas. This is a two stage process. The stages in this process are line chart, product, in year, profit.
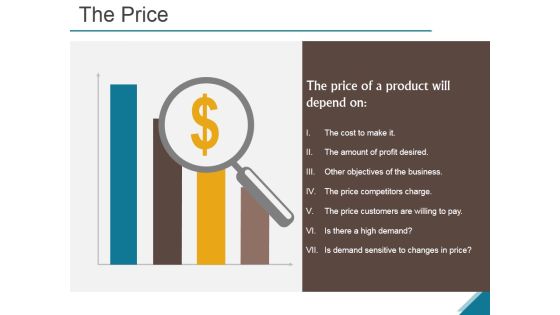
The Price Ppt PowerPoint Presentation Summary
This is a the price ppt powerpoint presentation summary. This is a four stage process. The stages in this process are the cost to make it, the amount of profit desired, other objectives of the business, the price competitors charge, the price customers are willing to pay, is there a high demand.
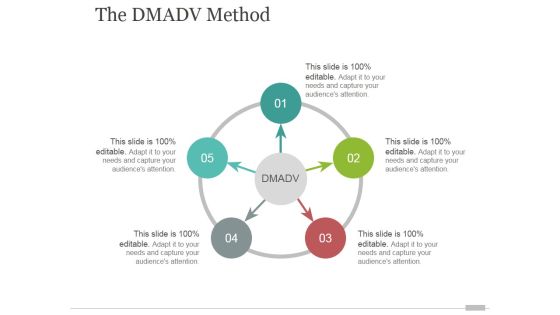
The Dmadv Method Ppt PowerPoint Presentation Design Templates
This is a the dmadv method ppt powerpoint presentation design templates. This is a five stage process. The stages in this process are arrows, process, business, marketing, strategy, analysis.
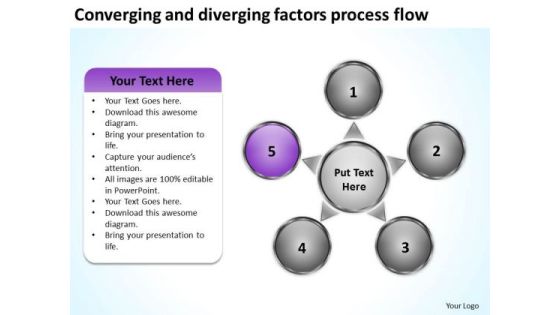
Converging And Diverging Factors Process Flow Chart Target Chart PowerPoint Templates
We present our converging and diverging factors process flow chart Target Chart PowerPoint templates.Download and present our Business PowerPoint Templates because your ideas too are pinpointedly focused on you goals. Present our Process and Flows PowerPoint Templates because our templates illustrates your ability. Download our Marketing PowerPoint Templates because customer satisfaction is a mantra of the marketplace. Building a loyal client base is an essential element of your business. Use our Circle Charts PowerPoint Templates because your brain is always churning out ideas like cogs in a wheel. Present our Flow Charts PowerPoint Templates because they are the stepping stones of our journey till date.Use these PowerPoint slides for presentations relating to Achievement, Aim, Arrow, Business, Chart, Communication, Diagram, Direction, Graphic, Growth, Guide, Increase, Marketing, Presentation, Shape, Sign, Success, Target, Team, Teamwork. The prominent colors used in the PowerPoint template are Purple, Gray, White. People tell us our converging and diverging factors process flow chart Target Chart PowerPoint templates are Attractive. Use our Diagram PowerPoint templates and PPT Slides will make the presenter look like a pro even if they are not computer savvy. Professionals tell us our converging and diverging factors process flow chart Target Chart PowerPoint templates are Zippy. Presenters tell us our Direction PowerPoint templates and PPT Slides are Charming. Professionals tell us our converging and diverging factors process flow chart Target Chart PowerPoint templates are Swanky. PowerPoint presentation experts tell us our Direction PowerPoint templates and PPT Slides are Energetic.
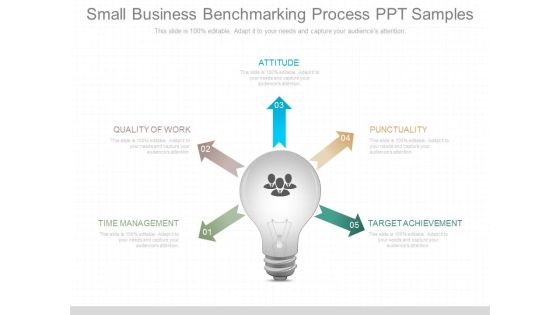
Small Business Benchmarking Process Ppt Samples
This is a small business benchmarking process ppt samples. This is a five stage process. The stages in this process are attitude, quality of work, time management, punctuality, target achievement.
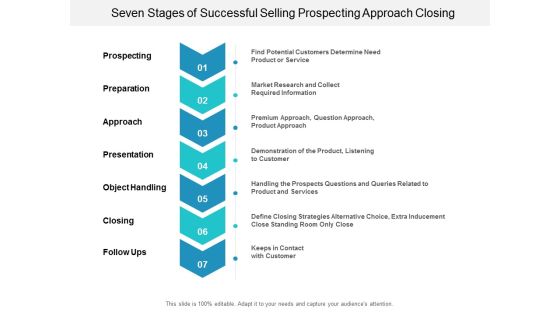
Seven Stages Of Successful Selling Prospecting Approach Closing Ppt Powerpoint Presentation Slides Ideas
This is a seven stages of successful selling prospecting approach closing ppt powerpoint presentation slides ideas. This is a seven stage process. The stages in this process are arrow steps, arrow stages, arrow phases.
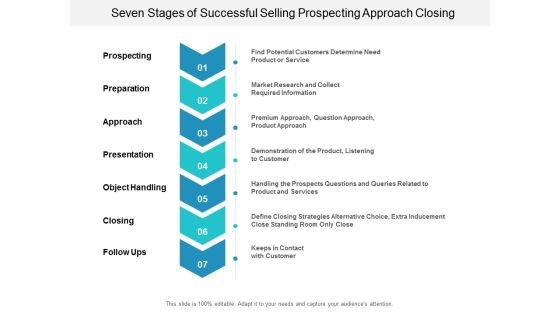
Seven Stages Of Successful Selling Prospecting Approach Closing Ppt Powerpoint Presentation Styles Topics
This is a seven stages of successful selling prospecting approach closing ppt powerpoint presentation styles topics. This is a seven stage process. The stages in this process are arrow steps, arrow stages, arrow phases.
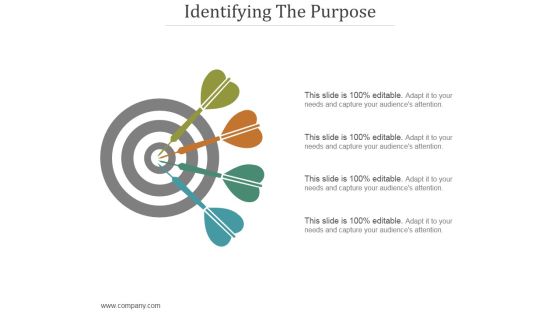
Identifying The Purpose Ppt PowerPoint Presentation Background Images
This is a identifying the purpose ppt powerpoint presentation background images. This is a four stage process. The stages in this process are plan, arrow, target, goal, strategy.
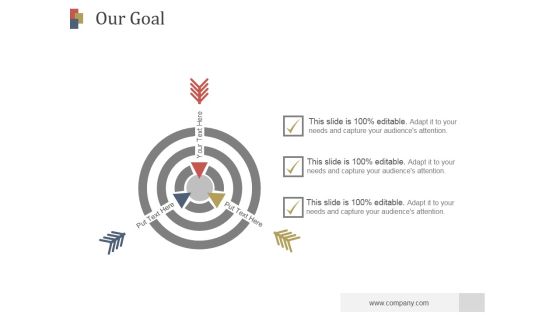
Our Goal Ppt PowerPoint Presentation Slides
This is a our goal ppt powerpoint presentation slides. This is a three stage process. The stages in this process are business, plan, arrow, process, target.

Profit Graph Business PowerPoint Templates And PowerPoint Themes 0512
Microsoft Powerpoint Templates and Background with bar chart growth
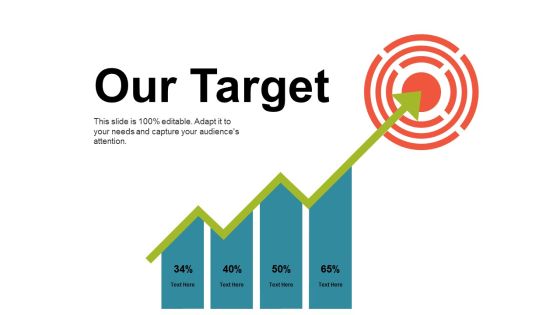
Our Target Ppt PowerPoint Presentation Summary Infographic Template
This is a our target ppt powerpoint presentation summary infographic template. This is a four stage process. The stages in this process are our target, arrow, marketing, strategy, business.

Strategic Plan Template 3 Ppt PowerPoint Presentation Gallery Model
This is a strategic plan template 3 ppt powerpoint presentation gallery model. This is a one stage process. The stages in this process are our goal, competition, marketing, strategy, business, arrow.

World Business Success PowerPoint Templates And PowerPoint Themes 0512
Microsoft Powerpoint Templates and Background with global profit growth charts

Stock Photo Conceptual Image Of Target Achievement PowerPoint Slide
This amazing image is designed with arrows hitting the target board. This professional image may be used to describe business and sales target. Use this image to set targets and to measure performance in your presentations.
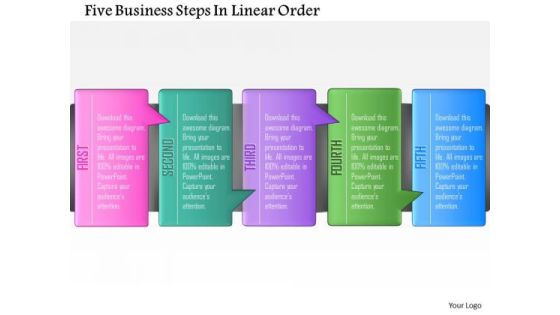
Consulting Slides Five Business Steps In Linear Order Business Presentation
Our awesome Diagram consists of a design of linear arrows with text placeholders. You can add text to text placeholders. This Diagram is designed to help bullet-point your views and thoughts

Consulting Slides Flow Of Five Business Steps Business Presentation
This diagram can be used in analyzing, designing, documenting or managing a process or program. Arrows represents flow of Information. It helps help the viewer to understand a process.

Consulting Slides Diagram Of Three Business Steps Business Presentation
Our awesome diagram consists with design of linear arrows with text placeholders. You can add text to text placeholders. This Diagram is designed to help bullet-point your views and thoughts
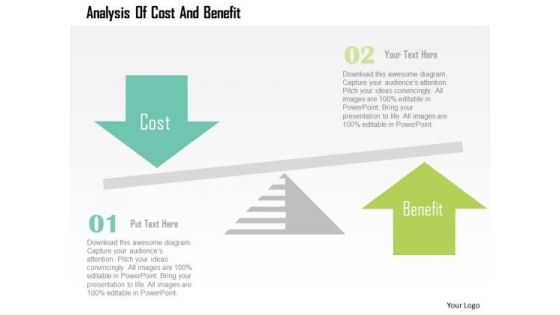
Business Diagram Analysis Of Cost And Benefit Presentation Template
This business diagram contains graphics of balancing scale with arrows of cost and benefit. You may use this diagram for analysis of cost and benefit. Communicate effectively with your group through this slide.

Statistical Technique Tags For Market Research Powerpoint Template
Graphic of arrows in linear flow has been used to design this business diagram. This diagram slide may be used to depict statistical techniques and market research. Use this editable slide to build quality presentation for your viewers.

Business Infographics Theme Design Powerpoint Slides
This PPT slide has been designed with circular arrows infographic diagram. This business diagram is suitable for marketing research and analysis. This professional slide helps in making an instant impact on viewers.
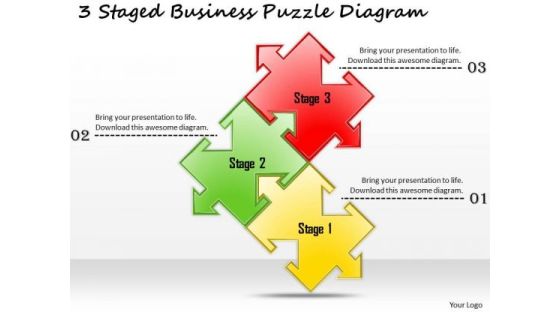
Business Development Strategy 3 Staged Puzzle Diagram Strategic Planning Templates
Be The Doer With Our business development strategy 3 staged puzzle diagram strategic planning templates Powerpoint Templates. Put Your Thoughts Into Practice. Your Ideas Will Do The Trick. Wave The Wand With Our Arrows Powerpoint Templates.

Multicolor Question Mark Design Powerpoint Template
This creative PPT slide has been designed with multicolor question mark arrows design. This business diagram is suitable for information display. Use this diagram in business presentations to give better impact.
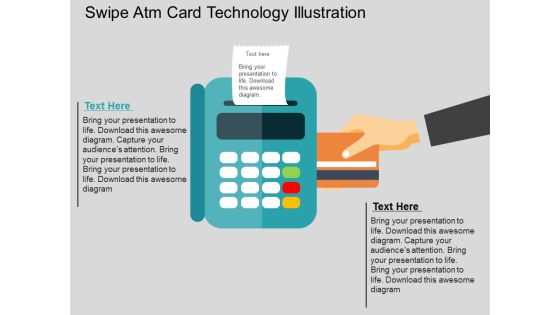
Swipe Atm Card Technology Illustration Powerpoint Templates
You can download this technology slide for topics like technology, internet and communication etc. It contains graphics of four arrows with global technology icons. Capture the attention of your audience using this exclusive template.

Three Text Tags With Alphabets Powerpoint Templates
The above template displays a diagram of circular arrows with icons. This diagram has been professionally designed to display steps of financial planning. Capture the attention of your audience.

Win Game PowerPoint Templates And PowerPoint Backgrounds 0911
Microsoft PowerPoint Template and Background with the word win on several circular arrows around a slot machine whose wheels are lined up in dollar signs symbolizing a jackpot or big winnings
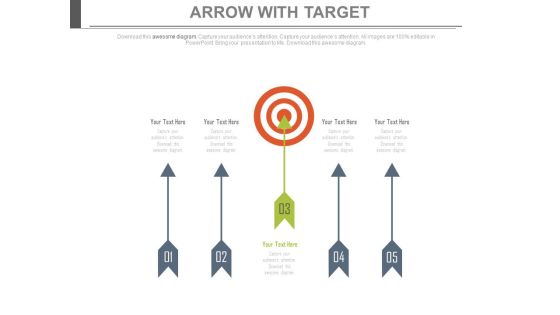
Strategies For Achieving Business Goal Powerpoint Slides
This PowerPoint template has been designed with arrows diagram with target board. You may use this PPT slide to display strategies for achieving business goal. Impress your audiences by using this PPT slide.

Text Boxes For Market Strategy Examples Powerpoint Template
This PowerPoint template contains graphics of colorful arrows text boxes. This PPT slide is suitable to present example of marketing strategy. Visual effect helps in maintaining the flow of the discussion and provides more clarity to the subject.

Business Graph Success PowerPoint Templates And PowerPoint Backgrounds 0411
Microsoft PowerPoint Template and Background with green arrow moving upwards rendering 2011

Business Graph Success PowerPoint Themes And PowerPoint Slides 0411
Microsoft PowerPoint Theme and Slide with green arrow moving upwards rendering 2011
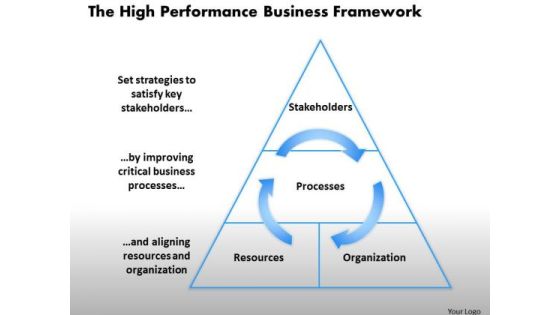
Business Framework The High Performance Business Framework 1 PowerPoint Presentation
This slide exhibits framework of high performance business. It contains pyramid diagram with circular arrows depicting strategies to satisfy key stakeholder by improving critical business processes and aligning resources and organization.
Graph Showing Success Business PowerPoint Templates And PowerPoint Backgrounds 0611
Microsoft PowerPoint Template and Background with the colour schedule with a red arrow rising upwards

Business Chart Success PowerPoint Templates And PowerPoint Backgrounds 0211
Microsoft PowerPoint Template and Background with growing gold graph with a red arrow pointing upward

Business Chart Success PowerPoint Themes And PowerPoint Slides 0211
Microsoft PowerPoint Theme and Slides with growing gold graph with a red arrow pointing upward

Business Graph01 Finance PowerPoint Templates And PowerPoint Backgrounds 1011
Microsoft PowerPoint Template and Background with growing gold graph with a red arrow pointing upward
Graph With Dollar Money PowerPoint Templates And PowerPoint Backgrounds 0511
Microsoft PowerPoint Template and Background with bar graph with dollars and a blue upward arrow
Bar Graph Rising Success PowerPoint Templates And PowerPoint Backgrounds 0611
Microsoft PowerPoint Template and Background with a bar graph with a rising green arrow

Bar Graph Rising Success PowerPoint Themes And PowerPoint Slides 0611
Microsoft PowerPoint Theme and Slide with a bar graph with a rising green arrow

Rising Profits Business PowerPoint Templates And PowerPoint Backgrounds 0411
Microsoft PowerPoint Template and Background with the arrow leaves a crack upwards

Rising Profits Business PowerPoint Themes And PowerPoint Slides 0411
Microsoft PowerPoint Theme and Slide with the arrow leaves a crack upwards
 Home
Home