Gross Profit

Coffee Shop Business Dashboard Category Blueprint For Opening A Coffee Shop Ppt Slides PDF
This slide shows the coffee shop business dashboard which includes sales month, gross margin by category, sales and profit details, etc. Deliver and pitch your topic in the best possible manner with this coffee shop business dashboard category blueprint for opening a coffee shop ppt slides pdf. Use them to share invaluable insights on sales, plan, gross margin and impress your audience. This template can be altered and modified as per your expectations. So, grab it now.

Coffee Shop Business Dashboard Category Business Plan For Opening A Coffeehouse Ppt Slides Graphics Example PDF
This slide shows the coffee shop business dashboard which includes sales month, gross margin by category, sales and profit details, etc. Deliver and pitch your topic in the best possible manner with this coffee shop business dashboard category business plan for opening a coffeehouse ppt slides graphics example pdf. Use them to share invaluable insights on sales, plan, gross margin and impress your audience. This template can be altered and modified as per your expectations. So, grab it now.
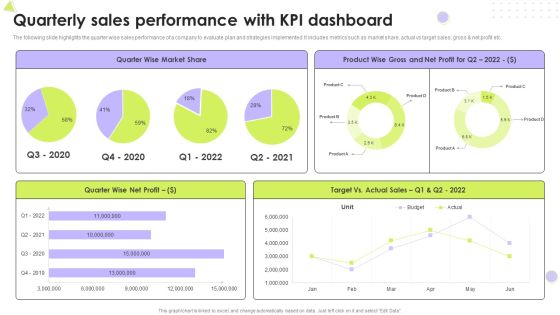
Quarterly Sales Performance With Kpi Dashboard Introduction PDF
The following slide highlights the quarter wise sales performance of a company to evaluate plan and strategies implemented. It includes metrics such as market share, actual vs target sales, gross and net profit etc. Pitch your topic with ease and precision using this Quarterly Sales Performance With Kpi Dashboard Introduction PDF. This layout presents information on Market Share, Net Profit, Target. It is also available for immediate download and adjustment. So, changes can be made in the color, design, graphics or any other component to create a unique layout.

Organization Accounting And Financial Performance Monitoring Dashboard Pictures PDF
This slide shows the dashboard prepared by accounting department of the organization for monitoring and measuring the financial position of the organization. It shows details regarding gross and net profit, current ratio, profit and loss trend, over due invoices and bills, cash flow and turnover rate of the organization.Showcasing this set of slides titled Organization Accounting And Financial Performance Monitoring Dashboard Pictures PDF. The topics addressed in these templates are Account Overview, Due Invoice, Loss Trend. All the content presented in this PPT design is completely editable. Download it and make adjustments in color, background, font etc. as per your unique business setting.
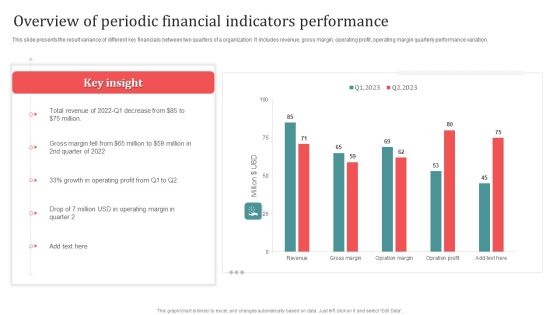
Overview Of Periodic Financial Indicators Performance Designs PDF
This slide presents the result variance of different key financials between two quarters of a organization. It includes revenue, gross margin, operating profit, operating margin quarterly performance variation. Showcasing this set of slides titled Overview Of Periodic Financial Indicators Performance Designs PDF. The topics addressed in these templates are Overview Of Periodic, Financial Indicators Performance. All the content presented in this PPT design is completely editable. Download it and make adjustments in color, background, font etc. as per your unique business setting.

Taxi Aggregator Venture Capitalist Fundraising Financial Highlights Diagrams PDF
This slide provides the glimpse about the financial highlights which focuses on sales, gross margin, net profit, etc. This is a taxi aggregator venture capitalist fundraising financial highlights diagrams pdf template with various stages. Focus and dispense information on one stages using this creative set, that comes with editable features. It contains large content boxes to add your information on topics like financial highlights. You can also showcase facts, figures, and other relevant content using this PPT layout. Grab it now.
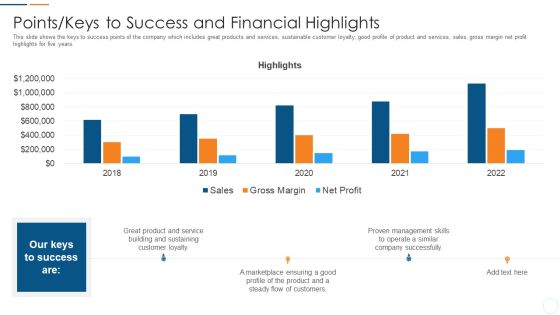
Organization Development Initiatives For Startups Points Keys To Success And Financial Highlights Graphics PDF
This slide shows the keys to success points of the company which includes great products and services, sustainable customer loyalty, good profile of product and services, sales, gross margin net profit highlights for five years. Deliver an awe inspiring pitch with this creative organization development initiatives for startups points keys to success and financial highlights graphics pdf bundle. Topics like service, marketplace, management can be discussed with this completely editable template. It is available for immediate download depending on the needs and requirements of the user.

Build Effective Business Strategy For Financial Development Points Keys To Success And Financial Highlights Download PDF
This slide shows the keys to success points of the company which includes great products and services, sustainable customer loyalty, good profile of product and services, sales, gross margin net profit highlights for five years. Deliver an awe inspiring pitch with this creative build effective business strategy for financial development points keys to success and financial highlights download pdf bundle. Topics like points keys to success and financial highlights can be discussed with this completely editable template. It is available for immediate download depending on the needs and requirements of the user.

Corporate Strategy For Business Development Market Segmentation Analysis Related Information PDF
slide shows the keys to success points of the company which includes great products and services, sustainable customer loyalty, good profile of product and services, sales, gross margin net profit highlights for five years. Deliver an awe inspiring pitch with this creative corporate strategy for business development market segmentation analysis related information pdf bundle. Topics like market segmentation analysis related to customers can be discussed with this completely editable template. It is available for immediate download depending on the needs and requirements of the user.

Corporate Strategy For Business Development Points Keys To Success And Financial Mockup PDF
slide shows the keys to success points of the company which includes great products and services, sustainable customer loyalty, good profile of product and services, sales, gross margin net profit highlights for five years. Deliver an awe inspiring pitch with this creative corporate strategy for business development points keys to success and financial mockup pdf bundle. Topics like points keys to success and financial highlights can be discussed with this completely editable template. It is available for immediate download depending on the needs and requirements of the user.
Points Keys To Success And Financial Highlights Start Up Master Plan Icons PDF
This slide shows the keys to success points of the company which includes great products and services, sustainable customer loyalty, good profile of product and services, sales, gross margin net profit highlights for five years.Deliver and pitch your topic in the best possible manner with this points keys to success and financial highlights start up master plan icons pdf Use them to share invaluable insights on sustaining customer loyalty, marketplace ensuring, proven management and impress your audience. This template can be altered and modified as per your expectations. So, grab it now.

Growth Strategy For Startup Company Points Keys To Success And Financial Highlights Download PDF
This slide shows the keys to success points of the company which includes great products and services, sustainable customer loyalty, good profile of product and services, sales, gross margin net profit highlights for five years. Deliver and pitch your topic in the best possible manner with this Growth Strategy For Startup Company Points Keys To Success And Financial Highlights Download PDF. Use them to share invaluable insights on Great Product And Service, Building And Sustaining, Customer Loyalty and impress your audience. This template can be altered and modified as per your expectations. So, grab it now.

Working Insurance Business Model Companies Slides PDF
This slide includes business framework of insurance companies and their functioning system. It has total customers, gross written premium, claims , profit and premium per customer.Persuade your audience using this Working Insurance Business Model Companies Slides PDF This PPT design covers two stages, thus making it a great tool to use. It also caters to a variety of topics including Premium Customer, Gross Written, Paid Customers Download this PPT design now to present a convincing pitch that not only emphasizes the topic but also showcases your presentation skills.

hotel cafe business plan coffee shop business dashboard actual elements pdf
This slide shows the coffee shop business dashboard which includes sales month, gross margin by category, sales and profit details, etc. Deliver an awe inspiring pitch with this creative hotel cafe business plan coffee shop business dashboard actual elements pdf bundle. Topics like coffee shop business dashboard can be discussed with this completely editable template. It is available for immediate download depending on the needs and requirements of the user.
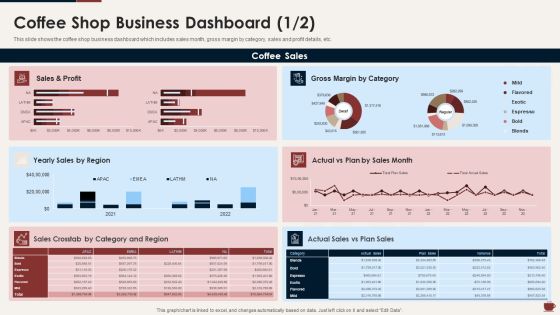
Master Plan For Opening Bistro Coffee Shop Business Inspiration PDF
This slide shows the coffee shop business dashboard which includes sales month, gross margin by category, sales and profit details, etc. Deliver and pitch your topic in the best possible manner with this master plan for opening bistro coffee shop business inspiration pdf. Use them to share invaluable insights on coffee shop business dashboard and impress your audience. This template can be altered and modified as per your expectations. So, grab it now.

Highlight Revenue Generated After Implementation Integrated Marketing Framework Professional PDF
This slide depicts the statistics illustrating the amount of money made once the marketing work plan was implemented to assist in meeting the objectives. It covers sales generate, gross margin, and net profit for the period from 2021 to 2025.Showcasing this set of slides titled Highlight Revenue Generated After Implementation Integrated Marketing Framework Professional PDF. The topics addressed in these templates are Highest Number, Sales Took. All the content presented in this PPT design is completely editable. Download it and make adjustments in color, background, font etc. as per your unique business setting.
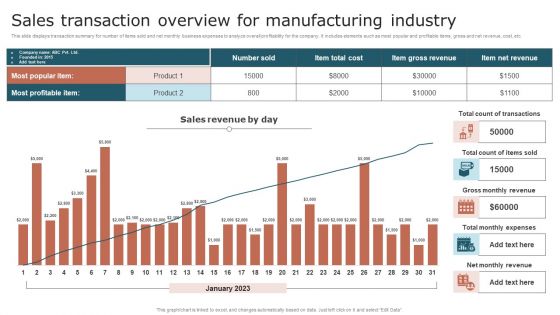
Sales Transaction Overview For Manufacturing Industry Elements PDF
This slide displays transaction summary for number of items sold and net monthly business expenses to analyze overall profitability for the company. It includes elements such as most popular and profitable items, gross and net revenue, cost, etc. Pitch your topic with ease and precision using this Sales Transaction Overview For Manufacturing Industry Elements PDF. This layout presents information on Product, Sales Revenue, Transactions. It is also available for immediate download and adjustment. So, changes can be made in the color, design, graphics or any other component to create a unique layout.

Budget Analysis Dashboard With Actual And Forecasted Revenue Comparison Structure PDF
This slide displays the budget analysis report comparing the budget with the actual year to date data. It also helps in making estimations for the remaining year. It includes variance between budgeted and actual gross margin results, service revenue, profit margin, product revenue, payroll cost, etc. Pitch your topic with ease and precision using this Budget Analysis Dashboard With Actual And Forecasted Revenue Comparison Structure PDF. This layout presents information on Payroll Cost, Budget Revenue Components, Product Revenue. It is also available for immediate download and adjustment. So, changes can be made in the color, design, graphics or any other component to create a unique layout.
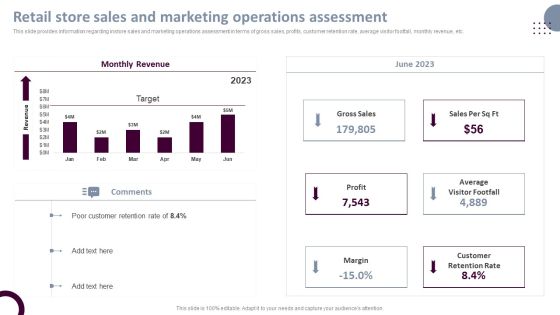
Retail Store Operations Retail Store Sales And Marketing Operations Assessment Brochure PDF
This slide provides information regarding instore sales and marketing operations assessment in terms of gross sales, profits, customer retention rate, average visitor footfall, monthly revenue, etc. Are you in need of a template that can accommodate all of your creative concepts This one is crafted professionally and can be altered to fit any style. Use it with Google Slides or PowerPoint. Include striking photographs, symbols, depictions, and other visuals. Fill, move around, or remove text boxes as desired. Test out color palettes and font mixtures. Edit and save your work, or work with colleagues. Download Retail Store Operations Retail Store Sales And Marketing Operations Assessment Brochure PDF and observe how to make your presentation outstanding. Give an impeccable presentation to your group and make your presentation unforgettable.

BI Technique For Data Informed Decisions Financial Performance Of Organization Guidelines PDF
This slide visually present the financial performance of organization in terms of revenue, gross and net profit and earnings per share with key insights. If you are looking for a format to display your unique thoughts, then the professionally designed BI Technique For Data Informed Decisions Financial Performance Of Organization Guidelines PDF is the one for you. You can use it as a Google Slides template or a PowerPoint template. Incorporate impressive visuals, symbols, images, and other charts. Modify or reorganize the text boxes as you desire. Experiment with shade schemes and font pairings. Alter, share or cooperate with other people on your work. Download BI Technique For Data Informed Decisions Financial Performance Of Organization Guidelines PDF and find out how to give a successful presentation. Present a perfect display to your team and make your presentation unforgettable.
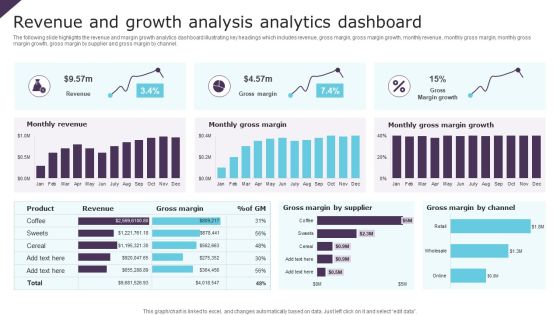
Revenue And Growth Analysis Analytics Dashboard Ppt Infographic Template Brochure PDF
The following slide highlights the revenue and margin growth analytics dashboard illustrating key headings which includes revenue, gross margin, gross margin growth, monthly revenue, monthly gross margin, monthly gross margin growth, gross margin by supplier and gross margin by channel. Pitch your topic with ease and precision using this Revenue And Growth Analysis Analytics Dashboard Ppt Infographic Template Brochure PDF. This layout presents information on Monthly Revenue, Monthly Gross Margin, Gross Margin Growth. It is also available for immediate download and adjustment. So, changes can be made in the color, design, graphics or any other component to create a unique layout.
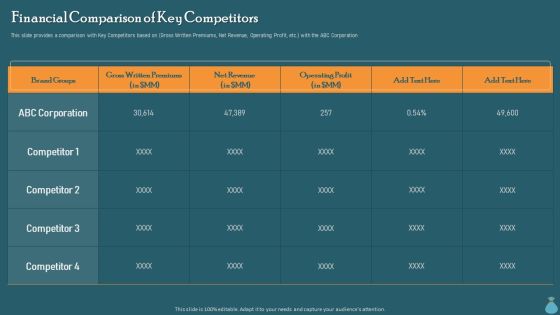
Financial Data Revelation To Varied Stakeholders Financial Comparison Of Key Competitors Microsoft PDF
This slide provides a comparison with Key Competitors based on Gross Written Premiums, Net Revenue, Operating Profit, etc. with the ABC Corporation. Make sure to capture your audiences attention in your business displays with our gratis customizable Financial Data Revelation To Varied Stakeholders Financial Comparison Of Key Competitors Microsoft PDF. These are great for business strategies, office conferences, capital raising or task suggestions. If you desire to acquire more customers for your tech business and ensure they stay satisfied, create your own sales presentation with these plain slides.

Financial Reporting To Analyze Financial Comparison Of Key Competitors Designs PDF
This slide provides a comparison with Key Competitors based on Gross Written Premiums, Net Revenue, Operating Profit, etc. with the ABC Corporation Get a simple yet stunning designed Financial Reporting To Analyze Financial Comparison Of Key Competitors Designs PDF. It is the best one to establish the tone in your meetings. It is an excellent way to make your presentations highly effective. So, download this PPT today from Slidegeeks and see the positive impacts. Our easy-to-edit Financial Reporting To Analyze Financial Comparison Of Key Competitors Designs PDF can be your go-to option for all upcoming conferences and meetings. So, what are you waiting for Grab this template today.
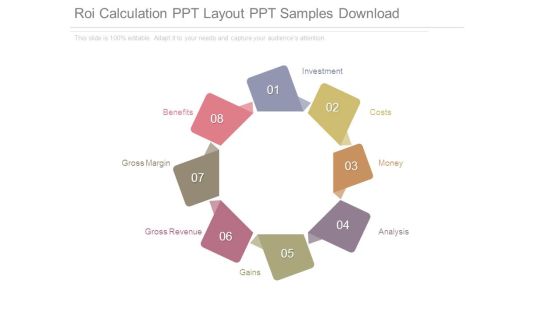
Roi Calculation Ppt Layout Ppt Samples Download
This is a roi calculation ppt layout ppt samples download. This is a eight stage process. The stages in this process are investment, costs, money, analysis, gains, gross revenue, gross margin, benefits.
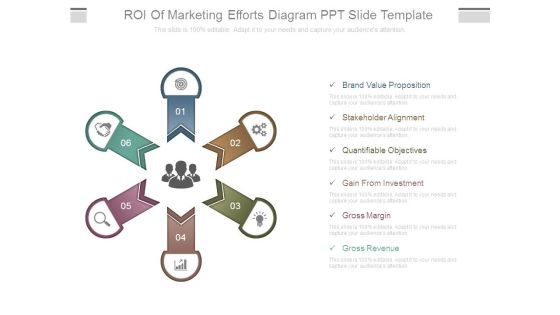
Roi Of Marketing Efforts Diagram Ppt Slide Template
This is a roi of marketing efforts diagram ppt slide template. This is a six stage process. The stages in this process are brand value proposition, stakeholder alignment, quantifiable objectives, gain from investment, gross margin, gross revenue.

Executive Dashboards To Track Sales Performance Guidelines PDF
This slide represents the CEO dashboard for tracking the sales performance of the organization. It includes key performance indicators such as gross, operating and net profit, sales amount by category, income statement etc. Pitch your topic with ease and precision using this Executive Dashboards To Track Sales Performance Guidelines PDF. This layout presents information on Income Statement, Monthly Sales Growth, Days Receivable Outstanding. It is also available for immediate download and adjustment. So, changes can be made in the color, design, graphics or any other component to create a unique layout.

Organization Key Metrics Summary By Human Resource Team Information PDF
This slide represents the dashboard showing the organizations financial health report prepared by the human resource department of the organization. It includes information related to sales, gross, operating and net profit, income statement, actual vs target sales, net operating cash etc. of the organization.Showcasing this set of slides titled Organization Key Metrics Summary By Human Resource Team Information PDF. The topics addressed in these templates are Organization Key Metrics Summary, Human Resource Team. All the content presented in this PPT design is completely editable. Download it and make adjustments in color, background, font etc. as per your unique business setting.

Company Income Bridge With Sales And Marketing Ppt PowerPoint Presentation Gallery Templates PDF
This slide showcase company revenue bridge with sales and marketing which includes gross revenue, gross income, operating income and taxes. Pitch your topic with ease and precision using this Company Income Bridge With Sales And Marketing Ppt PowerPoint Presentation Gallery Templates PDF. This layout presents information on Gross Revenue, Net Revenue, Rev Adjustments. It is also available for immediate download and adjustment. So, changes can be made in the color, design, graphics or any other component to create a unique layout.

Conversion Rate Template 1 Ppt PowerPoint Presentation Visual Aids
This is a conversion rate template 1 ppt powerpoint presentation visual aids. This is a two stage process. The stages in this process are net revenue, gross revenue.

Conversion Rate Template 1 Ppt PowerPoint Presentation Show
This is a conversion rate template 1 ppt powerpoint presentation show. This is a two stage process. The stages in this process are gross revenue, net revenue .

Conversion Rate Template 1 Ppt PowerPoint Presentation Styles
This is a conversion rate template 1 ppt powerpoint presentation styles. This is a two stage process. The stages in this process are net revenue, gross revenue.
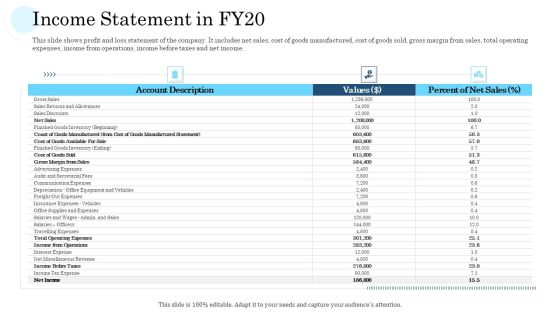
Mass Producing Firm Performance Assessment Income Statement In FY20 Information PDF
This slide shows profit and loss statement of the company. It includes net sales, cost of goods manufactured, cost of goods sold, gross margin from sales, total operating expenses, income from operations, income before taxes and net income.Deliver an awe-inspiring pitch with this creative mass producing firm performance assessment income statement in fy20 information pdf. bundle. Topics like net sales, gross sales, values can be discussed with this completely editable template. It is available for immediate download depending on the needs and requirements of the user.

Managing CFO Services Company Year End Tax Filing Plan Ppt Gallery Files PDF
Presenting this set of slides with name managing cfo services company year end tax filing plan ppt gallery files pdf. The topics discussed in these slides are gross income, adjustments to gross income. This is a completely editable PowerPoint presentation and is available for immediate download. Download now and impress your audience.
SAC Planning And Implementation SAP Analytics Cloud Dashboard For Product Sales Analysis Icons PDF
This slide illustrates the SAP Analytics Cloud dashboard to monitor product sales performance. It provides information regarding the gross margin and net revenue earned, product performance state wise and year wise. Deliver and pitch your topic in the best possible manner with this SAC Planning And Implementation SAP Analytics Cloud Dashboard For Product Sales Analysis Icons PDF. Use them to share invaluable insights on Gross Margin, Earned Quarter Wise, Gross Margin, Net Revenue and impress your audience. This template can be altered and modified as per your expectations. So, grab it now.
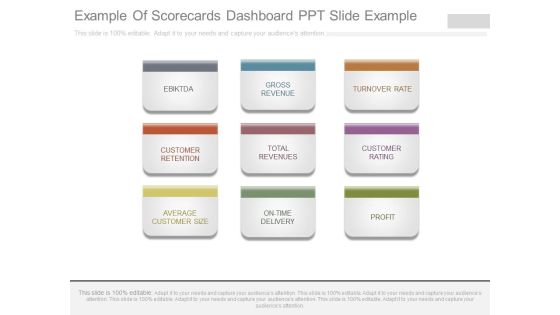
Example Of Scorecards Dashboard Ppt Slide Example
This is a example of scorecards dashboard ppt slide example. This is a nine stage process. The stages in this process are ebiktda, gross revenue, turnover rate, customer retention, total revenues, customer rating, average customer size, on time delivery, profit.

Benchmark Criteria For Various Saas Company KPI Guidelines PDF
The purpose of this slide is to showcase the benchmark criteria for different SaaS metrics. The metrics mentioned in the slide are annual recurring revenue ARR, gross margins, payback period, customer acquisition cost CAC, etc. Showcasing this set of slides titled Benchmark Criteria For Various Saas Company KPI Guidelines PDF. The topics addressed in these templates are Net Dollar Retention, Payback Period, Gross Logo, Gross Margins. All the content presented in this PPT design is completely editable. Download it and make adjustments in color, background, font etc. as per your unique business setting.

Overall Objectives And Goals Actual Performance And Targets Infographics PDF
This template covers the target performance and actual performance of the real estate business. It includes comparison based on number of deal closed, average listing price, gross income, sales volume, number of buyers or clients closed etc. Deliver and pitch your topic in the best possible manner with this overall objectives and goals actual performance and targets infographics pdf. Use them to share invaluable insights on sales volume, gross commission income, gross income and impress your audience. This template can be altered and modified as per your expectations. So, grab it now.

Effective Company Event Communication Tactics Dashboard For Tracking Event Revenue And Registrations Graphics PDF
This slide covers metrics for analyzing the event revenue and registrations. It includes KPIs such as gross revenue, gross revenue from promos, total refund, total registration, visits to purchase conversion, check-in- status, etc. Deliver and pitch your topic in the best possible manner with this Effective Company Event Communication Tactics Dashboard For Tracking Event Revenue And Registrations Graphics PDF. Use them to share invaluable insights on Gross Revenue, Registration Analysis, Purchase Conversion and impress your audience. This template can be altered and modified as per your expectations. So, grab it now.

Effective Company Event Communication Plan Email Marketing Action Steps And Best Practices Information PDF
This slide covers metrics for analyzing the event revenue and registrations. It includes KPIs such as gross revenue, gross revenue from promos, total refund, total registration, visits to purchase conversion, check-in- status, etc. Deliver and pitch your topic in the best possible manner with this Effective Company Event Communication Plan Email Marketing Action Steps And Best Practices Information PDF Use them to share invaluable insights on Registration Analysis, Revenue Analysis, Gross Revenue and impress your audience. This template can be altered and modified as per your expectations. So, grab it now.

Net Present Value Method Diagram Ppt Sample File
This is a net present value method diagram ppt sample file. This is a six stage process. The stages in this process are roi, gross margin, net income, cash flow, capital, turnover.

Targeted Customer Cost Structure Ppt Sample File
This is a targeted customer cost structure ppt sample file. This is a seven stage process. The stages in this process are life time value, customer segments, targeted customer, key metrics, key activity, cost structure, gross margin.
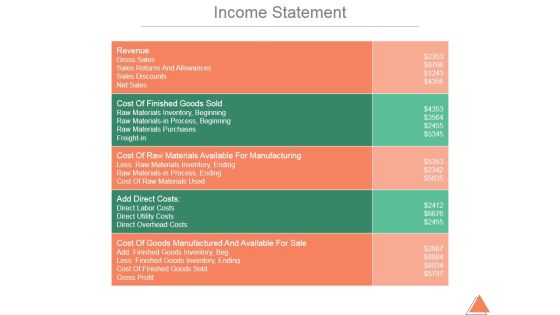
Income Statement Ppt PowerPoint Presentation Background Images
This is a income statement ppt powerpoint presentation background images. This is a five stage process. The stages in this process are revenue, gross sales, sales returns and allowances, sales discounts, net sales.
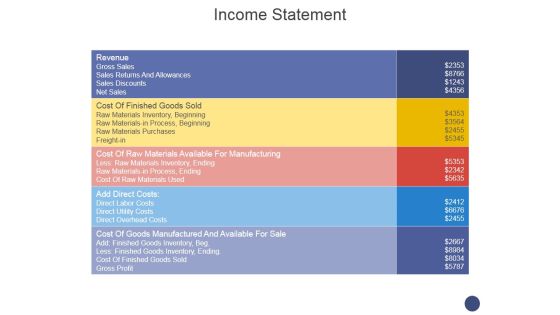
Income Statement Ppt PowerPoint Presentation Model Background
This is a income statement ppt powerpoint presentation model background. This is a five stage process. The stages in this process are revenue, gross sales, net sales, sales discounts, freight in.
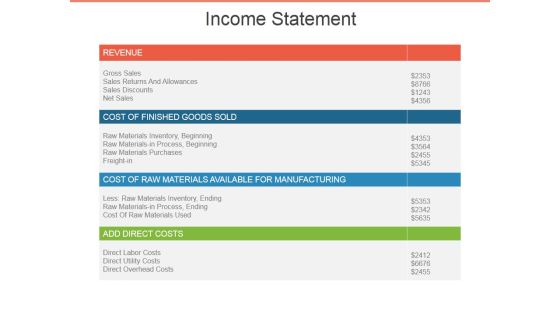
Income Statement Ppt PowerPoint Presentation Layouts Outfit
This is a income statement ppt powerpoint presentation layouts outfit. This is a four stage process. The stages in this process are gross sales, sales returns and allowances, sales discounts, net sales.
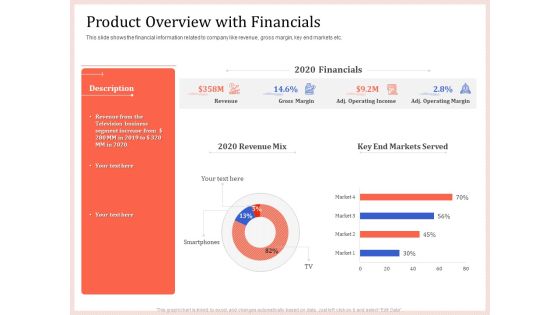
Pitch Deck To Raise Capital From Product Pooled Funding Product Overview With Financials Diagrams PDF
This slide shows the financial information related to company like revenue, gross margin, key end markets etc. Deliver and pitch your topic in the best possible manner with this pitch deck to raise capital from product pooled funding product overview with financials diagrams pdf. Use them to share invaluable insights on revenue, gross margin, operating income, operating margin and impress your audience. This template can be altered and modified as per your expectations. So, grab it now.
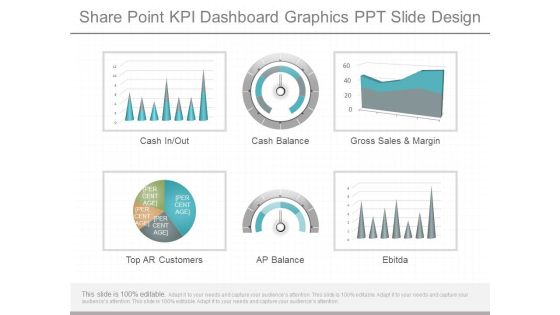
Share Point Kpi Dashboard Graphics Ppt Slide Design
This is a share point kpi dashboard graphics ppt slide design. This is a six stage process. The stages in this process are cash in out, cash balance, gross sales and margin, top ar customers, ap balance, ebitda.
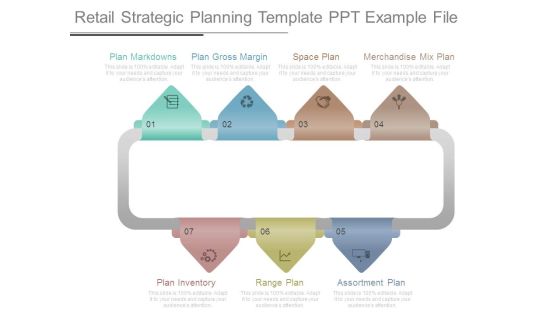
Retail Strategic Planning Template Ppt Example File
This is a retail strategic planning template ppt example file. This is a seven stage process. The stages in this process are plan markdowns, plan gross margin, space plan, merchandise mix plan, plan inventory, range plan, assortment plan.
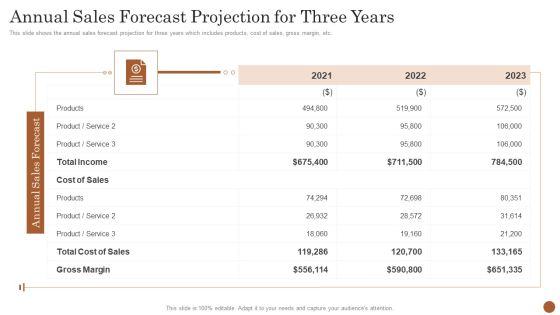
Business Model Opening Restaurant Annual Sales Forecast Projection For Three Years Sample PDF
This slide shows the annual sales forecast projection for three years which includes products, cost of sales, gross margin, etc. Deliver an awe inspiring pitch with this creative business model opening restaurant annual sales forecast projection for three years sample pdf bundle. Topics like gross margin, cost of sales, income, products, service can be discussed with this completely editable template. It is available for immediate download depending on the needs and requirements of the user.

Business Tax Deductions Diagram Example Of Ppt
This is a business tax deductions diagram example of ppt. This is a four stage process. The stages in this process are revenue, business expenses, gross income, taxable income.
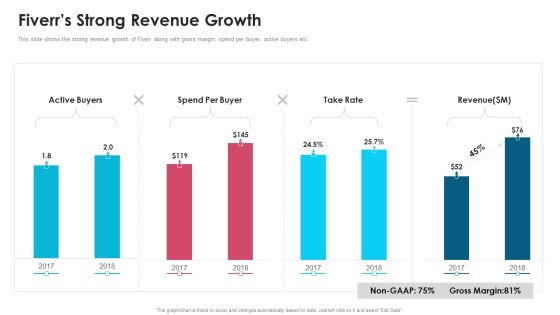
Fiverr Capital Fundraising Fiverrs Strong Revenue Growth Ppt Gallery Skills PDF
This slide shows the strong revenue growth of Fiverr along with gross margin, spend per buyer, active buyers etc. Deliver an awe inspiring pitch with this creative Fiverr Capital Fundraising Fiverrs Strong Revenue Growth Ppt Gallery Skills PDF bundle. Topics like Active Buyers Revenue, Spend Per Buyer, Take Rate Gross can be discussed with this completely editable template. It is available for immediate download depending on the needs and requirements of the user.

Valuation Results Ppt PowerPoint Presentation Professional Objects
This is a valuation results ppt powerpoint presentation professional objects. This is a two stage process. The stages in this process are valuation results, enterprise value, equity value, outstanding shares, gross enterprise value.
Valuation Results Ppt PowerPoint Presentation File Icon
This is a valuation results ppt powerpoint presentation file icon. This is a two stage process. The stages in this process are enterprise value, gross enterprise value, equity value, outstanding shares.

Conversion Rate Template 1 Ppt PowerPoint Presentation Portfolio
This is a conversion rate template 1 ppt powerpoint presentation portfolio. This is a three stage process. The stages in this process are gross revenue, net revenue, from last year.

Conversion Rate Template 1 Ppt PowerPoint Presentation Visual Aids Files
This is a conversion rate template 1 ppt powerpoint presentation visual aids files. This is a two stage process. The stages in this process are net revenue gross revenue from last year.

Reduce Expenses Powerpoint Slide Presentation Examples
This is a reduce expenses powerpoint slide presentation examples. This is a seven stage process. The stages in this process are reduce expenses, increase gross revenue, performance and service, operations management process, customer management process, innovation process, communication amongst workers.

Break Even Analysis Ppt PowerPoint Presentation Inspiration Example Introduction
This is a break even analysis ppt powerpoint presentation inspiration example introduction. This is a four stage process. The stages in this process are gross revenue, variable expenses, contribution, break even point, pat.

Break Even Analysis Ppt PowerPoint Presentation Model Example File
This is a break even analysis ppt powerpoint presentation model example file. This is a six stage process. The stages in this process are gross revenue, variable expenses, contribution, fixed expenses, break even point.

Break Even Analysis Ppt PowerPoint Presentation Layouts Rules
This is a break even analysis ppt powerpoint presentation layouts rules. This is a six stage process. The stages in this process are gross revenue, variable expenses, contribution, fixed expenses.

Information Technology Solutions Business Profile Financial Ratio Analysis Clipart PDF
This slide focuses on comparison of financial ratios of company for four consecutive years which includes current ratio, quick ratio, inventory turnover ratio, return on assets, gross margin ratio, etc. Deliver an awe inspiring pitch with this creative Information Technology Solutions Business Profile Financial Ratio Analysis Clipart PDF bundle. Topics like Return On Assets, Gross Margin, Inventory Turnover can be discussed with this completely editable template. It is available for immediate download depending on the needs and requirements of the user.

Small Business Venture Company Profile Financial Ratio Analysis Pictures PDF
This slide focuses on comparison of financial ratios of company for four consecutive years which includes current ratio, quick ratio, inventory turnover ratio, return on assets, gross margin ratio, etc. Deliver an awe inspiring pitch with this creative Small Business Venture Company Profile Financial Ratio Analysis Pictures PDF bundle. Topics like Inventory Turnover, Gross Margin, Quick Ratio can be discussed with this completely editable template. It is available for immediate download depending on the needs and requirements of the user.
 Home
Home