Gross Profit

Research Business Financials Life Science And Healthcare Solutions Company Profile Information PDF
The slide describes financial details for Research business vertical. It showcase revenue, gross profit, operating profit, EBIDTA and net profit along with margin. If you are looking for a format to display your unique thoughts, then the professionally designed Research Business Financials Life Science And Healthcare Solutions Company Profile Information PDF is the one for you. You can use it as a Google Slides template or a PowerPoint template. Incorporate impressive visuals, symbols, images, and other charts. Modify or reorganize the text boxes as you desire. Experiment with shade schemes and font pairings. Alter, share or cooperate with other people on your work. Download Research Business Financials Life Science And Healthcare Solutions Company Profile Information PDF and find out how to give a successful presentation. Present a perfect display to your team and make your presentation unforgettable.
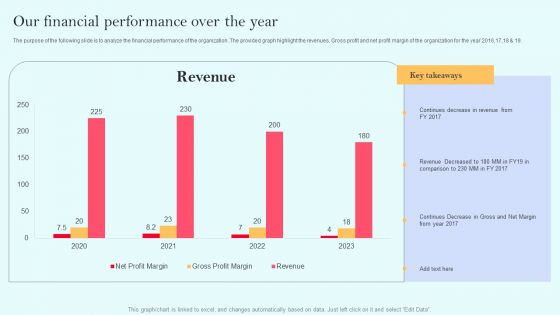
Recurring Income Generation Model Our Financial Performance Over The Year Clipart PDF
The purpose of the following slide is to analyze the financial performance of the organization. The provided graph highlight the revenues, Gross profit and net profit margin of the organization for the year 2016,17,18 and 19. Welcome to our selection of the Recurring Income Generation Model Our Financial Performance Over The Year Clipart PDF. These are designed to help you showcase your creativity and bring your sphere to life. Planning and Innovation are essential for any business that is just starting out. This collection contains the designs that you need for your everyday presentations. All of our PowerPoints are 100 percent editable, so you can customize them to suit your needs. This multi purpose template can be used in various situations. Grab these presentation templates today.
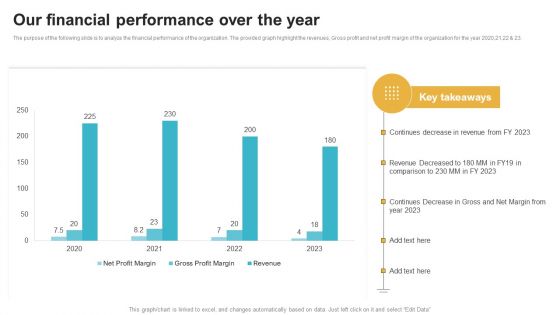
Saas Continuous Income Generation Model For Software Startup Our Financial Performance Over The Year Download PDF
The purpose of the following slide is to analyze the financial performance of the organization. The provided graph highlight the revenues, Gross profit and net profit margin of the organization for the year 2020,21,22 and 23. Welcome to our selection of the Saas Continuous Income Generation Model For Software Startup Our Financial Performance Over The Year Download PDF. These are designed to help you showcase your creativity and bring your sphere to life. Planning and Innovation are essential for any business that is just starting out. This collection contains the designs that you need for your everyday presentations. All of our PowerPoints are 100 percent editable, so you can customize them to suit your needs. This multi purpose template can be used in various situations. Grab these presentation templates today.

Construction Project Cost Benefit Analysis Report Project Feasibility Financial Ratios Ideas PDF
Following slide covers project feasibility financial ratio along with graphical representation. Ratios included are net profit sales, quick ratio, debt equity ratio and gross profit sales. Presenting this PowerPoint presentation, titled Construction Project Cost Benefit Analysis Report Project Feasibility Financial Ratios Ideas PDF, with topics curated by our researchers after extensive research. This editable presentation is available for immediate download and provides attractive features when used. Download now and captivate your audience. Presenting this Construction Project Cost Benefit Analysis Report Project Feasibility Financial Ratios Ideas PDF. Our researchers have carefully researched and created these slides with all aspects taken into consideration. This is a completely customizable Construction Project Cost Benefit Analysis Report Project Feasibility Financial Ratios Ideas PDF that is available for immediate downloading. Download now and make an impact on your audience. Highlight the attractive features available with our PPTs.
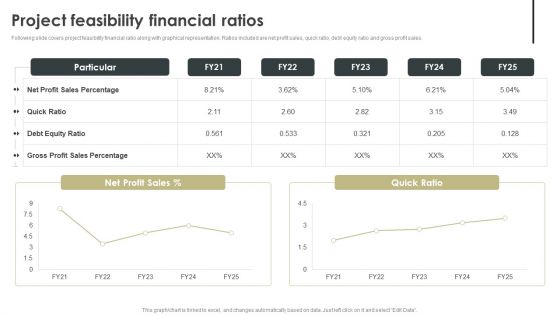
Construction Project Cost Benefit Analysis Report For Mortgage Approval Project Feasibility Financial Ratios Topics PDF
Following slide covers project feasibility financial ratio along with graphical representation. Ratios included are net profit sales, quick ratio, debt equity ratio and gross profit sales. Presenting this PowerPoint presentation, titled Construction Project Cost Benefit Analysis Report For Mortgage Approval Project Feasibility Financial Ratios Topics PDF, with topics curated by our researchers after extensive research. This editable presentation is available for immediate download and provides attractive features when used. Download now and captivate your audience. Presenting this Construction Project Cost Benefit Analysis Report For Mortgage Approval Project Feasibility Financial Ratios Topics PDF. Our researchers have carefully researched and created these slides with all aspects taken into consideration. This is a completely customizable Construction Project Cost Benefit Analysis Report For Mortgage Approval Project Feasibility Financial Ratios Topics PDF that is available for immediate downloading. Download now and make an impact on your audience. Highlight the attractive features available with our PPTs.

Income Statement Clothing Retailer Company Profile CP SS V
This slide represents the income statement highlights for HandM company. It includes the last 5 years net sales, gross profit and operating profit. Are you in need of a template that can accommodate all of your creative concepts This one is crafted professionally and can be altered to fit any style. Use it with Google Slides or PowerPoint. Include striking photographs, symbols, depictions, and other visuals. Fill, move around, or remove text boxes as desired. Test out color palettes and font mixtures. Edit and save your work, or work with colleagues. Download Income Statement Clothing Retailer Company Profile CP SS V and observe how to make your presentation outstanding. Give an impeccable presentation to your group and make your presentation unforgettable.
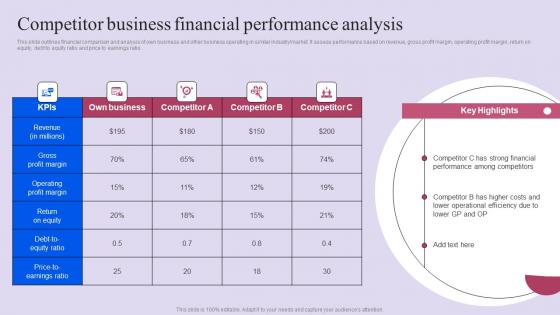
Competitor Business Financial Performance Analysis Ppt Slides Display Pdf
This slide outlines financial comparison and analysis of own business and other business operating in similar industrymarket. It assess performance based on revenue, gross profit margin, operating profit margin, return on equity, debt to equity ratio and price to earnings ratio. Do you have an important presentation coming up Are you looking for something that will make your presentation stand out from the rest Look no further than Competitor Business Financial Performance Analysis Ppt Slides Display Pdf. With our professional designs, you can trust that your presentation will pop and make delivering it a smooth process. And with Slidegeeks, you can trust that your presentation will be unique and memorable. So why wait Grab Competitor Business Financial Performance Analysis Ppt Slides Display Pdf today and make your presentation stand out from the rest
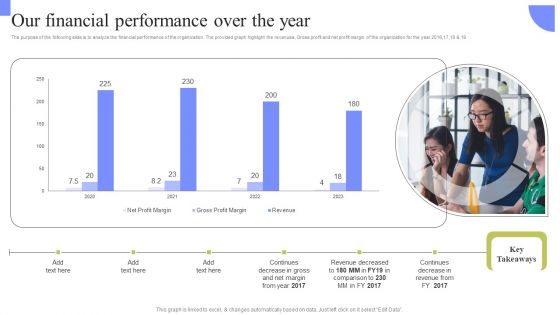
Periodic Revenue Model Our Financial Performance Over The Year Themes PDF
The purpose of the following slide is to analyze the financial performance of the organization. The provided graph highlight the revenues, Gross profit and net profit margin of the organization for the year 2016,17,18 and 19. Create an editable Periodic Revenue Model Our Financial Performance Over The Year Themes PDF that communicates your idea and engages your audience. Whether youre presenting a business or an educational presentation, pre designed presentation templates help save time. Periodic Revenue Model Our Financial Performance Over The Year Themes PDF is highly customizable and very easy to edit, covering many different styles from creative to business presentations. Slidegeeks has creative team members who have crafted amazing templates. So, go and get them without any delay.

Membership Based Revenue Plan Our Financial Performance Over The Year Mockup PDF
The purpose of the following slide is to analyze the financial performance of the organization. The provided graph highlight the revenues, Gross profit and net profit margin of the organization for the year 2020,21,22 and 23. Are you in need of a template that can accommodate all of your creative concepts This one is crafted professionally and can be altered to fit any style. Use it with Google Slides or PowerPoint. Include striking photographs, symbols, depictions, and other visuals. Fill, move around, or remove text boxes as desired. Test out color palettes and font mixtures. Edit and save your work, or work with colleagues. Download Membership Based Revenue Plan Our Financial Performance Over The Year Mockup PDF and observe how to make your presentation outstanding. Give an impeccable presentation to your group and make your presentation unforgettable.

Assessing Debt And Equity Fundraising Alternatives For Business Growth Financial KPI Dashboard To Evaluate Infographics PDF
This slide showcases dashboard that can help organization to evaluate key changes in financial kpis post fundraising. Its key components are net profit margin, revenue, gross profit margin, debt to equity and return on equity. This Assessing Debt And Equity Fundraising Alternatives For Business Growth Financial KPI Dashboard To Evaluate Infographics PDF is perfect for any presentation, be it in front of clients or colleagues. It is a versatile and stylish solution for organizing your meetings. TheAssessing Debt And Equity Fundraising Alternatives For Business Growth Financial KPI Dashboard To Evaluate Infographics PDF features a modern design for your presentation meetings. The adjustable and customizable slides provide unlimited possibilities for acing up your presentation. Slidegeeks has done all the homework before launching the product for you. So, do not wait, grab the presentation templates today

BPR To Develop Operational Effectiveness Dashboard To Measure Business Financial Performance Elements PDF
This slide shows the dashboard to measure business financial performance which focuses on revenues, debt to equity, net profit margin, gross profit margin and return on equity. Coming up with a presentation necessitates that the majority of the effort goes into the content and the message you intend to convey. The visuals of a PowerPoint presentation can only be effective if it supplements and supports the story that is being told. Keeping this in mind our experts created BPR To Develop Operational Effectiveness Dashboard To Measure Business Financial Performance Elements PDF to reduce the time that goes into designing the presentation. This way, you can concentrate on the message while our designers take care of providing you with the right template for the situation.

Dashboard To Measure Business Financial Performance Summary PDF
This slide shows the dashboard to measure business financial performance which focuses on revenues, debt to equity, net profit margin, gross profit margin and return on equity. Are you searching for a Dashboard To Measure Business Financial Performance Summary PDF that is uncluttered, straightforward, and original Its easy to edit, and you can change the colors to suit your personal or business branding. For a presentation that expresses how much effort youve put in, this template is ideal With all of its features, including tables, diagrams, statistics, and lists, its perfect for a business plan presentation. Make your ideas more appealing with these professional slides. Download Dashboard To Measure Business Financial Performance Summary PDF from Slidegeeks today.
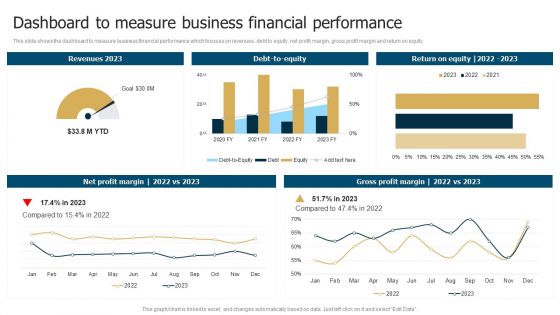
Business Restructuring Process Dashboard To Measure Business Financial Performance Rules PDF
This slide shows the dashboard to measure business financial performance which focuses on revenues, debt to equity, net profit margin, gross profit margin and return on equity. If you are looking for a format to display your unique thoughts, then the professionally designed Business Restructuring Process Dashboard To Measure Business Financial Performance Rules PDF is the one for you. You can use it as a Google Slides template or a PowerPoint template. Incorporate impressive visuals, symbols, images, and other charts. Modify or reorganize the text boxes as you desire. Experiment with shade schemes and font pairings. Alter, share or cooperate with other people on your work. Download Business Restructuring Process Dashboard To Measure Business Financial Performance Rules PDF and find out how to give a successful presentation. Present a perfect display to your team and make your presentation unforgettable.
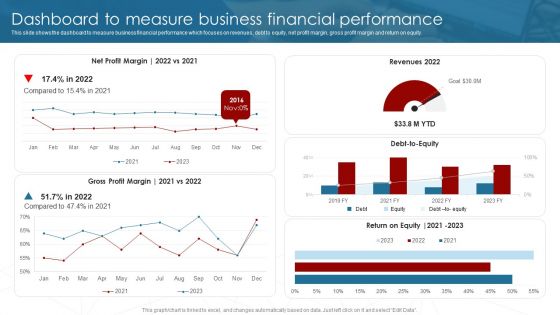
Deployment Of Business Process Dashboard To Measure Business Financial Performance Microsoft PDF
This slide shows the dashboard to measure business financial performance which focuses on revenues, debt to equity, net profit margin, gross profit margin and return on equity. Do you have to make sure that everyone on your team knows about any specific topic I yes, then you should give Deployment Of Business Process Dashboard To Measure Business Financial Performance Microsoft PDF a try. Our experts have put a lot of knowledge and effort into creating this impeccable Deployment Of Business Process Dashboard To Measure Business Financial Performance Microsoft PDF. You can use this template for your upcoming presentations, as the slides are perfect to represent even the tiniest detail. You can download these templates from the Slidegeeks website and these are easy to edit. So grab these today.
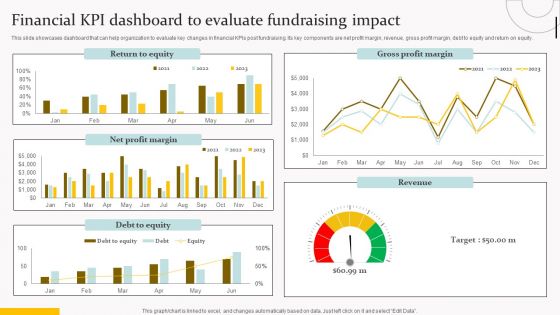
Financial Kpi Dashboard To Evaluate Fundraising Impact Topics PDF
This slide showcases dashboard that can help organization to evaluate key changes in financial KPIs post fundraising. Its key components are net profit margin, revenue, gross profit margin, debt to equity and return on equity. Do you have to make sure that everyone on your team knows about any specific topic I yes, then you should give Financial Kpi Dashboard To Evaluate Fundraising Impact Topics PDF a try. Our experts have put a lot of knowledge and effort into creating this impeccable Financial Kpi Dashboard To Evaluate Fundraising Impact Topics PDF. You can use this template for your upcoming presentations, as the slides are perfect to represent even the tiniest detail. You can download these templates from the Slidegeeks website and these are easy to edit. So grab these today.
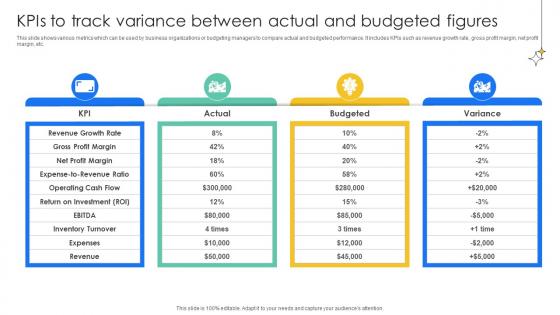
KPIs To Track Variance Between Actual Effective And Efficient Tools To Develop Fin SS V
This slide shows various metrics which can be used by business organizations or budgeting managers to compare actual and budgeted performance. It includes KPIs such as revenue growth rate, gross profit margin, net profit margin, etc. Coming up with a presentation necessitates that the majority of the effort goes into the content and the message you intend to convey. The visuals of a PowerPoint presentation can only be effective if it supplements and supports the story that is being told. Keeping this in mind our experts created KPIs To Track Variance Between Actual Effective And Efficient Tools To Develop Fin SS V to reduce the time that goes into designing the presentation. This way, you can concentrate on the message while our designers take care of providing you with the right template for the situation.

KPIs To Track Variance Between Strategies To Develop Effective Ppt PowerPoint Fin SS V
This slide shows various metrics which can be used by business organizations or budgeting managers to compare actual and budgeted performance. It includes KPIs such as revenue growth rate, gross profit margin, net profit margin, etc. Coming up with a presentation necessitates that the majority of the effort goes into the content and the message you intend to convey. The visuals of a PowerPoint presentation can only be effective if it supplements and supports the story that is being told. Keeping this in mind our experts created KPIs To Track Variance Between Strategies To Develop Effective Ppt PowerPoint Fin SS V to reduce the time that goes into designing the presentation. This way, you can concentrate on the message while our designers take care of providing you with the right template for the situation.
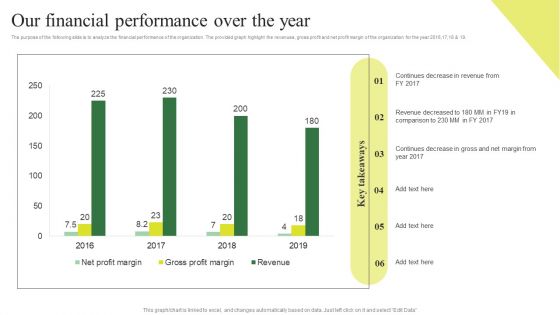
Consumption Based Pricing Model Our Financial Performance Over The Year Elements PDF
The purpose of the following slide is to analyze the financial performance of the organization. The provided graph highlight the revenues, gross profit and net profit margin of the organization for the year 2016,17,18 and 19. This Consumption Based Pricing Model Key Metrices For Forecasting In Recurring Revenue Model Clipart PDF is perfect for any presentation, be it in front of clients or colleagues. It is a versatile and stylish solution for organizing your meetings. The Consumption Based Pricing Model Key Metrices For Forecasting In Recurring Revenue Model Clipart PDF features a modern design for your presentation meetings. The adjustable and customizable slides provide unlimited possibilities for acing up your presentation. Slidegeeks has done all the homework before launching the product for you. So, do not wait, grab the presentation templates today

Deploying And Managing Recurring Our Financial Performance Over The Year Infographics PDF
The purpose of the following slide is to analyze the financial performance of the organization. The provided graph highlight the revenues, Gross profit and net profit margin of the organization for the year 2016,17,18 and 19. If you are looking for a format to display your unique thoughts, then the professionally designed Deploying And Managing Recurring Our Financial Performance Over The Year Infographics PDF is the one for you. You can use it as a Google Slides template or a PowerPoint template. Incorporate impressive visuals, symbols, images, and other charts. Modify or reorganize the text boxes as you desire. Experiment with shade schemes and font pairings. Alter, share or cooperate with other people on your work. Download Deploying And Managing Recurring Our Financial Performance Over The Year Infographics PDF and find out how to give a successful presentation. Present a perfect display to your team and make your presentation unforgettable.

Individualized Pricing Approach For Managed Services Financial Overview FY 18 Structure PDF
The purpose of the following slide is to analyze the financial performance of the organization. The provided graph highlight the revenues, Gross profit and net profit margin of the organization for the year 2016,17,18 and 19. Create an editable Individualized Pricing Approach For Managed Services Financial Overview FY 18 Structure PDF that communicates your idea and engages your audience. Whether you are presenting a business or an educational presentation, pre designed presentation templates help save time. Individualized Pricing Approach For Managed Services Financial Overview FY 18 Structure PDF is highly customizable and very easy to edit, covering many different styles from creative to business presentations. Slidegeeks has creative team members who have crafted amazing templates. So, go and get them without any delay.

A LA Carte Business Strategy Financial Overview FY 18 Topics PDF
The purpose of the following slide is to analyze the financial performance of the organization. The provided graph highlight the revenues, Gross profit and net profit margin of the organization for the year 2016,17,18 and 19. This A LA Carte Business Strategy Financial Overview FY 18 Topics PDF is perfect for any presentation, be it in front of clients or colleagues. It is a versatile and stylish solution for organizing your meetings. The A LA Carte Business Strategy Financial Overview FY 18 Topics PDF features a modern design for your presentation meetings. The adjustable and customizable slides provide unlimited possibilities for acing up your presentation. Slidegeeks has done all the homework before launching the product for you. So, do not wait, grab the presentation templates today

Per Device Pricing Strategy For Managed Solutions Financial Overview FY23 Ideas PDF
The purpose of the following slide is to analyze the financial performance of the organization. The provided graph highlight the revenues, Gross profit and net profit margin of the organization for the year 2020,21,22 and 23. Find highly impressive Per Device Pricing Strategy For Managed Solutions Financial Overview FY23 Ideas PDF on Slidegeeks to deliver a meaningful presentation. You can save an ample amount of time using these presentation templates. No need to worry to prepare everything from scratch because Slidegeeks experts have already done a huge research and work for you. You need to download Per Device Pricing Strategy For Managed Solutions Financial Overview FY23 Ideas PDF for your upcoming presentation. All the presentation templates are 100 percent editable and you can change the color and personalize the content accordingly. Download now.
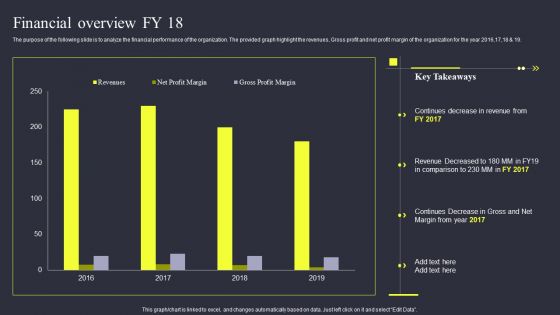
Strategies To Enhance Managed Service Business Financial Overview Fy 18 Information PDF
The purpose of the following slide is to analyze the financial performance of the organization. The provided graph highlight the revenues, Gross profit and net profit margin of the organization for the year 2016,17,18 and 19. Coming up with a presentation necessitates that the majority of the effort goes into the content and the message you intend to convey. The visuals of a PowerPoint presentation can only be effective if it supplements and supports the story that is being told. Keeping this in mind our experts created Strategies To Enhance Managed Service Business Financial Overview Fy 18 Information PDF to reduce the time that goes into designing the presentation. This way, you can concentrate on the message while our designers take care of providing you with the right template for the situation.

Financial Overview FY 18 Layered Pricing Strategy For Managed Services Introduction Pdf
The purpose of the following slide is to analyze the financial performance of the organization. The provided graph highlight the revenues, Gross profit and net profit margin of the organization for the year 2020,21,22 and 23. Are you searching for a Financial Overview FY 18 Layered Pricing Strategy For Managed Services Introduction Pdf that is uncluttered, straightforward, and original Its easy to edit, and you can change the colors to suit your personal or business branding. For a presentation that expresses how much effort you have put in, this template is ideal With all of its features, including tables, diagrams, statistics, and lists, its perfect for a business plan presentation. Make your ideas more appealing with these professional slides. Download Financial Overview FY 18 Layered Pricing Strategy For Managed Services Introduction Pdf from Slidegeeks today.
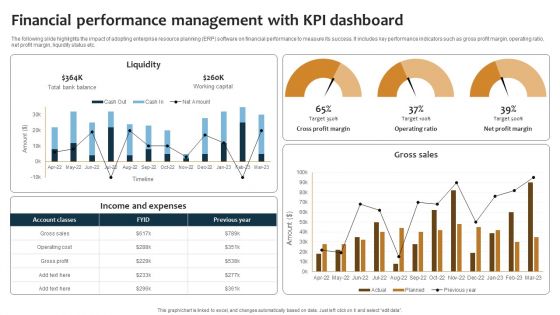
Improving Business Procedures Enterprise Resource Planning System Financial Performance Management Summary PDF
The following slide highlights the impact of adopting enterprise resource planning ERP software on financial performance to measure its success. It includes key performance indicators such as gross profit margin, operating ratio, net profit margin, liquidity status etc. Welcome to our selection of the Improving Business Procedures Enterprise Resource Planning System Financial Performance Management Summary PDF. These are designed to help you showcase your creativity and bring your sphere to life. Planning and Innovation are essential for any business that is just starting out. This collection contains the designs that you need for your everyday presentations. All of our PowerPoints are 100 percent editable, so you can customize them to suit your needs. This multi purpose template can be used in various situations. Grab these presentation templates today.
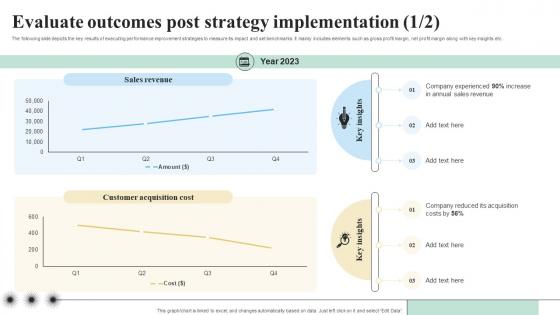
Evaluate Outcomes Post Strategy Objectives And Key Result Methodology For Business
The following slide depicts the key results of executing performance improvement strategies to measure its impact and set benchmarks. It mainly includes elements such as gross profit margin, net profit margin along with key insights etc. Whether you have daily or monthly meetings, a brilliant presentation is necessary. Evaluate Outcomes Post Strategy Objectives And Key Result Methodology For Business can be your best option for delivering a presentation. Represent everything in detail using Evaluate Outcomes Post Strategy Objectives And Key Result Methodology For Business and make yourself stand out in meetings. The template is versatile and follows a structure that will cater to your requirements. All the templates prepared by Slidegeeks are easy to download and edit. Our research experts have taken care of the corporate themes as well. So, give it a try and see the results.

Optimize Business Sales Analyzing Financial Performance Of The Organization Structure PDF
This slides shows the impact of current distribution strategies on the company financials. Companys gross profit and net profit margins are declining, selling cost is high and return on investment is decreasing. Crafting an eye-catching presentation has never been more straightforward. Let your presentation shine with this tasteful yet straightforward Optimize Business Sales Analyzing Financial Performance Of The Organization Structure PDF template. It offers a minimalistic and classy look that is great for making a statement. The colors have been employed intelligently to add a bit of playfulness while still remaining professional. Construct the ideal Optimize Business Sales Analyzing Financial Performance Of The Organization Structure PDF that effortlessly grabs the attention of your audience Begin now and be certain to wow your customers.

Implementing Strategies To Gain Competitive Advantage Income Statement Highlighting Companys Financial Performance Professional PDF
The following slide showcases profit and loss statement financial performance of company. It provides information about sales, sales return, allowance, gross profit, selling expenses, operating expenses, income tax, etc. Formulating a presentation can take up a lot of effort and time, so the content and message should always be the primary focus. The visuals of the PowerPoint can enhance the presenters message, so our Implementing Strategies To Gain Competitive Advantage Income Statement Highlighting Companys Financial Performance Professional PDF was created to help save time. Instead of worrying about the design, the presenter can concentrate on the message while our designers work on creating the ideal templates for whatever situation is needed. Slidegeeks has experts for everything from amazing designs to valuable content, we have put everything into Implementing Strategies To Gain Competitive Advantage Income Statement Highlighting Companys Financial Performance Professional PDF.

Company Income Statement Historic Vs Forecasted Ppt Inspiration Graphics PDF
This slide shows the income statement of the company with forecasted values including revenue, gross profit, operating expenses, operating profit etc. Are you in need of a template that can accommodate all of your creative concepts This one is crafted professionally and can be altered to fit any style. Use it with Google Slides or PowerPoint. Include striking photographs, symbols, depictions, and other visuals. Fill, move around, or remove text boxes as desired. Test out color palettes and font mixtures. Edit and save your work, or work with colleagues. Download Company Income Statement Historic Vs Forecasted Ppt Inspiration Graphics PDF and observe how to make your presentation outstanding. Give an impeccable presentation to your group and make your presentation unforgettable.

Transforming Sustainability Into Competitive Income Statement Highlighting Companys Sample PDF
The following slide showcases profit and loss statement financial performance of company. It provides information about sales, sales return, allowance, gross profit, selling expenses, operating expenses, income tax, etc. This modern and well-arranged Transforming Sustainability Into Competitive Income Statement Highlighting Companys Sample PDF provides lots of creative possibilities. It is very simple to customize and edit with the Powerpoint Software. Just drag and drop your pictures into the shapes. All facets of this template can be edited with Powerpoint, no extra software is necessary. Add your own material, put your images in the places assigned for them, adjust the colors, and then you can show your slides to the world, with an animated slide included.

Income Statement Highlighting Companys Financial Performance Pictures PDF
The following slide showcases profit and loss statement financial performance of company. It provides information about sales, sales return, allowance, gross profit, selling expenses, operating expenses, income tax, etc. Do you know about Slidesgeeks Income Statement Highlighting Companys Financial Performance Pictures PDF These are perfect for delivering any kind od presentation. Using it, create PowerPoint presentations that communicate your ideas and engage audiences. Save time and effort by using our pre designed presentation templates that are perfect for a wide range of topic. Our vast selection of designs covers a range of styles, from creative to business, and are all highly customizable and easy to edit. Download as a PowerPoint template or use them as Google Slides themes.

Insurance Firm Start Up Financial Detailed Analysis Of Insurance Agency Business Income Formats Pdf
This slide represents graphs of gross profit of the business and earnings before interest tax and depreciation. The purpose of this slide is to give a brief about the business profitability and what the business will get before paying of any expenses related to interest, tax and depreciation with key highlights. Want to ace your presentation in front of a live audience Our Insurance Firm Start Up Financial Detailed Analysis Of Insurance Agency Business Income Formats Pdf can help you do that by engaging all the users towards you. Slidegeeks experts have put their efforts and expertise into creating these impeccable powerpoint presentations so that you can communicate your ideas clearly. Moreover, all the templates are customizable, and easy-to-edit and downloadable. Use these for both personal and commercial use.
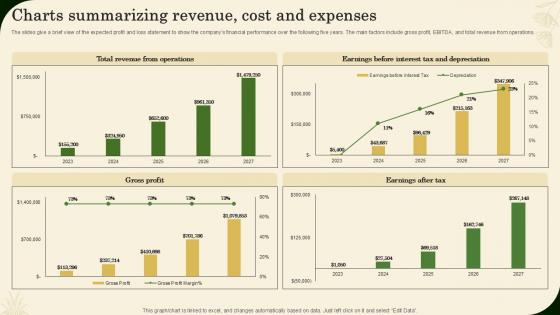
Charts Summarizing Revenue Cost And Expenses Landscaping Business Plan Ppt Template BP SS V
The slides give a brief view of the expected profit and loss statement to show the companys financial performance over the following five years. The main factors include gross profit, EBITDA, and total revenue from operations. Want to ace your presentation in front of a live audience Our Charts Summarizing Revenue Cost And Expenses Landscaping Business Plan Ppt Template BP SS V can help you do that by engaging all the users towards you. Slidegeeks experts have put their efforts and expertise into creating these impeccable powerpoint presentations so that you can communicate your ideas clearly. Moreover, all the templates are customizable, and easy-to-edit and downloadable. Use these for both personal and commercial use.
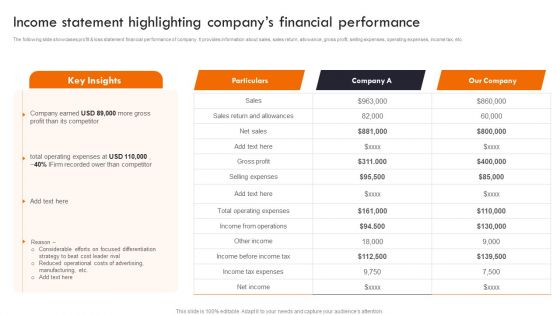
Gaining Competitive Edge Income Statement Highlighting Companys Financial Performance Introduction PDF
The following slide showcases profit and loss statement financial performance of company. It provides information about sales, sales return, allowance, gross profit, selling expenses, operating expenses, income tax, etc. Presenting this PowerPoint presentation, titled Gaining Competitive Edge Income Statement Highlighting Companys Financial Performance Introduction PDF, with topics curated by our researchers after extensive research. This editable presentation is available for immediate download and provides attractive features when used. Download now and captivate your audience. Presenting this Gaining Competitive Edge Income Statement Highlighting Companys Financial Performance Introduction PDF. Our researchers have carefully researched and created these slides with all aspects taken into consideration. This is a completely customizable Gaining Competitive Edge Income Statement Highlighting Companys Financial Performance Introduction PDF that is available for immediate downloading. Download now and make an impact on your audience. Highlight the attractive features available with our PPTs.
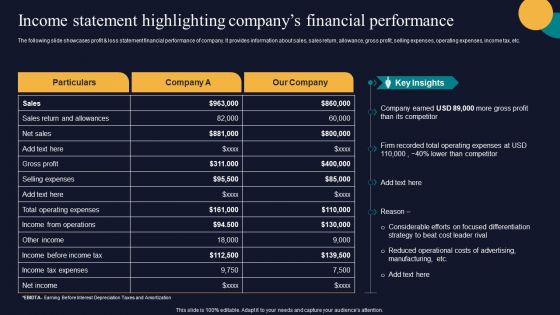
Income Statement Highlighting Companys Financial Performance Tactics To Gain Sustainable Rules PDF
The following slide showcases profit loss statement financial performance of company. It provides information about sales, sales return, allowance, gross profit, selling expenses, operating expenses, income tax, etc. Get a simple yet stunning designed Income Statement Highlighting Companys Financial Performance Tactics To Gain Sustainable Rules PDF. It is the best one to establish the tone in your meetings. It is an excellent way to make your presentations highly effective. So, download this PPT today from Slidegeeks and see the positive impacts. Our easy-to-edit Income Statement Highlighting Companys Financial Performance Tactics To Gain Sustainable Rules PDF can be your go-to option for all upcoming conferences and meetings. So, what are you waiting for Grab this template today.

Income Statement Highlighting Companys Financial Performance Strategic Management For Competitive Portrait PDF
The following slide showcases profit loss statement financial performance of company. It provides information about sales, sales return, allowance, gross profit, selling expenses, operating expenses, income tax, etc.This Income Statement Highlighting Companys Financial Performance Strategic Management For Competitive Portrait PDF is perfect for any presentation, be it in front of clients or colleagues. It is a versatile and stylish solution for organizing your meetings. The Income Statement Highlighting Companys Financial Performance Strategic Management For Competitive Portrait PDF features a modern design for your presentation meetings. The adjustable and customizable slides provide unlimited possibilities for acing up your presentation. Slidegeeks has done all the homework before launching the product for you. So, do not wait, grab the presentation templates today
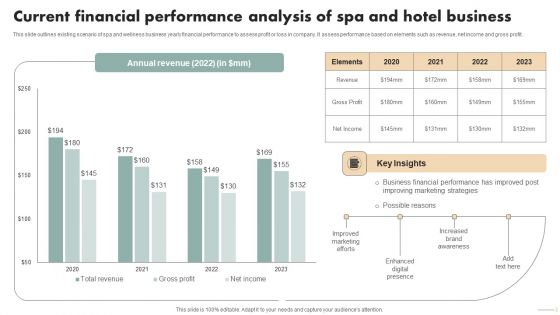
Spa Marketing Strategy Boost Reservations Enhance Revenue Current Financial Performance Analysis Mockup PDF
This slide outlines existing scenario of spa and wellness business yearly financial performance to assess profit or loss in company. It assess performance based on elements such as revenue, net income and gross profit. Do you have to make sure that everyone on your team knows about any specific topic I yes, then you should give Spa Marketing Strategy Boost Reservations Enhance Revenue Current Financial Performance Analysis Mockup PDF a try. Our experts have put a lot of knowledge and effort into creating this impeccable Spa Marketing Strategy Boost Reservations Enhance Revenue Current Financial Performance Analysis Mockup PDF. You can use this template for your upcoming presentations, as the slides are perfect to represent even the tiniest detail. You can download these templates from the Slidegeeks website and these are easy to edit. So grab these today.
Current Financial Performance Building Spa Business Brand Presence Marketeting Icons Pdf
This slide outlines existing scenario of spa and wellness business yearly financial performance to assess profit or loss in company. It assess performance based on elements such as revenue, net income and gross profit. Slidegeeks is here to make your presentations a breeze with Current Financial Performance Building Spa Business Brand Presence Marketeting Icons Pdf With our easy to use and customizable templates, you can focus on delivering your ideas rather than worrying about formatting. With a variety of designs to choose from, you are sure to find one that suits your needs. And with animations and unique photos, illustrations, and fonts, you can make your presentation pop. So whether you are giving a sales pitch or presenting to the board, make sure to check out Slidegeeks first

Financial Comparison Enterprise Software Solution Providing Company Profile CP SS V
Following slide provides information about software solutions offering company financial comparison. It includes financial metrics such as revenue, cost of goods sold, gross profit and net profit.Welcome to our selection of the Financial Comparison Enterprise Software Solution Providing Company Profile CP SS V. These are designed to help you showcase your creativity and bring your sphere to life. Planning and Innovation are essential for any business that is just starting out. This collection contains the designs that you need for your everyday presentations. All of our PowerPoints are 100 percent editable, so you can customize them to suit your needs. This multi-purpose template can be used in various situations. Grab these presentation templates today.
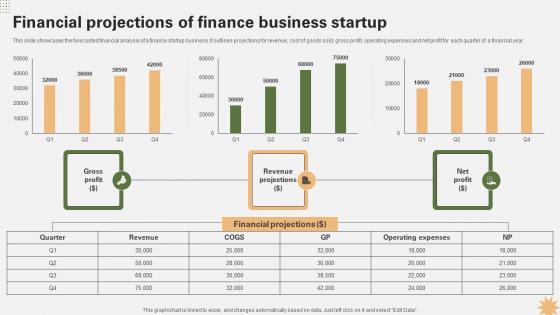
Financial Projections Of Finance Business Strategy For Launching A Financial Strategy SS V
This slide showcases the forecasted financial analysis of a finance startup business. It outlines projections for revenue, cost of goods sold, gross profit, operating expenses and net profit for each quarter of a financial year. Do you have an important presentation coming up Are you looking for something that will make your presentation stand out from the rest Look no further than Financial Projections Of Finance Business Strategy For Launching A Financial Strategy SS V. With our professional designs, you can trust that your presentation will pop and make delivering it a smooth process. And with Slidegeeks, you can trust that your presentation will be unique and memorable. So why wait Grab Financial Projections Of Finance Business Strategy For Launching A Financial Strategy SS V today and make your presentation stand out from the rest

Financial Projections Of Finance Business Startup Penetrating Markets With Financial Strategy SS V
This slide showcases the forecasted financial analysis of a finance startup business. It outlines projections for revenue, cost of goods sold, gross profit, operating expenses and net profit for each quarter of a financial year. Do you have an important presentation coming up Are you looking for something that will make your presentation stand out from the rest Look no further than Financial Projections Of Finance Business Startup Penetrating Markets With Financial Strategy SS V. With our professional designs, you can trust that your presentation will pop and make delivering it a smooth process. And with Slidegeeks, you can trust that your presentation will be unique and memorable. So why wait Grab Financial Projections Of Finance Business Startup Penetrating Markets With Financial Strategy SS V today and make your presentation stand out from the rest
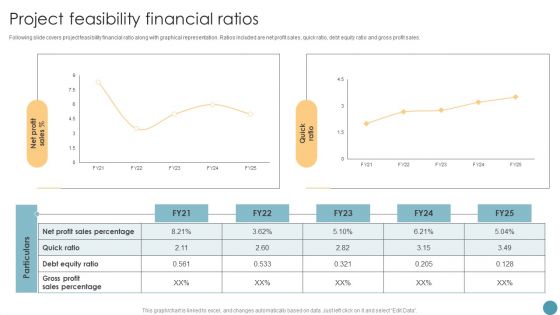
Project Feasibility Financial Ratios Feasibility Analysis Report For Construction Project Structure PDF
Following slide covers project feasibility financial ratio along with graphical representation. Ratios included are net profit sales, quick ratio, debt equity ratio and gross profit sales. Here you can discover an assortment of the finest PowerPoint and Google Slides templates. With these templates, you can create presentations for a variety of purposes while simultaneously providing your audience with an eye catching visual experience. Download Project Feasibility Financial Ratios Feasibility Analysis Report For Construction Project Structure PDF to deliver an impeccable presentation. These templates will make your job of preparing presentations much quicker, yet still, maintain a high level of quality. Slidegeeks has experienced researchers who prepare these templates and write high quality content for you. Later on, you can personalize the content by editing the Project Feasibility Financial Ratios Feasibility Analysis Report For Construction Project Structure PDF.
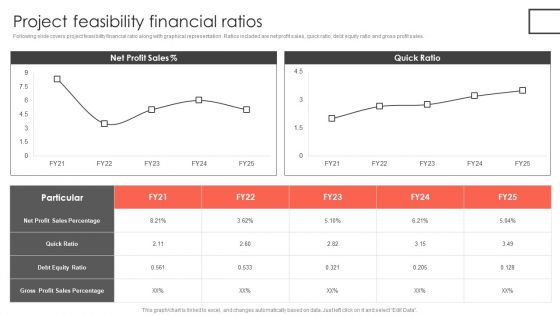
Project Feasibility Financial Ratios Construct Project Feasibility Analysis Report Microsoft PDF
Following slide covers project feasibility financial ratio along with graphical representation. Ratios included are net profit sales, quick ratio, debt equity ratio and gross profit sales. Formulating a presentation can take up a lot of effort and time, so the content and message should always be the primary focus. The visuals of the PowerPoint can enhance the presenters message, so our Project Feasibility Financial Ratios Construct Project Feasibility Analysis Report Microsoft PDF was created to help save time. Instead of worrying about the design, the presenter can concentrate on the message while our designers work on creating the ideal templates for whatever situation is needed. Slidegeeks has experts for everything from amazing designs to valuable content, we have put everything into Project Feasibility Financial Ratios Construct Project Feasibility Analysis Report Microsoft PDF

Project Feasibility Financial Ratios Credibility Assessment Summary For Construction Project Rules PDF
Following slide covers project feasibility financial ratio along with graphical representation. Ratios included are net profit sales, quick ratio, debt equity ratio and gross profit sales. Coming up with a presentation necessitates that the majority of the effort goes into the content and the message you intend to convey. The visuals of a PowerPoint presentation can only be effective if it supplements and supports the story that is being told. Keeping this in mind our experts created Project Feasibility Financial Ratios Credibility Assessment Summary For Construction Project Rules PDF to reduce the time that goes into designing the presentation. This way, you can concentrate on the message while our designers take care of providing you with the right template for the situation.

Financial Evaluation Report Project Feasibility Financial Ratios Mockup PDF
Following slide covers project feasibility financial ratio along with graphical representation. Ratios included are net profit sales, quick ratio, debt equity ratio and gross profit sales. Formulating a presentation can take up a lot of effort and time, so the content and message should always be the primary focus. The visuals of the PowerPoint can enhance the presenters message, so our Financial Evaluation Report Project Feasibility Financial Ratios Mockup PDF was created to help save time. Instead of worrying about the design, the presenter can concentrate on the message while our designers work on creating the ideal templates for whatever situation is needed. Slidegeeks has experts for everything from amazing designs to valuable content, we have put everything into Financial Evaluation Report Project Feasibility Financial Ratios Mockup PDF.
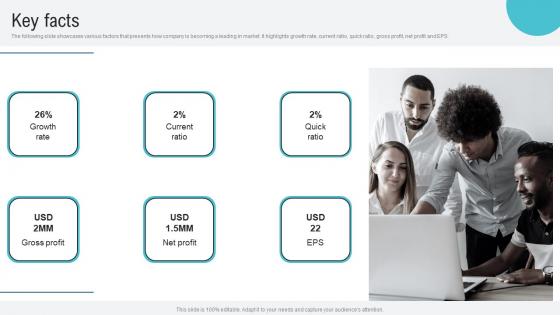
Key Facts Voice Assistance Security Platform Investor Funding Presentation Demonstration Pdf
The following slide showcases various factors that presents how company is becoming a leading in market. It highlights growth rate, current ratio, quick ratio, gross profit, net profit and EPS. Retrieve professionally designed Key Facts Voice Assistance Security Platform Investor Funding Presentation Demonstration Pdf to effectively convey your message and captivate your listeners. Save time by selecting pre made slideshows that are appropriate for various topics, from business to educational purposes. These themes come in many different styles, from creative to corporate, and all of them are easily adjustable and can be edited quickly. Access them as PowerPoint templates or as Google Slides themes. You do not have to go on a hunt for the perfect presentation because Slidegeeks got you covered from everywhere.

Forecasts Beauty Product Company Go To Market Strategy GTM SS V
The slide outlines future projections showing the estimated growth of the B2C cosmetic startup business for three consecutive years after launch. It includes forecast related to sales, gross profit and net profit that helps company in making financial decisions.Slidegeeks is here to make your presentations a breeze with Forecasts Beauty Product Company Go To Market Strategy GTM SS V With our easy-to-use and customizable templates, you can focus on delivering your ideas rather than worrying about formatting. With a variety of designs to choose from, you are sure to find one that suits your needs. And with animations and unique photos, illustrations, and fonts, you can make your presentation pop. So whether you are giving a sales pitch or presenting to the board, make sure to check out Slidegeeks first
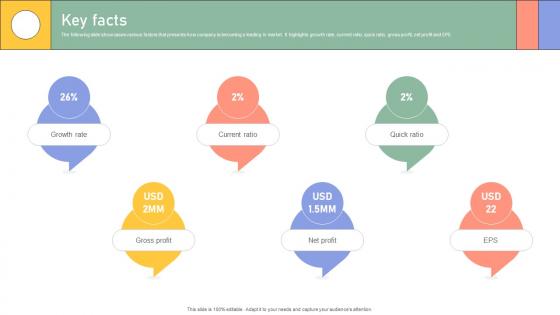
Key Facts Enterprise Software Application Investor Funding Elevator Pitch Deck
The following slide showcases various factors that presents how company is becoming a leading in market. It highlights growth rate, current ratio, quick ratio, gross profit, net profit and EPS. If you are looking for a format to display your unique thoughts, then the professionally designed Key Facts Enterprise Software Application Investor Funding Elevator Pitch Deck is the one for you. You can use it as a Google Slides template or a PowerPoint template. Incorporate impressive visuals, symbols, images, and other charts. Modify or reorganize the text boxes as you desire. Experiment with shade schemes and font pairings. Alter, share or cooperate with other people on your work. Download Key Facts Enterprise Software Application Investor Funding Elevator Pitch Deck and find out how to give a successful presentation. Present a perfect display to your team and make your presentation unforgettable.

Forecasts Information Technology Startup Go To Market Strategy GTM SS V
The slide outlines future projections showing the estimated growth of the IT business for three consecutive years after launch. It includes forecast related to sales, gross profit and net profit that helps company in making financial decisions.Slidegeeks is here to make your presentations a breeze with Forecasts Information Technology Startup Go To Market Strategy GTM SS V With our easy-to-use and customizable templates, you can focus on delivering your ideas rather than worrying about formatting. With a variety of designs to choose from, you are sure to find one that suits your needs. And with animations and unique photos, illustrations, and fonts, you can make your presentation pop. So whether you are giving a sales pitch or presenting to the board, make sure to check out Slidegeeks first
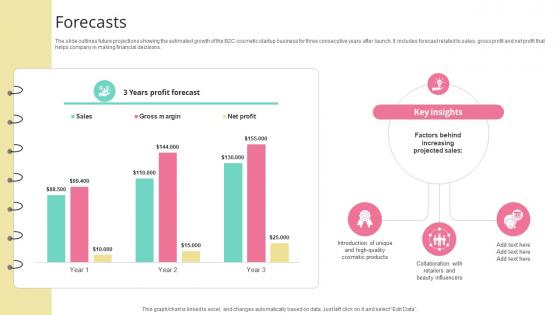
Forecasts Skincare Startup GTM Strategy GTM SS V
The slide outlines future projections showing the estimated growth of the B2C cosmetic startup business for three consecutive years after launch. It includes forecast related to sales, gross profit and net profit that helps company in making financial decisions.Slidegeeks is here to make your presentations a breeze with Forecasts Skincare Startup GTM Strategy GTM SS V With our easy-to-use and customizable templates, you can focus on delivering your ideas rather than worrying about formatting. With a variety of designs to choose from, you are sure to find one that suits your needs. And with animations and unique photos, illustrations, and fonts, you can make your presentation pop. So whether you are giving a sales pitch or presenting to the board, make sure to check out Slidegeeks first
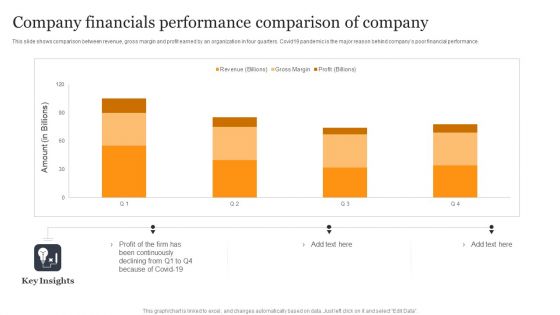
Company Financials Performance Comparison Of Company Microsoft PDF
This slide shows comparison between revenue, gross margin and profit earned by an organization in four quarters. Covid19 pandemic is the major reason behind companys poor financial performance. Showcasing this set of slides titled Company Financials Performance Comparison Of Company Microsoft PDF. The topics addressed in these templates are Been Continuously, Because Covid, Profit Firm. All the content presented in this PPT design is completely editable. Download it and make adjustments in color, background, font etc. as per your unique business setting.

Cost Of Goods And Revenue Comparison With Budget Slides PDF
This slide shows the profit and loss statement of an Organization. It includes marketing, technology, sales and other expenses, gross and net profit etc. Showcasing this set of slides titled Cost Of Goods And Revenue Comparison With Budget Slides PDF. The topics addressed in these templates are Marketing Expenses, Technology Expenses, Operating Expenses. All the content presented in this PPT design is completely editable. Download it and make adjustments in color, background, font etc. as per your unique business setting.
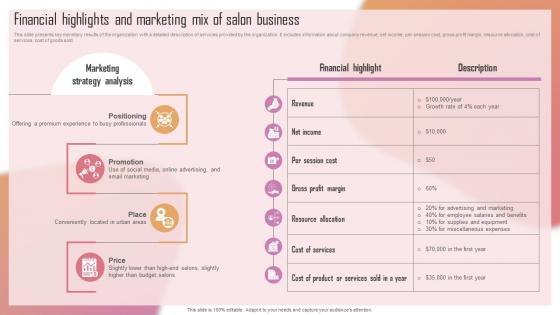
Customizing The Salon Experience Financial Highlights And Marketing Mix Of Salon Business Strategy SS V
This slide presents key monetary results of the organization with a detailed description of services provided by the organization. It includes information about company revenue, net income, per session cost, gross profit margin, resource allocation, cost of services, cost of goods sold. The Customizing The Salon Experience Financial Highlights And Marketing Mix Of Salon Business Strategy SS V is a compilation of the most recent design trends as a series of slides. It is suitable for any subject or industry presentation, containing attractive visuals and photo spots for businesses to clearly express their messages. This template contains a variety of slides for the user to input data, such as structures to contrast two elements, bullet points, and slides for written information. Slidegeeks is prepared to create an impression.

Blueprint To Enhance Organizational Operations Our Financial Details Slides PDF
The following slide displays the key financial details of the organization as the provided graphs displays the Gross profit margin, earning per share and Revenues of the organization for the past 3 years. This modern and well arranged Blueprint To Enhance Organizational Operations Our Financial Details Slides PDF provides lots of creative possibilities. It is very simple to customize and edit with the Powerpoint Software. Just drag and drop your pictures into the shapes. All facets of this template can be edited with Powerpoint no extra software is necessary. Add your own material, put your images in the places assigned for them, adjust the colors, and then you can show your slides to the world, with an animated slide included.
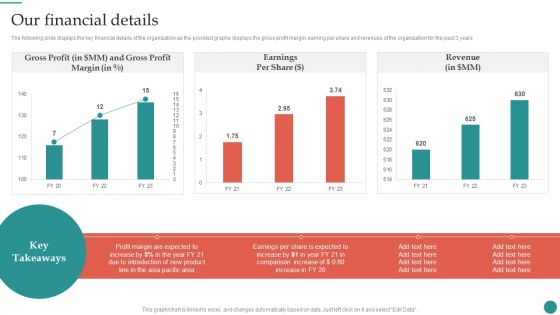
Our Financial Details Company Process Administration And Optimization Playbook Microsoft PDF
The following slide displays the key financial details of the organization as the provided graphs displays the gross profit margin, earning per share and revenues of the organization for the past 3 years.Crafting an eye-catching presentation has never been more straightforward. Let your presentation shine with this tasteful yet straightforward Our Financial Details Company Process Administration And Optimization Playbook Microsoft PDF template. It offers a minimalistic and classy look that is great for making a statement. The colors have been employed intelligently to add a bit of playfulness while still remaining professional. Construct the ideal Our Financial Details Company Process Administration And Optimization Playbook Microsoft PDF that effortlessly grabs the attention of your audience Begin now and be certain to wow your customers.

Metrics To Measure Project Management Performance Strategies To Enhance Project Lifecycle Download PDF
This slide focuses on metrics to measure project management performance such as productivity, gross profit margin, return on investment, client satisfaction, earned value, employee satisfaction score, etc.Do you have to make sure that everyone on your team knows about any specific topic I yes, then you should give Metrics To Measure Project Management Performance Strategies To Enhance Project Lifecycle Download PDF a try. Our experts have put a lot of knowledge and effort into creating this impeccable Metrics To Measure Project Management Performance Strategies To Enhance Project Lifecycle Download PDF. You can use this template for your upcoming presentations, as the slides are perfect to represent even the tiniest detail. You can download these templates from the Slidegeeks website and these are easy to edit. So grab these today.
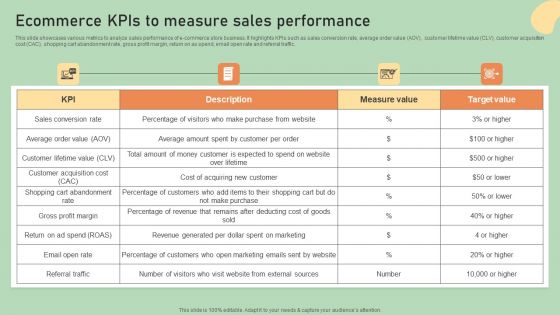
E Commerce Business Development Plan Ecommerce Kpis To Measure Sales Performance Structure PDF
This slide showcases various metrics to analyze sales performance of e-commerce store business. It highlights KPIs such as sales conversion rate, average order value AOV, customer lifetime value CLV, customer acquisition cost CAC, shopping cart abandonment rate, gross profit margin, return on as spend, email open rate and referral traffic. Retrieve professionally designed E Commerce Business Development Plan Ecommerce Kpis To Measure Sales Performance Structure PDF to effectively convey your message and captivate your listeners. Save time by selecting pre-made slideshows that are appropriate for various topics, from business to educational purposes. These themes come in many different styles, from creative to corporate, and all of them are easily adjustable and can be edited quickly. Access them as PowerPoint templates or as Google Slides themes. You do not have to go on a hunt for the perfect presentation because Slidegeeks got you covered from everywhere.
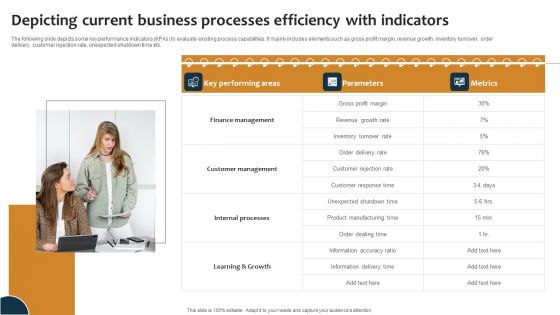
Improving Business Procedures Enterprise Resource Planning System Depicting Current Business Processe Professional PDF
The following slide depicts some key performance indicators KPAs to evaluate existing process capabilities. It mainly includes elements such as gross profit margin, revenue growth, inventory turnover, order delivery, customer rejection rate, unexpected shutdown time etc. Whether you have daily or monthly meetings, a brilliant presentation is necessary. Improving Business Procedures Enterprise Resource Planning System Depicting Current Business Processe Professional PDF can be your best option for delivering a presentation. Represent everything in detail using Improving Business Procedures Enterprise Resource Planning System Depicting Current Business Processe Professional PDF and make yourself stand out in meetings. The template is versatile and follows a structure that will cater to your requirements. All the templates prepared by Slidegeeks are easy to download and edit. Our research experts have taken care of the corporate themes as well. So, give it a try and see the results.
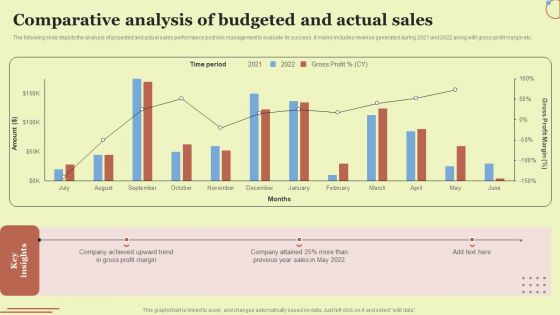
Comparative Analysis Of Budgeted And Actual Sales Rules PDF
The following slide depicts the analysis of projected and actual sales performance post risk management to evaluate its success. It mainly includes revenue generated during 2021 and 2022 along with gross profit margin etc. This Comparative Analysis Of Budgeted And Actual Sales Rules PDF from Slidegeeks makes it easy to present information on your topic with precision. It provides customization options, so you can make changes to the colors, design, graphics, or any other component to create a unique layout. It is also available for immediate download, so you can begin using it right away. Slidegeeks has done good research to ensure that you have everything you need to make your presentation stand out. Make a name out there for a brilliant performance.
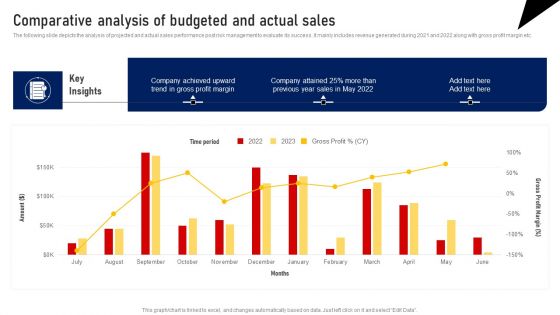
Comparative Analysis Of Budgeted And Actual Sales Template PDF
The following slide depicts the analysis of projected and actual sales performance post risk management to evaluate its success. It mainly includes revenue generated during 2021 and 2022 along with gross profit margin etc. This Comparative Analysis Of Budgeted And Actual Sales Template PDF from Slidegeeks makes it easy to present information on your topic with precision. It provides customization options, so you can make changes to the colors, design, graphics, or any other component to create a unique layout. It is also available for immediate download, so you can begin using it right away. Slidegeeks has done good research to ensure that you have everything you need to make your presentation stand out. Make a name out there for a brilliant performance.

 Home
Home