Graph Trend

Business Hiring Group Diversity Demographics Dashboard Guidelines PDF
This graph or chart is linked to excel, and changes automatically based on data. Just left click on it and select Edit Data. Showcasing this set of slides titled Business Hiring Group Diversity Demographics Dashboard Guidelines PDF. The topics addressed in these templates are Hiring Trends, Current Period, Previous Period. All the content presented in this PPT design is completely editable. Download it and make adjustments in color, background, font etc. as per your unique business setting.
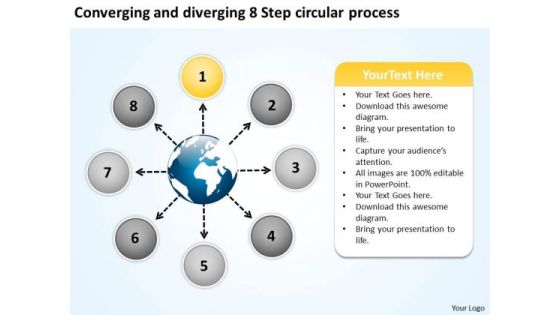
Diverging 8 Step Circular Process Ppt 2 Relative Flow Arrow Chart PowerPoint Templates
We present our diverging 8 step circular process ppt 2 Relative Flow Arrow Chart PowerPoint templates.Use our Ring Charts PowerPoint Templates because you can Unravel the desired and essential elements of your overall strategy. Download and present our Circle Charts PowerPoint Templates because this diagram put it all together to form the complete picture and reach the goal. Use our Process and flows PowerPoint Templates because this template helps you to bring your audiences to the table. Use our Marketing PowerPoint Templates because The marketplace is the merger of your dreams and your ability. Present our Flow charts PowerPoint Templates because they help to lay the base of your trend of thought.Use these PowerPoint slides for presentations relating to Arrows, business, chart, circle, company,concept, continuity, continuous, cycle,dependency, diagram, direction,dynamic,endless, graph,iteration, iterative, method, path, phase,presentation, process, production,progress, progression, report, rotation,sequence. The prominent colors used in the PowerPoint template are Yellow, White, Black. People tell us our diverging 8 step circular process ppt 2 Relative Flow Arrow Chart PowerPoint templates are designed by professionals Professionals tell us our cycle PowerPoint templates and PPT Slides are Adorable. We assure you our diverging 8 step circular process ppt 2 Relative Flow Arrow Chart PowerPoint templates are designed by professionals PowerPoint presentation experts tell us our cycle PowerPoint templates and PPT Slides are Elegant. We assure you our diverging 8 step circular process ppt 2 Relative Flow Arrow Chart PowerPoint templates are designed to make your presentations professional. People tell us our chart PowerPoint templates and PPT Slides are Stylish.

Business Framework Gears Business Timeline Roadmap PowerPoint Presentation PowerPoint Presentation
Display GAP analysis in your business presentation by using this exclusive PPT slide. This slide template has been crafted with graphic of graph for execution plan and strategy plan. Make an innovative presentation for planning related topics by using this PPT slide.

3d Arrow Flow Diagram Diverging 7 Steps Ppt Relative Cycle PowerPoint Slides
We present our 3d arrow flow diagram diverging 7 steps ppt Relative Cycle PowerPoint Slides.Use our Marketing PowerPoint Templates because they help to lay the base of your trend of thought. Use our Circle Charts PowerPoint Templates because they have fired the dreams of many fertile minds. Download our Process and Flows PowerPoint Templates because your business and plans for its growth consist of processes that are highly co-related. Download and present our Success PowerPoint Templates because the choices you make today will determine the future growth of your enterprise. Download and present our Business PowerPoint Templates because this template can project the path to sucess that you have charted.Use these PowerPoint slides for presentations relating to Access, arrow, background,banner, blue, bright, business, chart,circle, color, colorful, concept,conceptual, connection, corporate,creative, cycle, design, different, element,empty, form, frame, graphic, green,group, idea, illustration, match,message, order, part, piece, place,process, red, shape, solution, special,speech, strategy, symbol. The prominent colors used in the PowerPoint template are Purple, White, Gray. The feedback we get is that our 3d arrow flow diagram diverging 7 steps ppt Relative Cycle PowerPoint Slides are visually appealing. The feedback we get is that our background PowerPoint templates and PPT Slides are Lush. Presenters tell us our 3d arrow flow diagram diverging 7 steps ppt Relative Cycle PowerPoint Slides are Magical. The feedback we get is that our business PowerPoint templates and PPT Slides are the best it can get when it comes to presenting. PowerPoint presentation experts tell us our 3d arrow flow diagram diverging 7 steps ppt Relative Cycle PowerPoint Slides are Breathtaking. Customers tell us our banner PowerPoint templates and PPT Slides are Romantic.
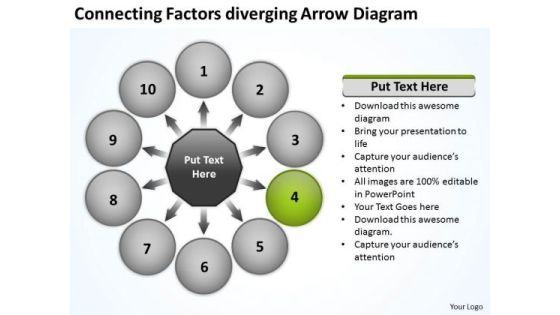
Connecting Factors Diverging Arrow Diagram Ppt Cycle Circular Process Network PowerPoint Templates
We present our connecting factors diverging arrow diagram ppt cycle Circular Process Network PowerPoint templates.Download and present our Circle Charts PowerPoint Templates because they help to lay the base of your trend of thought. Present our Flow Charts PowerPoint Templates because our ready backdrops leave a lasting impression. Use our Business PowerPoint Templates because it will demonstrate the strength of character under severe stress. Shine the torch ahead and bring the light to shine on all. Present our Shapes PowerPoint Templates because this slide Probe the minds of your colleagues, see their faces light up as they assimilate and understand the value of your suggestions. Download our Success PowerPoint Templates because the choices you make today will determine the future growth of your enterprise.Use these PowerPoint slides for presentations relating to Access, Arrow, Business, Concept, Conceptual, Connection, Corporate, Creative, Cycle, Design, Different, Empty, Graphic, Idea, Illustration, Process, Shape, Solution, Strategy, Symbol, Template. The prominent colors used in the PowerPoint template are Green dark , White, Black. People tell us our connecting factors diverging arrow diagram ppt cycle Circular Process Network PowerPoint templates help you meet deadlines which are an element of today's workplace. Just browse and pick the slides that appeal to your intuitive senses. Use our Corporate PowerPoint templates and PPT Slides are Flirty. Professionals tell us our connecting factors diverging arrow diagram ppt cycle Circular Process Network PowerPoint templates are One-of-a-kind. Presenters tell us our Creative PowerPoint templates and PPT Slides are Liberated. Professionals tell us our connecting factors diverging arrow diagram ppt cycle Circular Process Network PowerPoint templates are Gorgeous. PowerPoint presentation experts tell us our Cycle PowerPoint templates and PPT Slides are Whimsical.

10 Stages Converging Business PowerPoint Theme Process Radial Chart Slides
We present our 10 stages converging business powerpoint theme process Radial Chart Slides.Use our Arrows PowerPoint Templates because they help to lay the base of your trend of thought. Use our Flow charts PowerPoint Templates because this template with an image of helps you chart the course of your presentation. Download and present our Business PowerPoint Templates because the majestic tiger lord of all it surveys.It exudes power even when it is in repose. Present our Process and Flows PowerPoint Templates because you can Take your team along by explaining your plans. Present our Circle charts PowerPoint Templates because it is the time to bond with family, friends, colleagues and any other group of your choice.Use these PowerPoint slides for presentations relating to Business, chart, circle, colors, concept, corporate, cycle, data, design, detail, development, diagram, engineering, graphic, ideas, illustration, image, implement, implementation, life, lifecycle, management, model, objects, organization, plan, process, product, professional, project, quality, schema, shape, stack, stage, steps, strategy, structure, success, symbol. The prominent colors used in the PowerPoint template are Yellow, Black, Gray. You can be sure our 10 stages converging business powerpoint theme process Radial Chart Slides are Luxuriant. Presenters tell us our corporate PowerPoint templates and PPT Slides are effectively colour coded to prioritise your plans They automatically highlight the sequence of events you desire. We assure you our 10 stages converging business powerpoint theme process Radial Chart Slides are Efficient. Customers tell us our data PowerPoint templates and PPT Slides are One-of-a-kind. Presenters tell us our 10 stages converging business powerpoint theme process Radial Chart Slides are Stunning. You can be sure our cycle PowerPoint templates and PPT Slides are Lush.

6 Arrows Different Aspects Same Issue Ppt Sample Business Plan PowerPoint Templates
We present our 6 arrows different aspects same issue ppt sample business plan PowerPoint templates.Use our Arrows PowerPoint Templates because they help to lay the base of your trend of thought. Present our Shapes PowerPoint Templates because it Creates a winner with your passion and dream. Download our Circle Charts PowerPoint Templates because the structure of our templates allows you to effectively highlight the key issues concerning the growth of your business. Present our Signs PowerPoint Templates because there are various viable propositions available to further your commercial interests. Use our Business PowerPoint Templates because it illustrates the city with a lasting tryst with resilience. You epitomise the qualities that give your city its fame.Use these PowerPoint slides for presentations relating to 3d, achievement, aim, arrow, business, career, chart, communication, competition, concept, direction, financial, flying, forward, gain, going, gold, golden, graphic, group, grow, grow up, growing, growth, icon, illustration, image, leader, leadership, line, market, motion, one, progress, reflection, sign, silver, success, symbol, team, teamwork, together, turn, two, up, upward, way, white, win, winner. The prominent colors used in the PowerPoint template are Blue navy, Gray, White. People tell us our 6 arrows different aspects same issue ppt sample business plan PowerPoint templates are visually appealing. Use our career PowerPoint templates and PPT Slides are Bold. Use our 6 arrows different aspects same issue ppt sample business plan PowerPoint templates are Gorgeous. PowerPoint presentation experts tell us our competition PowerPoint templates and PPT Slides are One-of-a-kind. People tell us our 6 arrows different aspects same issue ppt sample business plan PowerPoint templates are Nice. Customers tell us our competition PowerPoint templates and PPT Slides are Dazzling.

AI Complexity Benefit Matrix AI For Brand Administration Introduction PDF
The AI Complexity Benefit Matrix AI For Brand Administration Introduction PDF is a compilation of the most recent design trends as a series of slides. It is suitable for any subject or industry presentation, containing attractive visuals and photo spots for businesses to clearly express their messages. This template contains a variety of slides for the user to input data, such as structures to contrast two elements, bullet points, and slides for written information. Slidegeeks is prepared to create an impression.

Diverging 11 Stages Of Single Process Ppt Relative Circular Flow Arrow Diagram PowerPoint Slides
We present our diverging 11 stages of single process ppt Relative Circular Flow Arrow Diagram PowerPoint Slides.Download and present our Circle charts PowerPoint Templates because this layout helps you to impress upon the audience how your strategy will carry all to the top of the corporate heap. Use our Arrows PowerPoint Templates because they help to lay the base of your trend of thought. Use our Flow charts PowerPoint Templates because you can present your opinions in this field using our impressive templates. Use our Business PowerPoint Templates because you can Flutter your wings and enchant the world. Impress them with the innate attractiveness of your thoughts and words. Download our Shapes PowerPoint Templates because this PPt Enlighten others on your team with your views.Use these PowerPoint slides for presentations relating to circle, commute, commuting, converge, diverge, fast, illustration infinity, iron, isolated, journey, locomotive, move, passage, passenger, path, rail railroad, railway, ring, road, route, speed, splint, station, steel, streak, strip, track, traintraintrack, tram, transit, transport, transportation, travel, travelling, turn, vacation vintage, voyage. The prominent colors used in the PowerPoint template are Black, Gray, White. You can be sure our diverging 11 stages of single process ppt Relative Circular Flow Arrow Diagram PowerPoint Slides effectively help you save your valuable time. The feedback we get is that our fast PowerPoint templates and PPT Slides are Handsome. Customers tell us our diverging 11 stages of single process ppt Relative Circular Flow Arrow Diagram PowerPoint Slides are Spiffy. You can be sure our diverge PowerPoint templates and PPT Slides are Chic. The feedback we get is that our diverging 11 stages of single process ppt Relative Circular Flow Arrow Diagram PowerPoint Slides are Detailed. You can be sure our fast PowerPoint templates and PPT Slides are visually appealing.
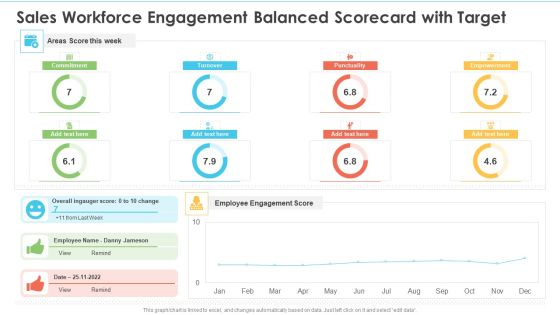
Sales Workforce Engagement Balanced Scorecard With Target Ppt Professional Designs Download PDF
This graph or chart is linked to excel, and changes automatically based on data. Just left click on it and select edit data. Deliver an awe inspiring pitch with this creative Sales Workforce Engagement Balanced Scorecard With Target Ppt Professional Designs Download PDF bundle. Topics like Areas Score Week, Employee Engagement Score, Overall Ingauger Score can be discussed with this completely editable template. It is available for immediate download depending on the needs and requirements of the user.
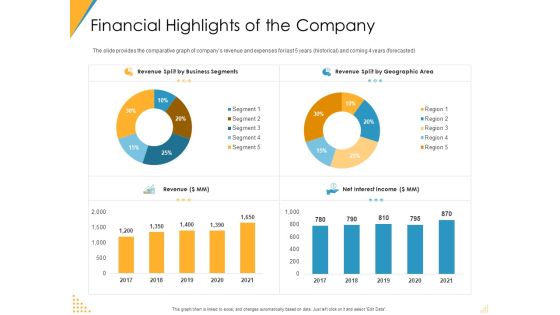
Investor Pitch Deck Post Market Financing Financial Highlights Of The Company Demonstration PDF
The slide provides the comparative graph of companys revenue and expenses for last 5 years historical and coming 4 years forecasted. Deliver an awe-inspiring pitch with this creative investor pitch deck post market financing financial highlights of the company demonstration pdf bundle. Topics like revenue, revenue split by business segments, revenue split by geographic area, net interest income can be discussed with this completely editable template. It is available for immediate download depending on the needs and requirements of the user.

Analysis Of Cleanliness At Retail Store Retail Outlet Operations Performance Evaluation Diagrams PDF
This slide illustrates the graph to showcase visitors responses towards the cleanliness of multiple store areas such as floor, display counters, try rooms etc.Deliver and pitch your topic in the best possible manner with this Analysis Of Cleanliness At Retail Store Retail Outlet Operations Performance Evaluation Diagrams PDF. Use them to share invaluable insights on Retail Store, Visitors Responded, Stores Floors and impress your audience. This template can be altered and modified as per your expectations. So, grab it now.
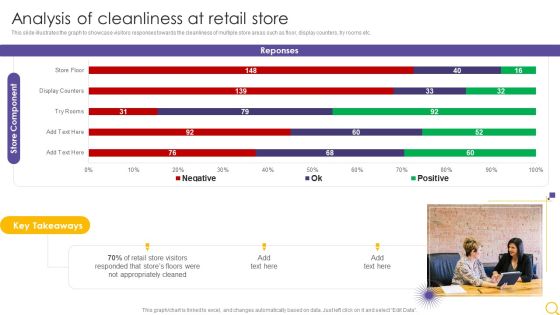
Retail Outlet Operational Efficiency Analytics Analysis Of Cleanliness At Retail Store Background PDF
This slide illustrates the graph to showcase visitors responses towards the cleanliness of multiple store areas such as floor, display counters, try rooms etc. Deliver and pitch your topic in the best possible manner with this Retail Outlet Operational Efficiency Analytics Analysis Of Cleanliness At Retail Store Background PDF. Use them to share invaluable insights on Retail Store, Visitors Responded, Appropriately Cleaned and impress your audience. This template can be altered and modified as per your expectations. So, grab it now.

Brand Awareness Plan Hierarchical Structure Of Product Marketing Team Ideas PDF
This slide shows the organization structure of product marketing team along with total members split by their roles and designation The Brand Awareness Plan Hierarchical Structure Of Product Marketing Team Ideas PDF is a compilation of the most recent design trends as a series of slides. It is suitable for any subject or industry presentation, containing attractive visuals and photo spots for businesses to clearly express their messages. This template contains a variety of slides for the user to input data, such as structures to contrast two elements, bullet points, and slides for written information. Slidegeeks is prepared to create an impression.

Techniques For Enhancing Buyer Acquisition Email Marketing Strategies For Generating More Sample PDF
This slide covers acquisition strategies to achieve targeted sales through email advertising. It includes approaches such as optimizing subject lines, personalized emails, and A or B testing. The Techniques For Enhancing Buyer Acquisition Email Marketing Strategies For Generating More Sample PDF is a compilation of the most recent design trends as a series of slides. It is suitable for any subject or industry presentation, containing attractive visuals and photo spots for businesses to clearly express their messages. This template contains a variety of slides for the user to input data, such as structures to contrast two elements, bullet points, and slides for written information. Slidegeeks is prepared to create an impression.

Corporate Digital Transformation And Innovation Strategy Structural Framework Professional PDF
This slide provides a framework for managers to categorize corporate innovations by focusing on the latest market trends and changing technologies. It includes factors such as optimization, creation, improvement, and reinvent. Persuade your audience using this Corporate Digital Transformation And Innovation Strategy Structural Framework Professional PDF. This PPT design covers four stages, thus making it a great tool to use. It also caters to a variety of topics including Conduct customer interviews, Analyze, qualitative data. Download this PPT design now to present a convincing pitch that not only emphasizes the topic but also showcases your presentation skills.

Win Loss Matrix To Identify Competitors Information PDF
Following slide shows win loss matrix to identify potential competitors in market that helps to formulate competitive strategies. It includes competitors based on type such as rivals, emergent, contenders and ankle biters. The Win Loss Matrix To Identify Competitors Information PDF is a compilation of the most recent design trends as a series of slides. It is suitable for any subject or industry presentation, containing attractive visuals and photo spots for businesses to clearly express their messages. This template contains a variety of slides for the user to input data, such as structures to contrast two elements, bullet points, and slides for written information. Slidegeeks is prepared to create an impression.
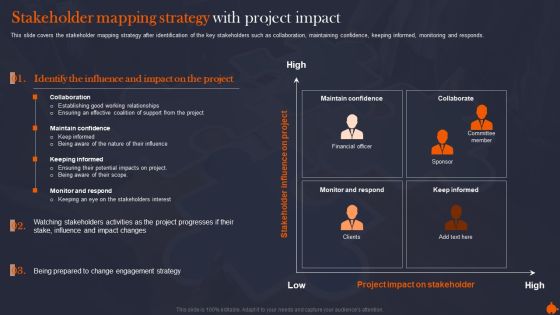
Stakeholder Mapping Strategy With Organize Supervise And Enhance Relationships With Shareholders Introduction PDF
This slide covers the stakeholder mapping strategy after identification of the key stakeholders such as collaboration, maintaining confidence, keeping informed, monitoring and responds. The Stakeholder Mapping Strategy With Organize Supervise And Enhance Relationships With Shareholders Introduction PDF is a compilation of the most recent design trends as a series of slides. It is suitable for any subject or industry presentation, containing attractive visuals and photo spots for businesses to clearly express their messages. This template contains a variety of slides for the user to input data, such as structures to contrast two elements, bullet points, and slides for written information. Slidegeeks is prepared to create an impression.

Perceptual Mapping Assessment Of Amazon Across Consumer Mind Diagrams PDF
This slide provides information regarding visual representation of Amazon positioning across the consumer mind in context to existing competitors. The attributes for consideration include product brand awareness and product varieties. The Perceptual Mapping Assessment Of Amazon Across Consumer Mind Diagrams PDF is a compilation of the most recent design trends as a series of slides. It is suitable for any subject or industry presentation, containing attractive visuals and photo spots for businesses to clearly express their messages. This template contains a variety of slides for the user to input data, such as structures to contrast two elements, bullet points, and slides for written information. Slidegeeks is prepared to create an impression.
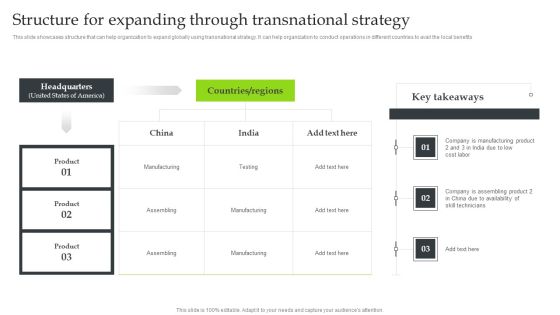
Expansion Strategic Plan Structure For Expanding Through Transnational Strategy Graphics PDF
This slide showcases structure that can help organization to expand globally using transnational strategy. It can help organization to conduct operations in different countries to avail the local benefits. The Expansion Strategic Plan Structure For Expanding Through Transnational Strategy Graphics PDF is a compilation of the most recent design trends as a series of slides. It is suitable for any subject or industry presentation, containing attractive visuals and photo spots for businesses to clearly express their messages. This template contains a variety of slides for the user to input data, such as structures to contrast two elements, bullet points, and slides for written information. Slidegeeks is prepared to create an impression.

Work Streams And Roles Involved In Customer Relationship Summary PDF
This slide provides information regarding the customer relationship transformation program with key management roles and work streams associated to it. The Work Streams And Roles Involved In Customer Relationship Summary PDF is a compilation of the most recent design trends as a series of slides. It is suitable for any subject or industry presentation, containing attractive visuals and photo spots for businesses to clearly express their messages. This template contains a variety of slides for the user to input data, such as structures to contrast two elements, bullet points, and slides for written information. Slidegeeks is prepared to create an impression.

Comprehensive Guide To Strengthen Brand Equity Methodology To Identify The Potential Topics PDF
Purpose of this slide is to provide information about the methodology that will assist organizations in determining the potential of their existing distinctive assets. The Comprehensive Guide To Strengthen Brand Equity Methodology To Identify The Potential Topics PDF is a compilation of the most recent design trends as a series of slides. It is suitable for any subject or industry presentation, containing attractive visuals and photo spots for businesses to clearly express their messages. This template contains a variety of slides for the user to input data, such as structures to contrast two elements, bullet points, and slides for written information. Slidegeeks is prepared to create an impression.
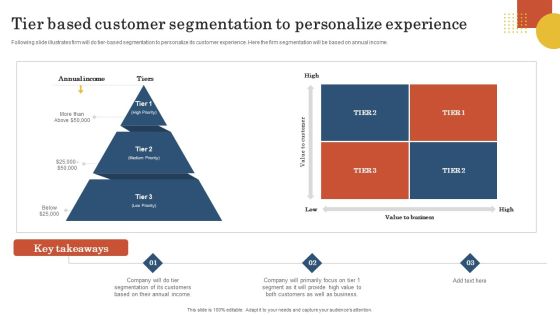
Retail Business Operation Management To Optimize Customer Experience Tier Based Customer Segmentation Designs PDF
Following slide illustrates firm will do tier-based segmentation to personalize its customer experience. Here the firm segmentation will be based on annual income. The Retail Business Operation Management To Optimize Customer Experience Tier Based Customer Segmentation Designs PDF is a compilation of the most recent design trends as a series of slides. It is suitable for any subject or industry presentation, containing attractive visuals and photo spots for businesses to clearly express their messages. This template contains a variety of slides for the user to input data, such as structures to contrast two elements, bullet points, and slides for written information. Slidegeeks is prepared to create an impression.
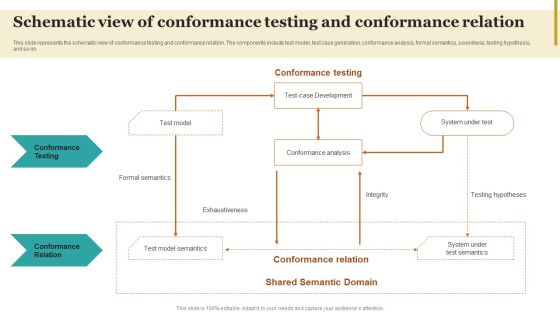
Schematic View Of Conformance Testing And Conformance Relation Themes PDF
This slide represents the schematic view of conformance testing and conformance relation. The components include test model, test case generation, conformance analysis, formal semantics, soundness, testing hypothesis, and so on. The Schematic View Of Conformance Testing And Conformance Relation Themes PDF is a compilation of the most recent design trends as a series of slides. It is suitable for any subject or industry presentation, containing attractive visuals and photo spots for businesses to clearly express their messages. This template contains a variety of slides for the user to input data, such as structures to contrast two elements, bullet points, and slides for written information. Slidegeeks is prepared to create an impression.
IOT Use Cases For Manufacturing Key Challenges Impeding IOT Adoption Icons PDF
This slide highlights the challenges of IoT growth and adoption in manufacturing which includes technology, standards, consumer and business. The IOT Use Cases For Manufacturing Key Challenges Impeding IOT Adoption Icons PDF is a compilation of the most recent design trends as a series of slides. It is suitable for any subject or industry presentation, containing attractive visuals and photo spots for businesses to clearly express their messages. This template contains a variety of slides for the user to input data, such as structures to contrast two elements, bullet points, and slides for written information. Slidegeeks is prepared to create an impression.

Quarterly Business Performance Sales Performance Review Clipart PDF
The following slide highlights the quarter wise sales performance to analyse the trend. It includes elements such as product wise sales revenue graph along with comparison of planned VS actual results etc. Showcasing this set of slides titled Quarterly Business Performance Sales Performance Review Clipart PDF. The topics addressed in these templates are Quarterly Business, Performance Sales Performance. All the content presented in this PPT design is completely editable. Download it and make adjustments in color, background, font etc. as per your unique business setting.
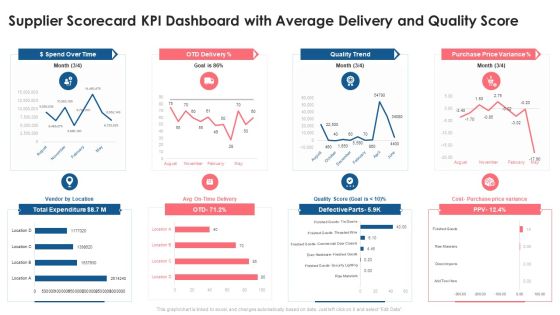
Supplier Scorecard Supplier Scorecard KPI Dashboard With Average Delivery And Quality Score Introduction PDF
This graph or chart is linked to excel, and changes automatically based on data. Just left click on it and select Edit Data. Deliver an awe inspiring pitch with this creative supplier scorecard supplier scorecard kpi dashboard with average delivery and quality score introduction pdf bundle. Topics like dollar spend over time, otd delivery, quality trend, purchase price variance, total expenditure can be discussed with this completely editable template. It is available for immediate download depending on the needs and requirements of the user.
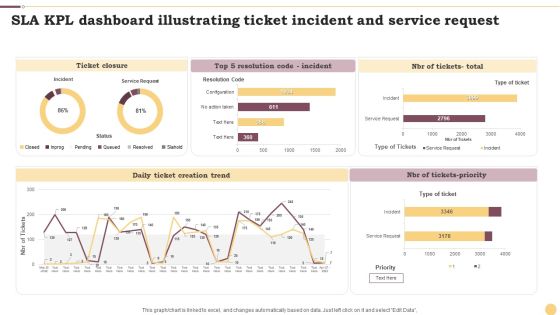
SLA KPL Dashboard Illustrating Ticket Incident And Service Request Ppt File Portrait PDF
This graph or chart is linked to excel, and changes automatically based on data. Just left click on it and select Edit Data. Showcasing this set of slides titled SLA KPL Dashboard Illustrating Ticket Incident And Service Request Ppt File Portrait PDF. The topics addressed in these templates are Ticket Closure, Daily Ticket, Creation Trend, NBR Tickets Priority. All the content presented in this PPT design is completely editable. Download it and make adjustments in color, background, font etc. as per your unique business setting.

Spend Category Analysis And Management Dashboard Ppt PowerPoint Presentation Diagram PDF
The following slide showcases a dashboard to monitor and evaluate spending in procurement process. It includes key elements such as spend, suppliers, transactions, PO count, PR count, invoice count, spend by category, spend trend, 80 or 20 analysis, spend by region, spend by supplier and spend by contract. Do you have to make sure that everyone on your team knows about any specific topic I yes, then you should give Spend Category Analysis And Management Dashboard Ppt PowerPoint Presentation Diagram PDF a try. Our experts have put a lot of knowledge and effort into creating this impeccable Spend Category Analysis And Management Dashboard Ppt PowerPoint Presentation Diagram PDF. You can use this template for your upcoming presentations, as the slides are perfect to represent even the tiniest detail. You can download these templates from the Slidegeeks website and these are easy to edit. So grab these today.

Business Chart Growth Success PowerPoint Templates Ppt Backgrounds For Slides 0113
We present our Business Chart Growth Success PowerPoint Templates PPT Backgrounds For Slides 0113.Download our Finance PowerPoint Templates because you can Break through with our PowerPoint Templates and Slides. Bring down the mental barriers of your audience. Download and present our Marketing PowerPoint Templates because Your audience will believe you are the cats whiskers. Download our Success PowerPoint Templates because It will Give impetus to the hopes of your colleagues. Our PowerPoint Templates and Slides will aid you in winning their trust. Download our Business PowerPoint Templates because Our PowerPoint Templates and Slides help you pinpoint your timelines. Highlight the reasons for your deadlines with their use. Download and present our Teamwork PowerPoint Templates because our PowerPoint Templates and Slides will give your ideas the shape.Use these PowerPoint slides for presentations relating to Multicolored Graph, finance, business, teamwork, marketing, success. The prominent colors used in the PowerPoint template are Green, Red, Blue. People tell us our Multicolored Graph On Business Chart Growth Success PowerPoint Templates PPT Backgrounds For Slides 0113 have awesome images to get your point across. People tell us our teamwork PowerPoint templates and PPT Slides are incredible easy to use. PowerPoint presentation experts tell us our Multicolored Graph On Business Chart Growth Success PowerPoint Templates PPT Backgrounds For Slides 0113 will impress their bosses and teams. PowerPoint presentation experts tell us our finance PowerPoint templates and PPT Slides are readymade to fit into any presentation structure. Presenters tell us our Multicolored Graph On Business Chart Growth Success PowerPoint Templates PPT Backgrounds For Slides 0113 will help them to explain complicated concepts. The feedback we get is that our PowerPoint templates and PPT Slides provide great value for your money. Be assured of finding the best projection to highlight your words.

Business Intelligence Dashboard Showcasing Fleet Management Metrics Elements PDF
This slide showcases BI dashboard to ensure smooth working of shipping and logistics operations. It includes KPIs such as vehicle cost trend, price per unit, fuel consumption, distance, accident, etc. Showcasing this set of slides titled Business Intelligence Dashboard Showcasing Fleet Management Metrics Elements PDF. The topics addressed in these templates are Cost Trend, Price Per Unit Trend, Vehicle Cost Trend. All the content presented in this PPT design is completely editable. Download it and make adjustments in color, background, font etc. as per your unique business setting.
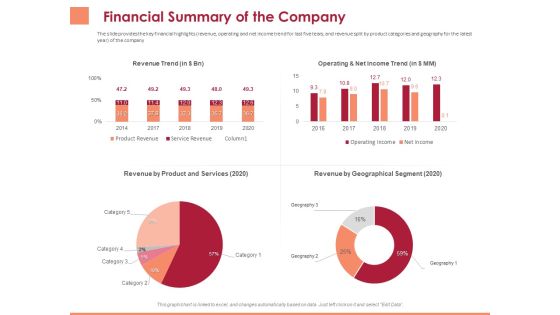
Pitch Deck To Raise Funding From Equity Crowdfunding Financial Summary Of The Company Ppt File Grid PDF
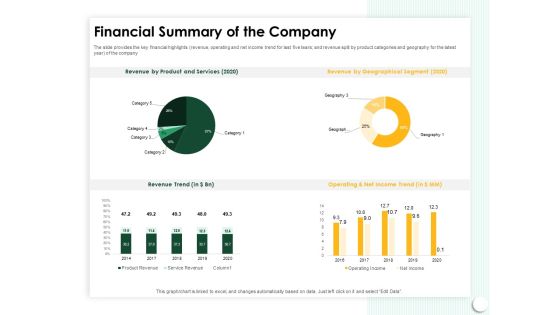
Presenting this set of slides with name pitch deck to raise funding from equity crowdfunding financial summary of the company ppt file grid pdf. The topics discussed in these slides are revenue trend, operating and net income trend, revenue product and services, revenue geographical segment. This is a completely editable PowerPoint presentation and is available for immediate download. Download now and impress your audience.
Startup Presentation For Collaborative Capital Funding Financial Summary Of The Company Diagrams PDF
Presenting this set of slides with name startup presentation for collaborative capital funding financial summary of the company diagrams pdf. The topics discussed in these slides are revenue by product and services 2020, revenue by geographical segment 2020, revenue trend, operating and net income trend. This is a completely editable PowerPoint presentation and is available for immediate download. Download now and impress your audience.

Investor Presentation For Society Funding Financial Summary Of The Company Inspiration PDF
Presenting this set of slides with name investor presentation for society funding financial summary of the company inspiration pdf. The topics discussed in these slides are revenue by product and services 2020, revenue by geographical segment 2020, revenue trend, operating and net income trend. This is a completely editable PowerPoint presentation and is available for immediate download. Download now and impress your audience.
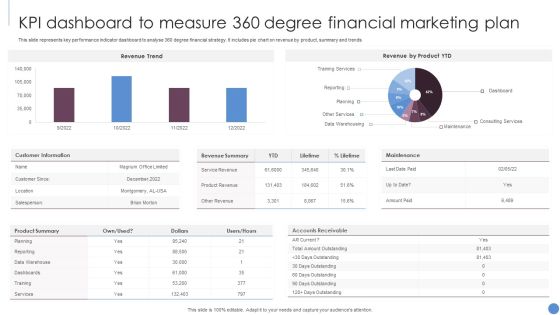
KPI Dashboard To Measure 360 Degree Financial Marketing Plan Slides PDF
This slide represents key performance indicator dashboard to analyse 360 degree financial strategy. It includes pie chart on revenue by product, summary and trends. Showcasing this set of slides titled KPI Dashboard To Measure 360 Degree Financial Marketing Plan Slides PDF. The topics addressed in these templates are Revenue Trend, Revenue Product YTD, Customer Information. All the content presented in this PPT design is completely editable. Download it and make adjustments in color, background, font etc. as per your unique business setting.

Customer Engagement Program Status Report Highlights Introduction PDF
The slide illustrates a highlights report for a customer engagement program to attract current and new target audiences. Various KPIs included are website traffic, website traffic trends, devices traffic. Showcasing this set of slides titled Customer Engagement Program Status Report Highlights Introduction PDF. The topics addressed in these templates are Website Traffic, Website Traffic Trends, BREAKDOWN. All the content presented in this PPT design is completely editable. Download it and make adjustments in color, background, font etc. as per your unique business setting.

Investor Deck For Capital Generation From Substitute Funding Options Financial Summary Of The Company Mockup PDF
Presenting this set of slides with name investor deck for capital generation from substitute funding options financial summary of the company mockup pdf. The topics discussed in these slides are revenue by product and services 2020, revenue by geographical segment 2020, revenue trend, operating and net income trend. This is a completely editable PowerPoint presentation and is available for immediate download. Download now and impress your audience.

Customer Relationship Management In Freehold Property Financial Summary Of The Company Brochure PDF
Presenting this set of slides with name customer relationship management in freehold property financial summary of the company brochure pdf. The topics discussed in these slides are revenue trend, operating and net income trend, revenue geographical segment 2020, operating income, net income, product revenue, service revenue. This is a completely editable PowerPoint presentation and is available for immediate download. Download now and impress your audience.
Pareto Analysis Shipping Tracking Metrics Dashboard Guidelines PDF
This slide showcases dashboard for analyzing on-time delivery trends. It also includes KPIs such as Pareto analysis and on-time deliveries by shipping organizations. Pitch your topic with ease and precision using this Pareto Analysis Shipping Tracking Metrics Dashboard Guidelines PDF. This layout presents information on Pareto Analysis, Deliveries Trends, Shipping Organization. It is also available for immediate download and adjustment. So, changes can be made in the color, design, graphics or any other component to create a unique layout.
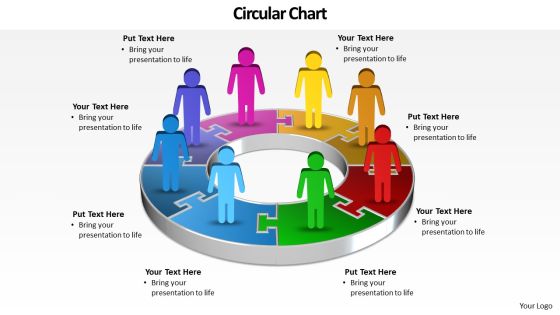
Ppt A Team Of Business People Standing On Pie Org Chart PowerPoint 2007 Pieces Templates
PPT a team of business people standing on pie org chart PowerPoint 2007 pieces Templates-Use this PowerPoint Diagram which shows the group of people on the Circular Puzzle to demonstrate the steps. It elaborates eight concepts. It is a powerful tool conceived to enable you to define your message in your Marketing PPT presentations. An excellent graphic to attract the attention of your audience to improve earnings. You can apply other 3D Styles and shapes to the slide to enhance your presentations.-PPT a team of business people standing on pie org chart PowerPoint 2007 pieces Templates-3d, analysis, brainstorming, business, chart, circle, circular, concept, conference, curving, cycle, design, financial, flow, flowchart, formula, future, goal, graphic, idea, management, market, marketing, movement, organization, presentation, process, product, solve, success, symbol, target, text, training, trends
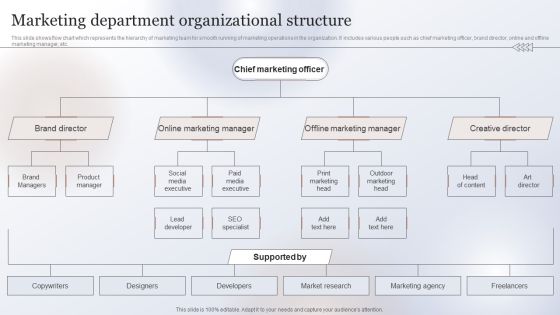
Marketing Strategy To Enhance Marketing Department Organizational Structure Sample PDF
This slide shows flow chart which represents the hierarchy of marketing team for smooth running of marketing operations in the organization. It includes various people such as chief marketing officer, brand director, online and offline marketing manager, etc. The Marketing Strategy To Enhance Marketing Department Organizational Structure Sample PDF is a compilation of the most recent design trends as a series of slides. It is suitable for any subject or industry presentation, containing attractive visuals and photo spots for businesses to clearly express their messages. This template contains a variety of slides for the user to input data, such as structures to contrast two elements, bullet points, and slides for written information. Slidegeeks is prepared to create an impression.

Comprehensive Guide To Build Marketing Organization Structure Of Startup Marketing Topics PDF
The following slide showcases divisional structure of early-stage startup marketing team. The key stakeholders mentioned in slide are marketing president, secretary, product manager, advertising director, public relations PR manager, market research director, promotion director, and creative services. The Comprehensive Guide To Build Marketing Organization Structure Of Startup Marketing Topics PDF is a compilation of the most recent design trends as a series of slides. It is suitable for any subject or industry presentation, containing attractive visuals and photo spots for businesses to clearly express their messages. This template contains a variety of slides for the user to input data, such as structures to contrast two elements, bullet points, and slides for written information. Slidegeeks is prepared to create an impression.

Determine And Analyze Competitors Positioning In Market Demonstration PDF
This slide showcases positioning map that can help organization to evaluate and analyze key competitiors in market before new brand launch. It can help to identify the cost and quality offered by different brand in market. The Determine And Analyze Competitors Positioning In Market Demonstration PDF is a compilation of the most recent design trends as a series of slides. It is suitable for any subject or industry presentation, containing attractive visuals and photo spots for businesses to clearly express their messages. This template contains a variety of slides for the user to input data, such as structures to contrast two elements, bullet points, and slides for written information. Slidegeeks is prepared to create an impression.

Key People Associated With Apple Core Team Ppt Professional Graphics Tutorials PDF
This slide provides information regarding key people associated with Apple core team in terms of CEO, COO. It also includes executives working in different department such as marketing, engineering, finance, operations, etc. The Key People Associated With Apple Core Team Ppt Professional Graphics Tutorials PDF is a compilation of the most recent design trends as a series of slides. It is suitable for any subject or industry presentation, containing attractive visuals and photo spots for businesses to clearly express their messages. This template contains a variety of slides for the user to input data, such as structures to contrast two elements, bullet points, and slides for written information. Slidegeeks is prepared to create an impression.

Augmented Intelligence Tools And Applications IT Working Of Augmented Intelligence LA Infographics PDF
This slide depicts the working of augmented intelligence, which is developed to enhance human intelligence by improving decision-making. It also caters to its phases, such as understanding, interpretation, reasoning, learning, and assurance. The Augmented Intelligence Tools And Applications IT Working Of Augmented Intelligence LA Infographics PDF is a compilation of the most recent design trends as a series of slides. It is suitable for any subject or industry presentation, containing attractive visuals and photo spots for businesses to clearly express their messages. This template contains a variety of slides for the user to input data, such as structures to contrast two elements, bullet points, and slides for written information. Slidegeeks is prepared to create an impression.

Integrating Parallel Processor System Symmetrical Multi Processor Smp Architecture Elements PDF
This slide represents the symmetrical multiprocessing technique of parallel processing, where a single shared main memory is coupled to several identical CPUs. It also covers components such as main memory, bus, cache, input and output, and the number of processors. The Integrating Parallel Processor System Symmetrical Multi Processor Smp Architecture Elements PDF is a compilation of the most recent design trends as a series of slides. It is suitable for any subject or industry presentation, containing attractive visuals and photo spots for businesses to clearly express their messages. This template contains a variety of slides for the user to input data, such as structures to contrast two elements, bullet points, and slides for written information. Slidegeeks is prepared to create an impression.

Omnichannel Distribution System To Satisfy Customer Needs Overview Of Selective Distribution Network Introduction PDF
Following slide gives an overview of selective distribution network which is generally used for selling luxury products. The number of distributors and retailers are limited under this system and are selected based on supplier defined criteria. The Omnichannel Distribution System To Satisfy Customer Needs Overview Of Selective Distribution Network Introduction PDF is a compilation of the most recent design trends as a series of slides. It is suitable for any subject or industry presentation, containing attractive visuals and photo spots for businesses to clearly express their messages. This template contains a variety of slides for the user to input data, such as structures to contrast two elements, bullet points, and slides for written information. Slidegeeks is prepared to create an impression.

Data Lineage Methods Overview Of Pattern Based Data Lineage Technique Pictures PDF
This slide outlines the pattern-based data lineage technique that generates the data lineage using patterns in metadata. It doesnot require knowledge of programming language for data processing, which is added advantage for non-technical stakeholders. The Data Lineage Methods Overview Of Pattern Based Data Lineage Technique Pictures PDF is a compilation of the most recent design trends as a series of slides. It is suitable for any subject or industry presentation, containing attractive visuals and photo spots for businesses to clearly express their messages. This template contains a variety of slides for the user to input data, such as structures to contrast two elements, bullet points, and slides for written information. Slidegeeks is prepared to create an impression.

Project Timeline And Task Progress Scorecard With Budget Allocations Structure PDF
This slide covers project progress summary with task status graph and timeline. It also includes details such project manager, status, budget allocations as per planned spent, count of risks issues, count of pending tasks and key updates. Showcasing this set of slides titled Project Timeline And Task Progress Scorecard With Budget Allocations Structure PDF. The topics addressed in these templates are Project Manager, Project Progress, Project Sponsor. All the content presented in this PPT design is completely editable. Download it and make adjustments in color, background, font etc. as per your unique business setting.

Challenges For Blockchain Technology In Supply Chain Management Demonstration PDF
This slide represents a graph showing the challenges faced by blockchain in areas of supply chain that are visibility, risk allocation, sourcing, fluctuating consumer demand, keeping pace with technology manufacturing, inventory and data management. Showcasing this set of slides titled Challenges For Blockchain Technology In Supply Chain Management Demonstration PDF. The topics addressed in these templates are Inventory Management Challenges, Supply Chain Complexity. All the content presented in this PPT design is completely editable. Download it and make adjustments in color, background, font etc. as per your unique business setting.
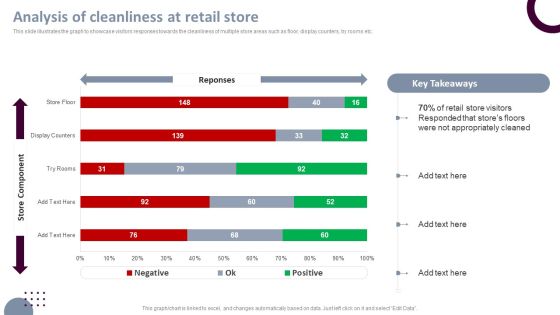
Retail Store Operations Analysis Of Cleanliness At Retail Store Portrait PDF
This slide illustrates the graph to showcase visitors responses towards the cleanliness of multiple store areas such as floor, display counters, try rooms etc. Slidegeeks is one of the best resources for PowerPoint templates. You can download easily and regulate Retail Store Operations Analysis Of Cleanliness At Retail Store Portrait PDF for your personal presentations from our wonderful collection. A few clicks is all it takes to discover and get the most relevant and appropriate templates. Use our Templates to add a unique zing and appeal to your presentation and meetings. All the slides are easy to edit and you can use them even for advertisement purposes.
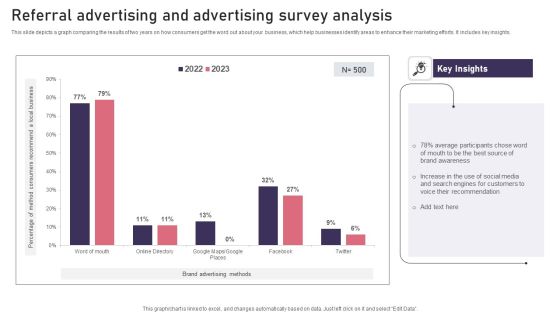
Referral Advertising And Advertising Survey Analysis Background PDF
This slide depicts a graph comparing the results of two years on how consumers get the word out about your business, which help businesses identify areas to enhance their marketing efforts. It includes key insights. Showcasing this set of slides titled Referral Advertising And Advertising Survey Analysis Background PDF. The topics addressed in these templates are Referral Advertising, Advertising Survey Analysis. All the content presented in this PPT design is completely editable. Download it and make adjustments in color, background, font etc. as per your unique business setting.
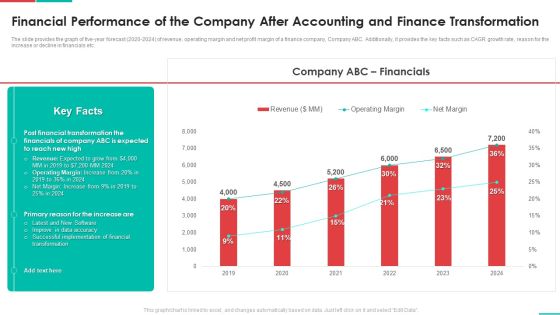
Roadmap For Financial Accounting Transformation Financial Performance Of The Company After Accounting Elements PDF
The slide provides the graph of five-year forecast 2020-2024 of revenue, operating margin and net profit margin of a finance company, Company ABC. Additionally, it provides the key facts such as CAGR growth rate, reason for the increase or decline in financials etc. Deliver and pitch your topic in the best possible manner with this roadmap for financial accounting transformation financial performance of the company after accounting elements pdf. Use them to share invaluable insights on implementation, financial, data accuracy, revenue and impress your audience. This template can be altered and modified as per your expectations. So, grab it now.
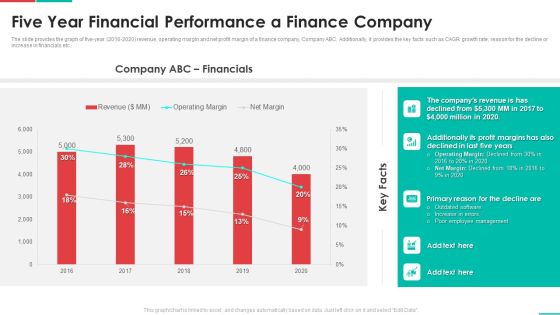
Roadmap For Financial Accounting Transformation Five Year Financial Performance A Finance Company Download PDF
The slide provides the graph of five-year 2016-2020 revenue, operating margin and net profit margin of a finance company, Company ABC. Additionally, it provides the key facts such as CAGR growth rate, reason for the decline or increase in financials etc. Deliver and pitch your topic in the best possible manner with this roadmap for financial accounting transformation five year financial performance a finance company download pdf. Use them to share invaluable insights on revenue, profit margins, management and impress your audience. This template can be altered and modified as per your expectations. So, grab it now.
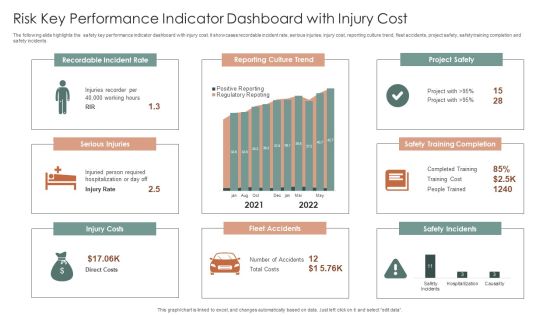
Risk Key Performance Indicator Dashboard With Injury Cost Ppt Summary Brochure PDF
The following slide highlights the safety key performance indicator dashboard with injury cost. It showcases recordable incident rate, serious injuries, injury cost, reporting culture trend, fleet accidents, project safety, safety training completion and safety incidents. Pitch your topic with ease and precision using this Risk Key Performance Indicator Dashboard With Injury Cost Ppt Summary Brochure PDF. This layout presents information on Recordable Incident Rate, Reporting Culture Trend, Project Safety. It is also available for immediate download and adjustment. So, changes can be made in the color, design, graphics or any other component to create a unique layout.
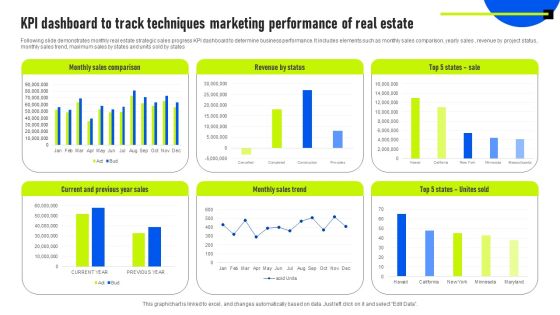
KPI Dashboard To Track Techniques Marketing Performance Of Real Estate Information PDF
Following slide demonstrates monthly real estate strategic sales progress KPI dashboard to determine business performance. It includes elements such as monthly sales comparison, yearly sales , revenue by project status, monthly sales trend, maximum sales by states and units sold by states. Showcasing this set of slides titled KPI Dashboard To Track Techniques Marketing Performance Of Real Estate Information PDF. The topics addressed in these templates are Revenue By Status, Monthly Sales Comparison, Monthly Sales Trend. All the content presented in this PPT design is completely editable. Download it and make adjustments in color, background, font etc. as per your unique business setting.
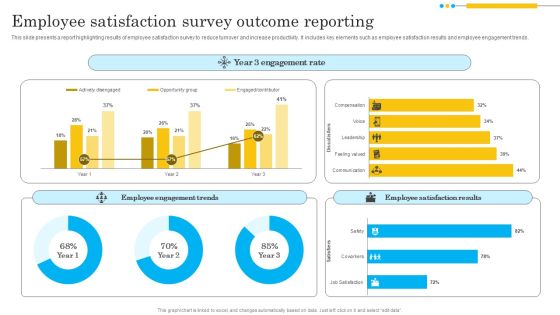
Employee Satisfaction Survey Outcome Reporting Sample PDF
This slide presents a report highlighting results of employee satisfaction survey to reduce turnover and increase productivity. It includes key elements such as employee satisfaction results and employee engagement trends. Showcasing this set of slides titled Employee Satisfaction Survey Outcome Reporting Sample PDF. The topics addressed in these templates are Engagement Rate, Employee Engagement Trends, Employee Satisfaction Results. All the content presented in this PPT design is completely editable. Download it and make adjustments in color, background, font etc. as per your unique business setting.
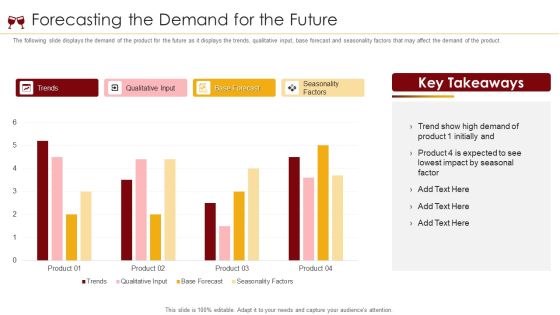
Soft Drinks Capital Raising Forecasting The Demand For The Future Ppt Model Graphics PDF
The following slide displays the demand of the product for the future as it displays the trends, qualitative input, base forecast and seasonality factors that may affect the demand of the product. Deliver and pitch your topic in the best possible manner with this soft drinks capital raising forecasting the demand for the future ppt model graphics pdf. Use them to share invaluable insights on trends, qualitative input, base forecast, seasonality factors and impress your audience. This template can be altered and modified as per your expectations. So, grab it now.

Carbonated Drinks Industry Elevator Pitch Forecasting The Demand For The Future Ideas PDF
The following slide displays the demand of the product for the future as it displays the trends, qualitative input, base forecast and seasonality factors that may affect the demand of the product. Deliver and pitch your topic in the best possible manner with this Carbonated Drinks Industry Elevator Pitch Forecasting The Demand For The Future Ideas PDF. Use them to share invaluable insights on Trends, Qualitative Input, Base Forecast, Seasonality Factors and impress your audience. This template can be altered and modified as per your expectations. So, grab it now.

Corporate Loan Performance Analysis Dashboard Slides PDF
This slide displays the dashboard for corporate loan performance management. It include KPIs such as total loans vs approved, loan default count trend, loan default by branch, loan approval amount by product, etc. Showcasing this set of slides titled Corporate Loan Performance Analysis Dashboard Slides PDF. The topics addressed in these templates are Loan Default Count Trend, Loan Approval Count By Branch, Loan Approval Amount By Product. All the content presented in this PPT design is completely editable. Download it and make adjustments in color, background, font etc. as per your unique business setting.

Health And Risk KPI Dashboard Ppt Pictures Designs Download PDF
The slide highlights the health and safety key performance indicator dashboard illustrating key headings which includes key objectives, inspections, total reports vs over due reports, injuries by body part and accident trends. Pitch your topic with ease and precision using this Health And Risk KPI Dashboard Ppt Pictures Designs Download PDF. This layout presents information on Key Objectives, Inspections, Accidents Trends. It is also available for immediate download and adjustment. So, changes can be made in the color, design, graphics or any other component to create a unique layout.
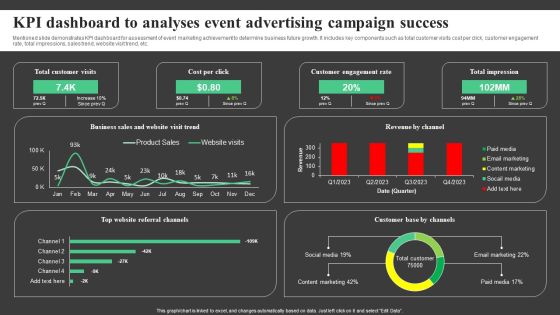
KPI Dashboard To Analyses Event Advertising Campaign Success Topics PDF
Mentioned slide demonstrates KPI dashboard for assessment of event marketing achievement to determine business future growth. It includes key components such as total customer visits cost per click, customer engagement rate, total impressions, sales trend, website visit trend, etc. Showcasing this set of slides titled KPI Dashboard To Analyses Event Advertising Campaign Success Topics PDF. The topics addressed in these templates are Total Customer Visits, Cost Per Click, Customer Engagement Rate . All the content presented in this PPT design is completely editable. Download it and make adjustments in color, background, font etc. as per your unique business setting.
Retail Assortment Dashboard Depicting Store Performance Ppt Icon Structure PDF
This slide shows product assortment dashboard depicting store performance which can benefit managers in reviewing the current situation of outlets and make decisions according to reached benchmarks. It includes details about achieved sales, rate of conversion, weekday vs. Weekend sales, daily trend, etc. Showcasing this set of slides titled Retail Assortment Dashboard Depicting Store Performance Ppt Icon Structure PDF. The topics addressed in these templates are Achieved Sales, Rate Of Conversion, Daily Trend, Outlet Sales. All the content presented in this PPT design is completely editable. Download it and make adjustments in color, background, font etc. as per your unique business setting.

Vendor Performance KPI Dashboard For Distribution Business Formats PDF
This slide exhibits monthly performance dashboard for distribution businesses to track their suppliers and reduce the chance of major disruptions. It includes key elements such as cost per drop, purchase trend, top items, top suppliers, etc. Showcasing this set of slides titled Vendor Performance KPI Dashboard For Distribution Business Formats PDF. The topics addressed in these templates are Purchase Trend, Suppliers, Distribution Business. All the content presented in this PPT design is completely editable. Download it and make adjustments in color, background, font etc. as per your unique business setting.

Organization Accounting And Financial Performance Monitoring Dashboard Pictures PDF
This slide shows the dashboard prepared by accounting department of the organization for monitoring and measuring the financial position of the organization. It shows details regarding gross and net profit, current ratio, profit and loss trend, over due invoices and bills, cash flow and turnover rate of the organization.Showcasing this set of slides titled Organization Accounting And Financial Performance Monitoring Dashboard Pictures PDF. The topics addressed in these templates are Account Overview, Due Invoice, Loss Trend. All the content presented in this PPT design is completely editable. Download it and make adjustments in color, background, font etc. as per your unique business setting.
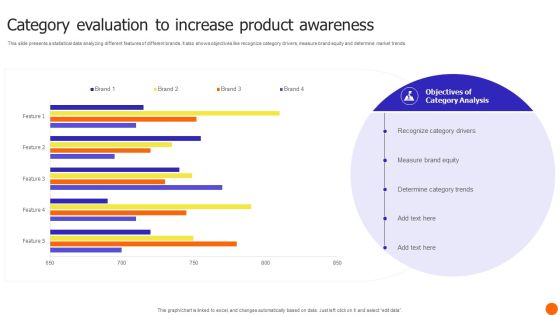
Category Evaluation To Increase Product Awareness Template PDF
This slide presents a statistical data analyzing different features of different brands. It also shows objectives like recognize category drivers, measure brand equity and determine market trends. Showcasing this set of slides titled Category Evaluation To Increase Product Awareness Template PDF. The topics addressed in these templates are Determine Category Trends, Measure Brand Equity, Recognize Category Drivers. All the content presented in this PPT design is completely editable. Download it and make adjustments in color, background, font etc. as per your unique business setting.

Construction Management Dashboard With Project Phases And Performance Inspiration PDF
This graph for chart is linked to excel, and changes automatically based on data. Just left click on it and select Edit Data. Deliver and pitch your topic in the best possible manner with this Construction Management Dashboard With Project Phases And Performance Inspiration PDF. Use them to share invaluable insights on Project Cost Performance, Actual Cost, Project Performance, Timeline VS Resource Capacity, Time vs Project Phase and impress your audience. This template can be altered and modified as per your expectations. So, grab it now.

Finance Metrics Dashboard Indicating Account Receivable And Account Payable Demonstration PDF
This graph or chart is linked to excel, and changes automatically based on data. Just left click on it and select edit data. Showcasing this set of slides titled Finance Metrics Dashboard Indicating Account Receivable And Account Payable Demonstration PDF. The topics addressed in these templates are Total Accounts Receivable, Total Accounts Payable, Recommended Payment Timeline, Monthly Cash Flow. All the content presented in this PPT design is completely editable. Download it and make adjustments in color, background, font etc. as per your unique business setting.

Business Operations Dashboard Ppt PowerPoint Presentation Styles Pictures PDF
This slide shows dashboard for measuring business operations. It includes details of total production, weekly average production, scrap and scrap average in each production line. It also covers daily production statistics, production trend, project summary, events and distribution.Deliver an awe-inspiring pitch with this creative business operations dashboard ppt powerpoint presentation styles pictures pdf. bundle. Topics like production trend, daily production, production summary, distribution can be discussed with this completely editable template. It is available for immediate download depending on the needs and requirements of the user.

Formulating Product Development Action Plan To Enhance Client Experience Dashboard Depicting Product Download PDF
This slide represents the dashboard that depicts product usage metrics that includes usage statistics, users and sessions on the basis of countries, events trends, product loyalty, product usage by city. Deliver an awe inspiring pitch with this creative formulating product development action plan to enhance client experience dashboard depicting product download pdf bundle. Topics like usage statistics, users and sessions on the basis of countries, events trends, product loyalty, product usage by city can be discussed with this completely editable template. It is available for immediate download depending on the needs and requirements of the user.

Restaurant Employees Customer Service Training Template PDF
This slide shows survey of various preferred training topics in restaurant and food industry. It includes training required for seasonal demands, customer service training, new trends, soft skills, technology, promotional training. Showcasing this set of slides titled Restaurant Employees Customer Service Training Template PDF. The topics addressed in these templates are Seasonal Demands, Customer Service Training, New Trends, Soft Skills, Technology, Promotional Training. All the content presented in this PPT design is completely editable. Download it and make adjustments in color, background, font etc. as per your unique business setting.

Inventory Management Dashboard To Forecasting Stock Budget Elements PDF
The following slide depicts the inventory analysis dashboard to determine inventory accuracy. It includes elements such as order cycle time, stock trend, ratio analysis, product wise inventory analysis etc. Pitch your topic with ease and precision using this Inventory Management Dashboard To Forecasting Stock Budget Elements PDF. This layout presents information on Inventory Ratio Analysis, Product Wise Inventory Analysis, Stock Trend. It is also available for immediate download and adjustment. So, changes can be made in the color, design, graphics or any other component to create a unique layout.

Transforming Business With AI Impact Of Artificial Intelligence In Business Rules PDF
This graph focuses on the impact of AI after being implemented in the business such as enhancing companys products and performance, optimize internal business operations, better decision making, etc. From laying roadmaps to briefing everything in detail, our templates are perfect for you. You can set the stage with your presentation slides. All you have to do is download these easy to edit and customizable templates. Transforming Business With AI Impact Of Artificial Intelligence In Business Rules PDF will help you deliver an outstanding performance that everyone would remember and praise you for. Do download this presentation today.

Product Marketing Leadership Ineffective Product Marketing Impact On Sales Volume Topics PDF
This slide shows the impact of ineffective product marketing strategies on number of product sold and overall revenue. Graph shows that, sales volume and value has been declining due to lack of proper marketing approaches. From laying roadmaps to briefing everything in detail, our templates are perfect for you. You can set the stage with your presentation slides. All you have to do is download these easy-to-edit and customizable templates. Product Marketing Leadership Ineffective Product Marketing Impact On Sales Volume Topics PDF will help you deliver an outstanding performance that everyone would remember and praise you for. Do download this presentation today.

Research And Development Investment Global Food Products Company Profile Information PDF
This slide highlights the research and development investment of agricultural company through bar graph format which showcases last five years data. From laying roadmaps to briefing everything in detail, our templates are perfect for you. You can set the stage with your presentation slides. All you have to do is download these easy-to-edit and customizable templates. Research And Development Investment Global Food Products Company Profile Information PDF will help you deliver an outstanding performance that everyone would remember and praise you for. Do download this presentation today.

Product And Services Promotion Major Goals Of Social Media Marketing Slides PDF
This graph or chart is linked to excel, and changes automatically based on data. Just left click on it and select Edit Data. From laying roadmaps to briefing everything in detail, our templates are perfect for you. You can set the stage with your presentation slides. All you have to do is download these easy-to-edit and customizable templates. Product And Services Promotion Major Goals Of Social Media Marketing Slides PDF will help you deliver an outstanding performance that everyone would remember and praise you for. Do download this presentation today.

Decline In Companys Sales Volume And Value Stages To Develop Demand Generation Tactics Information PDF
This slide shows the impact of ineffective product marketing strategies on number of product sold and overall revenue. Graph shows that, sales volume and value has been declining due to ineffective promotional strategies. From laying roadmaps to briefing everything in detail, our templates are perfect for you. You can set the stage with your presentation slides. All you have to do is download these easy-to-edit and customizable templates. Decline In Companys Sales Volume And Value Stages To Develop Demand Generation Tactics Information PDF will help you deliver an outstanding performance that everyone would remember and praise you for. Do download this presentation today.

Implementing Digital Marketing Leading Social Media Platforms Used By Retailers In 2022 Structure PDF
This graph or chart is linked to excel, and changes automatically based on data. Just left click on it and select Edit Data. From laying roadmaps to briefing everything in detail, our templates are perfect for you. You can set the stage with your presentation slides. All you have to do is download these easy-to-edit and customizable templates. Implementing Digital Marketing Leading Social Media Platforms Used By Retailers In 2022 Structure PDF will help you deliver an outstanding performance that everyone would remember and praise you for. Do download this presentation today.
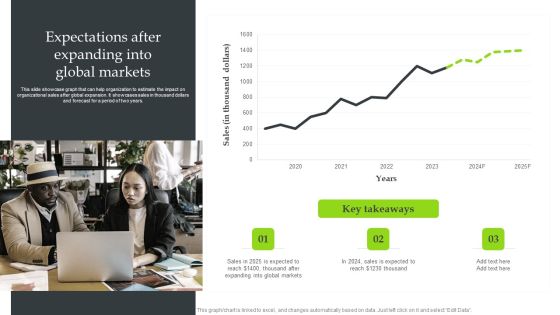
Expansion Strategic Plan Expectations After Expanding Into Global Markets Graphics PDF
This slide showcase graph that can help organization to estimate the impact on organizational sales after global expansion. It showcases sales in thousand dollars and forecast for a period of two years. From laying roadmaps to briefing everything in detail, our templates are perfect for you. You can set the stage with your presentation slides. All you have to do is download these easy-to-edit and customizable templates. Expansion Strategic Plan Expectations After Expanding Into Global Markets Graphics PDF will help you deliver an outstanding performance that everyone would remember and praise you for. Do download this presentation today.

Overview Of Organizational Current Performance Issues Demonstration PDF
The following slide covers graph depicting current employee performance issues in the company to analyze improvement opportunities. It mainly includes elements such as productivity rate, sales revenue growth, work quality, staff morale, hiring cost etc. From laying roadmaps to briefing everything in detail, our templates are perfect for you. You can set the stage with your presentation slides. All you have to do is download these easy to edit and customizable templates. Overview Of Organizational Current Performance Issues Demonstration PDF will help you deliver an outstanding performance that everyone would remember and praise you for. Do download this presentation today.

Service Strategy Guide To Maximize Customer Experience Customer Service Channel Preferences By Generation Guidelines PDF
This slide shows graph which can be used by organizations to get understanding regarding the channels preferred by different generations. These generations are baby boomers, gen x and millennials. From laying roadmaps to briefing everything in detail, our templates are perfect for you. You can set the stage with your presentation slides. All you have to do is download these easy to edit and customizable templates. Service Strategy Guide To Maximize Customer Experience Customer Service Channel Preferences By Generation Guidelines PDF will help you deliver an outstanding performance that everyone would remember and praise you for. Do download this presentation today.
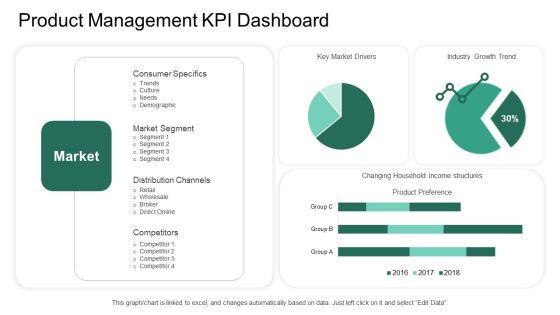
Market Potential Analysis Product Management KPI Dashboard Ppt Professional Inspiration PDF
Deliver an awe inspiring pitch with this creative market potential analysis product management KPI dashboard ppt professional inspiration pdf bundle. Topics like key market drivers, industry growth trend, competitors, market segment, product preference can be discussed with this completely editable template. It is available for immediate download depending on the needs and requirements of the user.

Commodity Category Analysis Product Management KPI Dashboard Inspiration PDF
Deliver an awe inspiring pitch with this creative commodity category analysis product management kpi dashboard inspiration pdf bundle. Topics like key market drivers, industry growth trend, product preference can be discussed with this completely editable template. It is available for immediate download depending on the needs and requirements of the user.

Quarterly Sales Growth Chart For Financial Report Ppt PowerPoint Presentation Ideas Infographics
Presenting this set of slides with name quarterly sales growth chart for financial report ppt powerpoint presentation ideas infographics. The topics discussed in these slides are revenue trend, bar chart, financial. This is a completely editable PowerPoint presentation and is available for immediate download. Download now and impress your audience.

Monthly Website Performance Analysis Chart Ppt PowerPoint Presentation Ideas Master Slide PDF
Pitch your topic with ease and precision using this monthly website performance analysis chart ppt powerpoint presentation ideas master slide pdf. This layout presents information on visitor devices, website traffic trends, the breakdown, average time. It is also available for immediate download and adjustment. So, changes can be made in the color, design, graphics or any other component to create a unique layout.

Classification Of Data For Business Website Ppt PowerPoint Presentation Styles Layout PDF
Presenting this set of slides with name classification of data for business website ppt powerpoint presentation styles layout pdf. The topics discussed in these slides are sales trends, social media analytics, website analytics, email marketing reports. This is a completely editable PowerPoint presentation and is available for immediate download. Download now and impress your audience.

Organization Performance Evaluation Business Operations Dashboard Structure PDF
Deliver an awe inspiring pitch with this creative organization performance evaluation business operations dashboard structure pdf bundle. Topics like production trend, daily production, production summary, distribution, events can be discussed with this completely editable template. It is available for immediate download depending on the needs and requirements of the user.

Revamping Firm Presence Through Relaunching Rebranding Performance Metrics Sales Ppt PowerPoint Presentation Ideas Designs Download PDF
Presenting this set of slides with name revamping firm presence through relaunching rebranding performance metrics sales ppt powerpoint presentation ideas designs download pdf. The topics discussed in these slides are sales revenue, top performing, production, target, trend. This is a completely editable PowerPoint presentation and is available for immediate download. Download now and impress your audience.
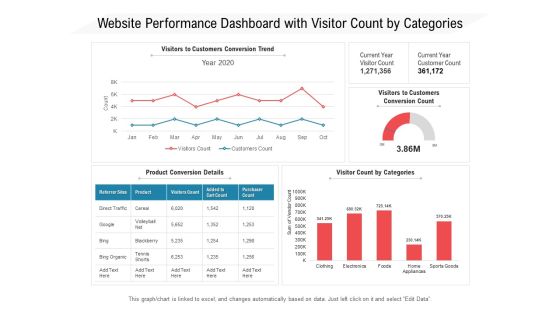
Website Performance Dashboard With Visitor Count By Categories Ppt PowerPoint Presentation Gallery Example File PDF
Presenting this set of slides with name website performance dashboard with visitor count by categories ppt powerpoint presentation gallery example file pdf. The topics discussed in these slides are conversion, trend, customers. This is a completely editable PowerPoint presentation and is available for immediate download. Download now and impress your audience.
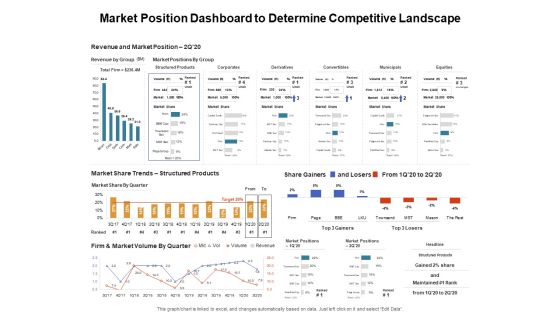
Venture Capitalist Control Board Market Position Dashboard To Determine Competitive Landscape Download PDF
Presenting this set of slides with name venture capitalist control board market position dashboard to determine competitive landscape download pdf. The topics discussed in these slides are revenue and market position, market share trends, firm and market volume by quarter. This is a completely editable PowerPoint presentation and is available for immediate download. Download now and impress your audience.
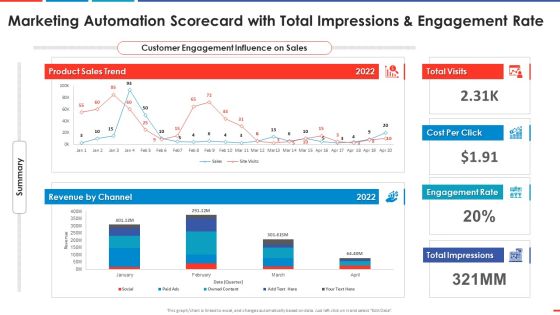
Marketing Automation Scorecard With Total Impression And Automated Business Promotion Scorecard Sample PDF
Deliver and pitch your topic in the best possible manner with this marketing automation scorecard with total impression and automated business promotion scorecard sample pdf. Use them to share invaluable insights on revenue, product sales trend, engagement rate and impress your audience. This template can be altered and modified as per your expectations. So, grab it now.

KPI Dashboards Per Industry FMCG Consumer Goods Dashboard Ppt PowerPoint Presentation Infographics Graphics Tutorials PDF
Deliver and pitch your topic in the best possible manner with this kpi dashboards per industry fmcg consumer goods dashboard ppt powerpoint presentation infographics graphics tutorials pdf. Use them to share invaluable insights on sales and margin trend, on shelf availability, overview, performance product category and impress your audience. This template can be altered and modified as per your expectations. So, grab it now.

Guide For Managers To Effectively Handle Products Product Management KPI Dashboard Diagrams PDF
Presenting this set of slides with name guide for managers to effectively handle products product management kpi dashboard diagrams pdf. The topics discussed in these slides are consumer specifics, market segment, distribution channels, competitors, industry growth trend, product preference, key market drivers. This is a completely editable PowerPoint presentation and is available for immediate download. Download now and impress your audience.

Product Commercialization Action Plan Product Management KPI Dashboard Ppt File Background Image PDF
Deliver and pitch your topic in the best possible manner with this product commercialization action plan product management KPI dashboard ppt file background image pdf. Use them to share invaluable insights on industry growth trend, product preference, market, market segment, competitors and impress your audience. This template can be altered and modified as per your expectations. So, grab it now.

Competitor Assessment In Product Development Product Management KPI Dashboard Background PDF
Deliver an awe-inspiring pitch with this creative competitor assessment in product development product management kpi dashboard background pdf. bundle. Topics like industry growth trend, product preference, market, key market drivers can be discussed with this completely editable template. It is available for immediate download depending on the needs and requirements of the user.

Business Case Studies Stagnant Industries Consumers Preference Premium Specialty And Healthier Products Sample PDF
Deliver and pitch your topic in the best possible manner with this business case studies stagnant industries consumers preference premium specialty and healthier products sample pdf. Use them to share invaluable insights on consumer trends, implications, gaining more market share and impress your audience. This template can be altered and modified as per your expectations. So, grab it now.

Chart Showing Communication Monitoring Ppt PowerPoint Presentation Model Slideshow
Presenting this set of slides with name chart showing communication monitoring ppt powerpoint presentation model slideshow. The topics discussed in these slides are revenue trend, bar chart, financial. This is a completely editable PowerPoint presentation and is available for immediate download. Download now and impress your audience.

Variance Analysis Line Chart Ppt PowerPoint Presentation Styles Graphics Example
Presenting this set of slides with name variance analysis line chart ppt powerpoint presentation styles graphics example. The topics discussed in these slides are revenue trend, bar chart, financial. This is a completely editable PowerPoint presentation and is available for immediate download. Download now and impress your audience.

Bar Chart Showing Quarterly Business Sales Ppt PowerPoint Presentation Model Icon
Presenting this set of slides with name bar chart showing quarterly business sales ppt powerpoint presentation model icon. The topics discussed in these slides are revenue trend, bar chart, financial. This is a completely editable PowerPoint presentation and is available for immediate download. Download now and impress your audience.

Bar Chart Showing Quarterly Economic Growth Ppt PowerPoint Presentation Infographic Template Slideshow
Presenting this set of slides with name bar chart showing quarterly economic growth ppt powerpoint presentation infographic template slideshow. The topics discussed in these slides are revenue trend, bar chart, financial. This is a completely editable PowerPoint presentation and is available for immediate download. Download now and impress your audience.

Monthly Average Fill Rate Analysis Chart Ppt PowerPoint Presentation Gallery Styles PDF
Presenting this set of slides with name monthly average fill rate analysis chart ppt powerpoint presentation gallery styles pdf. The topics discussed in these slides are actual, goal, team, customer order trend, plan, analysis team. This is a completely editable PowerPoint presentation and is available for immediate download. Download now and impress your audience.
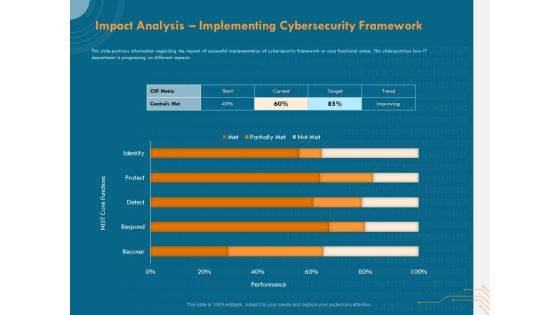
Cyber Security Implementation Framework Impact Analysis Implementing Cybersecurity Framework Ppt Show Graphics PDF
Presenting this set of slides with name cyber security implementation framework impact analysis implementing cybersecurity framework ppt show graphics pdf. The topics discussed in these slides are csf metric, controls met, nist core functions, target, trend. This is a completely editable PowerPoint presentation and is available for immediate download. Download now and impress your audience.

Consumer Complaint Dashboard With NPS Category Ppt PowerPoint Presentation Pictures Grid PDF
Presenting this set of slides with name consumer complaint dashboard with nps category ppt powerpoint presentation pictures grid pdf. The topics discussed in these slides are net promoter score, nps trend, nps by account tier, nps categories by account tier. This is a completely editable PowerPoint presentation and is available for immediate download. Download now and impress your audience.

Customer Support Dashboard With Satisfaction And Response Rate Ppt PowerPoint Presentation Summary Format PDF
Presenting this set of slides with name customer support dashboard with satisfaction and response rate ppt powerpoint presentation summary format pdf. The topics discussed in these slides are resolved tickets, good responses, compliance, satisfaction rate, response rate, support satisfaction, deadline compliance vs satisfaction rate trend. This is a completely editable PowerPoint presentation and is available for immediate download. Download now and impress your audience.

Balance Sheet Metrics With Average Profit Distribution Ppt PowerPoint Presentation Model Backgrounds PDF
Presenting this set of slides with name balance sheet metrics with average profit distribution ppt powerpoint presentation model backgrounds pdf. The topics discussed in these slides are sales by region, avg profit distribution by region, sales trend, maximum sales by category. This is a completely editable PowerPoint presentation and is available for immediate download. Download now and impress your audience.

User Assessment Kpis And Metrics Dashboard Ppt PowerPoint Presentation File Infographics PDF
Presenting this set of slides with name user assessment kpis and metrics dashboard ppt powerpoint presentation file infographics pdf. The topics discussed in these slides are online visitors, todays overview, today vs trend, new vs returning. This is a completely editable PowerPoint presentation and is available for immediate download. Download now and impress your audience.
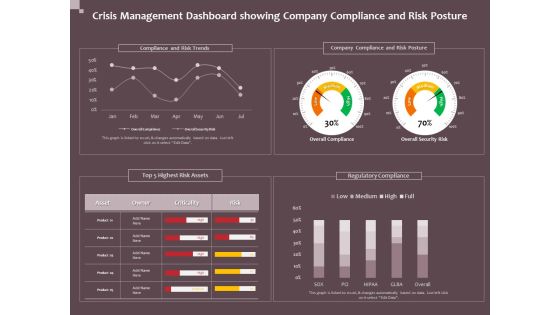
Hazard Administration Crisis Management Dashboard Showing Company Compliance And Risk Posture Clipart PDF
Presenting this set of slides with name hazard administration crisis management dashboard showing company compliance and risk posture clipart pdf. The topics discussed in these slides are compliance and risk trends, company compliance and risk posture, top 5 highest risk assets, regulatory compliance. This is a completely editable PowerPoint presentation and is available for immediate download. Download now and impress your audience.
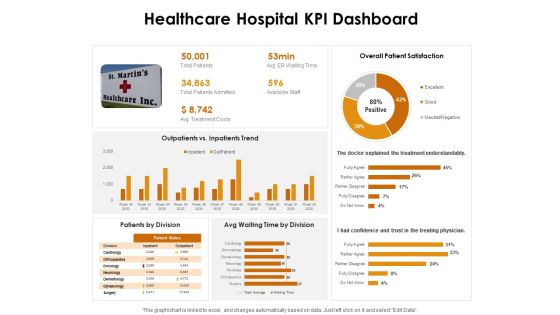
KPI Dashboards Per Industry Healthcare Hospital KPI Dashboard Ppt PowerPoint Presentation Show Infographics PDF
Deliver an awe-inspiring pitch with this creative kpi dashboards per industry healthcare hospital kpi dashboard ppt powerpoint presentation show infographics pdf bundle. Topics like overall patient satisfaction, outpatients vs. inpatients trend, doctor explained the treatment understandably can be discussed with this completely editable template. It is available for immediate download depending on the needs and requirements of the user.
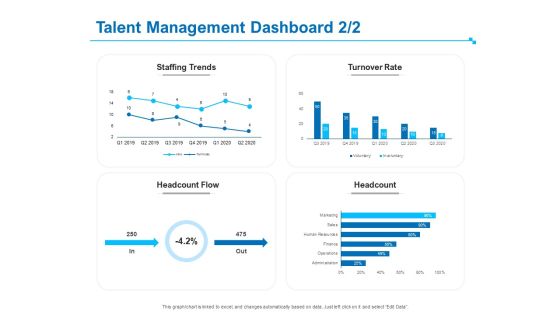
Strategic Talent Management Talent Management Dashboard Rate Ppt PowerPoint Presentation Infographic Template Graphics Download PDF
Deliver an awe-inspiring pitch with this creative strategic talent management talent management dashboard rate ppt powerpoint presentation infographic template graphics download pdf bundle. Topics like staffing trends, turnover rate, headcount flow, headcount can be discussed with this completely editable template. It is available for immediate download depending on the needs and requirements of the user.
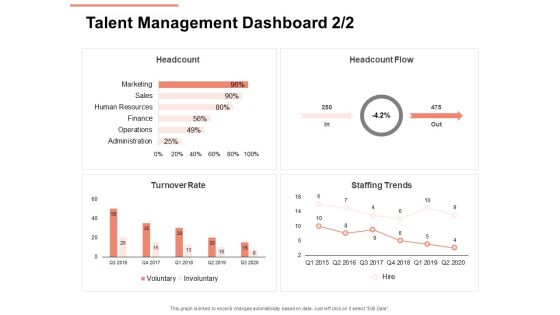
Workforce Planning System Talent Management Dashboard Ppt PowerPoint Presentation Layouts Example File PDF
Deliver an awe-inspiring pitch with this creative workforce planning system talent management dashboard ppt powerpoint presentation layouts example file pdf bundle. Topics like staffing trends, turnover rate, headcount flow, headcount can be discussed with this completely editable template. It is available for immediate download depending on the needs and requirements of the user.
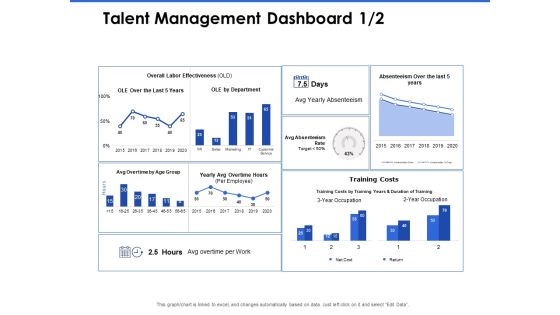
Talent Management Systems Talent Management Dashboard Brochure PDF
Deliver and pitch your topic in the best possible manner with this talent management systems talent management dashboard brochure pdf. Use them to share invaluable insights on staffing trends, turnover rate, headcount, headcount flow and impress your audience. This template can be altered and modified as per your expectations. So, grab it now.

Approaches Talent Management Workplace Talent Dashboard Ideas PDF
Deliver an awe-inspiring pitch with this creative approaches talent management workplace talent dashboard ideas pdf bundle. Topics like turnover rate, headcount, staffing trends, headcount flow can be discussed with this completely editable template. It is available for immediate download depending on the needs and requirements of the user.
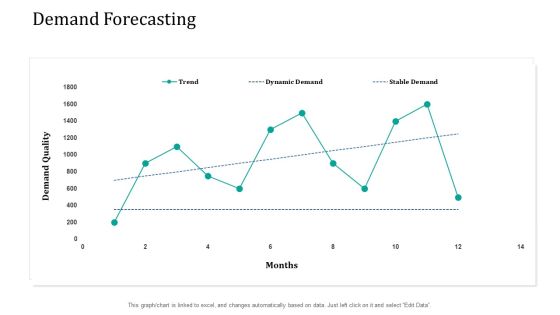
Supply Network Management Growth Demand Forecasting Ppt File Graphics Design PDF
Deliver an awe inspiring pitch with this creative supply network management growth demand forecasting ppt file graphics design pdf bundle. Topics like trend, dynamic demand, stable demand can be discussed with this completely editable template. It is available for immediate download depending on the needs and requirements of the user.

Logistic Network Administration Solutions Demand Forecasting Ppt Professional Topics PDF
Deliver an awe inspiring pitch with this creative logistic network administration solutions demand forecasting ppt professional topics pdf bundle. Topics like trend, dynamic demand, stable demand can be discussed with this completely editable template. It is available for immediate download depending on the needs and requirements of the user.

SCM Growth Demand Forecasting Ppt Infographic Template Deck PDF
Deliver an awe inspiring pitch with this creative scm growth demand forecasting ppt infographic template deck pdf bundle. Topics like trend, dynamic demand, stable demand can be discussed with this completely editable template. It is available for immediate download depending on the needs and requirements of the user.

Cloud Security KPI Dashboard With Key Statistics Ppt Icon Examples PDF
Pitch your topic with ease and precision using this Cloud Security KPI Dashboard With Key Statistics Ppt Icon Examples PDF. This layout presents information on Compliance Trend, Risk Status, Risk Severity. It is also available for immediate download and adjustment. So, changes can be made in the color, design, graphics or any other component to create a unique layout.

Marketing PowerPoint Template Linear Flow 4 Stages Project Management Graphic
We present our marketing PowerPoint template linear flow 4 stages project management Graphic. Use our Arrows PowerPoint Templates because, they help to lay the base of your trend of thought. Use our Layers PowerPoint Templates because, are the symbols of human growth. Use our Shapes PowerPoint Templates because, At times, however, there is a crucial aspect that requires extra attention. Use our Business PowerPoint Templates because; demonstrate how you think out of the box. Use our Process and Flows PowerPoint Templates because, are the stepping stones of our journey till date. Use these PowerPoint slides for presentations relating to abstract, algorithm, arrow, block diagram, business, chart, color, connection, design, development, diagram, direction, element, flow, graph, linear, linear diagram, management, organization, plan, process, section, segment, set, sign, solution, strategy, symbol, technology, vector. The prominent colors used in the PowerPoint template are Purple, Gray, and Black

3d Uniform Flow Arrows 8 Steps Ppt Business Production Plan PowerPoint Slides
We present our 3d uniform flow arrows 8 steps ppt business production plan PowerPoint Slides. Use our Business PowerPoint Templates because, Marketing Strategy Business Template: - Maximizing sales of your product is the intended destination. Use our Arrows PowerPoint Templates because, Probe the minds of your colleagues, see their faces light up as they assimilate and understand the value of your suggestions. Use our Success PowerPoint Templates because, At times, however, there is a crucial aspect that requires extra attention. Use our Signs PowerPoint Templates because, they help to lay the base of your trend of thought. Use our Process and Flows PowerPoint Templates because; Watch their mental juices begin to flow. Use these PowerPoint slides for presentations relating to abstract, arrow, arrows, business, chart, design, development, diagram, direction, element, flow, flowchart, graph, linear, management, model, motion, organization, plan, process, program, section, segment, set, sign, solution, strategy, symbol, technology. The prominent colors used in the PowerPoint template are Green, Gray, and Black

Success Ppt Linear Flow 5 Phase Diagram Style1 Business Communication PowerPoint 6 Image
We present our success PPT linear Flow 5 phase diagram style1 business communication Powerpoint 6 Image. Use our Puzzles or Jigsaws PowerPoint Templates because; Blaze a brilliant trail from point to point. Use our Game Pieces PowerPoint Templates because, they help to lay the base of your trend of thought. Use our Finance PowerPoint Templates because; Take it up to a higher level with your thoughts. Use our Shapes PowerPoint Templates because; Watch their mental juices begin to flow. Use our Business PowerPoint Templates because, It is in your DNA to analyses possible causes to the minutest detail. Use these PowerPoint slides for presentations relating to abstract, algorithm, arrow, block diagram, business, chart, color, connection, design, development, diagram, direction, element, flow, graph, linear, linear diagram, management, organization, plan, process, section, segment, set, sign, solution, strategy, symbol, technology, vector. The prominent colors used in the PowerPoint template are Blue, Gray, and Black
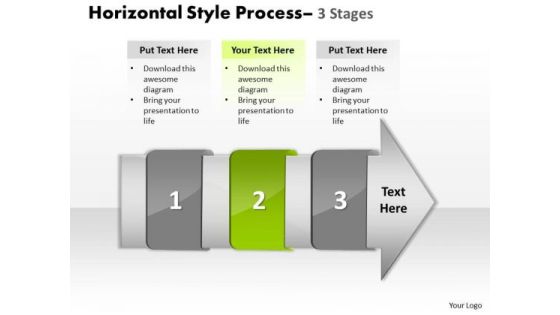
Ppt Theme Horizontal To Vertical Text Steps Working With Slide Numbers Demonstration 3 Graphic
We present our PPT Theme horizontal to vertical text steps working with slide numbers demonstration 3 Graphic. Use our Arrows PowerPoint Templates because, they help to lay the base of your trend of thought. Use our Shapes PowerPoint Templates because, Core Diagram: - Explore the various hues and layers existing in you are in your plans and processes. Use our Finance PowerPoint Templates because, Many a core idea has various enveloping layers. Use our Business PowerPoint Templates because, Marketing Strategy Business Template: - Maximizing sales of your product is the intended destination. Use our Process and Flows PowerPoint Templates because, are the stepping stones of our journey till date. Use these PowerPoint slides for presentations relating to accent, advertisement, arrow, badge, banner, business, button, collection, color, decoration, design, direction, element, financial, flow, graph, horizontal, instruction, isolated, label, manual, message, process, sale, set, shape, steps, symbol, template. The prominent colors used in the PowerPoint template are Green, Gray, and Black

 Home
Home