Governance Dashboard
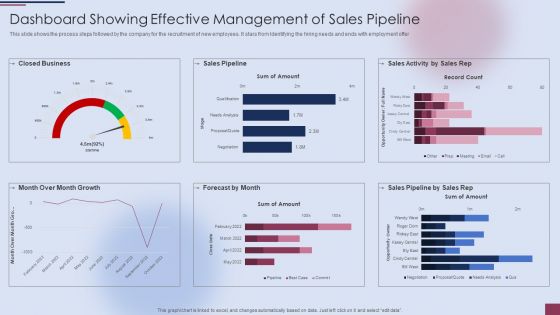
Dashboard Showing Effective Management Of Sales Pipeline Template PDF
This slide shows the process steps followed by the company for the recruitment of new employees. It stars from Identifying the hiring needs and ends with employment offer.Deliver and pitch your topic in the best possible manner with this Dashboard Showing Effective Management Of Sales Pipeline Template PDF. Use them to share invaluable insights on Closed Business, Sales Pipeline, Sales Activity and impress your audience. This template can be altered and modified as per your expectations. So, grab it now.

Sales Pipeline Management Dashboard With Top Ten Customers Formats PDF
This slide shows the process steps followed by the company for the recruitment of new employees. It stars from Identifying the hiring needs and ends with employment offer. Deliver an awe inspiring pitch with this creative Sales Pipeline Management Dashboard With Top Ten Customers Formats PDF bundle. Topics like Opportunities, Value, Customers can be discussed with this completely editable template. It is available for immediate download depending on the needs and requirements of the user.

Sales Pipeline Management Dashboard With Top Ten Customers Graphics PDF
This slide shows the process steps followed by the company for the recruitment of new employees. It stars from Identifying the hiring needs and ends with employment offer. Deliver and pitch your topic in the best possible manner with this Sales Pipeline Management Dashboard With Top Ten Customers Graphics PDF. Use them to share invaluable insights on Open Opportunities, Pipeline Value, Customers Revenue and impress your audience. This template can be altered and modified as per your expectations. So, grab it now.
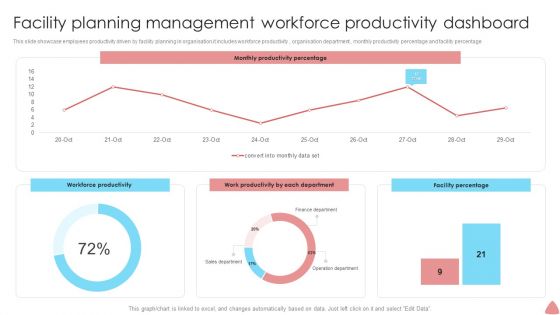
Facility Planning Management Workforce Productivity Dashboard Formats PDF
This slide showcase employees productivity driven by facility planning in organisation.it includes workforce productivity , organisation department , monthly productivity percentage and facility percentage. Showcasing this set of slides titled Facility Planning Management Workforce Productivity Dashboard Formats PDF. The topics addressed in these templates are Workforce Productivity, Work Productivity, Facility Percentage. All the content presented in this PPT design is completely editable. Download it and make adjustments in color, background, font etc. as per your unique business setting.
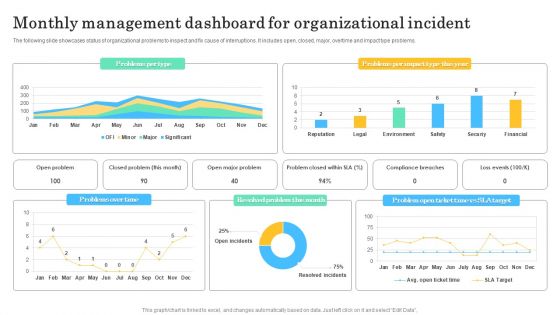
Monthly Management Dashboard For Organizational Incident Professional PDF
The following slide showcases status of organizational problems to inspect and fix cause of interruptions. It includes open, closed, major, overtime and impact type problems. Showcasing this set of slides titled Monthly Management Dashboard For Organizational Incident Professional PDF. The topics addressed in these templates are Problems Over Time, Resolved Problem Month. All the content presented in this PPT design is completely editable. Download it and make adjustments in color, background, font etc. as per your unique business setting.
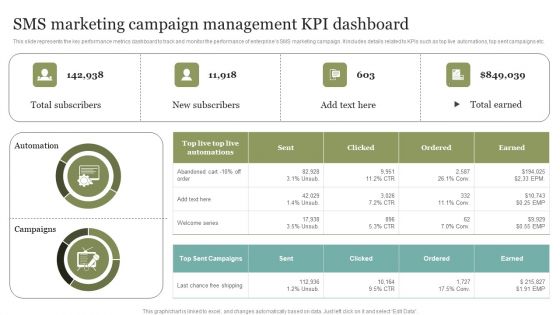
SMS Marketing Campaign Management KPI Dashboard Introduction PDF
Slidegeeks has constructed SMS Marketing Campaign Management KPI Dashboard Introduction PDF after conducting extensive research and examination. These presentation templates are constantly being generated and modified based on user preferences and critiques from editors. Here, you will find the most attractive templates for a range of purposes while taking into account ratings and remarks from users regarding the content. This is an excellent jumping-off point to explore our content and will give new users an insight into our top-notch PowerPoint Templates.
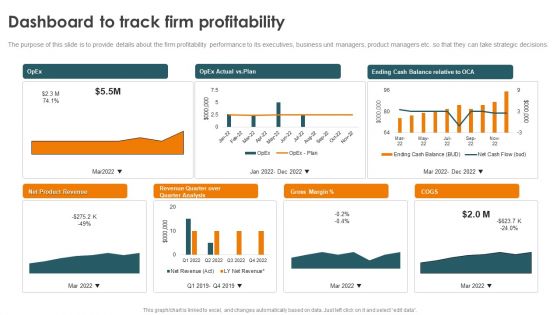
Profitability Modelling Framework Dashboard To Track Firm Profitability Topics PDF
The purpose of this slide is to provide details about the firm profitability performance to its executives, business unit managers, product managers etc. so that they can take strategic decisions. Find highly impressive Profitability Modelling Framework Dashboard To Track Firm Profitability Topics PDF on Slidegeeks to deliver a meaningful presentation. You can save an ample amount of time using these presentation templates. No need to worry to prepare everything from scratch because Slidegeeks experts have already done a huge research and work for you. You need to download Profitability Modelling Framework Dashboard To Track Firm Profitability Topics PDF for your upcoming presentation. All the presentation templates are 100 percent editable and you can change the color and personalize the content accordingly. Download now.

Dashboard For Software Defined Networking SDN Ppt Slides Images PDF
This slide depicts the dashboard for the software-defined network by covering details of bandwidth administrator, traffic quality, active flows, development tools, completed tasks, wide-area network bandwidth, and G drive. Coming up with a presentation necessitates that the majority of the effort goes into the content and the message you intend to convey. The visuals of a PowerPoint presentation can only be effective if it supplements and supports the story that is being told. Keeping this in mind our experts created Dashboard For Software Defined Networking SDN Ppt Slides Images PDF to reduce the time that goes into designing the presentation. This way, you can concentrate on the message while our designers take care of providing you with the right template for the situation.
Dashboard For Software Defined Networking SDN Ppt Icon Samples PDF
This slide depicts the dashboard for the software-defined network by covering details of bandwidth administrator, traffic quality, active flows, development tools, completed tasks, wide-area network bandwidth, and G drive. Coming up with a presentation necessitates that the majority of the effort goes into the content and the message you intend to convey. The visuals of a PowerPoint presentation can only be effective if it supplements and supports the story that is being told. Keeping this in mind our experts created Dashboard For Software Defined Networking SDN Ppt Icon Samples PDF to reduce the time that goes into designing the presentation. This way, you can concentrate on the message while our designers take care of providing you with the right template for the situation.
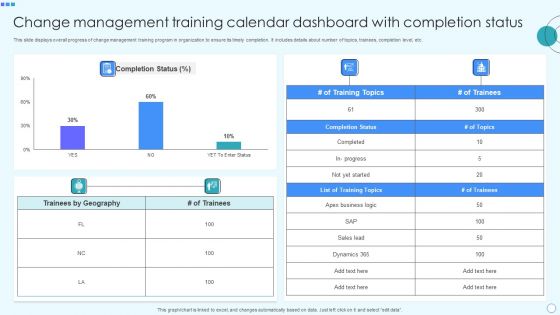
Change Management Training Calendar Dashboard With Completion Status Portrait PDF
This slide displays overall progress of change management training program in organization to ensure its timely completion. It includes details about number of topics, trainees, completion level, etc. Pitch your topic with ease and precision using this Change Management Training Calendar Dashboard With Completion Status Portrait PDF. This layout presents information on Business Logic, Geography, Completion Status, Sales Lead, Dynamics. It is also available for immediate download and adjustment. So, changes can be made in the color, design, graphics or any other component to create a unique layout.

Development And Operations KPI Dashboard With Total Builds Ideas PDF
This slide covers about devops project details with build summary, static analysis , test execution results and quality check on daily basis.Showcasing this set of slides titled Development And Operations KPI Dashboard With Total Builds Ideas PDF The topics addressed in these templates are Member Assignments, Code Repository, Quality Health All the content presented in this PPT design is completely editable. Download it and make adjustments in color, background, font etc. as per your unique business setting.

Finance Metrics Dashboard Indicating Portfolio Performance Microsoft PDF
This graph or chart is linked to excel, and changes automatically based on data. Just left click on it and select edit data. Pitch your topic with ease and precision using this Finance Metrics Dashboard Indicating Portfolio Performance Microsoft PDF. This layout presents information on Portfolio Performance Portfolio, Asset Management Manager, Top 10 Assets. It is also available for immediate download and adjustment. So, changes can be made in the color, design, graphics or any other component to create a unique layout.
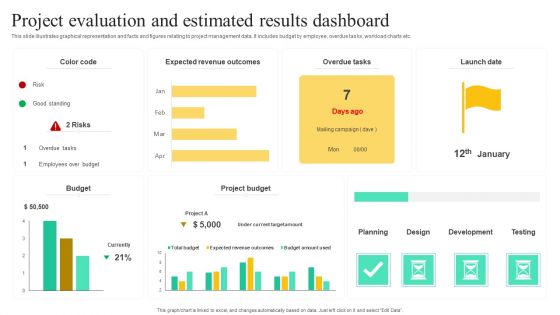
Project Evaluation And Estimated Results Dashboard Ideas PDF
This slide illustrates graphical representation and facts and figures relating to project management data. It includes budget by employee, overdue tasks, workload charts etc. Showcasing this set of slides titled Project Evaluation And Estimated Results Dashboard Ideas PDF. The topics addressed in these templates are Overdue Tasks, Project Budget, Project Evaluation. All the content presented in this PPT design is completely editable. Download it and make adjustments in color, background, font etc. as per your unique business setting.

Optimizing Online Stores Customer Checkout Behavior KPI Dashboard Brochure PDF
This slide represents the dashboard to help management in analyzing the point at which customers leave the checkout process. It includes details related to KPIs such as shipping drop-off, payment drop-off etc. Slidegeeks is here to make your presentations a breeze with Optimizing Online Stores Customer Checkout Behavior KPI Dashboard Brochure PDF With our easy-to-use and customizable templates, you can focus on delivering your ideas rather than worrying about formatting. With a variety of designs to choose from, youre sure to find one that suits your needs. And with animations and unique photos, illustrations, and fonts, you can make your presentation pop. So whether youre giving a sales pitch or presenting to the board, make sure to check out Slidegeeks first.

Multi Channel Online Commerce App Metrics Dashboard Sample PDF
This is a multi channel online commerce app metrics dashboard sample pdf template with various stages. Focus and dispense information on six stages using this creative set, that comes with editable features. It contains large content boxes to add your information on topics like lifetime value, active users, retention rate, increased usage. You can also showcase facts, figures, and other relevant content using this PPT layout. Grab it now.
KPI Metrics Dashboard Icon For Freelance Content Marketing Ideas PDF
Persuade your audience using this KPI Metrics Dashboard Icon For Freelance Content Marketing Ideas PDF. This PPT design covers four stages, thus making it a great tool to use. It also caters to a variety of topics including Kpi Metrics, Freelance Content Marketing. Download this PPT design now to present a convincing pitch that not only emphasizes the topic but also showcases your presentation skills.

KPI Dashboard To Evaluate Energy Consumption Designs PDF
The following slide depicts dashboard to measure energy utilization during the year at workplace to gain operational efficiency and develop smart ways to save for future. It includes elements such as progress by segment, transport, waste management, packaging, warehousing etc. Do you know about Slidesgeeks KPI Dashboard To Evaluate Energy Consumption Designs PDF These are perfect for delivering any kind od presentation. Using it, create PowerPoint presentations that communicate your ideas and engage audiences. Save time and effort by using our pre designed presentation templates that are perfect for a wide range of topic. Our vast selection of designs covers a range of styles, from creative to business, and are all highly customizable and easy to edit. Download as a PowerPoint template or use them as Google Slides themes.
Social Media Performance Analytics Dashboard Ppt Styles Icons PDF
Following slide exhibits social media management statistics with website report. It includes multiple KPIs such as website traffic, followers on multiple social media platforms and site revenue. Showcasing this set of slides titled social media performance analytics dashboard ppt styles icons pdf. The topics addressed in these templates are site revenue, website traffic. All the content presented in this PPT design is completely editable. Download it and make adjustments in color, background, font etc. as per your unique business setting.
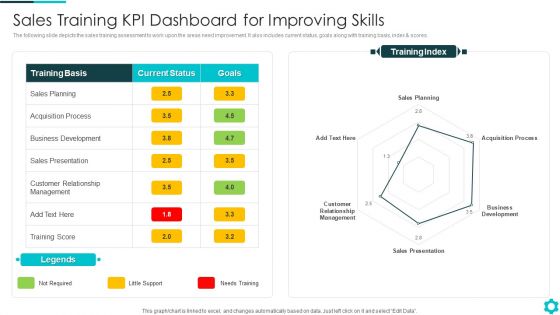
Sales Training KPI Dashboard For Improving Skills Portrait PDF
The following slide depicts the sales training assessment to work upon the areas need improvement. It also includes current status, goals along with training basis, index and scores.Showcasing this set of slides titled Sales Training KPI Dashboard For Improving Skills Portrait PDF The topics addressed in these templates are Acquisition Process, Sales Presentation, Customer Relationship Management All the content presented in this PPT design is completely editable. Download it and make adjustments in color, background, font etc. as per your unique business setting.
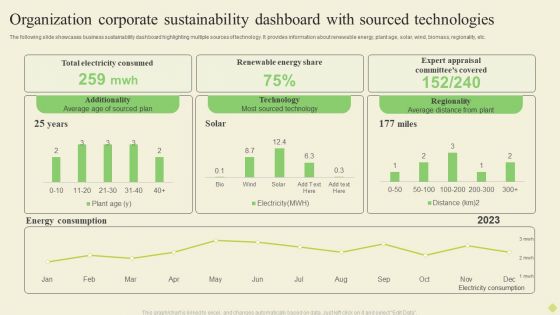
Organization Corporate Sustainability Dashboard With Sourced Technologies Pictures PDF
The following slide showcases green business model for multiple activities. It provides information about growth, return on capital, risk management, innovation, operational risks, etc.Showcasing this set of slides titled Organization Corporate Sustainability Dashboard With Sourced Technologies Pictures PDF. The topics addressed in these templates are Electricity Consumed, Renewable Energy, Committees Covered. All the content presented in this PPT design is completely editable. Download it and make adjustments in color, background, font etc. as per your unique business setting.

Agile PM Dashboard With Backlog Status Summary PDF
This template covers backlog description and status for agile project management with risk and issues mitigation. Further, it includes scope showing activities completion. Pitch your topic with ease and precision using this Agile PM Dashboard With Backlog Status Summary PDF. This layout presents information on Service For Developer Login, Risk And Issues, Service Development. It is also available for immediate download and adjustment. So, changes can be made in the color, design, graphics or any other component to create a unique layout.
Project Tracking Dashboard With Multiple Metrics Pictures PDF
The following slide highlights the KPI of project management to avoid deviations. It includes elements such as schedule, tasks, issue assessment, budget and risk analysis etc. Pitch your topic with ease and precision using this Project Tracking Dashboard With Multiple Metrics Pictures PDF. This layout presents information on Projected Budget Analysis, Risk Analysis, Quality Affirmation. It is also available for immediate download and adjustment. So, changes can be made in the color, design, graphics or any other component to create a unique layout.

Workforce Mobility And Stay Report Dashboard Brochure PDF
This slide showcases HR mobility and stay time report summary. It provides information such as time taken to quit job, notice period served, internal mobility, vacancies, etc. Showcasing this set of slides titled Workforce Mobility And Stay Report Dashboard Brochure PDF. The topics addressed in these templates are Management Roles, Internal Recruitment, Workforce Mobility. All the content presented in this PPT design is completely editable. Download it and make adjustments in color, background, font etc. as per your unique business setting.

Medical Administration Analysis With KPI Dashboard Clipart PDF
The following slide depicts the KPAs of medical and healthcare administration to manage and remit services. It includes KPIs such as numbers of doctors, numbers of patients, monthly patient analysis, upcoming appointments etc. Showcasing this set of slides titled Medical Administration Analysis With KPI Dashboard Clipart PDF. The topics addressed in these templates are Patient Analysis, Higher Than, Upcoming Appointments. All the content presented in this PPT design is completely editable. Download it and make adjustments in color, background, font etc. as per your unique business setting.
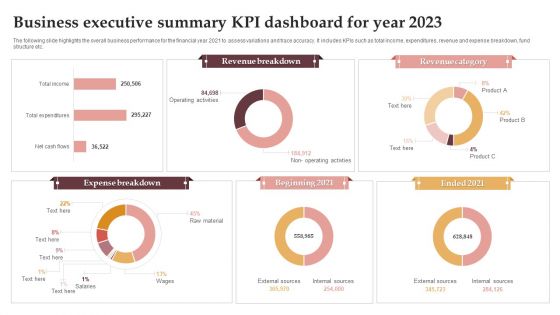
Business Executive Summary KPI Dashboard For Year 2023 Graphics PDF
The following slide highlights the overall business performance for the financial year 2021 to assess variations and trace accuracy. It includes KPIs such as total income, expenditures, revenue and expense breakdown, fund structure etc. Pitch your topic with ease and precision using this Business Executive Summary KPI Dashboard For Year 2023 Graphics PDF. This layout presents information on Revenue Breakdown, Revenue Category, Expense Breakdown. It is also available for immediate download and adjustment. So, changes can be made in the color, design, graphics or any other component to create a unique layout.
Customer Service Request Tickets Administration Dashboard Icons PDF
This slide covers division of tickets into different groups. It also includes a pie chart dividing tickets in multiple categories such as status, tech groups, alert level, request type and alert condition. Pitch your topic with ease and precision using this Customer Service Request Tickets Administration Dashboard Icons PDF. This layout presents information on Tickets Activity, Tickets Alert Level, Tickets Teach Group. It is also available for immediate download and adjustment. So, changes can be made in the color, design, graphics or any other component to create a unique layout.
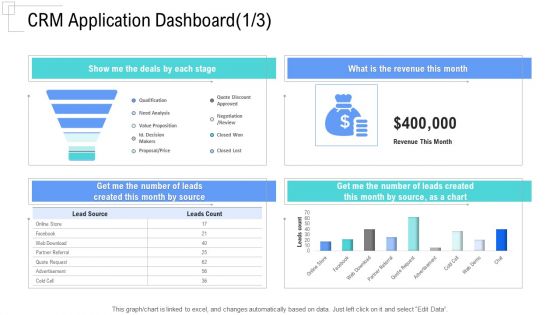
Managing Customer Experience CRM Application Dashboard Month Mockup PDF
This graph or chart is linked to excel, and changes automatically based on data. Just left click on it and select Edit Data.Deliver an awe-inspiring pitch with this creative managing customer experience crm application dashboard month mockup pdf bundle. Topics like show me the deals by each stage, what is the revenue this month, get me the number of leads created this month by source can be discussed with this completely editable template. It is available for immediate download depending on the needs and requirements of the user.

Online Marketing KPI Dashboard With Cost Trend Slides PDF
The following slide highlights the key metrics of digital marketing to reach the target audience in the most cost effective way. It includes average daily impressions, click through rate, cost per click, lead generation, conversion and scoring etc. Pitch your topic with ease and precision using this Online Marketing KPI Dashboard With Cost Trend Slides PDF. This layout presents information on Average Daily Impressions, Click Through Rate, Cost Per Click, Lead Generation, Conversion And Scoring. It is also available for immediate download and adjustment. So, changes can be made in the color, design, graphics or any other component to create a unique layout.

Official Team Collaboration Plan Team Performance Observation Dashboard Background PDF
This slide provides an overview of statistics related to current team performance based on observation method selected in previous slide for data collection. It involves team conflict status, Planned vs actual project status, leadership status and communication gap status. Deliver an awe-inspiring pitch with this creative official team collaboration plan team performance observation dashboard background pdf bundle. Topics like leadership skills status, team conflicts status, communication gaps can be discussed with this completely editable template. It is available for immediate download depending on the needs and requirements of the user.
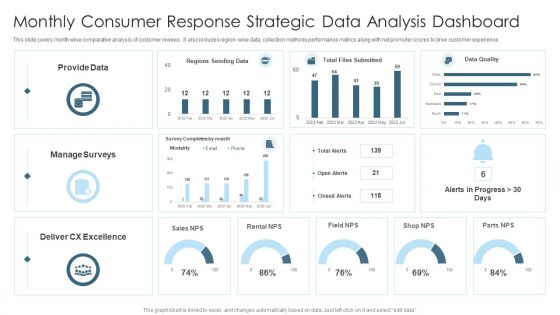
Monthly Consumer Response Strategic Data Analysis Dashboard Graphics PDF
This slide covers month wise comparative analysis of customer reviews . It also includes region wise data, collection methods performance metrics along with net promoter scores to drive customer experience. Showcasing this set of slides titled Monthly Consumer Response Strategic Data Analysis Dashboard Graphics PDF. The topics addressed in these templates are Provide Data, Sales, Manage Surveys. All the content presented in this PPT design is completely editable. Download it and make adjustments in color, background, font etc. as per your unique business setting.
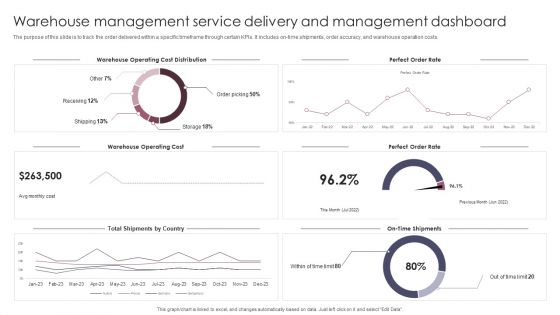
Warehouse Management Service Delivery And Management Dashboard Slides PDF
The purpose of this slide is to track the order delivered within a specific timeframe through certain KPIs. It includes on time shipments, order accuracy, and warehouse operation costs. Showcasing this set of slides titled Warehouse Management Service Delivery And Management Dashboard Slides PDF. The topics addressed in these templates are Warehouse Operating Cost, Warehouse Operating Cost Distribution. All the content presented in this PPT design is completely editable. Download it and make adjustments in color, background, font etc. as per your unique business setting.

Dashboard For Cloud Data Firm Revival Action Plan Summary PDF
Following slide highlights the strategies to optimize recovery performance is to provide a revival techniques to improve performance and overcome the problem of industrial sickness. The major strategies covered herein are cost control strategy, retrenchment strategy and leader replacement strategy. Pitch your topic with ease and precision using this Dashboard For Cloud Data Firm Revival Action Plan Summary PDF. This layout presents information on Device, Success, Process. It is also available for immediate download and adjustment. So, changes can be made in the color, design, graphics or any other component to create a unique layout.
Multi Cloud Infrastructure Management Cloud Performance Tracking Dashboard Diagrams PDF
This slide covers the Key performance indicators for tracking performance of the cloud such as violations break down, sources, rules and severity. From laying roadmaps to briefing everything in detail, our templates are perfect for you. You can set the stage with your presentation slides. All you have to do is download these easy-to-edit and customizable templates. Multi Cloud Infrastructure Management Cloud Performance Tracking Dashboard Diagrams PDF will help you deliver an outstanding performance that everyone would remember and praise you for. Do download this presentation today.
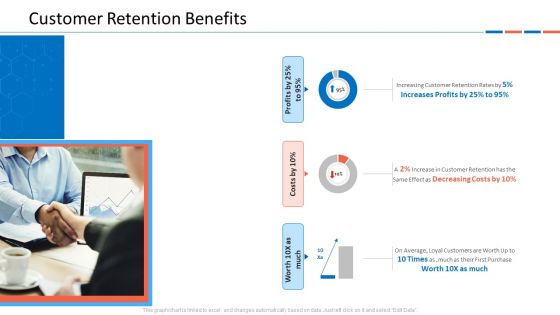
Customer Relationship Management Dashboard Customer Retention Benefits Inspiration PDF
This graph or chart is linked to excel, and changes automatically based on data. Just left click on it and select Edit Data.Deliver an awe inspiring pitch with this creative customer relationship management dashboard customer retention benefits inspiration pdf bundle. Topics like increasing customer retention rates, on average, loyal customers are worth up to 10 times as ,much as their first purchase, profits by 25percent to 95percent can be discussed with this completely editable template. It is available for immediate download depending on the needs and requirements of the user.
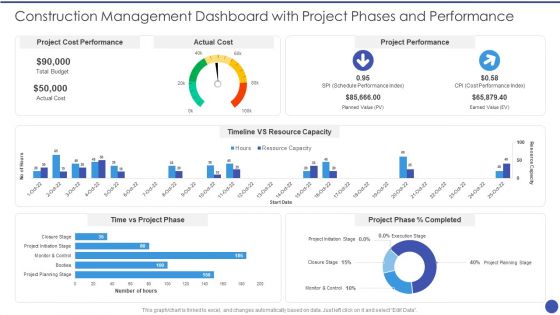
Construction Management Dashboard With Project Phases And Performance Inspiration PDF
This graph for chart is linked to excel, and changes automatically based on data. Just left click on it and select Edit Data. Deliver and pitch your topic in the best possible manner with this Construction Management Dashboard With Project Phases And Performance Inspiration PDF. Use them to share invaluable insights on Project Cost Performance, Actual Cost, Project Performance, Timeline VS Resource Capacity, Time vs Project Phase and impress your audience. This template can be altered and modified as per your expectations. So, grab it now.
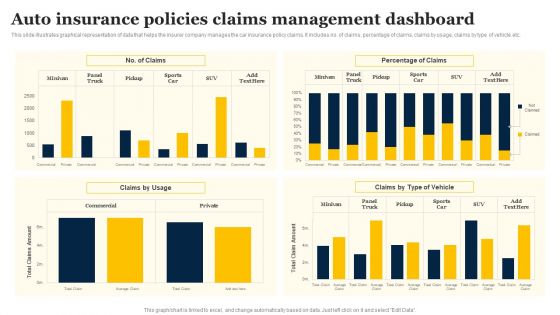
Auto Insurance Policies Claims Management Dashboard Infographics PDF
This slide illustrates graphical representation of data that helps the insurer company manages the car insurance policy claims. It includes no. of claims, percentage of claims, claims by usage, claims by type of vehicle etc. Pitch your topic with ease and precision using this Auto Insurance Policies Claims Management Dashboard Infographics PDF. This layout presents information on Percentage Claims, Claims Usage, Claims Type Vehicle. It is also available for immediate download and adjustment. So, changes can be made in the color, design, graphics or any other component to create a unique layout.
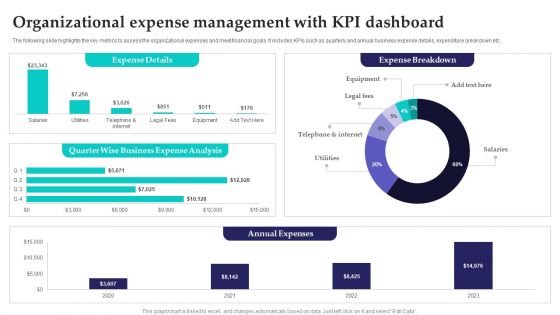
Organizational Expense Management With Kpi Dashboard Slides PDF
The following slide highlights the key metrics to assess the organizational expenses and meet financial goals. It includes KPIs such as quarterly and annual business expense details, expenditure breakdown etc. Showcasing this set of slides titled Organizational Expense Management With Kpi Dashboard Slides PDF. The topics addressed in these templates are Annual Expenses, Expense Details, Expense Breakdown. All the content presented in this PPT design is completely editable. Download it and make adjustments in color, background, font etc. as per your unique business setting.
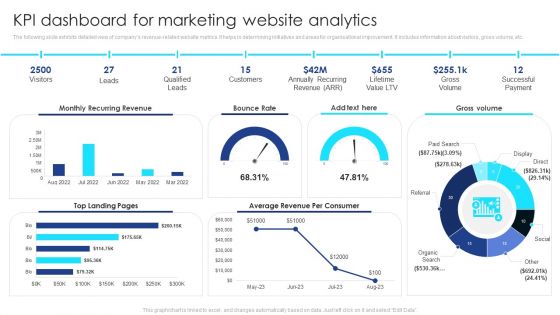
KPI Dashboard For Marketing Website Analytics Summary PDF
The following slide exhibits detailed view of companys revenue-related website metrics. It helps in determining initiatives and areas for organisational improvement. It includes information about visitors, gross volume, etc. Pitch your topic with ease and precision using this KPI Dashboard For Marketing Website Analytics Summary PDF. This layout presents information on Visitors, Leads, Qualified Leads, Customers, Gross Volume, Successful Payment. It is also available for immediate download and adjustment. So, changes can be made in the color, design, graphics or any other component to create a unique layout.

Call Center Process Key Performance Indicator Dashboard Mockup PDF
This slide showcases call center process measurements and key performance indicators so managers and teams can keep track of and improve performance . It includes received calls, calculating speed of answering calls , ended calls before starting conversations , average calls per minute etc. Showcasing this set of slides titled Call Center Process Key Performance Indicator Dashboard Mockup PDF. The topics addressed in these templates are Received Calls, Conversation, Abandon Rate. All the content presented in this PPT design is completely editable. Download it and make adjustments in color, background, font etc. as per your unique business setting.
Tracking The Cashflow Improvements With Cash Management Dashboard Download PDF
This slide showcases the KPIs that would help our business organization to track the improvements in the new cash management process. It includes quick ratio, cash balance, current ratio, days inventory outstanding, etc.Take your projects to the next level with our ultimate collection of Tracking The Cashflow Improvements With Cash Management Dashboard Download PDF. Slidegeeks has designed a range of layouts that are perfect for representing task or activity duration, keeping track of all your deadlines at a glance. Tailor these designs to your exact needs and give them a truly corporate look with your own brand colors they all make your projects stand out from the rest.
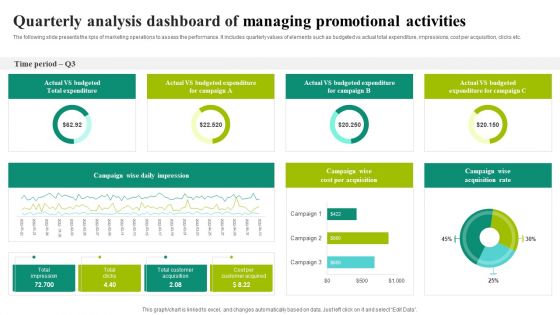
Quarterly Analysis Dashboard Of Managing Promotional Activities Ideas PDF
The following slide presents the kpis of marketing operations to assess the performance. It includes quarterly values of elements such as budgeted vs actual total expenditure, impressions, cost per acquisition, clicks etc. Showcasing this set of slides titled Quarterly Analysis Dashboard Of Managing Promotional Activities Ideas PDF. The topics addressed in these templates are Campaign Wise, Daily Impression, Total Impression, Total Clicks. All the content presented in this PPT design is completely editable. Download it and make adjustments in color, background, font etc. as per your unique business setting.
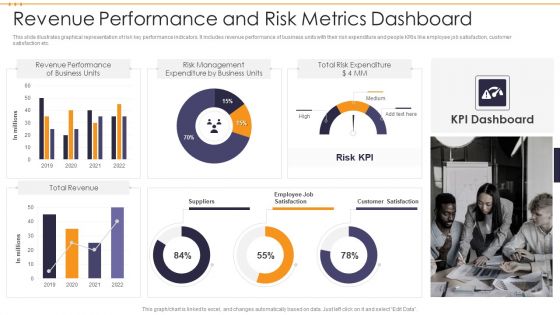
Revenue Performance And Risk Metrics Dashboard Demonstration PDF
This slide illustrates graphical representation of risk key performance indicators. It includes revenue performance of business units with their risk expenditure and people KRIs like employee job satisfaction, customer satisfaction etc. Showcasing this set of slides titled Revenue Performance And Risk Metrics Dashboard Demonstration PDF. The topics addressed in these templates are Total Risk Expenditure, Risk Management, Revenue Performance . All the content presented in this PPT design is completely editable. Download it and make adjustments in color, background, font etc. as per your unique business setting.
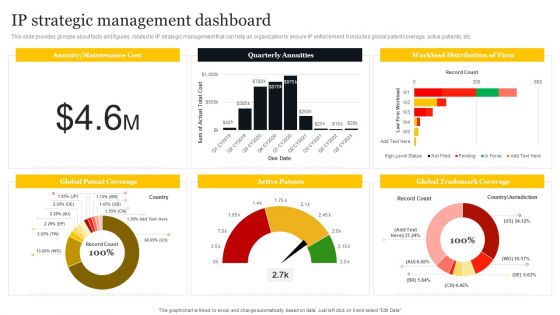
IP Strategic Management Dashboard Ppt PowerPoint Presentation File Example PDF
This slide provides glimpse about facts and figures related to IP strategic management that can help an organization to ensure IP enforcement. It includes global patent coverage, active patients, etc. Showcasing this set of slides titled IP Strategic Management Dashboard Ppt PowerPoint Presentation File Example PDF. The topics addressed in these templates are Quarterly Annuities, Workload Distribution Firm, Active Patents. All the content presented in this PPT design is completely editable. Download it and make adjustments in color, background, font etc. as per your unique business setting.
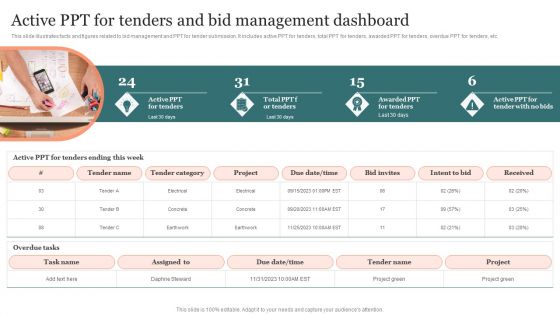
Active Ppt For Tenders And Bid Management Dashboard Microsoft PDF
This slide illustrates facts and figures related to bid management and PPT for tender submission. It includes active PPT for tenders, total PPT for tenders, awarded PPT for tenders, overdue PPT for tenders, etc. Presenting Active Ppt For Tenders And Bid Management Dashboard Microsoft PDF to dispense important information. This template comprises four stages. It also presents valuable insights into the topics including Project, Tender Name, Bid Invites. This is a completely customizable PowerPoint theme that can be put to use immediately. So, download it and address the topic impactfully.

IT Performance Management And Analysis Dashboard Ppt Styles Portrait PDF
This slide covers analytical summary of IT incidents recorded and managed. It includes elements such as average incident re-assignments, average age of open incidents based on priority, basic indicators, etc. Showcasing this set of slides titled IT Performance Management And Analysis Dashboard Ppt Styles Portrait PDF. The topics addressed in these templates are Average Age, Open Incidents Priority, Re Assigned, Incidents Count. All the content presented in this PPT design is completely editable. Download it and make adjustments in color, background, font etc. as per your unique business setting.

Reputation Management Dashboard To Track Brands Effectiveness Pictures PDF
This slide provides information regarding reputation management to monitor brands effectiveness in terms of brand review summary, listing score, competition, listing accuracy, etc.Retrieve professionally designed Reputation Management Dashboard To Track Brands Effectiveness Pictures PDF to effectively convey your message and captivate your listeners. Save time by selecting pre-made slideshows that are appropriate for various topics, from business to educational purposes. These themes come in many different styles, from creative to corporate, and all of them are easily adjustable and can be edited quickly. Access them as PowerPoint templates or as Google Slides themes. You do not have to go on a hunt for the perfect presentation because Slidegeeks got you covered from everywhere.
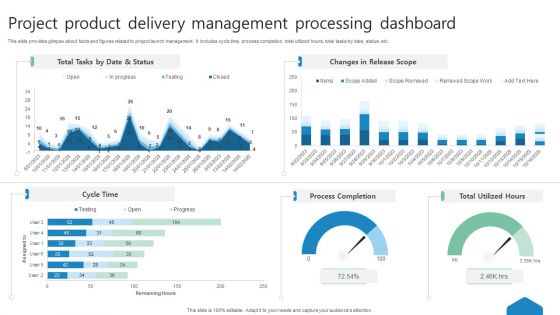
Project Product Delivery Management Processing Dashboard Ppt Summary Samples PDF
This slide provides glimpse about facts and figures related to project launch management. It includes cycle time, process completion, total utilized hours, total tasks by date, status, etc. Showcasing this set of slides titled Project Product Delivery Management Processing Dashboard Ppt Summary Samples PDF. The topics addressed in these templates are Process Completion, Total Utilized Hours, Cycle Time. All the content presented in this PPT design is completely editable. Download it and make adjustments in color, background, font etc. as per your unique business setting.
Sales Techniques Playbook Sales Management Activities Tracking Dashboard Introduction PDF
This slide provides information regarding various metrics catered to track sales team performance in terms of average revenue per account, win rate, NPS, along with sales representative performance tracking through number of opportunities created, lead response time, etc. Deliver an awe inspiring pitch with this creative sales techniques playbook sales management activities tracking dashboard introduction pdf bundle. Topics like growth, sales can be discussed with this completely editable template. It is available for immediate download depending on the needs and requirements of the user.
Key Blocks For Project Management Dashboard Ppt Icon Tips PDF
This slide illustrates graphical representations of facts and figures related to project drivers. It includes stakeholders engagement, feedback and response rate, business units performance etc. Showcasing this set of slides titled Key Blocks For Project Management Dashboard Ppt Icon Tips PDF. The topics addressed in these templates are Stakeholders Engagement Score, Business Units Performance, Effective Communication Score. All the content presented in this PPT design is completely editable. Download it and make adjustments in color, background, font etc. as per your unique business setting.

Lead Management To Engage Potential Customers Sales Dashboard Themes PDF
Do you know about Slidesgeeks Lead Management To Engage Potential Customers Sales Dashboard Themes PDF These are perfect for delivering any kind od presentation. Using it, create PowerPoint presentations that communicate your ideas and engage audiences. Save time and effort by using our pre designed presentation templates that are perfect for a wide range of topic. Our vast selection of designs covers a range of styles, from creative to business, and are all highly customizable and easy to edit. Download as a PowerPoint template or use them as Google Slides themes.

Term Life Insurance Plan Claims Management Dashboard Portrait PDF
This slide illustrates facts and figures related to status of total claims and closed claims made in an insurance company. It includes yearly claim status pie-chart, total claims quarter-wise and total closed claims quarter-wise. Pitch your topic with ease and precision using this Term Life Insurance Plan Claims Management Dashboard Portrait PDF. This layout presents information on Yearly Claim Status, Total Claims, Quarter Wise. It is also available for immediate download and adjustment. So, changes can be made in the color, design, graphics or any other component to create a unique layout.

Safety Risk Management Dashboard For Manufacturing Company Introduction PDF
This slide displays security metrics for company which includes number of critical incidents, cost, type, days since last accident to keep a track of Improvement needed in security performance. Showcasing this set of slides titled Safety Risk Management Dashboard For Manufacturing Company Introduction PDF. The topics addressed in these templates are Incident Per Employee, Total Incident Our Company, Incidence Avoidance Quiz Store. All the content presented in this PPT design is completely editable. Download it and make adjustments in color, background, font etc. as per your unique business setting.
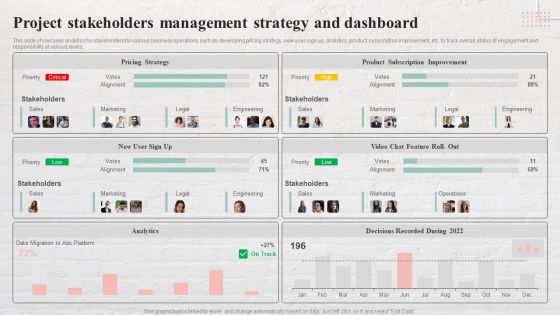
Project Stakeholders Management Strategy And Dashboard Sample PDF
This slide showcases analytics for stakeholders for various business operations such as developing pricing strategy, new user sign up, analytics, product subscription improvement, etc. to track overall status of engagement and responsibility at various levels. Pitch your topic with ease and precision using this Project Stakeholders Management Strategy And Dashboard Sample PDF. This layout presents information on Pricing Strategy, Product Subscription Improvement. It is also available for immediate download and adjustment. So, changes can be made in the color, design, graphics or any other component to create a unique layout.
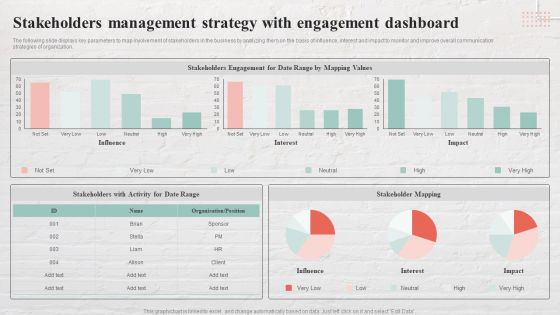
Stakeholders Management Strategy With Engagement Dashboard Infographics PDF
The following slide displays key parameters to map involvement of stakeholders in the business by analyzing them on the basis of influence, interest and impact to monitor and improve overall communication strategies of organization. Pitch your topic with ease and precision using this Stakeholders Management Strategy With Engagement Dashboard Infographics PDF. This layout presents information on Influence, Interest, Impact. It is also available for immediate download and adjustment. So, changes can be made in the color, design, graphics or any other component to create a unique layout.

Fleet Information Management Dashboard For Real Time Information Graphics PDF
This slide showcases real time information about appointments schedules for customer services. This template focuses on optimizing routes and taking business performance to next level. It includes information related to cars, costs, travels, etc. Pitch your topic with ease and precision using this Fleet Information Management Dashboard For Real Time Information Graphics PDF. This layout presents information on General Inspection, Oil Change, Tire Change. It is also available for immediate download and adjustment. So, changes can be made in the color, design, graphics or any other component to create a unique layout.

Home Insurance Analytics Statistics With Settlement Time Dashboard Ideas PDF
This slide illustrates home insurance facts and figures of the organization. It includes monthly claim volume, claim status, average notification time, acknowledged time, decision time etc. Pitch your topic with ease and precision using this Home Insurance Analytics Statistics With Settlement Time Dashboard Ideas PDF. This layout presents information on Average Acknowledged Time, Average Decision Time, Average Lead Time. It is also available for immediate download and adjustment. So, changes can be made in the color, design, graphics or any other component to create a unique layout.
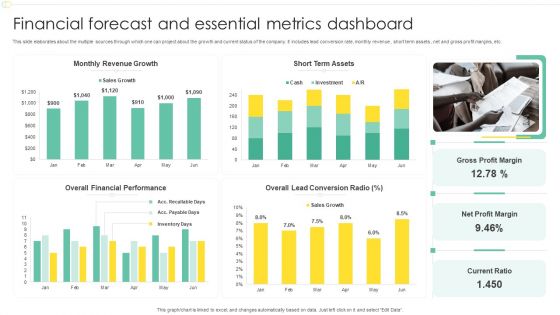
Financial Forecast And Essential Metrics Dashboard Ppt File Show PDF
This slide elaborates about the multiple sources through which one can project about the growth and current status of the company. It includes lead conversion rate, monthly revenue , short term assets , net and gross profit margins, etc. Pitch your topic with ease and precision using this Financial Forecast And Essential Metrics Dashboard Ppt File Show PDF. This layout presents information on Monthly Revenue Growth, Short Term Assets, Overall Financial Performance, Net Profit Margin. It is also available for immediate download and adjustment. So, changes can be made in the color, design, graphics or any other component to create a unique layout.

Key Success Factors Dashboard For Healthcare Industry Diagrams PDF
This slide displays major analytics for hospital administration to identify issues in real-time for best possible patients care. It includes details such as total patients admitted, treatment cost, waiting time, available staff, divisions, etc. Showcasing this set of slides titled Key Success Factors Dashboard For Healthcare Industry Diagrams PDF. The topics addressed in these templates are Success Factors, Total Patients, Total Patients Admitted, Available Staff. All the content presented in this PPT design is completely editable. Download it and make adjustments in color, background, font etc. as per your unique business setting.

Healthcare Big Data Assessment Dashboard Slide2 Introduction PDF
This slide covers the records about the patients used to describe massive volumes of information created by the adoption of digital technologies that collect patients records and help in managing hospital performance. Showcasing this set of slides titled Healthcare Big Data Assessment Dashboard Slide2 Introduction PDF. The topics addressed in these templates are Forecasted Patient Turnover, Service Indicators, Occupancy. All the content presented in this PPT design is completely editable. Download it and make adjustments in color, background, font etc. as per your unique business setting.
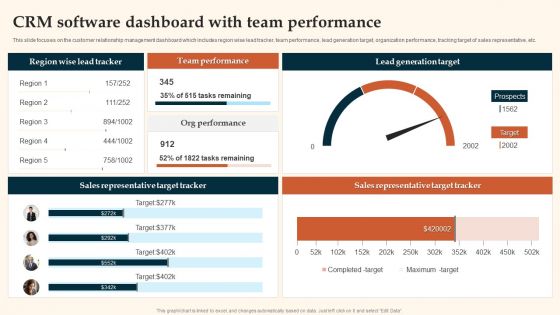
Crm Software Dashboard With Team Performance Topics PDF
This slide shows the using customer relationship management tool for managing their database which includes name of customer, bio, social profiles, creation date, last seen, country, total visits and plan. Showcasing this set of slides titled Crm Software Dashboard With Team Performance Topics PDF. The topics addressed in these templates are Competitive Customer Relationship Tool, Customer Database Management. All the content presented in this PPT design is completely editable. Download it and make adjustments in color, background, font etc. as per your unique business setting.

 Home
Home