Goal Chart
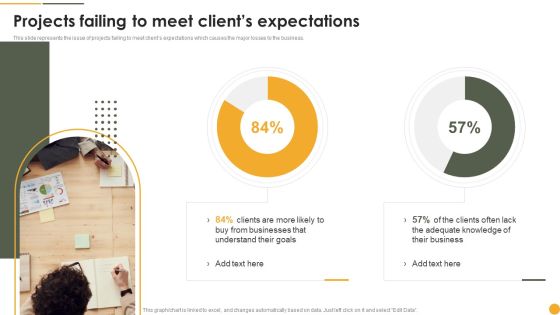
Dynamic Systems Development Approach Projects Failing To Meet Clients Expectations Inspiration PDF
This slide represents the issue of projects failing to meet clients expectations which causes the major losses to the business. Deliver and pitch your topic in the best possible manner with this Dynamic Systems Development Approach Projects Failing To Meet Clients Expectations Inspiration PDF. Use them to share invaluable insights on Businesses, Goals, Adequate Knowledge and impress your audience. This template can be altered and modified as per your expectations. So, grab it now.

Integrating Social Media Tactics Dashboard For Monitoring Snapchat Marketing Elements PDF
This slide shows dashboard for monitoring Snapchat marketing performance. It provides details about ad spends, impressions, cost per thousand eCPM, swipe ups, campaign, delivery status, budget, goal, bid, etc. Deliver an awe inspiring pitch with this creative Integrating Social Media Tactics Dashboard For Monitoring Snapchat Marketing Elements PDF bundle. Topics like Cost Per Thousand, Swipe Ups, Ad Spends can be discussed with this completely editable template. It is available for immediate download depending on the needs and requirements of the user.
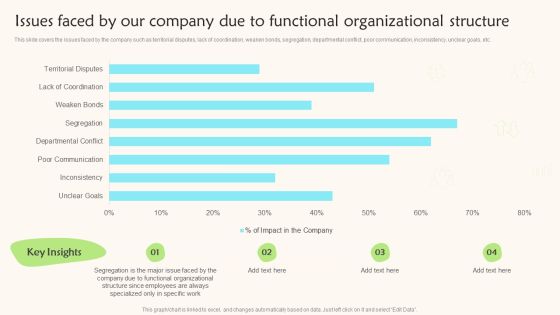
Issues Faced By Our Company Due To Functional Organizational Structure Teams Working Towards Sample PDF
This slide covers the issues faced by the company such as territorial disputes, lack of coordination, weaken bonds, segregation, departmental conflict, poor communication, inconsistency, unclear goals, etc.Deliver an awe inspiring pitch with this creative Issues Faced By Our Company Due To Functional Organizational Structure Teams Working Towards Sample PDF bundle. Topics like Segregation Major, Functional Organizational, Structure Employees can be discussed with this completely editable template. It is available for immediate download depending on the needs and requirements of the user.

Web Monthly Usage Analysis Summary Dashboard Clipart PDF
This slide depicts website usage analytics report for tracking performance. It involves number of users, sessions, bounce rate and average session duration. Pitch your topic with ease and precision using this Web Monthly Usage Analysis Summary Dashboard Clipart PDF. This layout presents information on Agency Metrics, Source Rate, Goal. It is also available for immediate download and adjustment. So, changes can be made in the color, design, graphics or any other component to create a unique layout.

Staff Retention Plan Employee Survey Results Ppt Model Summary PDF
Purpose of the following slide is to show the survey results as it displays pie chart that show actual results. Deliver an awe inspiring pitch with this creative staff retention plan employee survey results ppt model summary pdf bundle. Topics like employee survey results can be discussed with this completely editable template. It is available for immediate download depending on the needs and requirements of the user.

Strategic Human Resource Retention Management Employee Survey Results Template PDF
Purpose of the following slide is to show the survey results as it displays pie chart that show actual results. Deliver and pitch your topic in the best possible manner with this Strategic Human Resource Retention Management Employee Survey Results Template PDF. Use them to share invaluable insights on Compensation, Underappreciated, Work Environment and impress your audience. This template can be altered and modified as per your expectations. So, grab it now.
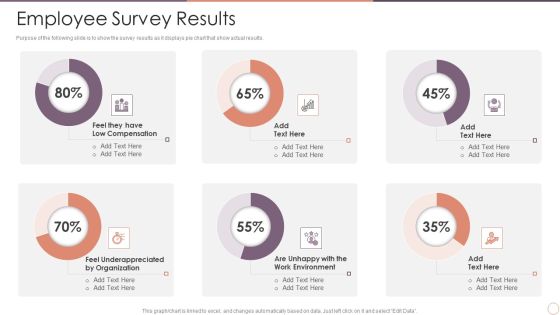
Managing Employee Turnover Employee Survey Results Microsoft PDF
Purpose of the following slide is to show the survey results as it displays pie chart that show actual results. Deliver an awe inspiring pitch with this creative Managing Employee Turnover Employee Survey Results Microsoft PDF bundle. Topics like Low Compensation, Underappreciated, Work Environment can be discussed with this completely editable template. It is available for immediate download depending on the needs and requirements of the user.
Social Media Marketing Performance Highlights With Key Campaign Results Ppt Icon PDF
This graph or chart is linked to excel, and changes automatically based on data. Just left click on it and select Edit Data. Showcasing this set of slides titled Social Media Marketing Performance Highlights With Key Campaign Results Ppt Icon PDF. The topics addressed in these templates are Profit Per, Overall Campaign, Total Budget. All the content presented in this PPT design is completely editable. Download it and make adjustments in color, background, font etc. as per your unique business setting.
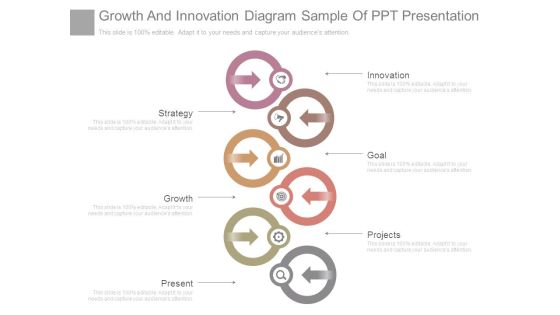
Growth And Innovation Diagram Sample Of Ppt Presentation
This is a growth and innovation diagram sample of ppt presentation. This is a six stage process. The stages in this process are strategy, growth, present, innovation, goal, projects.
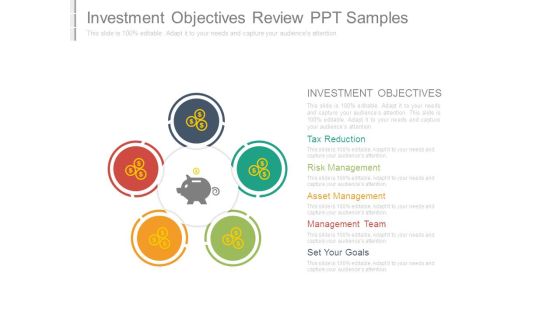
Investment Objectives Review Ppt Samples
This is a investment objectives review ppt samples. This is a five stage process. The stages in this process are investment objectives, tax reduction, risk management, asset management, management team, set your goals.
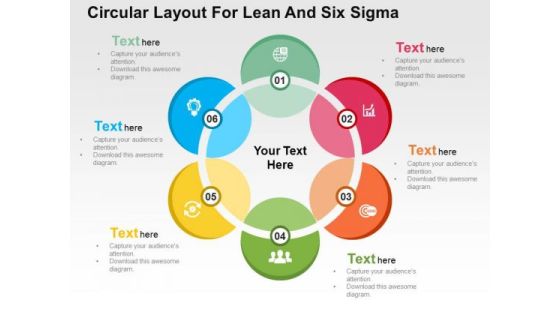
Circular Layout For Lean And Six Sigma PowerPoint Templates
Create visually amazing presentations with this circular diagram. Use this business slide to depict lean and Six Sigma. You may use this slide to share a plan to achieve the desired goals.
Motivating And Managing Employees Layout Ppt Icon
This is a motivating and managing employees layout ppt icon. This is a seven stage process. The stages in this process are setting goals, measuring performance, quality, excellent, leadership, motivation, performance, motivating and managing employees.

Product Positioning In Overseas Market Diagram Powerpoint Slide Designs
This is a product positioning in overseas market diagram powerpoint slide designs. This is a five stage process. The stages in this process are goals, target customers, core activities and markets, product segment focus, positioning.

3d Arrow Dilemma Of Puzzle Process 7 Stages Small Business Plans PowerPoint Templates
We present our 3d arrow dilemma of puzzle process 7 stages small business plans PowerPoint templates.Present our Symbol PowerPoint Templates because your marketing strategies can funnel down to the cone, stage by stage, refining as you go along. Download and present our Flow charts PowerPoint Templates because this template with an image of helps you chart the course of your presentation. Present our Arrows PowerPoint Templates because they are the stepping stones of our journey till date. Use our Puzzles or Jigsaws PowerPoint Templates because the ideas and plans are on your finger tips. Present our Business PowerPoint Templates because your ideas too are pinpointedly focused on you goals.Use these PowerPoint slides for presentations relating to 3d, Puzzle, Process, Arrow, Arrows, Block, Business, Chart, Design, Development, Diagram, Direction, Element, Flow, Flowchart, Graph, Linear, Management, Organization, Process, Program, Section, Sign, Solution, Symbol. The prominent colors used in the PowerPoint template are Yellow, Gray, Black. Professionals tell us our 3d arrow dilemma of puzzle process 7 stages small business plans PowerPoint templates are Excellent. We assure you our Process PowerPoint templates and PPT Slides are Perfect. People tell us our 3d arrow dilemma of puzzle process 7 stages small business plans PowerPoint templates are designed to make your presentations professional. Customers tell us our Arrow PowerPoint templates and PPT Slides look good visually. Use our 3d arrow dilemma of puzzle process 7 stages small business plans PowerPoint templates are Beautiful. We assure you our Design PowerPoint templates and PPT Slides are Fantastic.
Sample Of Team Building Model Ppt Sample
This is a sample of team building model ppt sample. This is a seven stage process. The stages in this process are productivity, self learning, workplace, communication, cooperation, motivation, common goal.
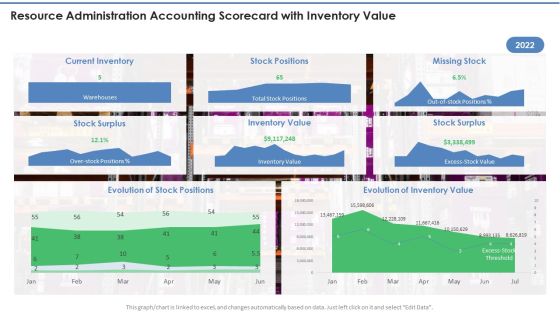
Resource Administration Accounting Scorecard With Inventory Value Infographics PDF
This graph or chart is linked to excel, and changes automatically based on data. Just left click on it and select Edit Data. Deliver and pitch your topic in the best possible manner with this Resource Administration Accounting Scorecard With Inventory Value Infographics PDF. Use them to share invaluable insights on Current Inventory, Stock Positions, Missing Stock and impress your audience. This template can be altered and modified as per your expectations. So, grab it now.
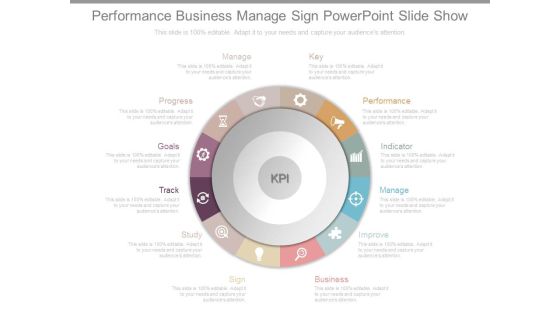
Performance Business Manage Sign Powerpoint Slide Show
This is a performance business manage sign powerpoint slide show. This is a twelve stage process. The stages in this process are key, performance, indicator, manage, improve, business, sign, study, track, goals, progress, manage, kpi.

Healthcare Hospital Performance Data Scorecard With Patient Readmission Rate Ppt Model Objects PDF
This graphor chart is linked to excel, and changes automatically based on data. Just left click on it and select Edit Data. Deliver and pitch your topic in the best possible manner with this Healthcare Hospital Performance Data Scorecard With Patient Readmission Rate Ppt Model Objects PDF. Use them to share invaluable insights on Time To Service, Average Patient Satisfaction, Patient Readmission Rate and impress your audience. This template can be altered and modified as per your expectations. So, grab it now.

Manufacturing Productivity Analysis Bar Graph Introduction PDF
This slide illustrates the productivity chart of manufacturing of a company. It includes quantity produced in million units against the time period. Pitch your topic with ease and precision using this Manufacturing Productivity Analysis Bar Graph Introduction PDF. This layout presents information on Manufacturing Productivity, Production Decreased, Closure Of Companies. It is also available for immediate download and adjustment. So, changes can be made in the color, design, graphics or any other component to create a unique layout.

Quarterly Resource Administration Accounting Scorecard With Average Finished Goods Value Introduction PDF
This graph or chart is linked to excel, and changes automatically based on data. Just left click on it and select Edit Data. Deliver an awe inspiring pitch with this creative Quarterly Resource Administration Accounting Scorecard With Average Finished Goods Value Introduction PDF bundle. Topics like Inventory Turns, Average WIP Value, Total Cost Goods can be discussed with this completely editable template. It is available for immediate download depending on the needs and requirements of the user.

Construction Management Dashboard With Productivity And Worked Hours Themes PDF
This graph for chart is linked to excel, and changes automatically based on data. Just left click on it and select Edit Data. Deliver an awe inspiring pitch with this creative Construction Management Dashboard With Productivity And Worked Hours Themes PDF bundle. Topics like Teams, Employees, Overall Construction Management Efficiency, Remuneration, Work Environment can be discussed with this completely editable template. It is available for immediate download depending on the needs and requirements of the user.
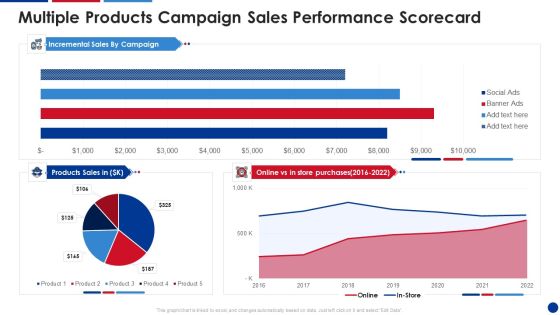
Multiple Products Campaign Sales Performance Scorecard Download PDF
This graph or chart is linked to excel, and changes automatically based on data. Just left click on it and select Edit Data. Deliver an awe inspiring pitch with this creative Multiple Products Campaign Sales Performance Scorecard Download PDF bundle. Topics like Incremental Sales, Products Sales, Store Purchases can be discussed with this completely editable template. It is available for immediate download depending on the needs and requirements of the user.

State And Product Wise Sales Performance Scorecard Summary PDF
This graph or chart is linked to excel, and changes automatically based on data. Just left click on it and select Edit Data. Deliver an awe inspiring pitch with this creative State And Product Wise Sales Performance Scorecard Summary PDF bundle. Topics like State Wise Sales, Products Sale, Region Wise Sales can be discussed with this completely editable template. It is available for immediate download depending on the needs and requirements of the user.

Product Marketing Leadership Product Marketing Dashboard For Pay Per Microsoft PDF
This graph or chart is linked to excel, and changes automatically based on data. Just left click on it and select Edit Data. Find a pre-designed and impeccable Product Marketing Leadership Product Marketing Dashboard For Pay Per Microsoft PDF. The templates can ace your presentation without additional effort. You can download these easy-to-edit presentation templates to make your presentation stand out from others. So, what are you waiting for Download the template from Slidegeeks today and give a unique touch to your presentation.
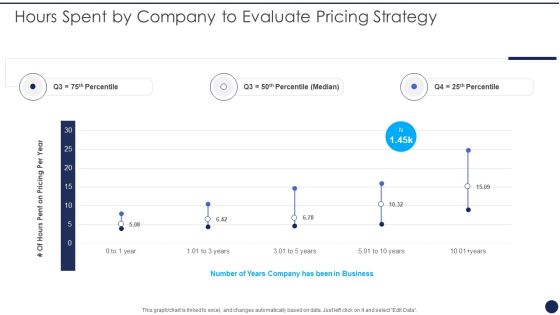
Hours Spent By Company To Evaluate Pricing Strategy Product Pricing Strategies Analysis Themes PDF
This graph or chart is linked to excel, and changes automatically based on data. Just left click on it and select Edit Data. Deliver and pitch your topic in the best possible manner with this Hours Spent By Company To Evaluate Pricing Strategy Product Pricing Strategies Analysis Themes PDF. Use them to share invaluable insights on Pricing Per Year, Number Years Business and impress your audience. This template can be altered and modified as per your expectations. So, grab it now.

Farming Business Company Profile Inventories By Segment 2016 And 2021 Themes PDF
This slide highlights the inventories for 2016 and 2021 through pie chart format. It includes retail products, potash, nitrogen, and phosphate.Deliver and pitch your topic in the best possible manner with this Farming Business Company Profile Inventories By Segment 2016 And 2021 Themes PDF. Use them to share invaluable insights on Products Increased, Stock Value, Values Potash and impress your audience. This template can be altered and modified as per your expectations. So, grab it now.
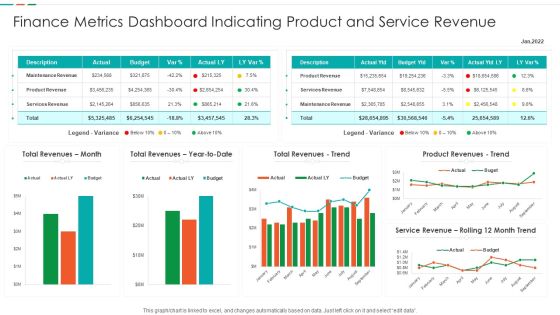
Finance Metrics Dashboard Indicating Product And Service Revenue Designs PDF
This graph or chart is linked to excel, and changes automatically based on data. Just left click on it and select edit data. Showcasing this set of slides titled Finance Metrics Dashboard Indicating Product And Service Revenue Designs PDF. The topics addressed in these templates are Maintenance Revenue Product, Revenue Product Revenues, Service Revenue Rolling. All the content presented in this PPT design is completely editable. Download it and make adjustments in color, background, font etc. as per your unique business setting.
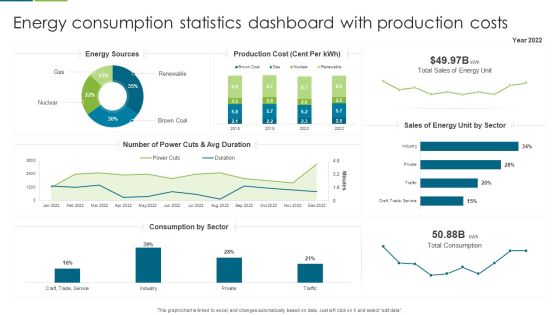
Energy Consumption Statistics Dashboard With Production Costs Slides PDF
This graph or chart is linked to excel, and changes automatically based on data. Just left click on it and select edit data. Showcasing this set of slides titled Energy Consumption Statistics Dashboard With Production Costs Slides PDF. The topics addressed in these templates are Production Cost, Sales Energy, Number Power. All the content presented in this PPT design is completely editable. Download it and make adjustments in color, background, font etc. as per your unique business setting.
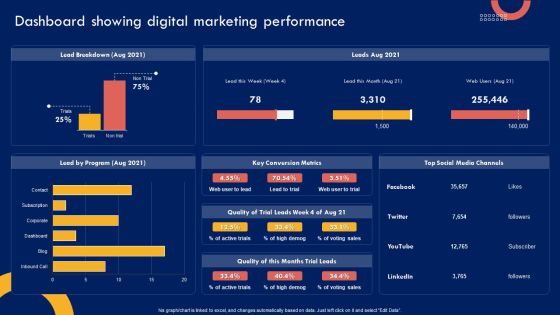
Product Marketing Leadership Dashboard Showing Digital Marketing Performance Download PDF
This graph OR chart is linked to excel, and changes automatically based on data. Just left click on it and select Edit Data. There are so many reasons you need a Product Marketing Leadership Dashboard Showing Digital Marketing Performance Download PDF. The first reason is you cant spend time making everything from scratch, Thus, Slidegeeks has made presentation templates for you too. You can easily download these templates from our website easily.

Product Pricing Strategies Analysis Business Conversion Due To Improved Pricing Strategy Slides PDF
This graph or chart is linked to excel, and changes automatically based on data. Just left click on it and select Edit Data. Deliver an awe inspiring pitch with this creative Product Pricing Strategies Analysis Business Conversion Due To Improved Pricing Strategy Slides PDF bundle. Topics like Increase Conversion Rate, Keep Expected Profit, Reduce Conversion Rate, Improve Expected Profit can be discussed with this completely editable template. It is available for immediate download depending on the needs and requirements of the user.

Product Pricing Strategies Analysis Hours Spent By Company To Evaluate Pricing Strategy Professional PDF
This graph or chart is linked to excel, and changes automatically based on data. Just left click on it and select Edit Data. Deliver an awe inspiring pitch with this creative Product Pricing Strategies Analysis Hours Spent By Company To Evaluate Pricing Strategy Professional PDF bundle. Topics like Pricing Per Year, Number Years Business can be discussed with this completely editable template. It is available for immediate download depending on the needs and requirements of the user.

Product Pricing Strategies Analysis Trade Off Between Profit And Demand For Optimal Price Portrait PDF
This graph or chart is linked to excel, and changes automatically based on data. Just left click on it and select Edit Data. Deliver and pitch your topic in the best possible manner with this Product Pricing Strategies Analysis Trade Off Between Profit And Demand For Optimal Price Portrait PDF. Use them to share invaluable insights on Potential Profit Premium, Demand Function Premium and impress your audience. This template can be altered and modified as per your expectations. So, grab it now.

Auto Sales Scorecard Bar Graph For Regional Performance Comparison Infographics PDF
This graph or chart is linked to excel, and changes automatically based on data. Just left click on it and select Edit Data. Deliver an awe inspiring pitch with this creative Auto Sales Scorecard Bar Graph For Regional Performance Comparison Infographics PDF bundle. Topics like Auto Sales Scorecard, Bar Graph Regional, Performance Comparison Product can be discussed with this completely editable template. It is available for immediate download depending on the needs and requirements of the user.
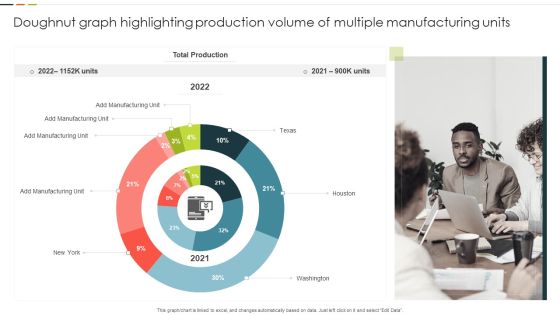
Doughnut Graph Highlighting Production Volume Of Multiple Manufacturing Units Guidelines PDF
This graph or chart is linked to excel, and changes automatically based on data. Just left click on it and select Edit Data. Showcasing this set of slides titled Doughnut Graph Highlighting Production Volume Of Multiple Manufacturing Units Guidelines PDF. The topics addressed in these templates are Total Production, Manufacturing Unit, Washington. All the content presented in this PPT design is completely editable. Download it and make adjustments in color, background, font etc. as per your unique business setting.

Kanban Structure For Product Quality Assurance Ppt Portfolio Deck PDF
This graph or chart is linked to excel, and changes automatically based on data. Just left click on it and select Edit Data. Pitch your topic with ease and precision using this Kanban Structure For Product Quality Assurance Ppt Portfolio Deck PDF. This layout presents information on Product Deployment, Quality Assurance, Product, Designing And Development. It is also available for immediate download and adjustment. So, changes can be made in the color, design, graphics or any other component to create a unique layout.
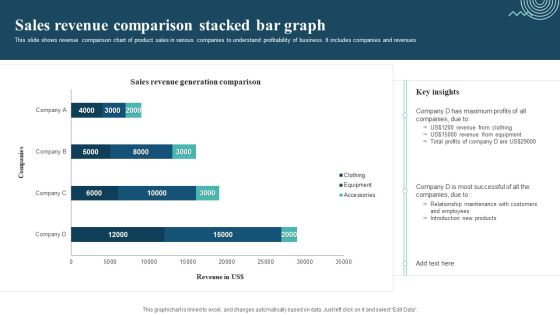
Sales Revenue Comparison Stacked Bar Graph Mockup PDF
This slide shows revenue comparison chart of product sales in various companies to understand profitability of business. It includes companies and revenues. Showcasing this set of slides titled Sales Revenue Comparison Stacked Bar Graph Mockup PDF. The topics addressed in these templates are Sales Revenue Comparison, Revenue From Clothing, Revenue From Equipment. All the content presented in this PPT design is completely editable. Download it and make adjustments in color, background, font etc. as per your unique business setting.

Product Performance Highlights With Key Growth Drivers Ppt Pictures Design Templates PDF
This graph or chart is linked to excel, and changes automatically based on data. Just left click on it and select Edit Data. Pitch your topic with ease and precision using this Product Performance Highlights With Key Growth Drivers Ppt Pictures Design Templates PDF. This layout presents information on Product Performance, Key Growth, Projected Growth. It is also available for immediate download and adjustment. So, changes can be made in the color, design, graphics or any other component to create a unique layout.

Client Helpline Dashboard With Product Customer Satisfaction Ppt Slides Graphics Template PDF
This graph or chart is linked to excel, and changes automatically based on data. Just left click on it and select Edit Data. Pitch your topic with ease and precision using this Client Helpline Dashboard With Product Customer Satisfaction Ppt Slides Graphics Template PDF. This layout presents information on Customer Satisfaction, Product, Compare. It is also available for immediate download and adjustment. So, changes can be made in the color, design, graphics or any other component to create a unique layout.
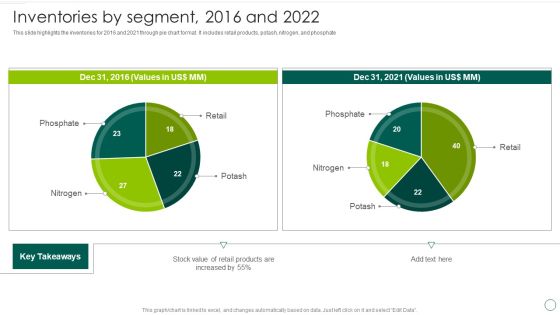
Food And Agro Company Outline Inventories By Segment 2016 And 2022 Background PDF
This slide highlights the inventories for 2016 and 2021 through pie chart format. It includes retail products, potash, nitrogen, and phosphate. Deliver an awe inspiring pitch with this creative Food And Agro Company Outline Inventories By Segment 2016 And 2022 Background PDF bundle. Topics like 2016, Stock Value, Retail Products can be discussed with this completely editable template. It is available for immediate download depending on the needs and requirements of the user.

Inventories By Segment 2016 And 2021 Global Food Products Company Profile Summary PDF
This slide highlights the inventories for 2016 and 2021 through pie chart format. It includes retail products, potash, nitrogen, and phosphateFind a pre-designed and impeccable Inventories By Segment 2016 And 2021 Global Food Products Company Profile Summary PDF. The templates can ace your presentation without additional effort. You can download these easy-to-edit presentation templates to make your presentation stand out from others. So, what are you waiting for Download the template from Slidegeeks today and give a unique touch to your presentation.
Digital Media Channels Company Wide Aggregate Financials Of Grundfom Water Icons PDF
This slide provides Company-Wide Aggregate Financials of Grundfom Water Management Company along with new turnover, financial result, revenue growth chart etc. Deliver an awe inspiring pitch with this creative Digital Media Channels Company Wide Aggregate Financials Of Grundfom Water Icons PDF bundle. Topics like Including Fomfarm, Revenue Forecast, FomFarms Revenues can be discussed with this completely editable template. It is available for immediate download depending on the needs and requirements of the user.

IT Security Evaluation Scorecard With Bar Graph Ppt Gallery Design Templates PDF
This graph or chart is linked to excel, and changes automatically based on data. Just left click on it and select Edit Data. Deliver and pitch your topic in the best possible manner with this IT Security Evaluation Scorecard With Bar Graph Ppt Gallery Design Templates PDF. Use them to share invaluable insights on CPU Utilization Memory, Utilization Packet Loss and impress your audience. This template can be altered and modified as per your expectations. So, grab it now.

Weekly Sales Performance Highlights With Product Share Ppt File Information PDF
This graph or chart is linked to excel, and changes automatically based on data. Just left click on it and select Edit Data. Pitch your topic with ease and precision using this Weekly Sales Performance Highlights With Product Share Ppt File Information PDF. This layout presents information on Dashboard Summary, Weekly Sale, Product Share. It is also available for immediate download and adjustment. So, changes can be made in the color, design, graphics or any other component to create a unique layout.
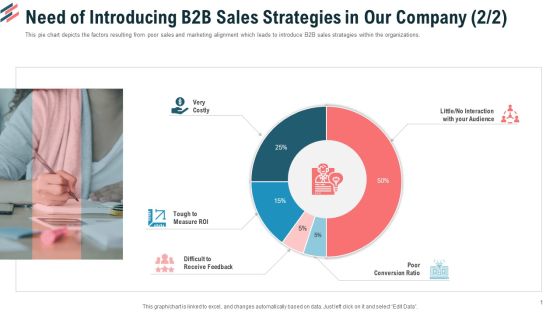
Need Of Introducing B2B Sales Strategies In Our Company Poor Ppt Model Smartart PDF
This pie chart depicts the factors resulting from poor sales and marketing alignment which leads to introduce B2B sales strategies within the organizations.Deliver and pitch your topic in the best possible manner with this need of introducing b2b sales strategies in our company poor ppt model smartart pdf. Use them to share invaluable insights on very costly, tough to measure roi, poor conversion ratio and impress your audience. This template can be altered and modified as per your expectations. So, grab it now.

Company Wide Aggregate Financials Of Grundfom Water Management Company Background PDF
This slide provides Company-Wide Aggregate Financials of Grundfom Water Management Company along with new turnover, financial result, revenue growth chart etc. Deliver an awe inspiring pitch with this creative Company Wide Aggregate Financials Of Grundfom Water Management Company Background PDF bundle. Topics like Fomfarms Revenues, Turnover Base, Including Fomfarm can be discussed with this completely editable template. It is available for immediate download depending on the needs and requirements of the user.

Company Daily Sales Performance Scorecard With Target Download PDF
This graph or chart is linked to excel, and changes automatically based on data. Just left click on it and select Edit Data. Deliver an awe inspiring pitch with this creative Company Daily Sales Performance Scorecard With Target Download PDF bundle. Topics like Sales Target can be discussed with this completely editable template. It is available for immediate download depending on the needs and requirements of the user.

Carbon Emissions Of Countries Bar Graph Professional PDF
This slide depicts emissions chart of various countries to avoid the worst impacts of climate change. It includes countries and carbon emissions in million metric tons. Pitch your topic with ease and precision using this Carbon Emissions Of Countries Bar Graph Professional PDF. This layout presents information on Maximum Production, Consumer Goods, Carbon Emissions. It is also available for immediate download and adjustment. So, changes can be made in the color, design, graphics or any other component to create a unique layout.
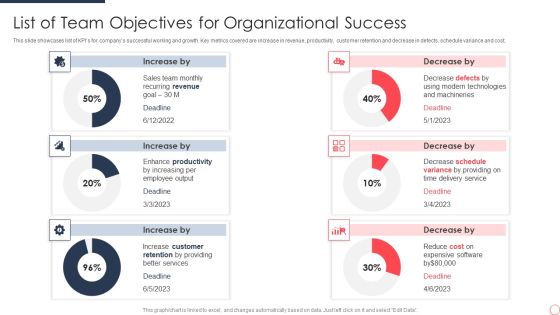
List Of Team Objectives For Organizational Success Ideas PDF
This slide showcases list of KPIs for companys successful working and growth. Key metrics covered are increase in revenue, productivity, customer retention and decrease in defects, schedule variance and cost. Showcasing this set of slides titled List Of Team Objectives For Organizational Success Ideas PDF. The topics addressed in these templates are Sales Team, Recurring Revenue, Goal. All the content presented in this PPT design is completely editable. Download it and make adjustments in color, background, font etc. as per your unique business setting.

Promotion Campaign Scorecard With Conversion Rate Ppt Inspiration Graphics PDF
This graph or chart is linked to excel, and changes automatically based on data. Just left click on it and select Edit Data. Deliver an awe inspiring pitch with this creative promotion campaign scorecard with conversion rate ppt inspiration graphics pdf bundle. Topics like ctr by campaign, conversions by campaign, impressions by date, conversion value vs target, spent by campaign can be discussed with this completely editable template. It is available for immediate download depending on the needs and requirements of the user.

Auto Sales Scorecard For Petrol Vs Diesel Vehicles Template PDF
This graph or chart is linked to excel, and changes automatically based on data. Just left click on it and select Edit Data. Deliver an awe inspiring pitch with this creative Auto Sales Scorecard For Petrol Vs Diesel Vehicles Template PDF bundle. Topics like Top Products Revenue, Petrol Vs Diesel, Vehicles Incremental Sales, Marketing Activities Product can be discussed with this completely editable template. It is available for immediate download depending on the needs and requirements of the user.

Smart Home Security Solutions Company Profile Security Company Sales Revenue By Market Themes PDF
This slide highlights the security company sales revenue by market share and commodity in pie chart format which includes Northeast, Southwest, Southeast, Midwest regions sales revenue. Deliver an awe inspiring pitch with this creative Smart Home Security Solutions Company Profile Security Company Sales Revenue By Market Themes PDF bundle. Topics like Sales Revenue Market, Sales Revenue Product, Wireless And Networking can be discussed with this completely editable template. It is available for immediate download depending on the needs and requirements of the user.
Focusing On Customer Satisfaction Icons PDF
The slide shows the pie chart presentation of key drivers of customer satisfaction including train punctuality, traffic information, safety, services, product prices etc. Additionally, it mentions the key measures to improve customer satisfaction. Deliver an awe inspiring pitch with this creative focusing on customer satisfaction icons pdf bundle. Topics like customers satisfaction, opportunity, innovation can be discussed with this completely editable template. It is available for immediate download depending on the needs and requirements of the user.
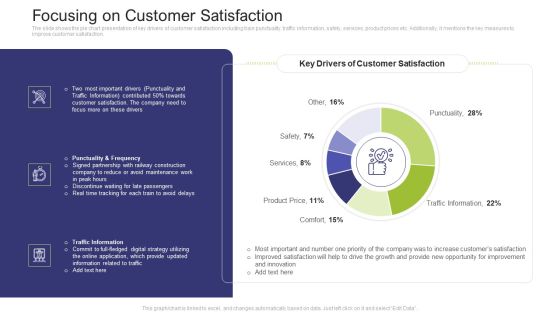
Focusing On Customer Satisfaction Formats PDF
The slide shows the pie chart presentation of key drivers of customer satisfaction including train punctuality, traffic information, safety, services, product prices etc. Additionally, it mentions the key measures to improve customer satisfaction.Deliver and pitch your topic in the best possible manner with this focusing on customer satisfaction formats pdf. Use them to share invaluable insights on product price, services, comfort, punctuality and impress your audience. This template can be altered and modified as per your expectations. So, grab it now.

Agricultural Business Company Profile Inventories By Segment 2016 And 2021 Sample PDF
This slide highlights the inventories for 2016 and 2021 through pie chart format. It includes retail products, potash, nitrogen, and phosphate.Deliver and pitch your topic in the best possible manner with this Agricultural Business Company Profile Inventories By Segment 2016 And 2021 Sample PDF Use them to share invaluable insights on Retail Products, Phosphate, Retail and impress your audience. This template can be altered and modified as per your expectations. So, grab it now.

Continual Improvement Procedure In Supply Chain Costs Associated With Logistics Operations Diagrams PDF
This slide shows the pie chart that represents the costs related with various logistics operations such as shipping costs of returns, inventory carrying, warehousing and other administrative costs.Deliver an awe inspiring pitch with this creative Continual Improvement Procedure In Supply Chain Costs Associated With Logistics Operations Diagrams PDF bundle. Topics like Damaged Products, Transportation, Inventory Holding can be discussed with this completely editable template. It is available for immediate download depending on the needs and requirements of the user.

Market Size Of API Management By Platform Ppt Outline Design Templates PDF
The following chart shows the Application Interface Management Market Analysis by deployment type , over a period of years. Deliver and pitch your topic in the best possible manner with this market size of api management by platform ppt outline design templates pdf. Use them to share invaluable insights on management market size, product, demand and impress your audience. This template can be altered and modified as per your expectations. So, grab it now.

Automobile Sales Scorecard Competitor Assessment Scorecard For Auto Sales Demonstration PDF
This graph or chart is linked to excel, and changes automatically based on data. Just left click on it and select Edit Data. Deliver an awe inspiring pitch with this creative Automobile Sales Scorecard Competitor Assessment Scorecard For Auto Sales Demonstration PDF bundle. Topics like Competitor Assessment Scorecard, Auto Sales Product can be discussed with this completely editable template. It is available for immediate download depending on the needs and requirements of the user.

Resource Administration Accounting Scorecard With Inventory Summary Designs PDF
This graph or chart is linked to excel, and changes automatically based on data. Just left click on it and select Edit Data. Deliver and pitch your topic in the best possible manner with this Resource Administration Accounting Scorecard With Inventory Summary Designs PDF. Use them to share invaluable insights on Product Details, Top Selling Item, Purchase Order and impress your audience. This template can be altered and modified as per your expectations. So, grab it now.
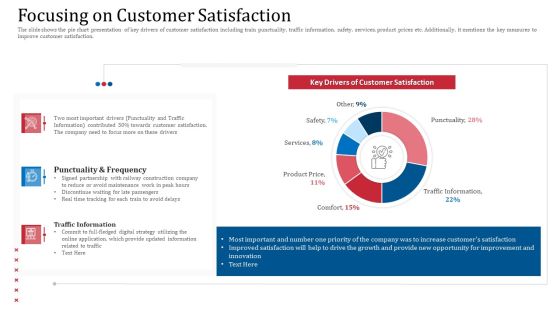
Focusing On Customer Satisfaction Background PDF
The slide shows the pie chart presentation of key drivers of customer satisfaction including train punctuality, traffic information, safety, services, product prices etc. Additionally, it mentions the key measures to improve customer satisfaction.Deliver and pitch your topic in the best possible manner with this focusing on customer satisfaction background pdf. Use them to share invaluable insights on punctuality and frequency, traffic information, updated information and impress your audience. This template can be altered and modified as per your expectations. So, grab it now.

Commercial Banking Template Collection Historical Share Price Performance Microsoft PDF
The slide provides the line chart of stock price of the company in last five years. It also states the reason for drastic decline or up of the stock price. Deliver and pitch your topic in the best possible manner with this commercial banking template collection historical share price performance microsoft pdf. Use them to share invaluable insights on historical share price performance and impress your audience. This template can be altered and modified as per your expectations. So, grab it now.
 Home
Home