Goal Chart
Incident And Issue Management Procedure Gantt Chart With Project Progress Bar Ppt Icon Influencers PDF
This slide provides the glimpse about the project progress bar graph in gantt chart form which covers the general release, open and closed beta and development. Deliver and pitch your topic in the best possible manner with this Incident And Issue Management Procedure Gantt Chart With Project Progress Bar Ppt Icon Influencers pdf. Use them to share invaluable insights on gantt chart with project progress bar and impress your audience. This template can be altered and modified as per your expectations. So, grab it now.
Project Deliverable Document Chart Ppt PowerPoint Presentation Ideas Design Inspiration PDF
Persuade your audience using this project deliverable document chart ppt powerpoint presentation ideas design inspiration pdf. This PPT design covers one stages, thus making it a great tool to use. It also caters to a variety of topics including project deliverable document chart. Download this PPT design now to present a convincing pitch that not only emphasizes the topic but also showcases your presentation skills.

Clients Existing Website Traffic Assessment SEO Audit Report Analysis Chart Of The Company Brochure PDF
The slide shows an SEO audit report analysis chart with details such as SEO factor, factor description, current factor status and action plan that needs to be implemented.Deliver an awe inspiring pitch with this creative Clients Existing Website Traffic Assessment SEO Audit Report Analysis Chart Of The Company Brochure PDF bundle. Topics like Current Status, Image Descriptions, Standard can be discussed with this completely editable template. It is available for immediate download depending on the needs and requirements of the user.
Business Diagram Pie Chart With Icons For Result Analysis Presentation Template
This business slide contains graphics of pie chart with business icons. Download this impressive diagram to present marketing performance measurement. This image slide is best to present your newer thoughts.
Scrum Staff Organization Map IT Scrum Organization Chart For Cross Functional Teams Themes PDF
This slide provides the glimpse about the cross functional teams scrum organization chart which focuses on different teams and front end, back end and quality analysts. Deliver and pitch your topic in the best possible manner with this scrum staff organization map it scrum organization chart for cross functional teams themes pdf. Use them to share invaluable insights on scrum organization chart for cross functional teams and impress your audience. This template can be altered and modified as per your expectations. So, grab it now.
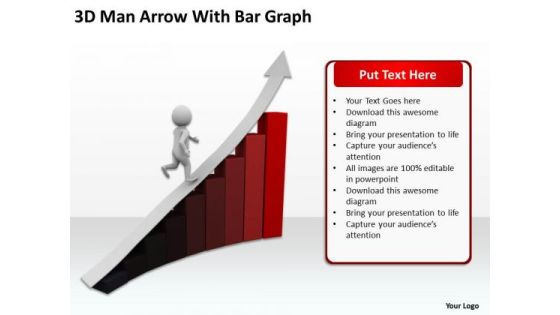
Business Organizational Chart Template 3d Man Arrow With Bar Graph PowerPoint Templates
We present our business organizational chart template 3d man arrow with bar graph PowerPoint templates.Present our Marketing PowerPoint Templates because It will mark the footprints of your journey. Illustrate how they will lead you to your desired destination. Present our Business PowerPoint Templates because Our PowerPoint Templates and Slides will let Your superior ideas hit the target always and everytime. Download and present our Sales PowerPoint Templates because Our PowerPoint Templates and Slides will provide weight to your words. They will bring out the depth of your thought process. Use our Arrows PowerPoint Templates because Our PowerPoint Templates and Slides will fulfill your every need. Use them and effectively satisfy the desires of your audience. Present our Success PowerPoint Templates because Our PowerPoint Templates and Slides will let you Illuminate the road ahead to Pinpoint the important landmarks along the way.Use these PowerPoint slides for presentations relating to 3d, Achievement, Arrow, Bars, Business, Businessman, Chart, Climbing, Column, Company, Concept, Corporate, Diagram, Economy, Effort, Finance, Firm, Goal, Graph, Green, Grow, Growth, Human, Illustration, Increase, Investment, Leader, Man, Manager, Market, Money, Person, Professional, Profit, Progress, Red, Render, Report, Rising, Sales, Stairs, Statistic, Step, Success, Suitcase, Tie, Up, Walking. The prominent colors used in the PowerPoint template are Red, Gray, Black. We assure you our business organizational chart template 3d man arrow with bar graph PowerPoint templates are visually appealing. Use our Businessman PowerPoint templates and PPT Slides are incredible easy to use. We assure you our business organizational chart template 3d man arrow with bar graph PowerPoint templates are designed by a team of presentation professionals. Professionals tell us our Column PowerPoint templates and PPT Slides will help them to explain complicated concepts. The feedback we get is that our business organizational chart template 3d man arrow with bar graph PowerPoint templates will make the presenter look like a pro even if they are not computer savvy. You can be sure our Businessman PowerPoint templates and PPT Slides are specially created by a professional team with vast experience. They diligently strive to come up with the right vehicle for your brilliant Ideas.
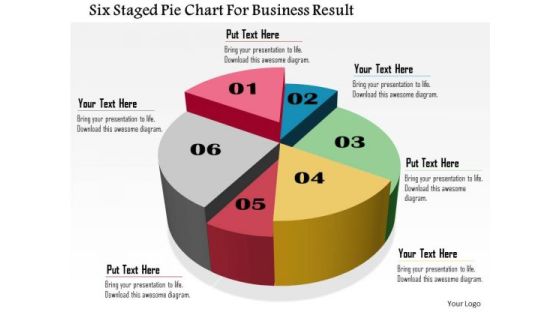
Business Daigram Six Staged Pie Chart For Business Result Presentation Templets
Six staged pie chart is used to design this business slide. Download this diagram to make business and financial reports. Use our above diagram to express information in a visual way.
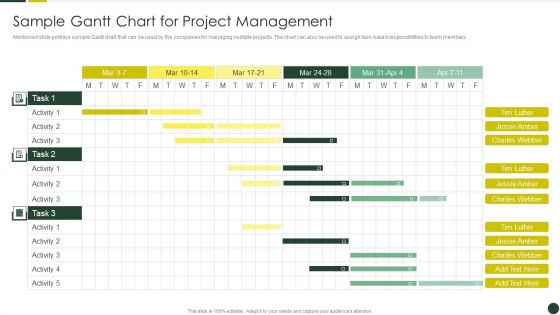
Quality Management Plan Templates Set 2 Sample Gantt Chart For Project Management Inspiration PDF
Mentioned slide portrays sample Gantt chart that can be used by the companies for managing multiple projects. The chart can also be used to assign task-based responsibilities to team members. Deliver an awe inspiring pitch with this creative Quality Management Plan Templates Set 2 Sample Gantt Chart For Project Management Inspiration PDF bundle. Topics like Quality Management, Quality Management, Baseline Performance can be discussed with this completely editable template. It is available for immediate download depending on the needs and requirements of the user.

Multi Feature Scrum Team Company Chart Ppt PowerPoint Presentation File Show PDF
This slide provides the glimpse about the multi feature scrum team organizational chart which focuses on product backlog, feature team and various component teams. Create an editable Multi Feature Scrum Team Company Chart Ppt PowerPoint Presentation File Show PDF that communicates your idea and engages your audience. Whether you are presenting a business or an educational presentation, pre designed presentation templates help save time. Multi Feature Scrum Team Company Chart Ppt PowerPoint Presentation File Show PDF is highly customizable and very easy to edit, covering many different styles from creative to business presentations. Slidegeeks has creative team members who have crafted amazing templates. So, go and get them without any delay.
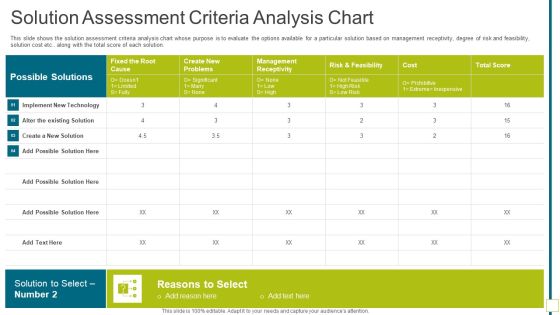
Solution Assessment Criteria Analysis Chart Solution Evaluation Validation Meet Organizational Needs Diagrams PDF
This slide shows the solution assessment criteria analysis chart whose purpose is to evaluate the options available for a particular solution based on management receptivity, degree of risk and feasibility, solution cost etc.. along with the total score of each solution. Deliver and pitch your topic in the best possible manner with this solution assessment criteria analysis chart solution evaluation validation meet organizational needs diagrams pdf. Use them to share invaluable insights on solution assessment criteria analysis chart and impress your audience. This template can be altered and modified as per your expectations. So, grab it now.

Health And Wellbeing Playbook Employee Mental Wellbeing Evaluation Tally Chart Guidelines PDF
This slide showcases tally chart that can be used by team leaders to evaluate their employees mental wellbeing status. Here evaluation will be based on the number of times an employee get distracted.Deliver an awe inspiring pitch with this creative health and wellbeing playbook employee mental wellbeing evaluation tally chart guidelines pdf bundle. Topics like employee mental wellbeing evaluation tally chart can be discussed with this completely editable template. It is available for immediate download depending on the needs and requirements of the user.
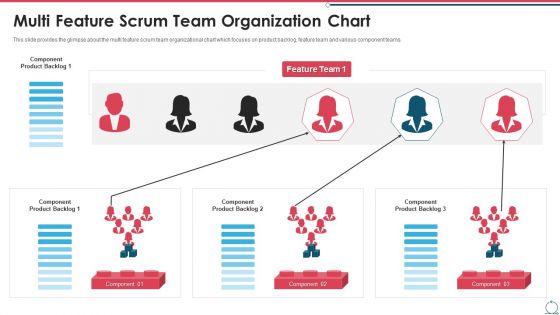
Building An Agile Development Scrum Team Multi Feature Scrum Team Organization Chart Summary PDF
This slide provides the glimpse about the multi feature scrum team organizational chart which focuses on product backlog, feature team and various component teams. This is a building an agile development scrum team multi feature scrum team organization chart summary pdf template with various stages. Focus and dispense information on three stages using this creative set, that comes with editable features. It contains large content boxes to add your information on topics like multi feature scrum team organization chart. You can also showcase facts, figures, and other relevant content using this PPT layout. Grab it now.
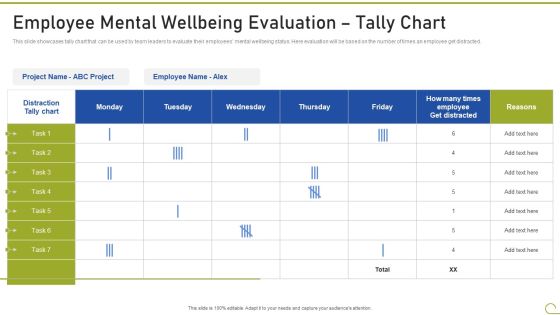
Health And Fitness Playbook Employee Mental Wellbeing Evaluation Tally Chart Designs PDF
This slide showcases tally chart that can be used by team leaders to evaluate their employees mental wellbeing status. Here evaluation will be based on the number of times an employee get distracted. Deliver an awe inspiring pitch with this creative health and fitness playbook employee mental wellbeing evaluation tally chart designs pdf bundle. Topics like employee, mental wellbeing evaluation, tally chart can be discussed with this completely editable template. It is available for immediate download depending on the needs and requirements of the user.

Pie Chart To Survey Business Outcomes Ppt Powerpoint Presentation Infographic Template Gridlines
This is a pie chart to survey business outcomes ppt powerpoint presentation infographic template gridlines. This is a seven stage process. The stages in this process are business outcomes, business results, business output.
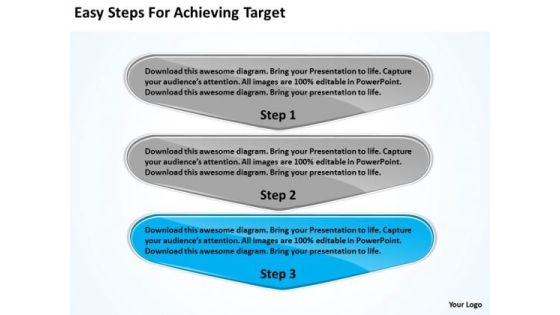
Easy Steps For Achieving Target Po Process Flow Chart PowerPoint Slides
We present our easy steps for achieving target po process flow chart PowerPoint Slides.Download our Leadership PowerPoint Templates because you watch them slowly start to savour the flavour you have served them. Download and present our Business PowerPoint Templates because you can Lead your flock steadily to greater heights. Look around at the vast potential of achievement around you. Present our Shapes PowerPoint Templates because your quicksilver ideas are the arrows in your quiver. Present our Marketing PowerPoint Templates because customer satisfaction is a mantra of the marketplace. Building a loyal client base is an essential element of your business. Download our Arrows PowerPoint Templates because our templates emphasises your views.Use these PowerPoint slides for presentations relating to Abstract, Arrow, Arrows, Business, Chart, Design, Development, Diagram, Direction, Element, Flow, Flowchart, Graph, Linear, Management, Model, Motion, Organization, Plan, Process, Program, Section, Segment, Set, Sign, Solution, Strategy, Symbol, Technology. The prominent colors used in the PowerPoint template are Blue, Gray, White. Use our easy steps for achieving target po process flow chart PowerPoint Slides help you meet deadlines which are an element of today's workplace. Just browse and pick the slides that appeal to your intuitive senses. Presenters tell us our Arrows PowerPoint templates and PPT Slides are Fun. Presenters tell us our easy steps for achieving target po process flow chart PowerPoint Slides are Spiffy. You can be sure our Chart PowerPoint templates and PPT Slides provide you with a vast range of viable options. Select the appropriate ones and just fill in your text. PowerPoint presentation experts tell us our easy steps for achieving target po process flow chart PowerPoint Slides are Glamorous. Professionals tell us our Chart PowerPoint templates and PPT Slides are Romantic.
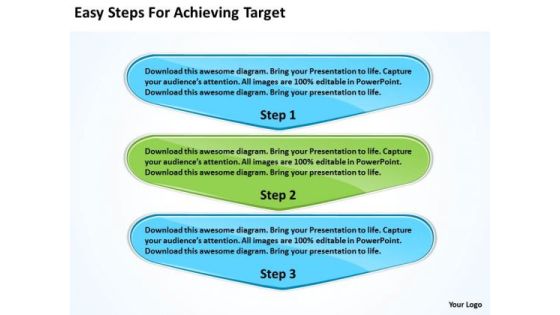
Easy Steps For Achieving Target Business Process Flow Chart Examples PowerPoint Slides
We present our easy steps for achieving target business process flow chart examples PowerPoint Slides.Use our Arrows PowerPoint Templates because this slide illustrates your thoughts and experiences to your staff. Download our Business PowerPoint Templates because the majestic tiger lord of all it surveys.It exudes power even when it is in repose. Use our Shapes PowerPoint Templates because you have the people in place, selected the team leaders and all are raring to go. Present our Leadership PowerPoint Templates because honesty is the best policy has an ardent follower in you. Present our Marketing PowerPoint Templates because networking is an imperative in todays world. You need to access the views of others. Similarly you need to give access to them of your abilities.Use these PowerPoint slides for presentations relating to Abstract, Arrow, Arrows, Business, Chart, Design, Development, Diagram, Direction, Element, Flow, Flowchart, Graph, Linear, Management, Model, Motion, Organization, Plan, Process, Program, Section, Segment, Set, Sign, Solution, Strategy, Symbol, Technology. The prominent colors used in the PowerPoint template are Blue, Green, White. Customers tell us our easy steps for achieving target business process flow chart examples PowerPoint Slides provide you with a vast range of viable options. Select the appropriate ones and just fill in your text. The feedback we get is that our Chart PowerPoint templates and PPT Slides are Colorful. Professionals tell us our easy steps for achieving target business process flow chart examples PowerPoint Slides are Graceful. People tell us our Chart PowerPoint templates and PPT Slides are Energetic. Customers tell us our easy steps for achieving target business process flow chart examples PowerPoint Slides are Sparkling. Professionals tell us our Design PowerPoint templates and PPT Slides are incredible easy to use.

Business Process Flow Diagrams Network Chart PowerPoint Templates Ppt Backgrounds For Slides
We present our business process flow diagrams network chart PowerPoint templates PPT backgrounds for slides.Download and present our Hexagon PowerPoint Templates because you should once Tap the ingenuity of our PowerPoint Templates and Slides. They are programmed to succeed. Use our Business PowerPoint Templates because It can be used to Set your controls for the heart of the sun. Our PowerPoint Templates and Slides will be the propellant to get you there. Download and present our Shapes PowerPoint Templates because Our PowerPoint Templates and Slides will steer your racing mind. Hit the right buttons and spur on your audience. Present our Process and Flows PowerPoint Templates because Your success is our commitment. Our PowerPoint Templates and Slides will ensure you reach your goal. Present our Marketing PowerPoint Templates because Our PowerPoint Templates and Slides will provide the perfect balance. Your weighty ideas will get the ideal impetus.Use these PowerPoint slides for presentations relating to 3d, Abstract, Around, Arrow, Arrow Circles, Chart, Circle, Circular, Circular Arrows, Circular Flow, Circulation, Color, Cycle, Cyclic, Direction, Element, Flow, Glossy, Hexagon, Icon, Illustration, Isolated, Loop, Motion, Movement, Pentagon, Refresh, Ring, Rotation, Round, Section, Set, Shape, Sign, Square, Symbol, Triangle, Vector, Vibrant. The prominent colors used in the PowerPoint template are Red, Blue, Green.
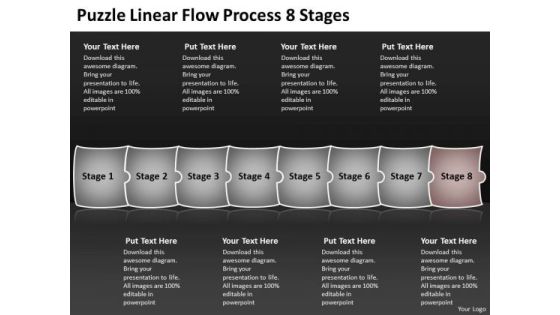
Puzzle Linear Flow Process 8 Stages Ppt Chart Program PowerPoint Slides
We present our puzzle linear flow process 8 stages ppt chart program PowerPoint Slides.Use our Business PowerPoint Templates because,This template helps to pierce through the doubts of your audience. Use our Puzzles or Jigsaws PowerPoint Templates because,You can Trigger audience minds with your interesting ideas. Use our Communication PowerPoint Templates because,You can Start with the fundamental basic activities and slowly but surely hone them down to the top of the pyramid, the ultimate goal. Use our Shapes PowerPoint Templates because,We all know that alphabetical order is a time honoured concept. Use our Success PowerPoint Templates because,IT outlines the entire thought process for the benefit of others. Tell it to the world with your characteristic aplombUse these PowerPoint slides for presentations relating to abstract, action, attach, box, business, center, chain, chart, communication, concept, connection, cube, cycle, data, diagram, flow, horizontal, illustration, individual, interaction, jigsaw, join, link, merge, puzzle, relation, relationship, search, shape, silhouette, success. The prominent colors used in the PowerPoint template are Brown, White, Gray
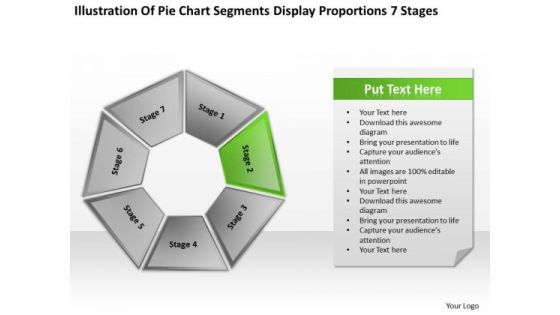
Chart Segments Display Proportions 7 Stages Business Development Plans PowerPoint Templates
We present our chart segments display proportions 7 stages business development plans PowerPoint templates.Use our Business PowerPoint Templates because It will get your audience in sync. Use our Leadership PowerPoint Templates because Our PowerPoint Templates and Slides are a sure bet. Gauranteed to win against all odds. Download our Shapes PowerPoint Templates because Our PowerPoint Templates and Slides help you meet the demand of the Market. Just browse and pick the slides that appeal to your intuitive senses. Download and present our Targets PowerPoint Templates because you should Whip up a frenzy with our PowerPoint Templates and Slides. They will fuel the excitement of your team. Present our Process and Flows PowerPoint Templates because Our PowerPoint Templates and Slides will generate and maintain the level of interest you desire. They will create the impression you want to imprint on your audience.Use these PowerPoint slides for presentations relating to Abstract, analysis, banner, blank, boxes, brochure, business, button, catalog, chart, circular, combination, combine, communication, company, competition, components, concept, diagram, different, display, finance, goal, illustration, information, link, marketing, mission, navigation, petals, pictogram, pie, plan, presentation, process, report, round, segment, strategy, tab, target, template, text, website. The prominent colors used in the PowerPoint template are Green, Gray, White.

7 Stages Parallel Arrow Process Sequence Chart Business Plan Outline Template PowerPoint Templates
We present our 7 stages parallel arrow process sequence chart business plan outline template PowerPoint templates.Present our Arrows PowerPoint Templates because Our PowerPoint Templates and Slides are Clear and concise. Use them and dispel any doubts your team may have. Download and present our Signs PowerPoint Templates because Our PowerPoint Templates and Slides will let Your superior ideas hit the target always and everytime. Download and present our Shapes PowerPoint Templates because You can Raise a toast with our PowerPoint Templates and Slides. Spread good cheer amongst your audience. Download and present our Metaphors-Visual Concepts PowerPoint Templates because It will mark the footprints of your journey. Illustrate how they will lead you to your desired destination. Download our Business PowerPoint Templates because Our PowerPoint Templates and Slides are aesthetically designed to attract attention. We gaurantee that they will grab all the eyeballs you need.Use these PowerPoint slides for presentations relating to action, analysis, arrow, business, chart, colorful, company, concept, conceptual, corporate, design, diagram, editable, flowchart, goal, growth, guidelines, idea, illustration, manage, management, mission, model, motivation, opportunity, organization, performance, plan, process, profit, progress, project, representation, resource, risk, solution, strategy, strength, success, swot, team, theoretical, theory, threat, tool, vector, vision, weakness. The prominent colors used in the PowerPoint template are Yellow, Orange, Green. We assure you our 7 stages parallel arrow process sequence chart business plan outline template PowerPoint templates will make you look like a winner. People tell us our arrow PowerPoint templates and PPT Slides are designed by a team of presentation professionals. Customers tell us our 7 stages parallel arrow process sequence chart business plan outline template PowerPoint templates will make the presenter look like a pro even if they are not computer savvy. Presenters tell us our company PowerPoint templates and PPT Slides will make the presenter look like a pro even if they are not computer savvy. People tell us our 7 stages parallel arrow process sequence chart business plan outline template PowerPoint templates effectively help you save your valuable time. We assure you our colorful PowerPoint templates and PPT Slides help you meet deadlines which are an element of today's workplace. Just browse and pick the slides that appeal to your intuitive senses.

3d Chronological Puzzle Process 8 Stages Ppt Make Flow Chart PowerPoint Templates
We present our 3d chronological puzzle process 8 stages ppt make flow chart PowerPoint templates. Use our Advertising PowerPoint Templates because, the lessons have been analyzed, studied and conclusions drawn. Use our Business PowerPoint Templates because; Use our template to illustrate what you say. Use our Puzzles or Jigsaws PowerPoint Templates because, the color coding of our templates are specifically designed to highlight you points. Use our Shapes PowerPoint Templates because, Start with the fundamental basic activities and slowly but surely hone them down to the top of the pyramid, the ultimate goal. Use our Process and Flows PowerPoint Templates because, Now you have to coordinate and motivate your team. Use these PowerPoint slides for presentations relating to Abstract, action, attach, box, business, center, chain, chart, communication, concept, connection, cube, cycle, data, diagram, flow, globe, horizontal, idea, illustration, individual, information, interaction, jigsaw, join, link, merge, missing, opportunity, part, people, piece, pieces, process, puzzle, relation, relationship, search, shape, silhouette, success. The prominent colors used in the PowerPoint template are Green, White, and Gray
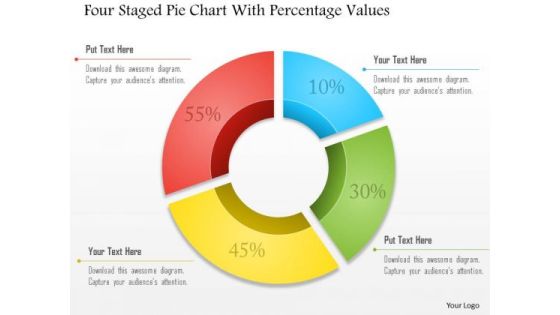
Business Diagram Four Staged Pie Chart With Percentage Values Presentation Template
Four staged pie chart and percentage values are used to design this business slide. Download this diagram to make business and financial reports. Use our above diagram to express information in a visual way.
Percentage Value Comparison Pie Chart Icon Ppt PowerPoint Presentation Model Clipart Images
This is a percentage value comparison pie chart icon ppt powerpoint presentation model clipart images. This is a three stage process. The stages in this process are percentage icon, dividend icon, portion icon.

3D Bar Chart For Percentage Values Comparison Ppt PowerPoint Presentation Professional Visual Aids
This is a 3d bar chart for percentage values comparison ppt powerpoint presentation professional visual aids. This is a five stage process. The stages in this process are art, colouring, paint brush.

Column Chart Employee Value Proposition Ppt PowerPoint Presentation Slides Graphics Design
This is a column chart employee value proposition ppt powerpoint presentation slides graphics design. This is a two stage process. The stages in this process are business, management, strategy, analysis, marketing.
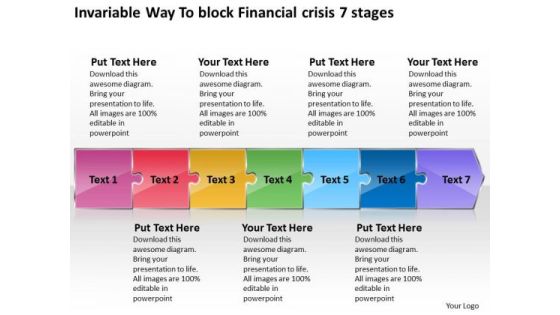
Invariable Way To Block Financial Crisis 7 Stages Flow Chart Production PowerPoint Templates
We present our invariable way to block financial crisis 7 stages flow chart production PowerPoint templates.Use our Business PowerPoint Templates because,You are sure you have the right people for your plans. Use our Arrows PowerPoint Templates because,Presenting your views using our innovative slides, will be assured of leaving a lasting impression. Use our Shapes PowerPoint Templates because,This one depicts the popular chart. Use our Finance PowerPoint Templates because,There are various viable propositions available to further your commercial interests. Use our Process and Flows PowerPoint Templates because, It shows them how to persistently hit bullseye.Use these PowerPoint slides for presentations relating to arrow, background, business, chart, diagram, financial, graphic, gray, icon, illustration, management, orange, perspective, planning, process, stages, steps, text. The prominent colors used in the PowerPoint template are Pink , Red, Yellow. People tell us our invariable way to block financial crisis 7 stages flow chart production PowerPoint templates are Excellent. The feedback we get is that our graphic PowerPoint templates and PPT Slides are aesthetically designed to attract attention. We guarantee that they will grab all the eyeballs you need. People tell us our invariable way to block financial crisis 7 stages flow chart production PowerPoint templates are Vintage. Presenters tell us our financial PowerPoint templates and PPT Slides are Spiffy. The feedback we get is that our invariable way to block financial crisis 7 stages flow chart production PowerPoint templates are Appealing. Professionals tell us our graphic PowerPoint templates and PPT Slides are Fun.
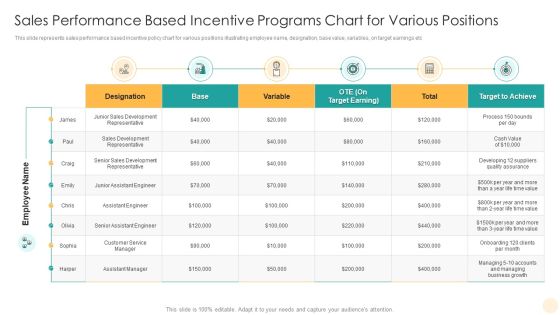
Sales Performance Based Incentive Programs Chart For Various Positions Rules PDF
This slide represents sales performance based incentive policy chart for various positions illustrating employee name, designation, base value, variables, on target earnings etc. Showcasing this set of slides titled Sales Performance Based Incentive Programs Chart For Various Positions Rules PDF. The topics addressed in these templates are Sales Development Representative, Target To Achieve, Target Earning. All the content presented in this PPT design is completely editable. Download it and make adjustments in color, background, font etc. as per your unique business setting.
Dollar Market Value Trend Chart Vector Icon Ppt Styles Templates PDF
Persuade your audience using this dollar market value trend chart vector icon ppt styles templates pdf. This PPT design covers three stages, thus making it a great tool to use. It also caters to a variety of topics including dollar market value trend chart vector icon. Download this PPT design now to present a convincing pitch that not only emphasizes the topic but also showcases your presentation skills.
Product Features Comparison Chart With Icons Ppt Powerpoint Presentation Portfolio Diagrams
This is a product features comparison chart with icons ppt powerpoint presentation portfolio diagrams. This is a four stage process. The stages in this process are product differentiation, product comparison, brand differentiation.

Concentric Sphere Chart Infographics For Determining Business Value Ppt Professional Template PDF
Persuade your audience using this concentric sphere chart infographics for determining business value ppt professional template pdf. This PPT design covers four stages, thus making it a great tool to use. It also caters to a variety of topics including concentric sphere chart infographics for determining business value. Download this PPT design now to present a convincing pitch that not only emphasizes the topic but also showcases your presentation skills.
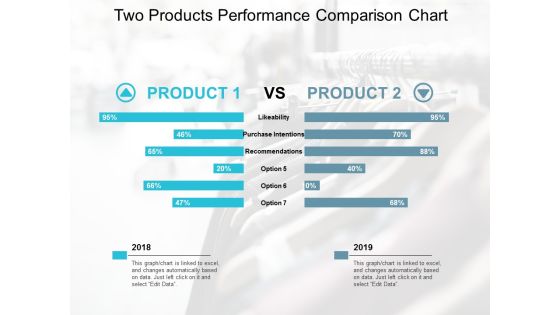
Two Products Performance Comparison Chart Ppt Powerpoint Presentation Outline Design Inspiration
This is a two products performance comparison chart ppt powerpoint presentation outline design inspiration. The topics discussed in this diagram are product differentiation, product comparison, brand differentiation. This is a completely editable PowerPoint presentation, and is available for immediate download.

Monthly Task Management Gantt Chart Ppt Powerpoint Presentation Outline Example File
This is a monthly task management gantt chart ppt powerpoint presentation outline example file. This is a three stage process. The stages in this process are new product development, new product launch, introducing new product.
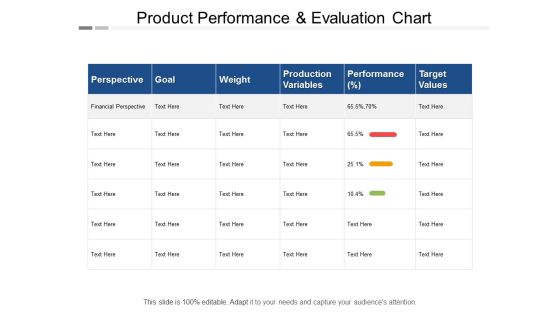
Product Performance And Evaluation Chart Ppt PowerPoint Presentation Pictures Slide Download
This is a product performance and evaluation chart ppt powerpoint presentation pictures slide download. This is a sex stage process. The stages in this process are production management, production performance, production improvement.

Two Products Features And Performance Comparison Chart Ppt Powerpoint Presentation Ideas Layout Ideas
This is a two products features and performance comparison chart ppt powerpoint presentation ideas layout ideas. This is a two stage process. The stages in this process are product differentiation, product comparison, brand differentiation.
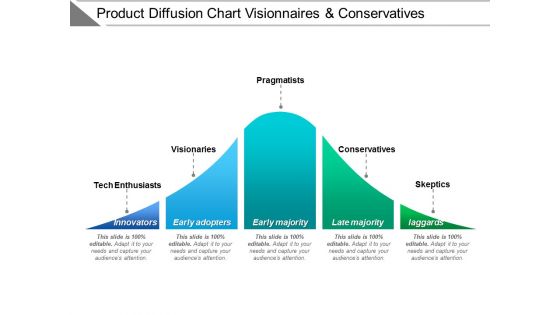
Product Diffusion Chart Visionaries And Conservatives Ppt PowerPoint Presentation Model Clipart
This is a product diffusion chart visionaries and conservatives ppt powerpoint presentation model clipart. This is a five stage process. The stages in this process are adoption curve, crossing the chasm, hype cycle.
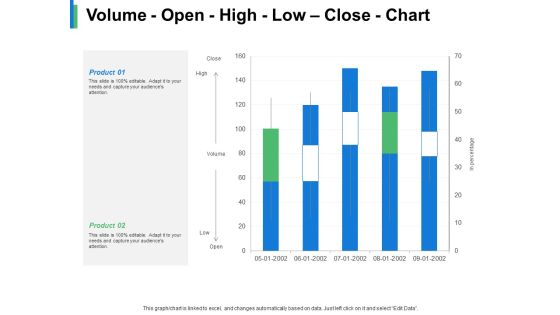
Volume Open High Low Close Chart Product Ppt PowerPoint Presentation Gallery Example
This is a volume open high low close chart product ppt powerpoint presentation gallery example. This is a two stage process. The stages in this process are business, management, strategy, marketing, sales.

Product Backlog Process Flow Chart Ppt PowerPoint Presentation Model Design Templates
This is a product backlog process flow chart ppt powerpoint presentation model design templates. This is a two stage process. The stages in this process are backlog, uncompleted work, pending work.

Return On Capital Employed Product Performance Chart Ppt PowerPoint Presentation Portfolio Visuals
This is a return on capital employed product performance chart ppt powerpoint presentation portfolio visuals. This is a three stage process. The stages in this process are accounting ratio, roce, return on capital employed.
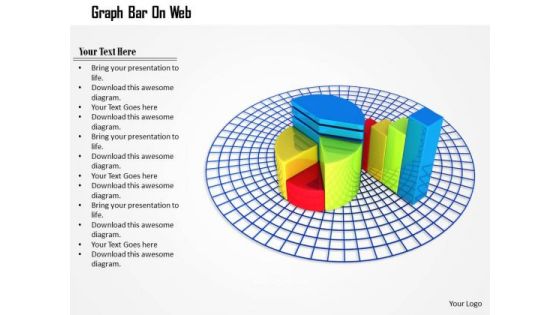
Stock Photo Pie Chart And Bar Graph On Web PowerPoint Slide
This image is designed with pie chart and bar graph on web. Use this diagram to explain your strategy to co-ordinate activities. Deliver amazing presentations to mesmerize your audience.

Building Innovation Capabilities And USP Detection Product Capability Assessment Gantt Chart Ppt Summary Gridlines PDF
The Schedule of the Product Capability assessment process can be shown through this Gantt chart provided in the slide. Deliver and pitch your topic in the best possible manner with this building innovation capabilities and usp detection product capability assessment gantt chart ppt summary gridlines pdf. Use them to share invaluable insights on competency identification, competency ranking, maturity assessment, map competencies, developing competencies, review and impress your audience. This template can be altered and modified as per your expectations. So, grab it now.
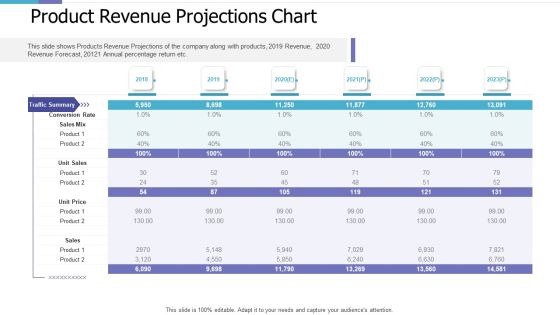
Product Revenue Projections Chart Investor Pitch Deck For PE Funding Brochure PDF
This slide shows Products Revenue Projections of the company along with products, 2019 Revenue, 2020 Revenue Forecast, 20121 Annual percentage return etc. Deliver an awe inspiring pitch with this creative product revenue projections chart investor pitch deck for pe funding brochure pdf bundle. Topics like product revenue projections chart can be discussed with this completely editable template. It is available for immediate download depending on the needs and requirements of the user.

Capability Icon With Chart And Productivity Management Ppt PowerPoint Presentation Gallery Templates PDF
Persuade your audience using this capability icon with chart and productivity management ppt powerpoint presentation gallery templates pdf. This PPT design covers three stages, thus making it a great tool to use. It also caters to a variety of topics including capability icon with chart and productivity management. Download this PPT design now to present a convincing pitch that not only emphasizes the topic but also showcases your presentation skills.

Competitive Analysis Template 8 Matrix Chart Ppt PowerPoint Presentation Designs Download
This is a competitive analysis template 8 matrix chart ppt powerpoint presentation designs download. This is a six stage process. The stages in this process are product quality, product fidelity, after sales service, customer service, price, shipping speed.

Competitive Analysis Template 8 Matrix Chart Ppt PowerPoint Presentation Show Outfit
This is a competitive analysis template 8 matrix chart ppt powerpoint presentation show outfit. This is a six stage process. The stages in this process are product quality, product fidelity, after sales service, customer service, price, shipping speed.

Bar Chart With Magnifying Glass For Product Performance Analysis Ppt PowerPoint Presentation Gallery Example File PDF
Presenting bar chart with magnifying glass for product performance analysis ppt powerpoint presentation gallery example file pdf to dispense important information. This template comprises three stages. It also presents valuable insights into the topics including bar chart with magnifying glass for product performance analysis. This is a completely customizable PowerPoint theme that can be put to use immediately. So, download it and address the topic impactfully.

Product Demand Grid Chart With Increase In Sales Volume Ppt Slides Tips PDF
Persuade your audience using this product demand grid chart with increase in sales volume ppt slides tips pdf. This PPT design covers four stages, thus making it a great tool to use. It also caters to a variety of topics including product demand grid chart with increase in sales volume. Download this PPT design now to present a convincing pitch that not only emphasizes the topic but also showcases your presentation skills.
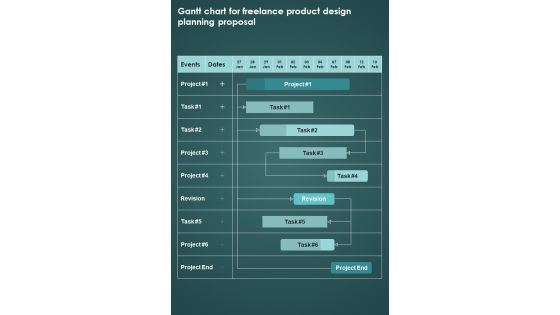
Gantt Chart For Freelance Product Design Planning Proposal One Pager Sample Example Document
Presenting you an exemplary Gantt Chart For Freelance Product Design Planning Proposal One Pager Sample Example Document. Our one pager comprises all the must have essentials of an inclusive document. You can edit it with ease, as its layout is completely editable. With such freedom, you can tweak its design and other elements to your requirements. Download this Gantt Chart For Freelance Product Design Planning Proposal One Pager Sample Example Document brilliant piece now.
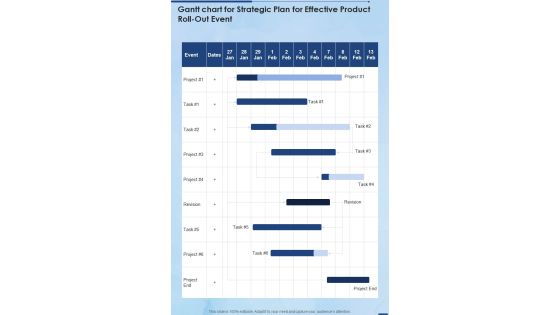
Gantt Chart For Strategic Plan For Effective Product Roll Out Event One Pager Sample Example Document
Presenting you an exemplary Gantt Chart For Strategic Plan For Effective Product Roll Out Event One Pager Sample Example Document. Our one-pager comprises all the must-have essentials of an inclusive document. You can edit it with ease, as its layout is completely editable. With such freedom, you can tweak its design and other elements to your requirements. Download this Gantt Chart For Strategic Plan For Effective Product Roll Out Event One Pager Sample Example Document brilliant piece now.
Downfall Chart For Productivity Loss Vector Icon Ppt PowerPoint Presentation File Clipart PDF
Persuade your audience using this downfall chart for productivity loss vector icon ppt powerpoint presentation file clipart pdf. This PPT design covers three stages, thus making it a great tool to use. It also caters to a variety of topics including downfall chart for productivity loss vector icon. Download this PPT design now to present a convincing pitch that not only emphasizes the topic but also showcases your presentation skills.
People Development Icon With Productivity Chart Ppt PowerPoint Presentation File Sample PDF
Persuade your audience using this people development icon with productivity chart ppt powerpoint presentation file sample pdf. This PPT design covers four stages, thus making it a great tool to use. It also caters to a variety of topics including people development icon with productivity chart. Download this PPT design now to present a convincing pitch that not only emphasizes the topic but also showcases your presentation skills.
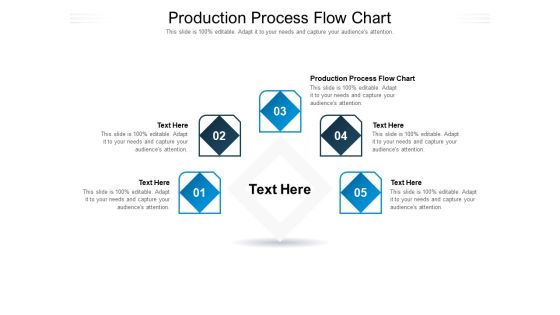
Production Process Flow Chart Ppt PowerPoint Presentation File Tips Cpb Pdf
Presenting this set of slides with name production process flow chart ppt powerpoint presentation file tips cpb pdf. This is an editable Powerpoint five stages graphic that deals with topics like production process flow chart to help convey your message better graphically. This product is a premium product available for immediate download and is 100 percent editable in Powerpoint. Download this now and use it in your presentations to impress your audience.
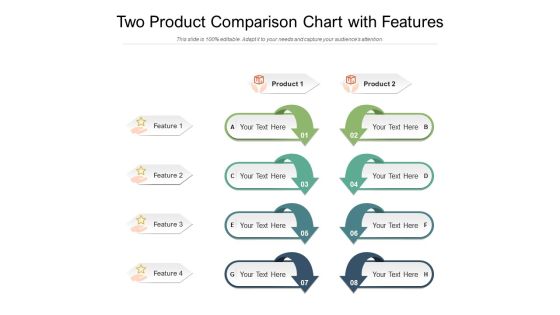
Two Product Comparison Chart With Features Ppt PowerPoint Presentation File Formats PDF
Persuade your audience using this two product comparison chart with features ppt powerpoint presentation file formats pdf. This PPT design covers two stages, thus making it a great tool to use. It also caters to a variety of topics including two product comparison chart with features. Download this PPT design now to present a convincing pitch that not only emphasizes the topic but also showcases your presentation skills.
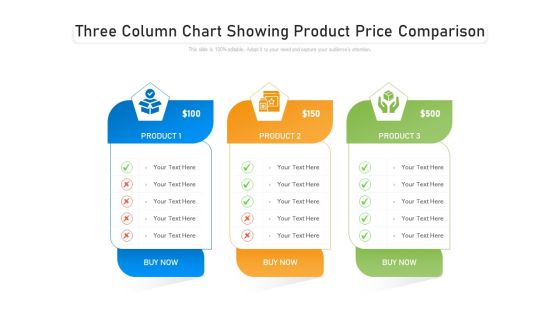
Three Column Chart Showing Product Price Comparison Ppt PowerPoint Presentation Ideas Deck PDF
Persuade your audience using this three column chart showing product price comparison ppt powerpoint presentation ideas deck pdf. This PPT design covers three stages, thus making it a great tool to use. It also caters to a variety of topics including three column chart showing product price comparison. Download this PPT design now to present a convincing pitch that not only emphasizes the topic but also showcases your presentation skills.

Three Column Chart With Product Feature Comparison Ppt PowerPoint Presentation Gallery Layouts PDF
Persuade your audience using this three column chart with product feature comparison ppt powerpoint presentation gallery layouts pdf. This PPT design covers three stages, thus making it a great tool to use. It also caters to a variety of topics including three column chart with product feature comparison. Download this PPT design now to present a convincing pitch that not only emphasizes the topic but also showcases your presentation skills.

Split Circular Chart Showing Product Sales Performance Ppt PowerPoint Presentation Professional Microsoft PDF
Persuade your audience using this split circular chart showing product sales performance ppt powerpoint presentation professional microsoft pdf. This PPT design covers five stages, thus making it a great tool to use. It also caters to a variety of topics including split circular chart showing product sales performance. Download this PPT design now to present a convincing pitch that not only emphasizes the topic but also showcases your presentation skills.
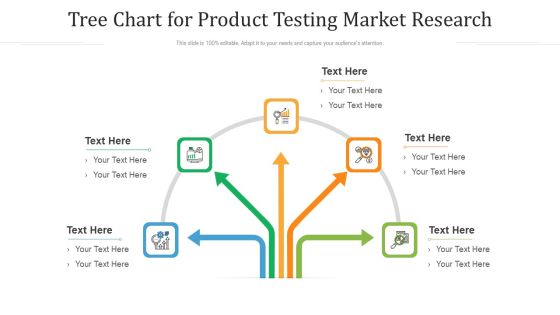
Tree Chart For Product Testing Market Research Ppt PowerPoint Presentation File Background Image PDF
Persuade your audience using this tree chart for product testing market research ppt powerpoint presentation file background image pdf. This PPT design covers five stages, thus making it a great tool to use. It also caters to a variety of topics including tree chart for product testing market research. Download this PPT design now to present a convincing pitch that not only emphasizes the topic but also showcases your presentation skills.

Gantt Chart For Product Inauguration Occasion One Pager Sample Example Document
Presenting you an exemplary Gantt Chart For Product Inauguration Occasion One Pager Sample Example Document. Our one-pager comprises all the must-have essentials of an inclusive document. You can edit it with ease, as its layout is completely editable. With such freedom, you can tweak its design and other elements to your requirements. Download this Gantt Chart For Product Inauguration Occasion One Pager Sample Example Document brilliant piece now.
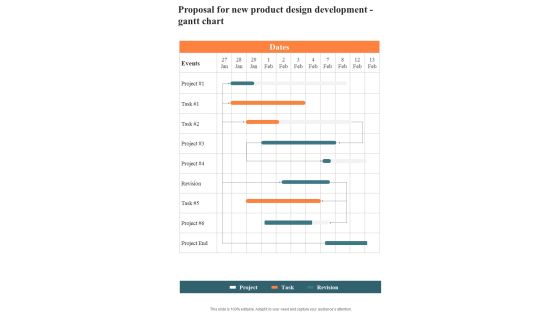
Proposal For New Product Design Development Gantt Chart One Pager Sample Example Document
Presenting you an exemplary Proposal For New Product Design Development Gantt Chart One Pager Sample Example Document. Our one-pager comprises all the must-have essentials of an inclusive document. You can edit it with ease, as its layout is completely editable. With such freedom, you can tweak its design and other elements to your requirements. Download this Proposal For New Product Design Development Gantt Chart One Pager Sample Example Document brilliant piece now.

New Product Development Proposal Gantt Chart One Pager Sample Example Document
Presenting you an exemplary New Product Development Proposal Gantt Chart One Pager Sample Example Document. Our one-pager comprises all the must-have essentials of an inclusive document. You can edit it with ease, as its layout is completely editable. With such freedom, you can tweak its design and other elements to your requirements. Download this New Product Development Proposal Gantt Chart One Pager Sample Example Document brilliant piece now.
Business Intelligence Strategy 3d People Sitting Around Pie Chart Basic Concepts
Deliver The Right Dose With Our Business Intelligence Strategy 3d People Sitting Around Pie Chart Basic Concepts Powerpoint Templates. Your Ideas Will Get The Correct Illumination. Your Abilities Have Been Lying Dormant. Awaken Them With Our Business Powerpoint Templates.

 Home
Home