Goal Chart
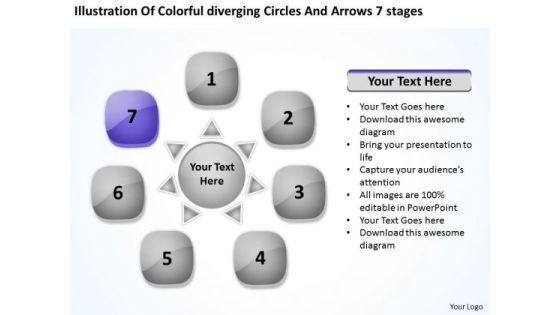
Colorful Diverging Circles And Arrows 7 Stages Circular Layout Chart PowerPoint Templates
We present our colorful diverging circles and arrows 7 stages Circular Layout Chart PowerPoint templates.Download our Process and flows PowerPoint Templates because it unravels each one for your audience while setting key timelines as you go along. Use our Business PowerPoint Templates because you are ready to flap your wings and launch off. All poised are you to touch the sky with glory. Download our Marketing PowerPoint Templates because customer satisfaction is a mantra of the marketplace. Building a loyal client base is an essential element of your business. Use our Flow charts PowerPoint Templates because the structure of our templates allows you to effectively highlight the key issues concerning the growth of your business. Use our Shapes PowerPoint Templates because you should Emphasise the process of your business or corporate growth.Use these PowerPoint slides for presentations relating to Business, button, catalog, chart, circle, company, data, design, diagram, direction, document, financial, glossy, goals, graph, junction, management, market, marketing, model, multicolored, multiple, navigation, network, options, plan, presentation, process, results, shiny, sphere, statistics. The prominent colors used in the PowerPoint template are Yellow, Gray, Black. People tell us our colorful diverging circles and arrows 7 stages Circular Layout Chart PowerPoint templates are Stylish. We assure you our chart PowerPoint templates and PPT Slides are Whimsical. PowerPoint presentation experts tell us our colorful diverging circles and arrows 7 stages Circular Layout Chart PowerPoint templates are Wonderful. You can be sure our chart PowerPoint templates and PPT Slides are Bright. Professionals tell us our colorful diverging circles and arrows 7 stages Circular Layout Chart PowerPoint templates are Majestic. Use our diagram PowerPoint templates and PPT Slides are Liberated.

Ppt Yellow Men Standing On Business PowerPoint Presentation Pie Chart Templates
PPT yellow men standing on business powerpoint presentation pie chart Templates-Use this Circular Arrow diagram to show activities that are related to the business plan metrics and monitor the results to determine if the business plan is proceeding as planned.-PPT yellow men standing on business powerpoint presentation pie chart Templates-3d, arrow, background, blue, chart, circle, circular, clipart, colorful, connection, continuity, cycle, cyclic, diagram, direction, flow, graph, icon, illustration, isolated, loop, motion, process, progress, recycle, ring, round, step, sticker, symbol, teamwork, template, turn, vector

PowerPoint Backgrounds Chart Steps Plan 4 Stages Style 6 Ppt Slide
PowerPoint Backgrounds Chart Steps Plan 4 Stages Style 6 PPT Slide-This Business Powerpoint Template Shows the one step which consists of four stages to achieve the goal. Use this another graphic design to represent a continuing sequence of stages, tasks, or events and emphasize the connection between all components.-PowerPoint Backgrounds Chart Steps Plan 4 Stages Style 6 PPT Slide

Ppt Red Quadrant On Circular Free Pie PowerPoint Template Chart Ks2 Templates
PPT red quadrant on circular free pie powerpoint template chart ks2 Templates-Use this layout to define the outcome and the multiple possibilities in a way that is used in calculation of probabilities, genetics and strategic reasoning. This chart visualize the of process steps, reoccurrences and components or of your company structure or product features.-PPT red quadrant on circular free pie powerpoint template chart ks2 Templates-3 arrow, art, background, business, chart, circle, clip, colorful, design, diagram, flow, fourth, graph, graphic, half, icon, illustration, management, point, process, progress, project, round, segment, set, slide, stage, successful business, third, transparent
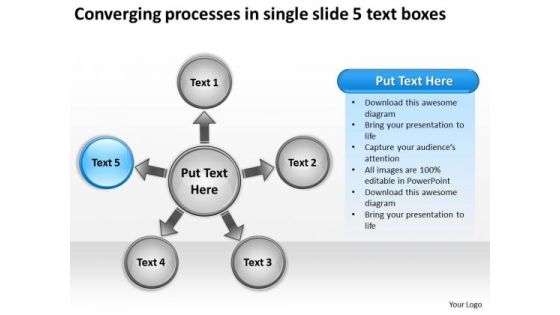
Processes In Single Slide 5 Text Boxes Chart Circular Flow PowerPoint Templates
We present our processes in single slide 5 text boxes chart Circular Flow PowerPoint templates.Present our Business PowerPoint Templates because this layout helps you to bring some important aspects of your business process to the notice of all concerned. Streamline the flow of information across the board. Use our Ring Charts PowerPoint Templates because it unravels each one for your audience while setting key timelines as you go along. Present our Process and Flows PowerPoint Templates because to achieve sureshot success you need to come together at the right time, place and manner. Present our Shapes PowerPoint Templates because this helps you to put all your brilliant views to your audience. Download our Arrows PowerPoint Templates because they will Amplify your basic corporate concept and forefront the benefits of overlapping processes to arrive at common goals.Use these PowerPoint slides for presentations relating to Achievement, Aim, Arrow, Business, Chart, Communication, Diagram, Direction, Graphic, Growth, Guide, Increase, Marketing, Presentation, Shape, Sign, Success, Target, Team, Teamwork, Process, Radial, Resource, Strategy, Template. The prominent colors used in the PowerPoint template are Blue light, White, Gray. People tell us our processes in single slide 5 text boxes chart Circular Flow PowerPoint templates are Versatile. Professionals tell us our Chart PowerPoint templates and PPT Slides are Efficient. Customers tell us our processes in single slide 5 text boxes chart Circular Flow PowerPoint templates are Nostalgic. Use our Communication PowerPoint templates and PPT Slides are Spiffy. We assure you our processes in single slide 5 text boxes chart Circular Flow PowerPoint templates are Glamorous. Professionals tell us our Arrow PowerPoint templates and PPT Slides are One-of-a-kind.

Colorful Diverging Circles And Arrows 7 Stages Cycle Spoke Chart PowerPoint Slides
We present our colorful diverging circles and arrows 7 stages Cycle Spoke Chart PowerPoint Slides.Download and present our Ring charts PowerPoint Templates because You can Double your output with our PowerPoint Templates and Slides. They make beating deadlines a piece of cake. Present our Marketing PowerPoint Templates because The marketplace is the merger of your dreams and your ability. Use our Arrows PowerPoint Templates because there is a vision, a need you can meet. Download our Shapes PowerPoint Templates because you can Transmit your thoughts via our slides and proud your team to action. Use our Business PowerPoint Templates because a brainwave has occurred to you after review. You know just how to push the graph skyward.Use these PowerPoint slides for presentations relating to Business, button, chart, circle, company, data, design, diagram, direction, document, financial, glossy, goals, graph, management, market, marketing, model, multicolored, multiple, navigation, network, options, plan, presentation, process, results, shiny, sphere, statistics. The prominent colors used in the PowerPoint template are Red, Gray, Black. People tell us our colorful diverging circles and arrows 7 stages Cycle Spoke Chart PowerPoint Slides are Classic. We assure you our data PowerPoint templates and PPT Slides will generate and maintain the level of interest you desire. They will create the impression you want to imprint on your audience. PowerPoint presentation experts tell us our colorful diverging circles and arrows 7 stages Cycle Spoke Chart PowerPoint Slides are Second to none. You can be sure our company PowerPoint templates and PPT Slides are Fun. Professionals tell us our colorful diverging circles and arrows 7 stages Cycle Spoke Chart PowerPoint Slides are Fabulous. Use our chart PowerPoint templates and PPT Slides are Bright.

Production Process Flow Chart Ppt PowerPoint Presentation Complete Deck With Slides
Improve your presentation delivery using this Production Process Flow Chart Ppt PowerPoint Presentation Complete Deck With Slides. Support your business vision and objectives using this well-structured PPT deck. This template offers a great starting point for delivering beautifully designed presentations on the topic of your choice. Comprising Fifteen this professionally designed template is all you need to host discussion and meetings with collaborators. Each slide is self-explanatory and equipped with high-quality graphics that can be adjusted to your needs. Therefore, you will face no difficulty in portraying your desired content using this PPT slideshow. This PowerPoint slideshow contains every important element that you need for a great pitch. It is not only editable but also available for immediate download and utilization. The color, font size, background, shapes everything can be modified to create your unique presentation layout. Therefore, download it now.

Organization Chart And Corporate Model Transformation Restructuring Organization Framework Clipart PDF
The model illustrates the integration of restructuring and highlights the three standards of activities such as long-term goals, tactical objectives, and commercial risks. There are four essential disciplines Planning, Measurement, and control, Continuous review of the market, Programme and project management. Presenting organization chart and corporate model transformation restructuring organization framework clipart pdf to provide visual cues and insights. Share and navigate important information on one stages that need your due attention. This template can be used to pitch topics like strategy, implementation, managing risk. In addtion, this PPT design contains high resolution images, graphics, etc, that are easily editable and available for immediate download.

Tech Support Process Flow Chart Ppt PowerPoint Presentation Complete Deck With Slides
Improve your presentation delivery using this Tech Support Process Flow Chart Ppt PowerPoint Presentation Complete Deck With Slides. Support your business vision and objectives using this well-structured PPT deck. This template offers a great starting point for delivering beautifully designed presentations on the topic of your choice. Comprising twelve slides this professionally designed template is all you need to host discussion and meetings with collaborators. Each slide is self-explanatory and equipped with high-quality graphics that can be adjusted to your needs. Therefore, you will face no difficulty in portraying your desired content using this PPT slideshow. This PowerPoint slideshow contains every important element that you need for a great pitch. It is not only editable but also available for immediate download and utilization. The color, font size, background, shapes everything can be modified to create your unique presentation layout. Therefore, download it now.

Distinct View Of An Issue Circularly Described Flow Chart PowerPoint Templates
We present our distinct view of an issue circularly described Flow Chart PowerPoint templates.Present our Circle Charts PowerPoint Templates because firing the arrows to emblazon the desired path will let you achieve anticipated results. Present our Arrows PowerPoint Templates because you have to coordinate and motivate your team. Download our Ring Charts PowerPoint Templates because this template helps you to illustrate your method, piece by piece, and interlock the whole process in the minds of your audience. Present our Business PowerPoint Templates because you are ready to flap your wings and launch off. All poised are you to touch the sky with glory. Present our Flow Charts PowerPoint Templates because Our PowerPoint Templates and Slides are topically designed to provide an attractive backdrop to any subject.Use these PowerPoint slides for presentations relating to 3d, arrow, blue, chart, circle, circular, circulation, collection, concept, connection, continuity, cursor, cycle, cyclic, diagram, direction, dynamic, flow, flowchart, graph, graphic, green, group, icon, loop, motion, movement, process, progress, recycle, recycling, red, refresh, reload, renew, repetition, return, reuse, rgb, ring, rotation, round, set, sign, spin, symbol, three, turn, update, vector. The prominent colors used in the PowerPoint template are Red, Yellow, Green. Presenters tell us our distinct view of an issue circularly described Flow Chart PowerPoint templates are Attractive. You can be sure our concept PowerPoint templates and PPT Slides are incredible easy to use. Professionals tell us our distinct view of an issue circularly described Flow Chart PowerPoint templates effectively help you save your valuable time. People tell us our circulation PowerPoint templates and PPT Slides will make the presenter look like a pro even if they are not computer savvy. People tell us our distinct view of an issue circularly described Flow Chart PowerPoint templates are Fancy. Professionals tell us our concept PowerPoint templates and PPT Slides are the best it can get when it comes to presenting.
Food Process Tracking With Control Chart Uplift Food Production Company Quality Standards Introduction PDF
The quality team will use control chart as food quality management tool. It will help in determining the food processes are stable and capable under provided conditions. Deliver an awe inspiring pitch with this creative food process tracking with control chart uplift food production company quality standards introduction pdf bundle. Topics like action plan, resources, chart analysis can be discussed with this completely editable template. It is available for immediate download depending on the needs and requirements of the user.
Food Process Tracking With Control Chart Increased Superiority For Food Products Sample PDF
The quality team will use control chart as food quality management tool. It will help in determining the food processes are stable and capable under provided conditions. Deliver an awe inspiring pitch with this creative food process tracking with control chart increased superiority for food products sample pdf bundle. Topics like action plan, resources, chart analysis can be discussed with this completely editable template. It is available for immediate download depending on the needs and requirements of the user.

5 Circular Stages Involved Development Ppt New Product Flow Chart PowerPoint Slides
We present our 5 circular stages involved development ppt new product flow chart PowerPoint Slides.Download our Arrows PowerPoint Templates because you can Present your views on the methods using our self-explanatory templates. Download our Circle Charts PowerPoint Templates because it shows you the vision of a desired destination and the best road to take to reach that goal. Download and present our Shapes PowerPoint Templates because you can Help your viewers automatically emphathise with your thoughts. Download our Business PowerPoint Templates because you have analysed many global markets and come up with possibilities. Highlight the pros and cons of other likely business oppurtunities. Download and present our Signs PowerPoint Templates because very often it is important to reflect on the basics.Use these PowerPoint slides for presentations relating to Arrows, green, chart, circle, circular, circulation, collection, concept, connection, continuity, cursor, cycle, cyclic, diagram, direction, flow, flowchart, graph, graphic, green, group, icon, isolated, loop, motion, movement, process, progress, recycle, recycling, red, refresh, reload, renew, repetition, return,, ring, rotation, round, sign, symbol. The prominent colors used in the PowerPoint template are Green, Black, Gray. The feedback we get is that our 5 circular stages involved development ppt new product flow chart PowerPoint Slides are Fun. People tell us our concept PowerPoint templates and PPT Slides are designed by professionals We assure you our 5 circular stages involved development ppt new product flow chart PowerPoint Slides are Breathtaking. Presenters tell us our circular PowerPoint templates and PPT Slides are Fancy. We assure you our 5 circular stages involved development ppt new product flow chart PowerPoint Slides will help you be quick off the draw. Just enter your specific text and see your points hit home. Use our concept PowerPoint templates and PPT Slides are Bold.

Business PowerPoint Templates Download Ppt Relative Circular Flow Arrow Chart Slides
We present our business powerpoint templates download ppt Relative Circular Flow Arrow Chart Slides.Download and present our Business PowerPoint Templates because infrastructure growth is an obvious requirement of today.inform your group on how exactly this potential is tailor made for you. Use our Marketing PowerPoint Templates because customer satisfaction is a mantra of the marketplace. Building a loyal client base is an essential element of your business. Use our Finance PowerPoint Templates because you envisage some areas of difficulty in the near future. The overall financial situation could be a source of worry. Download our Flow Charts PowerPoint Templates because a healthy person is the esence of a sense of happiness. Download and present our Process and flows PowerPoint Templates because Our PowerPoint Templates and Slides will generate and maintain the level of interest you desire. They will create the impression you want to imprint on your audience.Use these PowerPoint slides for presentations relating to Business, chart, circle, circular,concept, conference, curving, cycle, design, diagram, direction, element, financial, flow, flowchart, formula, future, goal, graphic, idea, management, market, marketing, mind, mind map, motion, movement, organization, organize, plan, presentation, process, product, questions, render, solutions, solve, strategy, success, symbol. The prominent colors used in the PowerPoint template are Red, Gray, White. The feedback we get is that our business powerpoint templates download ppt Relative Circular Flow Arrow Chart Slides are Efficacious. Customers tell us our curving PowerPoint templates and PPT Slides are visually appealing. Professionals tell us our business powerpoint templates download ppt Relative Circular Flow Arrow Chart Slides are Charming. Customers tell us our cycle PowerPoint templates and PPT Slides are Upbeat. Use our business powerpoint templates download ppt Relative Circular Flow Arrow Chart Slides are designed by professionals Professionals tell us our circular PowerPoint templates and PPT Slides are Charming.
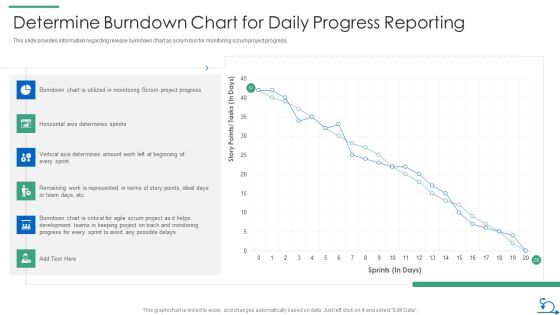
How Bidding Teams Determine Burndown Chart For Daily Progress Reporting Pictures PDF
This slide provides information regarding release burndown chart as scrum tool for monitoring scrum project progress. Deliver an awe inspiring pitch with this creative how bidding teams determine burndown chart for daily progress reporting pictures pdf bundle. Topics like burndown chart, team, project progress can be discussed with this completely editable template. It is available for immediate download depending on the needs and requirements of the user.

Quality Assurance Templates Set 2 Pareto Chart Highlighting Customer Complaints Elements PDF
Following slide illustrates pareto chart that can be used by a firm to highlights its customer complaints related to documentation, product quality, packaging, delivery and other. Deliver an awe inspiring pitch with this creative quality assurance templates set 2 pareto chart highlighting customer complaints elements pdf bundle. Topics like pareto chart highlighting customer complaints can be discussed with this completely editable template. It is available for immediate download depending on the needs and requirements of the user.
Sustainable Energy Resources Column Chart Ppt PowerPoint Presentation Icon Infographic Template PDF
This graph or chart is linked to excel, and changes automatically based on data. Just left click on it and select Edit Data. Deliver and pitch your topic in the best possible manner with this Sustainable Energy Resources Column Chart Ppt PowerPoint Presentation Icon Infographic Template PDF. Use them to share invaluable insights on Column Chart, 2017 To 2022 and impress your audience. This template can be altered and modified as per your expectations. So, grab it now.

Incident And Issue Management Procedure Planned And Actual Velocity Project Burndown Chart Guidelines PDF
This slide provides the glimpse about the planned and actual velocity project burndown chart which showcase the impact of introducing issue escalation process in the company. Deliver an awe inspiring pitch with this creative incident and issue management procedure planned and actual velocity project burndown chart guidelines pdf bundle. Topics like planned and actual velocity project burndown chart can be discussed with this completely editable template. It is available for immediate download depending on the needs and requirements of the user.

Approach Avoidance Conflict Planned And Actual Velocity Project Burndown Chart Structure PDF
This slide provides the glimpse about the planned and actual velocity project burndown chart which showcase the impact of introducing issue escalation process in the company. Deliver an awe inspiring pitch with this creative approach avoidance conflict planned and actual velocity project burndown chart structure pdf bundle. Topics like planned and actual velocity project burndown chart can be discussed with this completely editable template. It is available for immediate download depending on the needs and requirements of the user.
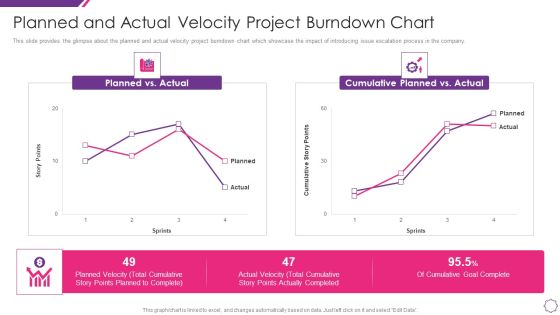
Handle Project Escalations Planned And Actual Velocity Project Burndown Chart Ppt Portfolio Outfit PDF
This slide provides the glimpse about the planned and actual velocity project burndown chart which showcase the impact of introducing issue escalation process in the company. Deliver an awe inspiring pitch with this creative handle project escalations planned and actual velocity project burndown chart ppt portfolio outfit pdf bundle. Topics like planned and actual velocity project burndown chart can be discussed with this completely editable template. It is available for immediate download depending on the needs and requirements of the user.

Business Operation Modeling Approaches Project Iteration Burn Down Chart Template PDF
This slide provides the glimpse about the project iteration burn down chart which focuses on 21 days plan along with completed tasks, remaining effort, ideal burndown and remaining tasks.Deliver an awe inspiring pitch with this creative business operation modeling approaches project iteration burn down chart template pdf bundle. Topics like project iteration burn down chart can be discussed with this completely editable template. It is available for immediate download depending on the needs and requirements of the user.

Promotion Standard Practices Tools And Templates Net Promoter Score Infographic With Donut Chart Inspiration PDF
Mentioned slide displays net promoter score with rating scale for detractors, passives and promoters, It covers 12 months NPS rating in a donut chart.Deliver an awe inspiring pitch with this creative promotion standard practices tools and templates net promoter score infographic with donut chart inspiration pdf bundle. Topics like net promoter score infographic with donut chart can be discussed with this completely editable template. It is available for immediate download depending on the needs and requirements of the user.
Food Process Tracking With Control Chart Application Of Quality Management For Food Processing Companies Background PDF
The quality team will use control chart as food quality management tool. It will help in determining the food processes are stable and capable under provided conditions. Deliver an awe inspiring pitch with this creative food process tracking with control chart application of quality management for food processing companies background pdf bundle. Topics like action plan, resources, chart analysis can be discussed with this completely editable template. It is available for immediate download depending on the needs and requirements of the user.
Food Process Tracking With Control Chart Assuring Food Quality And Hygiene Introduction PDF
The quality team will use control chart as food quality management tool. It will help in determining the food processes are stable and capable under provided conditions. Deliver an awe inspiring pitch with this creative food process tracking with control chart assuring food quality and hygiene introduction pdf bundle. Topics like action plan, resources, chart analysis can be discussed with this completely editable template. It is available for immediate download depending on the needs and requirements of the user.
Food Process Tracking With Control Chart Food Security Excellence Ppt Inspiration Graphics Example PDF
The quality team will use control chart as food quality management tool. It will help in determining the food processes are stable and capable under provided conditions. Deliver an awe inspiring pitch with this creative food process tracking with control chart food security excellence ppt inspiration graphics example pdf bundle. Topics like action plan, resources, chart analysis can be discussed with this completely editable template. It is available for immediate download depending on the needs and requirements of the user.
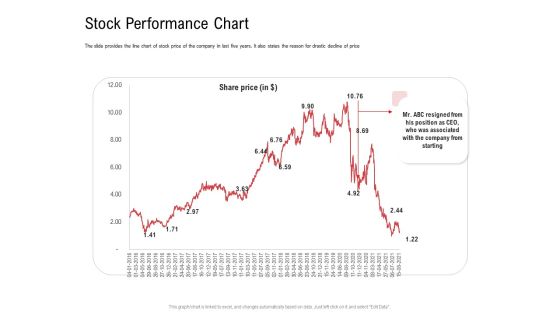
Investor Pitch Deck Collect Funding Spot Market Stock Performance Chart Demonstration PDF
The slide provides the line chart of stock price of the company in last five years. It also states the reason for drastic decline of price. Deliver an awe-inspiring pitch with this creative investor pitch deck collect funding spot market stock performance chart demonstration pdf bundle. Topics like stock performance chart can be discussed with this completely editable template. It is available for immediate download depending on the needs and requirements of the user.
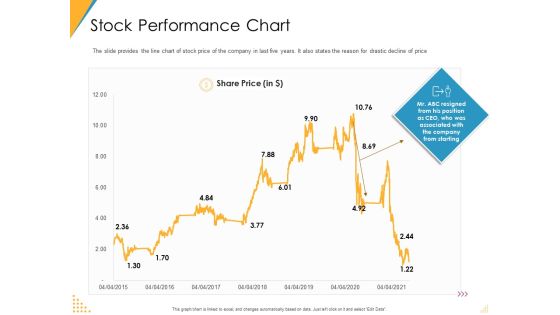
Investor Pitch Deck Post Market Financing Stock Performance Chart Ppt Summary Inspiration PDF
The slide provides the line chart of stock price of the company in last five years. It also states the reason for drastic decline of price. Deliver an awe-inspiring pitch with this creative investor pitch deck post market financing stock performance chart ppt summary inspiration pdf bundle. Topics like stock performance chart can be discussed with this completely editable template. It is available for immediate download depending on the needs and requirements of the user.

Investor Pitch Deck Public Offering Market Stock Performance Chart Mockup PDF
The slide provides the line chart of stock price of the company in last five years. It also states the reason for drastic decline of price. Deliver an awe-inspiring pitch with this creative investor pitch deck public offering market stock performance chart mockup pdf bundle. Topics like stock performance chart can be discussed with this completely editable template. It is available for immediate download depending on the needs and requirements of the user.
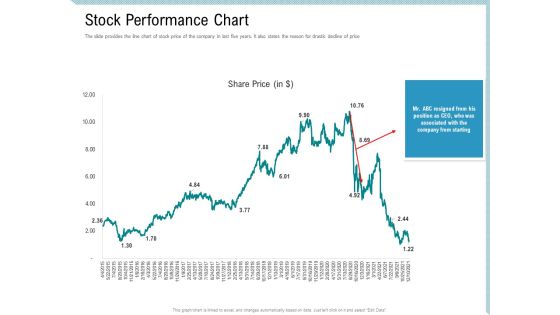
Investor Pitch Deck Collect Capital Financial Market Stock Performance Chart Designs PDF
The slide provides the line chart of stock price of the company in last five years. It also states the reason for drastic decline of price. Deliver an awe-inspiring pitch with this creative investor pitch deck collect capital financial market stock performance chart designs pdf bundle. Topics like stock performance chart can be discussed with this completely editable template. It is available for immediate download depending on the needs and requirements of the user.

Agile Certificate Coaching Company Determine Scrum Release Burndown Chart Demonstration PDF
This slide provides information regarding release burndown chart as scrum tool for monitoring scrum project progress. Deliver an awe-inspiring pitch with this creative agile certificate coaching company determine scrum release burndown chart demonstration pdf bundle. Topics like determine scrum release burndown chart can be discussed with this completely editable template. It is available for immediate download depending on the needs and requirements of the user.

Pitch Presentation Raise Money Spot Market Stock Performance Chart Ppt Portfolio Rules PDF
The slide provides the line chart of stock price of the company in last five years. It also states the reason for drastic decline of price. Deliver and pitch your topic in the best possible manner with this pitch presentation raise money spot market stock performance chart ppt portfolio rules pdf. Use them to share invaluable insights on stock performance chart and impress your audience. This template can be altered and modified as per your expectations. So, grab it now.

Collection Of Quality Assurance PPT Control Chart To Determine Total Specimen Labelling Graphics PDF
Following slide portrays control chart that can be used by an organization to determine total specimen labelling errors. Deliver an awe inspiring pitch with this creative collection of quality assurance ppt control chart to determine total specimen labelling graphics pdf bundle. Topics like control chart to determine total specimen labelling errors can be discussed with this completely editable template. It is available for immediate download depending on the needs and requirements of the user.

Scrum Architecture Follow Up Progress By Using Burn Down Chart Guidelines PDF
This slide provides the glimpse about the burn down chart for progress follow up which covers the estimated and actual burndown.Deliver an awe inspiring pitch with this creative scrum architecture follow up progress by using burn down chart guidelines pdf bundle. Topics like follow up progress by using burn down chart can be discussed with this completely editable template. It is available for immediate download depending on the needs and requirements of the user.

3d Man On Pie Chart Business PowerPoint Templates Ppt Backgrounds For Slides 0113
We present our 3d Man On Pie Chart Business PowerPoint Templates PPT Backgrounds For Slides 0113.Download and present our Business PowerPoint Templates because You can Connect the dots. Fan expectations as the whole picture emerges. Present our Marketing PowerPoint Templates because Our PowerPoint Templates and Slides are the chords of your song. String them along and provide the lilt to your views. Download our People PowerPoint Templates because Your success is our commitment. Our PowerPoint Templates and Slides will ensure you reach your goal. Use our Success PowerPoint Templates because Our PowerPoint Templates and Slides are created with admirable insight. Use them and give your group a sense of your logical mind. Use our Pie charts PowerPoint Templates because You are well armed with penetrative ideas. Our PowerPoint Templates and Slides will provide the gunpowder you need.Use these PowerPoint slides for presentations relating to Pie chart and man, business, marketing, success, people, pie charts. The prominent colors used in the PowerPoint template are Red, Green, Blue. You can be sure our 3d Man On Pie Chart Business PowerPoint Templates PPT Backgrounds For Slides 0113 will help them to explain complicated concepts. Use our pie PowerPoint templates and PPT Slides will help them to explain complicated concepts. You can be sure our 3d Man On Pie Chart Business PowerPoint Templates PPT Backgrounds For Slides 0113 provide you with a vast range of viable options. Select the appropriate ones and just fill in your text. Customers tell us our marketing PowerPoint templates and PPT Slides are specially created by a professional team with vast experience. They diligently strive to come up with the right vehicle for your brilliant Ideas. People tell us our 3d Man On Pie Chart Business PowerPoint Templates PPT Backgrounds For Slides 0113 provide great value for your money. Be assured of finding the best projection to highlight your words. People tell us our pie PowerPoint templates and PPT Slides are designed by a team of presentation professionals.

Advertising Existing Products And Services In The Target Market Column Chart Ppt Professional Layout Ideas PDF
Presenting this set of slides with name advertising existing products and services in the target market column chart ppt professional layout ideas pdf. The topics discussed in these slide is column chart. This is a completely editable PowerPoint presentation and is available for immediate download. Download now and impress your audience.

Advertising Existing Products And Services In The Target Market Pie Chart Ppt Model Example Introduction PDF
Presenting this set of slides with name advertising existing products and services in the target market pie chart ppt model example introduction pdf. The topics discussed in these slide is pie chart. This is a completely editable PowerPoint presentation and is available for immediate download. Download now and impress your audience.

Clustered Bar Chart Percentage Product Ppt PowerPoint Presentation Portfolio Example Introduction
This is a clustered bar chart percentage product ppt powerpoint presentation portfolio example introduction. This is a three stage process. The stages in this process are area chart, finance, marketing, management, investment.

Ppt Team Effort Person Standing Yellow Piece Of Chart PowerPoint Ks2 Templates
PPT team effort person standing yellow piece of chart PowerPoint ks2 Templates-Use this Circular Arrow diagram to show activities that are related to the business plan metrics and monitor the results to determine if the business plan is proceeding as planned. You can apply other 3D Styles and shapes to the slide to enhance your presentations.-PPT team effort person standing yellow piece of chart PowerPoint ks2 Templates-arrow, bar, business, businessman, candidate, cartoon, character, chart, circle, circular, client, communication, company, concept, diagram, finance, financial, flow, growth, human, illustration, increase, information, iteration, man, market, marketing, process, processing, profit, sales, statistics, stats, success, target

Diverging 11 Steps Around Globe Process Flow Circular Layout Chart PowerPoint Templates
We present our diverging 11 steps around globe process flow Circular Layout Chart PowerPoint templates.Download our Globe PowerPoint Templates because as a result we often end up with errors. Download and present our Business PowerPoint Templates because you are ready to flap your wings and launch off. All poised are you to touch the sky with glory. Download and present our Circle Charts PowerPoint Templates because It can Bubble and burst with your ideas. Use our Process and flows PowerPoint Templates because you will surely see all making the grade. Present our Flow charts PowerPoint Templates because you can present your opinions in this field using our impressive templates.Use these PowerPoint slides for presentations relating to Arrows, business, chart, circle, company,concept, continuity, continuous, cycle,dependency, diagram, direction,dynamic,endless, graph,iteration, iterative, method, path, phase,presentation, process, production,progress, progression, report, rotation,sequence. The prominent colors used in the PowerPoint template are Yellow, Blue, Gray. People tell us our diverging 11 steps around globe process flow Circular Layout Chart PowerPoint templates are Awesome. Professionals tell us our cycle PowerPoint templates and PPT Slides are Splendid. We assure you our diverging 11 steps around globe process flow Circular Layout Chart PowerPoint templates are Tasteful. PowerPoint presentation experts tell us our company PowerPoint templates and PPT Slides are Breathtaking. We assure you our diverging 11 steps around globe process flow Circular Layout Chart PowerPoint templates will make the presenter successul in his career/life. People tell us our concept PowerPoint templates and PPT Slides are Tasteful.

Product Features And Competitors Chart Ppt Powerpoint Presentation Slides Graphics Design
This is a product features and competitors chart ppt powerpoint presentation slides graphics design. This is a three stage process. The stages in this process are comparison chart, comparison table, comparison matrix.

Diverging 11 Factors Round Manner Ppt Cycle Flow Chart PowerPoint Slides
We present our diverging 11 factors round manner ppt Cycle Flow Chart PowerPoint Slides.Use our Circle Charts PowerPoint Templates because you have played a stellar role and have a few ideas. Use our Arrows PowerPoint Templates because you can see clearly through to the bigger bowl ahead. Time your jump to perfection and hit the nail on the head. Use our Business PowerPoint Templates because spell out your advertising plans to increase market share. The feedback has been positive and productive. Download and present our Shapes PowerPoint Templates because this one depicts the popular chart. Use our Flow Charts PowerPoint Templates because like your thoughts arrows are inherently precise and true.Use these PowerPoint slides for presentations relating to amazement, application, arrow, background, black, circle, devolution, direction, direction-giving, email, glamour, help, icon, insert, internet, joy, manners, reflex, roundly, scalable, search, searching, solution, support, universal, vector, visible, way, website, white. The prominent colors used in the PowerPoint template are Yellow, Green, Blue. Customers tell us our diverging 11 factors round manner ppt Cycle Flow Chart PowerPoint Slides are Fashionable. PowerPoint presentation experts tell us our devolution PowerPoint templates and PPT Slides are Ritzy. People tell us our diverging 11 factors round manner ppt Cycle Flow Chart PowerPoint Slides are Glamorous. People tell us our arrow PowerPoint templates and PPT Slides will make you look like a winner. Customers tell us our diverging 11 factors round manner ppt Cycle Flow Chart PowerPoint Slides are Bold. People tell us our arrow PowerPoint templates and PPT Slides are One-of-a-kind.
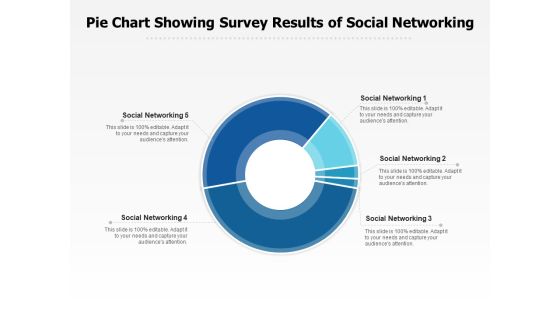
Pie Chart Showing Survey Results Of Social Networking Ppt PowerPoint Presentation Gallery Ideas PDF
Presenting this set of slides with name pie chart showing survey results of social networking ppt powerpoint presentation gallery ideas pdf. The topics discussed in these slide is pie chart showing survey results of social networking. This is a completely editable PowerPoint presentation and is available for immediate download. Download now and impress your audience.

Pie Chart Survey Results Of Vehicle Export Ppt PowerPoint Presentation Portfolio Slide Portrait PDF
Presenting this set of slides with name pie chart survey results of vehicle export ppt powerpoint presentation portfolio slide portrait pdf. The topics discussed in these slides are pie chart survey results of vehicle export, export of car. This is a completely editable PowerPoint presentation and is available for immediate download. Download now and impress your audience.
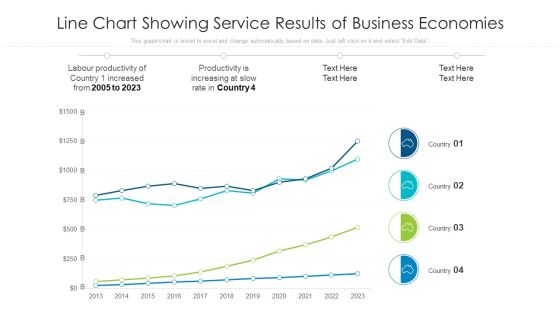
Line Chart Showing Service Results Of Business Economies Ppt PowerPoint Presentation Model Tips PDF
Pitch your topic with ease and precision using this line chart showing service results of business economies ppt powerpoint presentation model tips pdf. This layout presents information on line chart showing service results of business economies. It is also available for immediate download and adjustment. So, changes can be made in the color, design, graphics or any other component to create a unique layout.

Ppt Team Work Person Presentation Standing Orange Piece Of Chart PowerPoint Templates
PPT team work person presentation standing orange piece of chart PowerPoint Templates-Use this graphical approach to represent global business issues such as financial data, stock market Exchange, increase in sales, corporate presentations and more. Create captivating presentations to deliver comparative and weighted arguments.-PPT team work person presentation standing orange piece of chart PowerPoint Templates-arrow, bar, business, businessman, candidate, cartoon, character, chart, circle, circular, client, communication, company, concept, diagram, finance, financial, flow, growth, human, illustration, increase, information, iteration, man, market, marketing, process, processing, profit, sales, statistics, stats, success, target

Area Chart Ppt PowerPoint Presentation Inspiration Icons Ppt PowerPoint Presentation Professional File Formats
This is a area chart ppt powerpoint presentation inspiration icons ppt powerpoint presentation professional file formats. This is a two stage process. The stages in this process are area chart, product, percentage, business, growth.
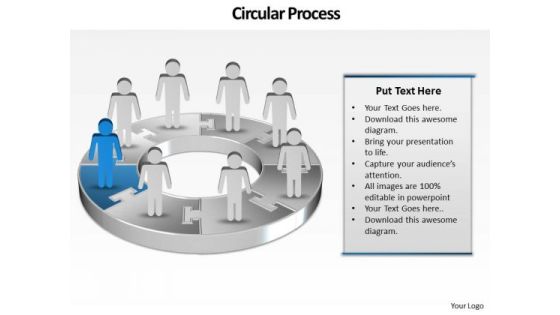
Ppt Group Of People Pie Chart Person Presentation Standing Blue Piece PowerPoint Templates
PPT group of people pie chart person presentation standing blue piece PowerPoint Templates-This PowerPoint Diagram shows the Round Description of steps which are involved in development Process. It includes Eight Steps. You can change color, size and orientation of any icon to your liking.-PPT group of people pie chart person presentation standing blue piece PowerPoint Templates-arrow, bar, business, businessman, candidate, cartoon, character, chart, circle, circular, client, communication, company, concept, diagram, finance, growth, human, illustration, increase, information, marketing, person, presentation, process, profit, sales, stats, success, target

Ppt Group Of People Pie Chart Person Standing Purple Piece PowerPoint Templates
PPT group of people pie chart person standing purple piece PowerPoint Templates-This continual illustration of procedure graphic is a visual representation of your information and ideas. Use this diagram as a method of graphically representing the flow of data as an information processing system.-PPT group of people pie chart person standing purple piece PowerPoint Templates-arrow, bar, business, businessman, candidate, cartoon, character, chart, circle, circular, client, communication, company, concept, diagram, finance, growth, human, illustration, increase, information, marketing, person, presentation, process, profit, sales, stats, success, target

Ppt Pie Family Tree Chart PowerPoint 2003 Person Standing Green Piece Templates
PPT pie family tree chart PowerPoint 2003 person standing green piece Templates-The above Diagram displays a picture of eight circular text boxes placed in sequential manner. This image has been professionally designed to emphasize the concept of Operations performed in Circular process. Adjust the above image in your PPT presentations to visually support your content in your Business PPT slideshows.-PPT pie family tree chart PowerPoint 2003 person standing green piece Templates-arrow, bar, business, businessman, candidate, cartoon, character, chart, circle, circular, client, communication, company, concept, diagram, finance, financial, flow, growth, human, illustration, increase, information, iteration, man, market, marketing, process, processing, profit, sales, statistics, stats, success, target
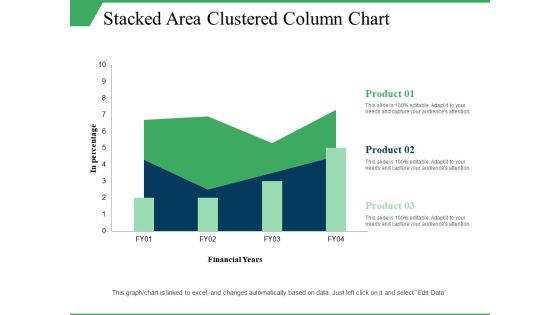
Stacked Area Clustered Column Chart Ppt PowerPoint Presentation Visual Aids Model
This is a stacked area clustered column chart ppt powerpoint presentation visual aids model. This is a three stage process. The stages in this process are in percentage, product, financial years, growth, column chart.

6 Stages Flow Diverging Process Arrows Relative Cycle Chart PowerPoint Slides
We present our 6 stages flow diverging process arrows Relative Cycle Chart PowerPoint Slides.Download and present our Boxes PowerPoint Templates because you understand the ailment and how to fight it. Download our Business PowerPoint Templates because this template can project the path to sucess that you have charted. Download our Arrows PowerPoint Templates because so that you can Lead the way to spread good cheer to one and all. Download and present our Circle Charts PowerPoint Templates because Our PowerPoint Templates and Slides offer you the widest possible range of options. Download our Flow Charts PowerPoint Templates because your group can behave steady in the top bracket.Use these PowerPoint slides for presentations relating to 3d, abstract, arrow, art, background, blank, business, chart, circle, concept, connection, cycle, development, diagram, direction, element, environment, exchange, finance, financial, flow, graph, graphic, graphic presentation, group, icon, illustration, investment, isolated, isometric, market, motion, movement, organization, passive income, perspective, process, process chart, recycle, report, ring, sign, step, stock, success, symbol, teamwork, text, vector. The prominent colors used in the PowerPoint template are Blue, Red, Yellow. Presenters tell us our 6 stages flow diverging process arrows Relative Cycle Chart PowerPoint Slides will save the presenter time. You can be sure our arrow PowerPoint templates and PPT Slides are Excellent. Professionals tell us our 6 stages flow diverging process arrows Relative Cycle Chart PowerPoint Slides are Handsome. People tell us our art PowerPoint templates and PPT Slides are Youthful. People tell us our 6 stages flow diverging process arrows Relative Cycle Chart PowerPoint Slides will make the presenter look like a pro even if they are not computer savvy. Professionals tell us our arrow PowerPoint templates and PPT Slides provide great value for your money. Be assured of finding the best projection to highlight your words.
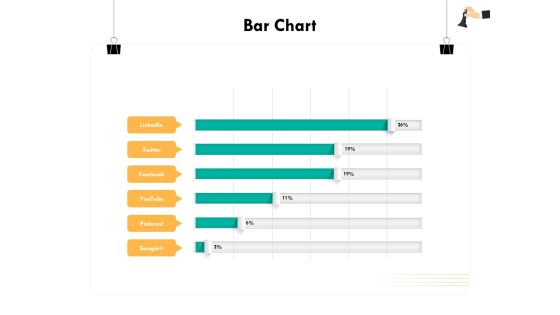
Strategic Sourcing For Better Procurement Value Bar Chart Ppt Professional Graphics Template PDF
Presenting this set of slides with name strategic sourcing for better procurement value bar chart ppt professional graphics template pdf. The topics discussed in these slide is bar chart. This is a completely editable PowerPoint presentation and is available for immediate download. Download now and impress your audience.
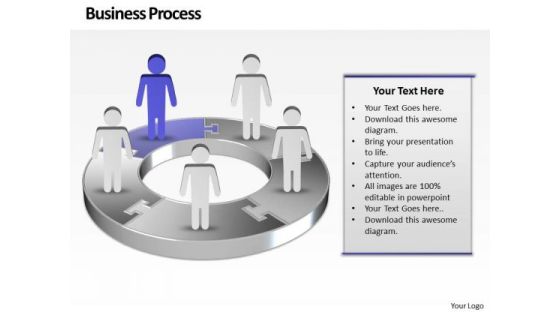
Ppt Purple Men Standing On Free Concept Pie PowerPoint Presentation Chart Templates
PPT purple men standing on free concept pie powerpoint presentation chart Templates-Use this Circular Arrow diagram to show activities that are related to the business plan metrics and monitor the results to determine if the business plan is proceeding as planned.-PPT purple men standing on free concept pie powerpoint presentation chart Templates-3d, arrow, background, blue, chart, circle, circular, clipart, colorful, connection, continuity, cycle, cyclic, diagram, direction, flow, graph, icon, illustration, isolated, loop, motion, process, progress, recycle, ring, round, step, sticker, symbol, teamwork, template, turn, vector

Ppt 3d Men Standing On Concept Download Free Pie PowerPoint Template Chart Templates
PPT 3d men standing on concept download free pie powerpoint template chart Templates-Use this 3D Amazing PowerPoint Diagram to illustrate the steps to be followed in Circular Process. It is represented by five colorful stages. This Diagram shows every single stage which can be explained in single slide to make your Presentation Attractive.-PPT 3d men standing on concept download free pie powerpoint template chart Templates-3d, arrow, background, blue, chart, circle, circular, circulation, clipart, colorful, connection, continuity, cut, cycle, cyclic, diagram, direction, empty, flow, graph, green, icon, illustration, isolated, loop, motion, pink, presentation, process, progress, reason, recycle, recycling, repetition, report, result, ring, rotation, round, scheme, section, step, sticker, symbol, teamwork, template, turn, vector
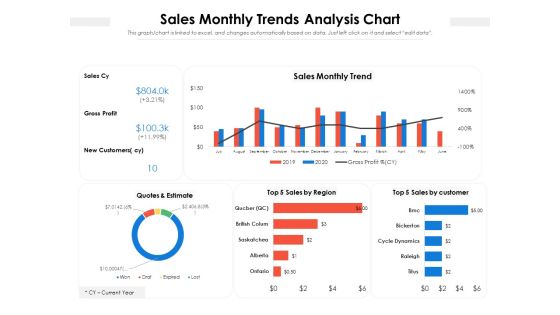
Sales Monthly Trends Analysis Chart Ppt Powerpoint Presentation Gallery Objects Pdf
Pitch your topic with ease and precision using this sales monthly trends analysis chart ppt powerpoint presentation gallery objects pdf. This layout presents information on sales monthly trends analysis chart. It is also available for immediate download and adjustment. So, changes can be made in the color, design, graphics or any other component to create a unique layout.

Pie Chart With Various Percentage Values Ppt PowerPoint Presentation Gallery Graphics Template PDF
Showcasing this set of slides titled pie chart with various percentage values ppt powerpoint presentation gallery graphics template pdf. The topics addressed in these templates are pie chart with various percentage values. All the content presented in this PPT design is completely editable. Download it and make adjustments in color, background, font etc. as per your unique business setting.
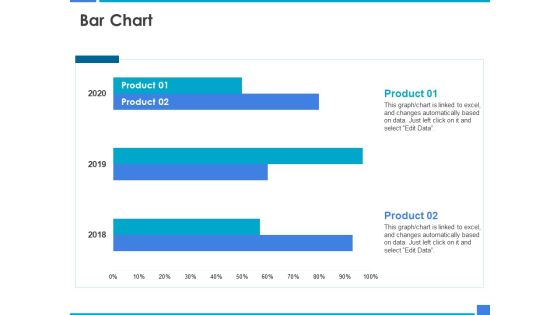
Product Strategy And Product Management Implementation Bar Chart Ppt Pictures Samples PDF
Presenting this set of slides with name product strategy and product management implementation bar chart ppt pictures samples pdf. The topics discussed in these slide is bar chart. This is a completely editable PowerPoint presentation and is available for immediate download. Download now and impress your audience.

ABC Analysis Chart With Percentage Of Dollar Value Ppt PowerPoint Presentation Gallery Portfolio PDF
Pitch your topic with ease and precision using this abc analysis chart with percentage of dollar value ppt powerpoint presentation gallery portfolio pdf. This layout presents information on abc analysis chart with percentage of dollar value. It is also available for immediate download and adjustment. So, changes can be made in the color, design, graphics or any other component to create a unique layout.

Various Banking Contribution Chart With Percentage Values Ppt PowerPoint Presentation Visual Aids Deck PDF
Pitch your topic with ease and precision using this various banking contribution chart with percentage values ppt powerpoint presentation visual aids deck pdf This layout presents information on various banking contribution chart with percentage values. It is also available for immediate download and adjustment. So, changes can be made in the color, design, graphics or any other component to create a unique layout.
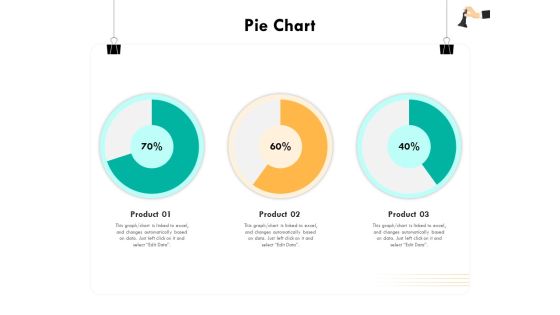
Strategic Sourcing For Better Procurement Value Pie Chart Ppt Inspiration Example Introduction PDF
Presenting this set of slides with name strategic sourcing for better procurement value pie chart ppt inspiration example introduction pdf. The topics discussed in these slide is pie chart. This is a completely editable PowerPoint presentation and is available for immediate download. Download now and impress your audience.

 Home
Home