Goal Chart

IT Software Web Development Gantt Chart Topics PDF
This slide presents a Gantt chart highlighting various phases of website design plan to help project managers deliver the project on time. It includes phases such as project definition, content, design, development and review. Pitch your topic with ease and precision using this IT Software Web Development Gantt Chart Topics PDF. This layout presents information on Chart, Software, Development. It is also available for immediate download and adjustment. So, changes can be made in the color, design, graphics or any other component to create a unique layout.
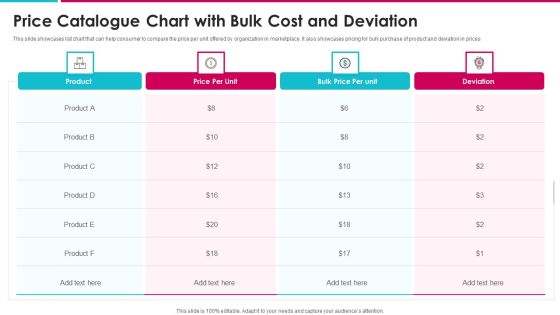
Price Catalogue Chart With Bulk Cost And Deviation Background PDF
This slide showcases list chart that can help consumer to compare the price per unit offered by organization in marketplace. It also showcases pricing for bulk purchase of product and deviation in prices Showcasing this set of slides titled price catalogue chart with bulk cost and deviation background pdf. The topics addressed in these templates are price catalogue chart with bulk cost and deviation. All the content presented in this PPT design is completely editable. Download it and make adjustments in color, background, font etc. as per your unique business setting.
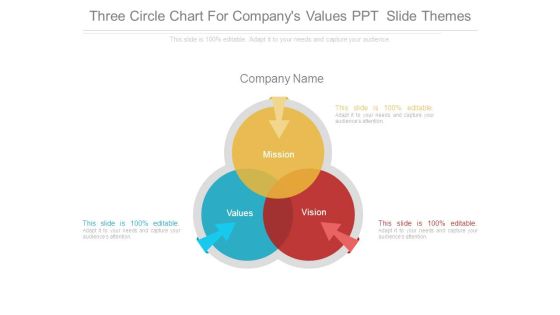
Three Circle Chart For Companys Values Ppt Slide Themes
This is a three circle chart for companys values ppt slide themes. This is a three stage process. The stages in this process are mission, company name, values, vision.

Quality Policy And Quality Objectives Chart Powerpoint Slides
This is a quality policy and quality objectives chart powerpoint slides. This is a four stage process. The stages in this process are development and continuous improvement, plan, evaluation monitoring and control, performance and quality assurance.

Volume High Low Close Chart Ppt PowerPoint Presentation Pictures Objects
This is a volume high low close chart ppt powerpoint presentation pictures objects. This is a one stage process. The stages in this process are finance, marketing, management, investment, analysis.

Project Status Bar Chart Ppt PowerPoint Presentation Ideas Objects
This is a project status bar chart ppt powerpoint presentation ideas objects. This is a four stage process. The stages in this process are project management, project progress, project growth.
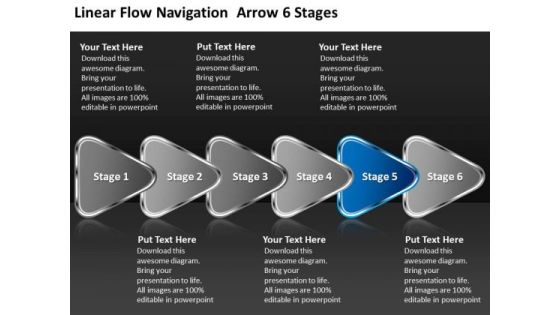
Linear Flow Navigation Arrow 6 Stages Chart Slides PowerPoint Templates
We present our linear flow navigation arrow 6 stages chart Slides PowerPoint templates.Use our Arrows PowerPoint Templates because,You have the people in place, selected the team leaders and all are raring to go. Use our Marketing PowerPoint Templates because,Networking is an imperative in todays world. You need to access the views of others. Similarly you need to give access to them of your abilities Use our Success PowerPoint Templates because,You have come up with a brilliant breakthrough idea. You can also visualise the interest it will generate. Use our Process and Flows PowerPoint Templates because,You have the people in place, selected the team leaders and all are raring to go. Use our Business PowerPoint Templates because, Your ideas too are pinpointedly focused on you goals. Use these PowerPoint slides for presentations relating to Abstract, Arrow, Arrows, Business, Chart, Design, Development, Diagram, Direction, Element, Flow, Flowchart, Graph, Linear, Management, Model, Motion, Organization, Plan, Process, Program, Section, Segment, Set, Sign, Solution, Strategy, Symbol, Technology. The prominent colors used in the PowerPoint template are Blue navy, Gray, Black

Chart For Business Development Ppt Sample Small Plan PowerPoint Slides
We present our chart for business development ppt sample small plan PowerPoint Slides.Present our Business PowerPoint Templates because Your success is our commitment. Our PowerPoint Templates and Slides will ensure you reach your goal. Use our Leadership PowerPoint Templates because our PowerPoint Templates and Slides are the string of your bow. Fire of your ideas and conquer the podium. Use our Layers PowerPoint Templates because Our PowerPoint Templates and Slides are created with admirable insight. Use them and give your group a sense of your logical mind. Present our Shapes PowerPoint Templates because Our PowerPoint Templates and Slides offer you the widest possible range of options. Download and present our Signs PowerPoint Templates because you can Break through with our PowerPoint Templates and Slides. Bring down the mental barriers of your audience.Use these PowerPoint slides for presentations relating to Business, result, market, website, network, sales, opportunity, target, achievement, corporate, loss, plan, down, benefit, arrow, success, presentation, diagram, gain, ascending, data, stock, element, report, marketing, upward, development, computer, abstract, management, graph, illustration, chart, direction, growth, professional, company, downward, banner, art, investment, improvement, office, statistic, financial, increasing, performance, 3d. The prominent colors used in the PowerPoint template are Blue, Gray, White.

Circular Chart With Icons For Value Chain Powerpoint Template
This PowerPoint template has been designed with circular chart and icons. This professional PPT slide is suitable to present value chain analysis. Capture the attention of your audience using this professional slide.

Bubble Chart Employee Value Proposition Ppt PowerPoint Presentation Icon Sample
This is a bubble chart employee value proposition ppt powerpoint presentation icon sample. This is a two stage process. The stages in this process are business, management, strategy, analysis, marketing.
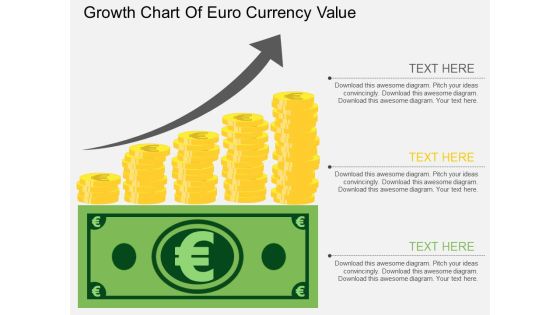
Growth Chart Of Euro Currency Value Powerpoint Template
The above PPT template displays growth chart of Euro currency. This diagram helps to exhibit Euro currency value growth. Adjust the above diagram in your business presentations to visually support your content.
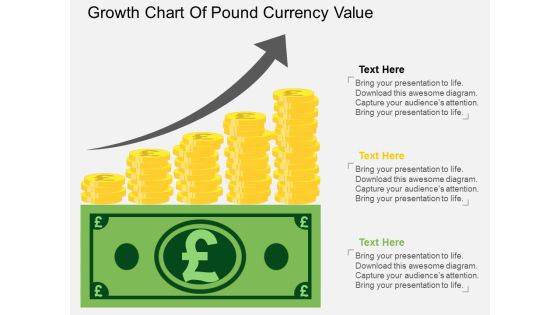
Growth Chart Of Pound Currency Value Powerpoint Template
The above PPT template displays growth chart of Pound currency. This diagram helps to exhibit Pound currency value growth. Adjust the above diagram in your business presentations to visually support your content.

Value Stream Mapping Steps Chart Ppt Presentation Examples
This is a value stream mapping steps chart ppt presentation examples. This is a four stage process. The stages in this process are years, time planning, business, marketing, future.
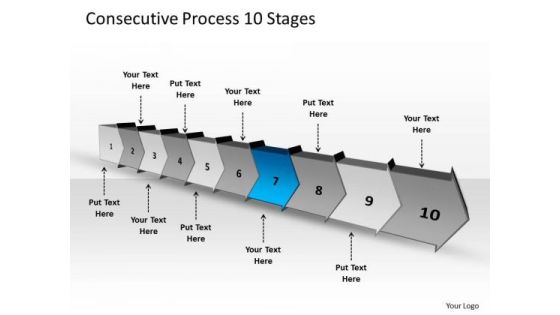
Consecutive Process 10 Stages Visio Flow Chart PowerPoint Slides
We present our consecutive process 10 stages vision flow chart PowerPoint Slides. Use our Marketing PowerPoint Templates because, Drive home your reasons and chart the path ahead to arrive at tour destination and achieve the goal. Use our Arrows PowerPoint Templates because, You have some exciting plans to spread goodwill among the underprivileged, Expound on your ideas and show to your colleagues how they can help others and in the process increase your Brand value. Use our Business PowerPoint Templates because, Marketing Strategy Business Template: - Maximizing sales of your product is the intended destination. Use our Process and Flows PowerPoint Templates because, your quicksilver ideas are the arrows in your quiver. Use our Leadership PowerPoint Templates because, expand on your plans to overcome such obstacles and reassure the team that they shall continue to roll along merrily. Use these PowerPoint slides for presentations relating to Advertising, arrow, background, banner, bookmark, card, choice, concept, creative, design, direction, flow, idea, illustration, info graphic, instruction, label, layout, marketing, modern, next, options, process, product, promotion, sequence, simple, step, symbol, template, triangle. The prominent colors used in the PowerPoint template are Blue, Gray, and White

Enterprise Value Timing Factors Chart Ppt Examples Professional
This is a enterprise value timing factors chart ppt examples professional. This is a four stage process. The stages in this process are industry dynamics, company performance, organic growth, strategic acquisitions.
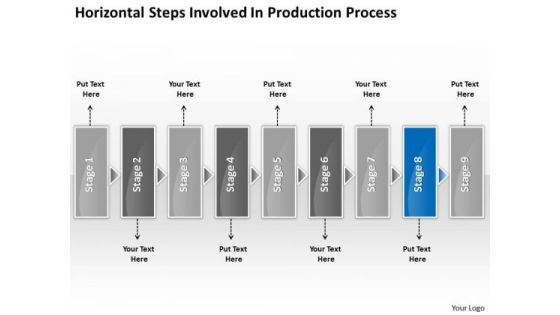
Horizontal Steps Involved Production Processs Business Fishbone Chart PowerPoint Templates
We present our horizontal steps involved production processs business fishbone chart PowerPoint templates.Download and present our Arrows PowerPoint Templates because this layout helps you to see satisfaction spread across the room as they unravel your gifted views. Use our Shapes PowerPoint Templates because you should take your team soaring to the pinnacle they crave. Present our Business PowerPoint Templates because this is the unerring accuracy in reaching the target. the effortless ability to launch into flight. Use our Boxes PowerPoint Templates because your listeners do not have to put on their thinking caps. Download our Communication PowerPoint Templates because you can gain the success to desired levels in one go.Use these PowerPoint slides for presentations relating to abstract, arrow, blank, business, chart, circular, circulation, concept, conceptual, design, diagram, executive, flow, horizontal, icon, idea, illustration, management, model, numbers, organization, process, progression, resource, sequence, stages, steps, strategy. The prominent colors used in the PowerPoint template are Blue, Gray, Black. The feedback we get is that our horizontal steps involved production processs business fishbone chart PowerPoint templates are Magnificent. PowerPoint presentation experts tell us our chart PowerPoint templates and PPT Slides are Elegant. People tell us our horizontal steps involved production processs business fishbone chart PowerPoint templates are Nice. Professionals tell us our circulation PowerPoint templates and PPT Slides are Colorful. You can be sure our horizontal steps involved production processs business fishbone chart PowerPoint templates are Fun. We assure you our concept PowerPoint templates and PPT Slides are designed by a team of presentation professionals.
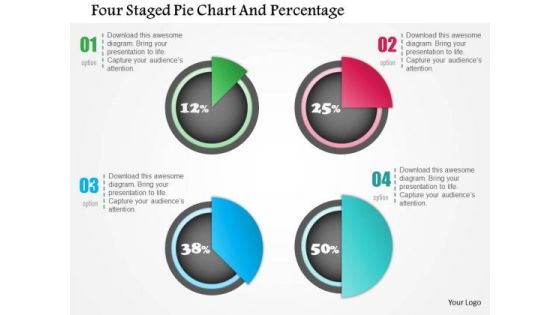
Business Diagram Four Staged Pie Chart And Percentage Presentation Template
Four staged pie chart and percentage values has been used to design this power point template. This PPT contains the concept of financial result analysis. Use this PPT for business and marketing related presentations.
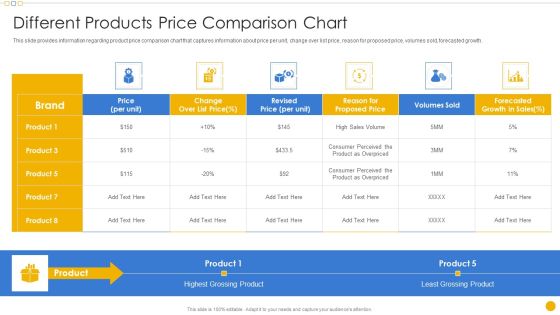
Sales Management Playbook Different Products Price Comparison Chart Professional PDF
This slide provides information regarding ideal customer profile that defines perfect customer fit to realize optimum value from product or solution rendered by identifying organizational concerns, pain points, value proposition, etc.Deliver and pitch your topic in the best possible manner with this Sales Management Playbook Different Products Price Comparison Chart Professional PDF Use them to share invaluable insights on Different Products Price Comparison Chart and impress your audience. This template can be altered and modified as per your expectations. So, grab it now.

Business Diagram Process Pyramids Bar Chart Business Slide Presentation Template
Graphic of pyramid and bar chart has been used to design this power point template diagram. This PPT diagram contains the concept of business result analysis and process flow. Use this template slide and display result in your presentations.

Monthly Task Planning Gantt Chart Ppt PowerPoint Presentation Portfolio Images
This is a monthly task planning gantt chart ppt powerpoint presentation portfolio images. This is a six stage process. The stages in this process are strategy plan, strategy objectives, strategy action.

Donut Pie Chart Product Finance Ppt PowerPoint Presentation Diagram Ppt
This is a donut pie chart product finance ppt powerpoint presentation diagram ppt. This is a three stage process. The stages in this process are finance, management, strategy, analysis, marketing.

Product Life Cycle Management Chart Ppt Slides Design
This is a product life cycle management chart ppt slides design. This is a eight stage process. The stages in this process are introduction, growth, decline, analyze, plan, source, design, insight.

Successive Demonstration Using Hands Production Planning Flow Chart PowerPoint Templates
We present our successive demonstration using hands production planning flow chart PowerPoint templates. Use our Symbol PowerPoint Templates because; In any endeavor people matter most. Use our Business PowerPoint Templates because, Marketing Strategy Business Template:- Maximizing sales of your product is the intended destination. Use our Metaphor PowerPoint Templates because; educate your staff on the means to provide the required support for speedy recovery. Use our Abstract PowerPoint Templates because; Use our creative template to lay down your views. Use our Process and Flows PowerPoint Templates because, Our PowerPoint templates designed for your ideas to sell. Use these PowerPoint slides for presentations relating to Description using hands steps, Business, Collection, Connection, Cursor, Decoration, Design, Dimensional, Direction, Element, Icon, Illustration, Information, Modern, Motion, Paper, Perspective, Plastic, Pointer, Pointing, Process, Recycle, Recycling, Reflective, Set, Shape, Shiny, Sign, Symbol, Technology. The prominent colors used in the PowerPoint template are Blue, Gray, and Black
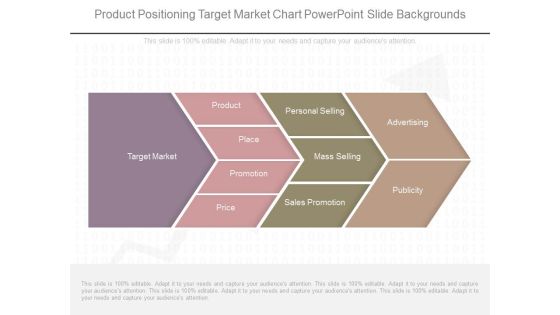
Product Positioning Target Market Chart Powerpoint Slide Backgrounds
This is a product positioning target market chart powerpoint slide backgrounds. This is a four stage process. The stages in this process are target market, product, place, promotion, price, personal selling, mass selling, sales promotion, advertising, publicity.

Design Development New Product Chart Good Ppt Example
This is a design development new product chart good ppt example. This is a six stage process. The stages in this process are idea generation, marketing strategy development, product development, idea screening, concept development and testing, test marketing.

Curve Chart For Product Life Cycle Presentation Outline
This is a curve chart for product life cycle presentation outline. This is a five stage process. The stages in this process are sales over time, product extension, introduction, growth, maturity, decline, time.
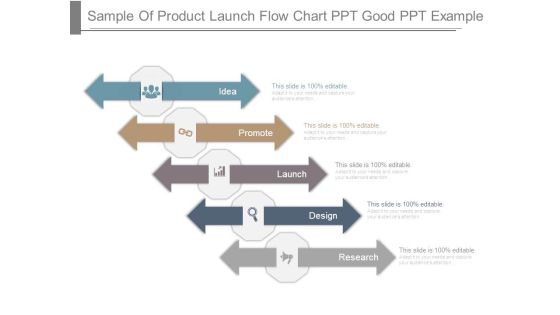
Sample Of Product Launch Flow Chart Ppt Good Ppt Example
This is a sample of product launch flow chart ppt good ppt example. This is a five stage process. The stages in this process are idea, promote, launch, design, research.

Our Product Vs Competition Analysis Chart Powerpoint Slide Background Designs
This is a our product vs competition analysis chart powerpoint slide background designs. This is a four stage process. The stages in this process are business, marketing, success, strategy, compare.

Area Chart Product Marketing Ppt PowerPoint Presentation Layouts Portfolio
This is a area chart product marketing ppt powerpoint presentation layouts portfolio. This is a three stage process. The stages in this process are business, management, strategy, analysis, marketing.

6 Phase Auditing Process Pie Chart Ppt PowerPoint Presentation Graphics
This is a 6 phase auditing process pie chart ppt powerpoint presentation graphics. This is a six stage process. The stages in this process are communicating results, following up, configuring parameters, establishing priority areas, determining process frequency.

Salesman Principles Playbook Different Products Price Comparison Chart Slides PDF
This slide provides information regarding product price comparison chart that captures information about price per unit, change over list price, reason for proposed price, volumes sold, forecasted growth. Deliver an awe inspiring pitch with this creative salesman principles playbook different products price comparison chart slides pdf bundle. Topics like weekly updates meets, monthly review meetings, quarterly review meetings can be discussed with this completely editable template. It is available for immediate download depending on the needs and requirements of the user.

Flow Chart Ppt PowerPoint Presentation File Infographic Template
This is a flow chart ppt powerpoint presentation file infographic template. This is a seven stage process. The stages in this process are start, define specifications, perform transaction, create collection plans, report and analyze results.
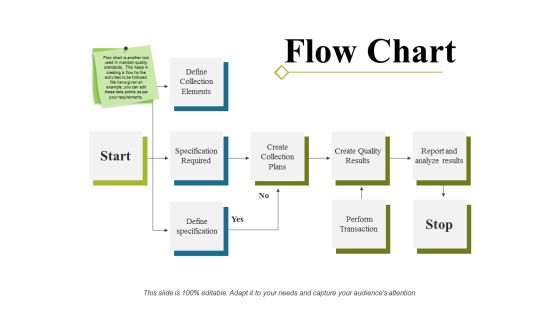
Flow Chart Ppt PowerPoint Presentation File Layout Ideas
This is a flow chart ppt powerpoint presentation file layout ideas. This is a four stage process. The stages in this process are define collection elements, specification required, define specification, create collection plans, create quality results, perform transaction.
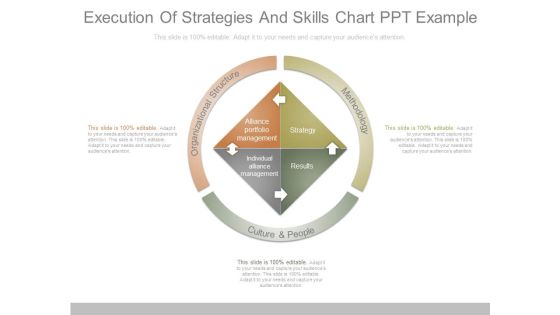
Execution Of Strategies And Skills Chart Ppt Example
This is a execution of strategies and skills chart ppt example. This is a three stage process. The stages in this process are methodology, culture and people, organizational structure, alliance portfolio management, strategy, individual alliance management, results.

Closed Loop Life Cycle Chart Powerpoint Slide Backgrounds
This is a closed loop life cycle chart powerpoint slide backgrounds. This is a seven stage process. The stages in this process are consumption and use, results, manufacturing, materials sourcing, distribution logistics, sale and retail, underlying assumption.
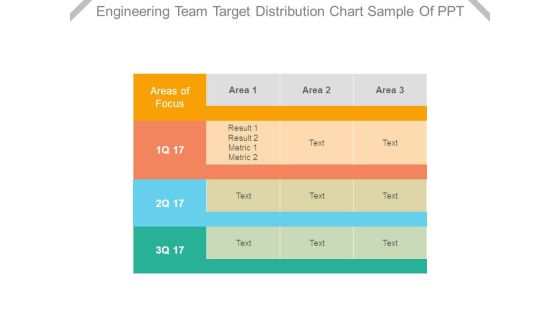
Engineering Team Target Distribution Chart Sample Of Ppt
This is a engineering team target distribution chart sample of ppt. This is a three stage process. The stages in this process are areas of focus, area, result, metric.

Ppt Slide Business Illustration Umbrella Chart Strategic Planning
Get The Domestics Right With Our PPT Slide business illustration umbrella chart strategic planning Powerpoint Templates. Create The Base For Thoughts To Grow. Do Away With Dogmatic Approaches. Establish The Value Of Reason With Our Business Plan Powerpoint Templates.
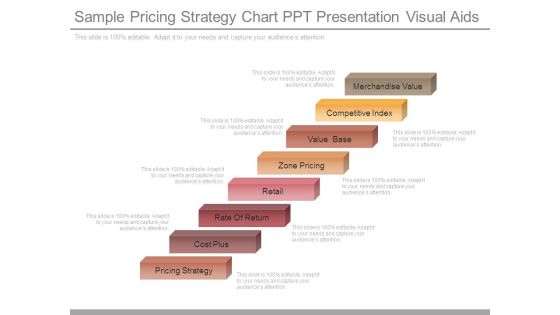
Sample Pricing Strategy Chart Ppt Presentation Visual Aids
This is a sample pricing strategy chart ppt presentation visual aids. This is a eight stage process. The stages in this process are merchandise value, competitive index, value base, zone pricing, retail, rate of return, cost plus, pricing strategy.
Five Circles Linear Chart With Icons Powerpoint Slides
Visually support your presentation with our above template containing five circles linear chart with icons. This diagram slide may be used for comparing contrasting different business objects. Etch your views in the brains of your audience with this diagram slide.

Company Product Sales Forecast Chart Ppt File Slide Portrait PDF
This slide shows the Product sales forecast table with Product names along with price per unit and total units sold for the current as well as the projected period till the year 2023. Deliver an awe inspiring pitch with this creative company product sales forecast chart ppt file slide portrait pdf bundle. Topics like company product sales forecast chart can be discussed with this completely editable template. It is available for immediate download depending on the needs and requirements of the user.

Stacked Bar Chart Ppt PowerPoint Presentation Inspiration Ideas
This is a stacked bar chart ppt powerpoint presentation inspiration ideas. This is a four stage process. The stages in this process are product, highest, business, marketing, bar graph.

Bar Chart Ppt PowerPoint Presentation Infographics Format Ideas
This is a bar chart ppt powerpoint presentation infographics format ideas. This is a two stage process. The stages in this process are bar graph, product, financial year, sales in percentage.
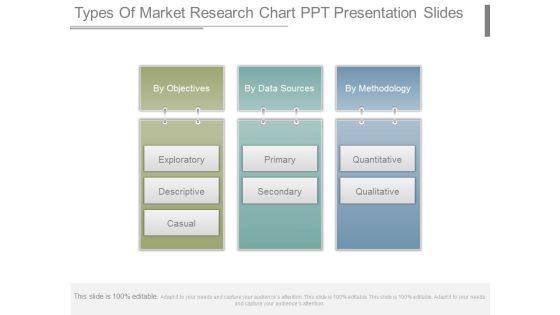
Types Of Market Research Chart Ppt Presentation Slides
This is a types of market research chart ppt presentation slides. This is a three stage process. The stages in this process are by objectives, exploratory, descriptive, causal, by data sources, primary, secondary, by methodology, quantitative, qualitative.
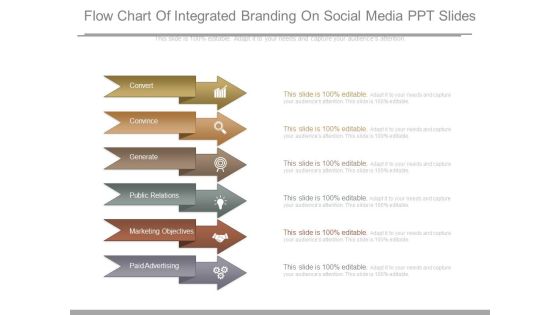
Flow Chart Of Integrated Branding On Social Media Ppt Slides
This is a flow chart of integrated branding on social media ppt slides. This is a six stage process. The stages in this process are convert, convince, generate, public relations, marketing objectives, paid advertising.
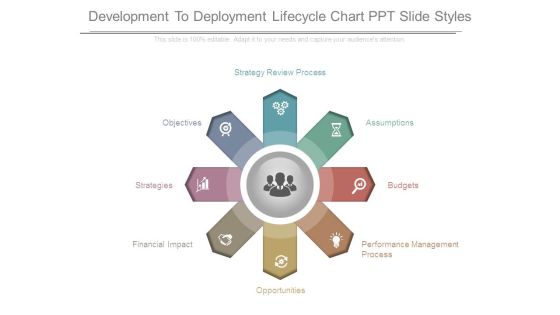
Development To Deployment Lifecycle Chart Ppt Slide Styles
This is a development to deployment lifecycle chart ppt slide styles. This is a eight stage process. The stages in this process are performance management process, opportunities, financial impact, strategies, objectives, strategy review process, assumptions, budgets.

Key Performance Indicators Pie Chart Powerpoint Slide Ideas
This is a key performance indicators pie chart powerpoint slide ideas. This is a four stage process. The stages in this process are focus, objectives, measures, targets, invites, vision and strategy, area of focus.
Market Trends Chart With Percentage And Icons Powerpoint Slides
This PowerPoint template has been designed with graphics of chart with percentage values and icons. This PowerPoint template may be used to market trends and financial analysis. Prove the viability of your ideas using this impressive slide.

Product Marketing Department Team Organizational Chart Icon Professional PDF
Persuade your audience using this Product Marketing Department Team Organizational Chart Icon Professional PDF. This PPT design covers three stages, thus making it a great tool to use. It also caters to a variety of topics including Team Organizational Chart Icon, Product Marketing Department. Download this PPT design now to present a convincing pitch that not only emphasizes the topic but also showcases your presentation skills.
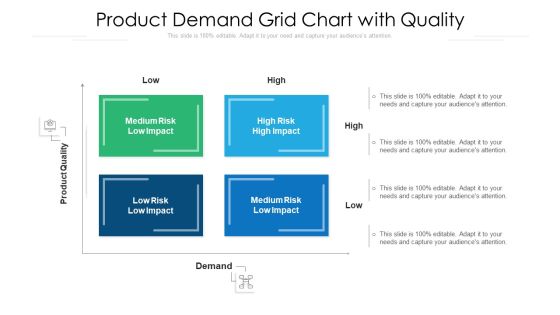
Product Demand Grid Chart With Quality Ppt Inspiration Maker PDF
Persuade your audience using this product demand grid chart with quality ppt inspiration maker pdf. This PPT design covers four stages, thus making it a great tool to use. It also caters to a variety of topics including product demand grid chart with quality. Download this PPT design now to present a convincing pitch that not only emphasizes the topic but also showcases your presentation skills.

Percentage Chart For Good Marketing Strategy Powerpoint Slides
This PowerPoint template has been designed with pie chart and percentage values. The PowerPoint template has a high quality design. You can download this PowerPoint slide to make good marketing strategy and business plans.

Five Factors Of Brand Equity Chart Presentation Images
This is a five factors of brand equity chart presentation images. This is a five stage process. The stages in this process are awareness, differentiation, consumer connection, accessibility, value. \n \n \n \n \n \n \n \n \n \n
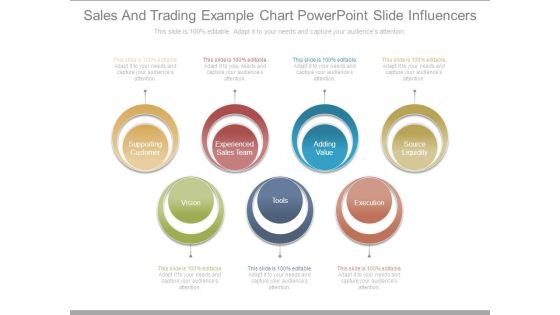
Sales And Trading Example Chart Powerpoint Slide Influencers
This is a sales and trading example chart powerpoint slide influencers. This is a seven stage process. The stages in this process are supporting customer, experienced sales team, adding value, source liquidity, vision, tools, execution.

Combo Chart Ppt PowerPoint Presentation Ideas Visual Aids
This is a combo chart ppt powerpoint presentation ideas visual aids. This is a three stage process. The stages in this process are product, sales, bar graph, business, marketing.

Column Chart Ppt PowerPoint Presentation Model Graphics Download
This is a column chart ppt powerpoint presentation model graphics download. This is a two stage process. The stages in this process are product, financial year, sales in percentage, bar graph, success.

Column Chart Ppt PowerPoint Presentation Gallery Slide Portrait
This is a column chart ppt powerpoint presentation gallery slide portrait. This is a two stage process. The stages in this process are sales in percentage, financial year, product, bar graph, growth.

Competitive Analysis Matrix Chart Ppt PowerPoint Presentation Portfolio Format Ideas
This is a competitive analysis matrix chart ppt powerpoint presentation portfolio format ideas. This is a six stage process. The stages in this process are our business, product quality, product fidelity, after sales service, customer service.

Competitive Analysis Template 8 Matrix Chart Ppt PowerPoint Presentation Templates
This is a competitive analysis template 8 matrix chart ppt powerpoint presentation templates. This is a six stage process. The stages in this process are our business, product quality, product fidelity, after sales service, customer service, price, shipping speed, competitor.

Competitive Analysis Matrix Chart Template 1 Ppt PowerPoint Presentation Deck
This is a competitive analysis matrix chart template 1 ppt powerpoint presentation deck. This is a six stage process. The stages in this process are product quality, product fidelity, after sales service, customer service, shipping speed.

Competitive Analysis Matrix Chart Ppt PowerPoint Presentation Gallery
This is a competitive analysis matrix chart ppt powerpoint presentation gallery. This is a seven stage process. The stages in this process are our business, product quality, product fidelity, after sales service, customer service, price, shipping speed.

Competitive Analysis Matrix Chart Ppt PowerPoint Presentation Inspiration
This is a competitive analysis matrix chart ppt powerpoint presentation inspiration. This is a six stage process. The stages in this process are product quality, product fidelity, after sales service, customer service, price, shipping speed.

 Home
Home