Goal Chart
Line Chart Ppt PowerPoint Presentation Icon Deck
This is a line chart ppt powerpoint presentation icon deck. This is a two stage process. The stages in this process are business, management, growth, product, finance.

Area Chart Ppt PowerPoint Presentation Icon Brochure
This is a area chart ppt powerpoint presentation icon brochure. This is a two stage process. The stages in this process are product, sales in percentage, growth, success.
Stock Chart Ppt PowerPoint Presentation Icon Microsoft
This is a stock chart ppt powerpoint presentation icon microsoft. This is a five stage process. The stages in this process are product, high, volume, low.
Line Chart Ppt PowerPoint Presentation Styles Icons
This is a line chart ppt powerpoint presentation styles icons. This is a three stage process. The stages in this process are profit, dollar, product, business, marketing.
Scatter Chart Ppt PowerPoint Presentation Icon Mockup
This is a scatter chart ppt powerpoint presentation icon mockup. This is a nine stage process. The stages in this process are product, in percentage, dollars, percentage, finance.
Stock Chart Ppt PowerPoint Presentation Inspiration Icon
This is a stock chart ppt powerpoint presentation inspiration icon. This is a two stage process. The stages in this process are high, volume, low, product, close.
Stock Chart Ppt PowerPoint Presentation Icon Format
This is a stock chart ppt powerpoint presentation icon format. This is a two stage process. The stages in this process are product, close, high, volume, low.
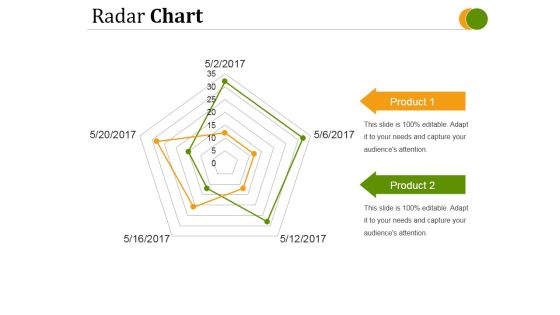
Radar Chart Ppt PowerPoint Presentation Pictures
This is a radar chart ppt powerpoint presentation pictures. This is a two stage process. The stages in this process are product, business, management, marketing, strategy.

Column Chart Ppt PowerPoint Presentation Show Shapes
This is a column chart ppt powerpoint presentation show shapes. This is a two stage process. The stages in this process are sales, product, business, management, finance.
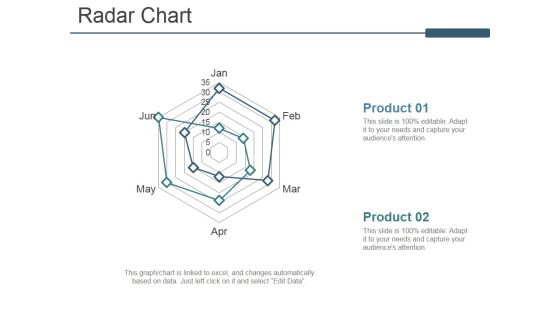
Radar Chart Ppt PowerPoint Presentation Model Graphics
This is a radar chart ppt powerpoint presentation model graphics. This is a two stage process. The stages in this process are product, business, marketing, process, success.

Area Chart Ppt PowerPoint Presentation Inspiration Aids
This is a area chart ppt powerpoint presentation inspiration aids. This is a two stage process. The stages in this process are in percentage, product, business, marketing, strategy.

Rader Chart Ppt PowerPoint Presentation Good
This is a rader chart ppt powerpoint presentation good. This is a five stage process. The stages in this process are business, marketing, product, management, planning.

Area Chart Ppt PowerPoint Presentation Templates
This is a area chart ppt powerpoint presentation templates. This is a two stage process. The stages in this process are product, business, management, strategy, marketing, planning.

Column Chart Ppt PowerPoint Presentation Layout
This is a column chart ppt powerpoint presentation layout. This is a two stage process. The stages in this process are product, business, management, strategy, marketing, planning.

Combo Chart Ppt PowerPoint Presentation Professional
This is a combo chart ppt powerpoint presentation professional. This is a three stage process. The stages in this process are product, business, management, strategy, marketing, planning.

Column Chart Ppt PowerPoint Presentation Infographics Portrait
This is a column chart ppt powerpoint presentation infographics portrait. This is a two stage process. The stages in this process are product, year, time planning, business, step.
Organization Chart For Small Business Ppt Example
This is a organization chart for small business ppt example. This is a four stage process. The stages in this process are development, sales, management, production.
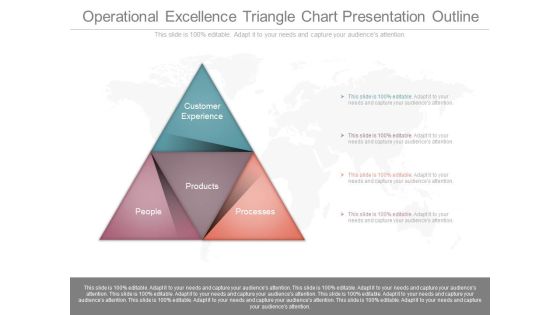
Operational Excellence Triangle Chart Presentation Outline
This is a operational excellence triangle chart presentation outline. This is a four stage process. The stages in this process are customer experience, products, processes, people.

Sales Performance Measures Chart Ppt Sample
This is a sales performance measures chart ppt sample. This is a three stage process. The stages in this process are product, relationship, service, sales.

Business Organizational Chart Powerpoint Templates Download
This is a business organizational chart powerpoint templates download. This is a four stage process. The stages in this process are marketing, sales, production, finance.
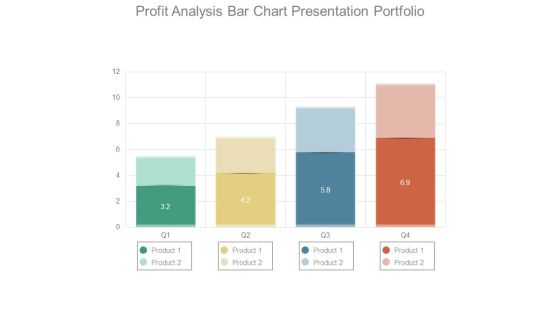
Profit Analysis Bar Chart Presentation Portfolio
This is a profit analysis bar chart presentation portfolio. This is a four stage process. The stages in this process are product.

Area Chart Ppt PowerPoint Presentation Graphics
This is a area chart ppt powerpoint presentation graphics. This is a two stage process. The stages in this process are business, marketing, management, product, finance.

Scatter Chart Ppt PowerPoint Presentation Slides
This is a scatter chart ppt powerpoint presentation slides. This is a five stage process. The stages in this process are product, in dollars, in percentage.

Radar Chart Ppt PowerPoint Presentation Slide Download
This is a radar chart ppt powerpoint presentation slide download. This is a two stage process. The stages in this process are product, strategy, business, marketing, management.

Radar Chart Ppt PowerPoint Presentation Template
This is a radar chart ppt powerpoint presentation template. This is a two stage process. The stages in this process are product, marketing, business, shape.

Line Chart Ppt PowerPoint Presentation Model
This is a line chart ppt powerpoint presentation model. This is a two stage process. The stages in this process are in percentage, product, business.
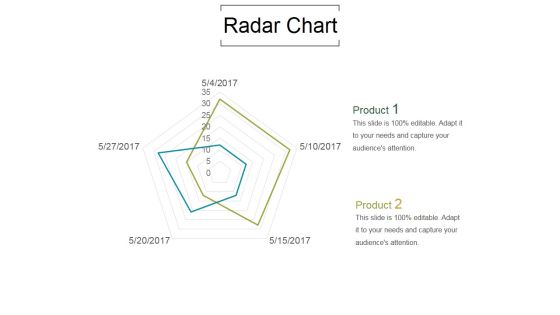
Radar Chart Ppt PowerPoint Presentation Samples
This is a radar chart ppt powerpoint presentation samples. This is a two stage process. The stages in this process are product, marketing, business.

Area Chart Ppt PowerPoint Presentation Designs
This is a area chart ppt powerpoint presentation designs. This is a two stage process. The stages in this process are product, graph, in percentage, growth, business.
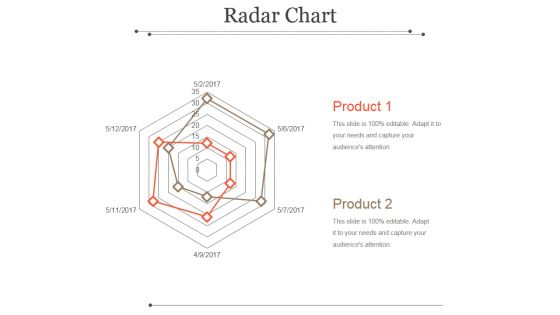
Radar Chart Ppt PowerPoint Presentation Show
This is a radar chart ppt powerpoint presentation show. This is a two stage process. The stages in this process are product, management, business, marketing.

Line Chart Ppt PowerPoint Presentation Example
This is a line chart ppt powerpoint presentation example. This is a two stage process. The stages in this process are product, in percentage, business, marketing.
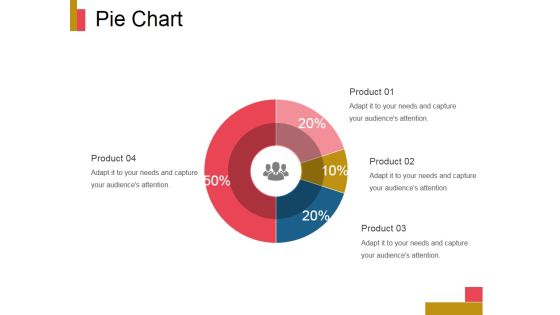
Pie Chart Ppt PowerPoint Presentation Design Ideas
This is a pie chart ppt powerpoint presentation design ideas. This is a four stage process. The stages in this process are product, finance, business, marketing, pie.

Area Chart Ppt PowerPoint Presentation Rules
This is a area chart ppt powerpoint presentation rules. This is a two stage process. The stages in this process are business, management, product, growth.
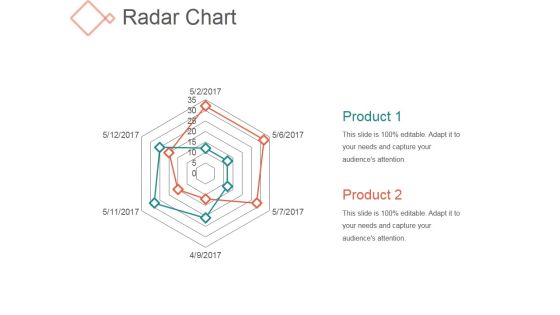
Radar Chart Ppt PowerPoint Presentation Influencers
This is a radar chart ppt powerpoint presentation influencers. This is a two stage process. The stages in this process are business, marketing, product, shapes.

Area Chart Ppt PowerPoint Presentation Summary Example
This is a area chart ppt powerpoint presentation summary example. This is a two stage process. The stages in this process are financial year, in percentage, product.

Radar Chart Ppt PowerPoint Presentation Show Sample
This is a radar chart ppt powerpoint presentation show sample. This is a five stage process. The stages in this process are product, business, marketing, shapes.

Area Chart Ppt PowerPoint Presentation Show Portfolio
This is a area chart ppt powerpoint presentation show portfolio. This is a two stage process. The stages in this process are business, product, finance, growth, management.

Column Chart Ppt PowerPoint Presentation Inspiration Visuals
This is a column chart ppt powerpoint presentation inspiration visuals. This is a nine stage process. The stages in this process are business, marketing, product, expenditure.

Combo Chart Ppt PowerPoint Presentation Pictures Layouts
This is a combo chart ppt powerpoint presentation pictures layouts. This is a eight stage process. The stages in this process are product, growth rate, market size, years.

Pie Chart Ppt PowerPoint Presentation Professional Introduction
This is a pie chart ppt powerpoint presentation professional introduction. This is a five stage process. The stages in this process are product, finance, pie, process, business.

Radar Chart Ppt PowerPoint Presentation Model Tips
This is a radar chart ppt powerpoint presentation model tips. This is a five stage process. The stages in this process are product, business, marketing, shapes.

Area Chart Ppt PowerPoint Presentation Gallery Inspiration
This is a area chart ppt powerpoint presentation gallery inspiration. This is a two stage process. The stages in this process are product, growth, success, graph, finance.

Combo Chart Ppt PowerPoint Presentation File Model
This is a combo chart ppt powerpoint presentation file model. This is a eight stage process. The stages in this process are product, year, market size, business, marketing.

Area Chart Ppt PowerPoint Presentation Pictures Visuals
This is a area chart ppt powerpoint presentation pictures visuals. This is a two stage process. The stages in this process are product, business, finance, marketing.

Radar Chart Ppt PowerPoint Presentation Slides Graphics
This is a radar chart ppt powerpoint presentation slides graphics. This is a two stage process. The stages in this process are product, shapes, management, business, marketing.
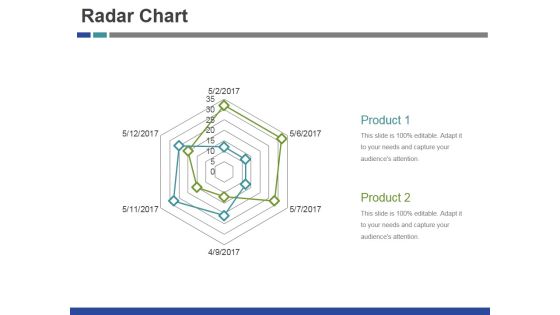
Radar Chart Ppt PowerPoint Presentation Outline Vector
This is a radar chart ppt powerpoint presentation outline vector. This is a six stage process. The stages in this process are product, business, marketing, shapes.

Scatter Chart Ppt PowerPoint Presentation Inspiration Brochure
This is a scatter chart ppt powerpoint presentation inspiration brochure. This is a two stage process. The stages in this process are product, growth, success, business.

Column Chart Ppt PowerPoint Presentation Styles Vector
This is a column chart ppt powerpoint presentation styles vector. This is a six stage process. The stages in this process are growth, success, business, marketing, product.

Line Chart Ppt PowerPoint Presentation Pictures Maker
This is a line chart ppt powerpoint presentation pictures maker. This is a two stage process. The stages in this process are financial years, product, growth, success.
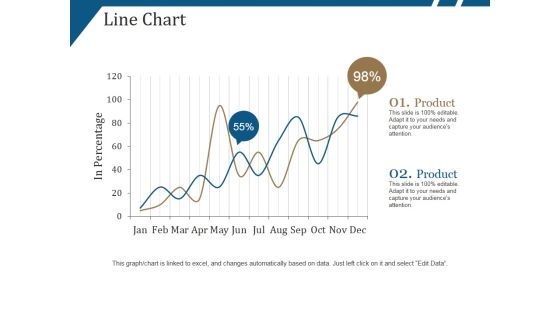
Line Chart Ppt PowerPoint Presentation Portfolio Show
This is a line chart ppt powerpoint presentation portfolio show. This is a two stage process. The stages in this process are product, in percentage, growth, success.
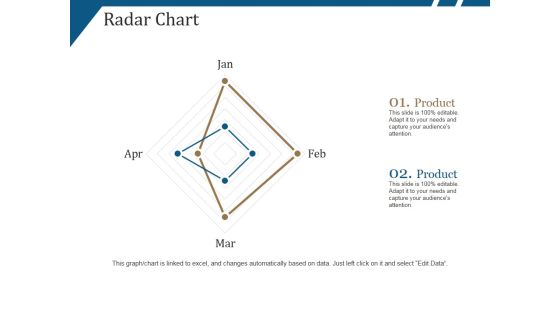
Radar Chart Ppt PowerPoint Presentation Layouts Summary
This is a radar chart ppt powerpoint presentation layouts summary. This is a four stage process. The stages in this process are product, business, marketing, shapes.

Scatter Chart Ppt PowerPoint Presentation Summary Deck
This is a scatter chart ppt powerpoint presentation summary deck. This is a nine stage process. The stages in this process are product, sales in percentage, growth, success.

Radar Chart Ppt PowerPoint Presentation Model Picture
This is a radar chart ppt powerpoint presentation model picture. This is a six stage process. The stages in this process are product, finance marketing, business, management, analysis.

Column Chart Ppt PowerPoint Presentation Portfolio Background
This is a column chart ppt powerpoint presentation portfolio background. This is a nine stage process. The stages in this process are product, expenditure, growth, success, business.

Combo Chart Ppt PowerPoint Presentation Ideas Brochure
This is a combo chart ppt powerpoint presentation ideas brochure. This is a four stage process. The stages in this process are product, profit, growth, success, business.

Radar Chart Ppt PowerPoint Presentation Show Demonstration
This is a radar chart ppt powerpoint presentation show demonstration. This is a two stage process. The stages in this process are product, shape, business, marketing.

Area Chart Ppt PowerPoint Presentation Gallery Brochure
This is a area chart ppt powerpoint presentation gallery brochure. This is a two stage process. The stages in this process are product, growth in percentage, success, business.

Radar Chart Ppt PowerPoint Presentation Summary Skills
This is a radar chart ppt powerpoint presentation summary skills. This is a two stage process. The stages in this process are product, shape, business, marketing.
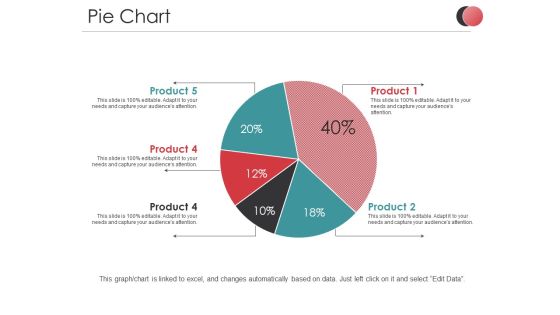
Pie Chart Ppt PowerPoint Presentation Slides Files
This is a pie chart ppt powerpoint presentation slides files. This is a five stage process. The stages in this process are product, percentage, business, marketing, process.

Column Chart Ppt PowerPoint Presentation Show Visuals
This is a column chart ppt powerpoint presentation show visuals. This is a two stage process. The stages in this process are product, year, success, step, business.

Radar Chart Ppt PowerPoint Presentation Layouts Elements
This is a radar chart ppt powerpoint presentation layouts elements. This is a three stage process. The stages in this process are product, shapes, business, marketing.

Line Chart Ppt PowerPoint Presentation Portfolio Shapes
This is a line chart ppt powerpoint presentation portfolio shapes. This is a two stage process. The stages in this process are profit, product, business, marketing, graph.
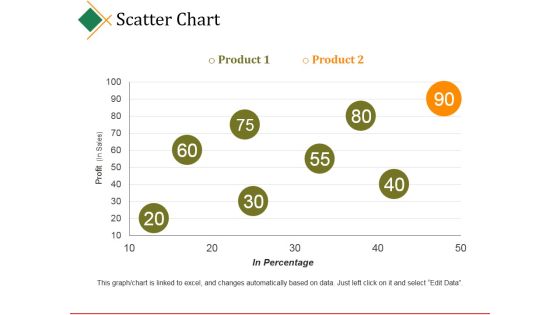
Scatter Chart Ppt PowerPoint Presentation Model
This is a scatter chart ppt powerpoint presentation model. This is a two stage process. The stages in this process are business, product, profit, in percentage, business.
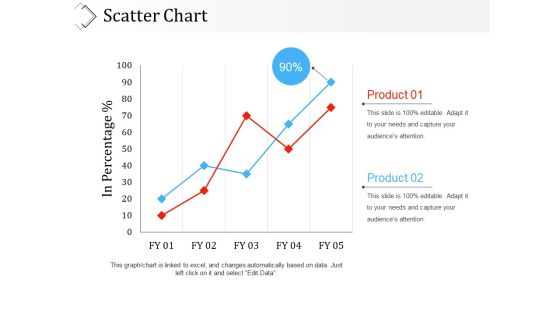
Scatter Chart Ppt PowerPoint Presentation Outline Picture
This is a scatter chart ppt powerpoint presentation outline picture. This is a two stage process. The stages in this process are in percentage, business, marketing, product, graph.

Column Chart Ppt PowerPoint Presentation Ideas Inspiration
This is a column chart ppt powerpoint presentation ideas inspiration. This is a five stage process. The stages in this process are graph, year, business, marketing, product.

Line Chart Ppt PowerPoint Presentation Pictures Ideas
This is a line chart ppt powerpoint presentation pictures ideas. This is a two stage process. The stages in this process are in millions, percentage, finance, product, growth.

Scatter Chart Ppt PowerPoint Presentation Gallery Vector
This is a scatter chart ppt powerpoint presentation gallery vector. This is a nine stage process. The stages in this process are in percentage, dollars, product, percentage, finance.
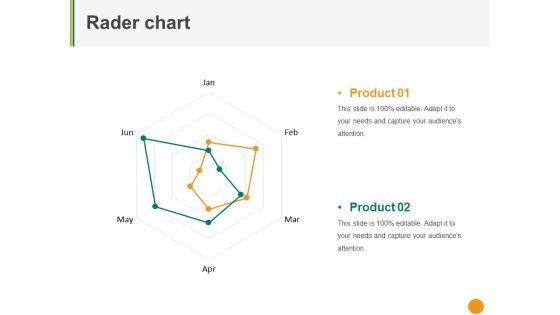
Rader Chart Ppt PowerPoint Presentation Professional Pictures
This is a rader chart ppt powerpoint presentation professional pictures. This is a two stage process. The stages in this process are product, finance, business, marketing.

Bar Chart Ppt PowerPoint Presentation Summary Pictures
This is a bar chart ppt powerpoint presentation summary pictures. This is a four stage process. The stages in this process are product, unit count, finance, percentage, business.
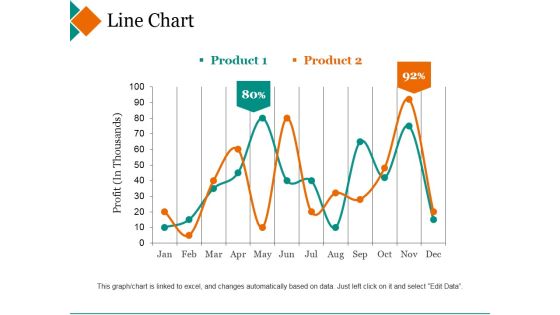
Line Chart Ppt PowerPoint Presentation Inspiration Deck
This is a line chart ppt powerpoint presentation inspiration deck. This is a two stage process. The stages in this process are product, profit, percentage, finance, line graph.
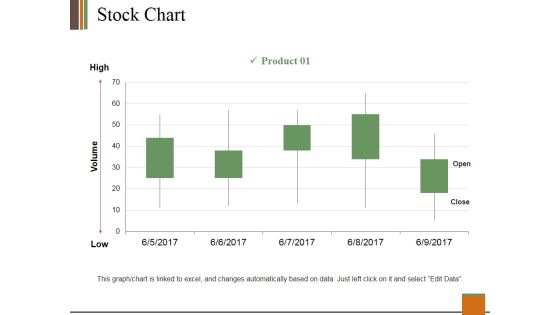
Stock Chart Ppt PowerPoint Presentation Slides Clipart
This is a stock chart ppt powerpoint presentation slides clipart. This is a one stage process. The stages in this process are product, high, volume, low, open, close.
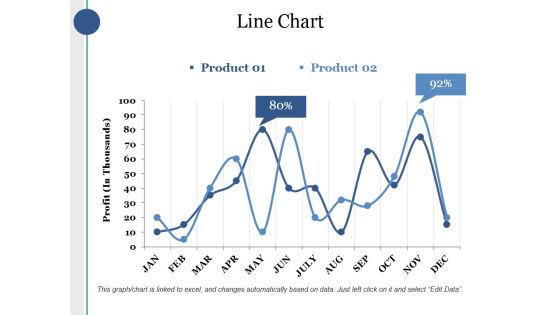
Line Chart Ppt PowerPoint Presentation Layouts Sample
This is a line chart ppt powerpoint presentation layouts sample. This is a two stage process. The stages in this process are product, profit, percentage, finance, business.
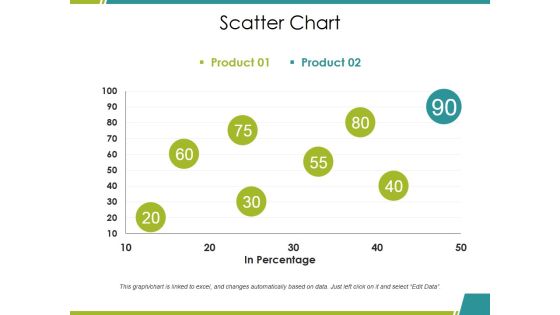
Scatter Chart Ppt PowerPoint Presentation Summary Inspiration
This is a scatter chart ppt powerpoint presentation summary inspiration. This is a two stage process. The stages in this process are product, in percentage, growth, success, business.

Pie Chart Ppt PowerPoint Presentation Inspiration Summary
This is a pie chart ppt powerpoint presentation inspiration summary. This is a five stage process. The stages in this process are product, donut, business, percentage, marketing.

Pie Chart Ppt PowerPoint Presentation Layouts Elements
This is a pie chart ppt powerpoint presentation layouts elements. This is a four stage process. The stages in this process are product, business, marketing, percentage, growth.

Scatter Chart Ppt PowerPoint Presentation File Visuals
This is a scatter chart ppt powerpoint presentation file visuals. This is a two stage process. The stages in this process are product, profit, in percentage, growth, success.
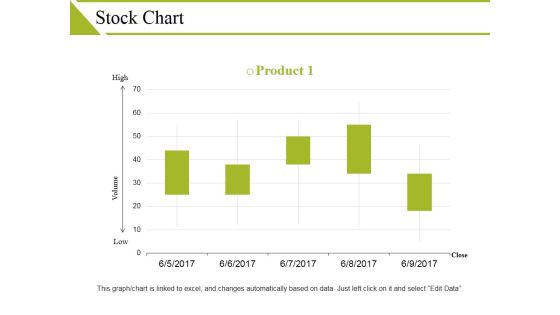
Stock Chart Ppt PowerPoint Presentation Show Guidelines
This is a stock chart ppt powerpoint presentation show guidelines. This is a one stage process. The stages in this process are high, volume, low, product, close.

Radar Chart Ppt PowerPoint Presentation Infographics Portfolio
This is a radar chart ppt powerpoint presentation infographics portfolio. This is a two stage process. The stages in this process are product, finance, shapes, business, marketing.

Area Chart Ppt PowerPoint Presentation Show Backgrounds
This is a area chart ppt powerpoint presentation show backgrounds. This is a two stage process. The stages in this process are financial year, product, in percentage.

Area Chart Ppt PowerPoint Presentation Pictures Designs
This is a area chart ppt powerpoint presentation pictures designs. This is a two stage process. The stages in this process are product, sales in percentage, growth, success.

Line Chart Ppt PowerPoint Presentation Pictures Layout
This is a line chart ppt powerpoint presentation pictures layout. This is a two stage process. The stages in this process are product, financial years, sales in percentage.

Area Chart Ppt PowerPoint Presentation Professional Grid
This is a area chart ppt powerpoint presentation professional grid. This is a two stage process. The stages in this process are product, sales in percentage, business.

Bar Chart Ppt PowerPoint Presentation Portfolio Inspiration
This is a bar chart ppt powerpoint presentation portfolio inspiration. This is a two stage process. The stages in this process are product, in percentage, in years.

Line Chart Ppt PowerPoint Presentation Layouts Templates
This is a line chart ppt powerpoint presentation layouts templates. This is a two stage process. The stages in this process are product, in percentage, in years.

Stock Chart Ppt PowerPoint Presentation Guide
This is a stock chart ppt powerpoint presentation guide. This is a two stage process. The stages in this process are product, close, high, volume, low.

Column Chart Ppt PowerPoint Presentation Show Outfit
This is a column chart ppt powerpoint presentation show outfit. This is a two stage process. The stages in this process are product, percentage, marketing.

Combo Chart Ppt PowerPoint Presentation File Example
This is a combo chart ppt powerpoint presentation file example. This is a three stage process. The stages in this process are product, percentage, marketing, business, management.

Combo Chart Ppt PowerPoint Presentation Model Grid
This is a combo chart ppt powerpoint presentation model grid. This is a three stage process. The stages in this process are growth, product, percentage, marketing.

Line Chart Ppt PowerPoint Presentation Summary Guidelines
This is a line chart ppt powerpoint presentation summary guidelines. This is a two stage process. The stages in this process are percentage, product, business, management, marketing.

Stock Chart Ppt PowerPoint Presentation Show Pictures
This is a stock chart ppt powerpoint presentation show pictures. This is a five stage process. The stages in this process are product, percentage, management, marketing.

Pie Chart Ppt PowerPoint Presentation Model Smartart
This is a pie chart ppt powerpoint presentation model smartart. This is a five stage process. The stages in this process are management, marketing, business, percentage, product.

Column Chart Ppt PowerPoint Presentation Ideas Example
This is a column chart ppt powerpoint presentation ideas example. This is a five stage process. The stages in this process are percentage, product, management, marketing.

Company Product Sales Forecast Chart Topics PDF
Deliver and pitch your topic in the best possible manner with this company product sales forecast chart topics pdf. Use them to share invaluable insights on company product sales forecast chart and impress your audience. This template can be altered and modified as per your expectations. So, grab it now.
Production Flow Process Chart Icon Template PDF
Pitch your topic with ease and precision using this Production Flow Process Chart Icon Template PDF. This layout presents information on Production Flow, Process Chart Icon. It is also available for immediate download and adjustment. So, changes can be made in the color, design, graphics or any other component to create a unique layout.
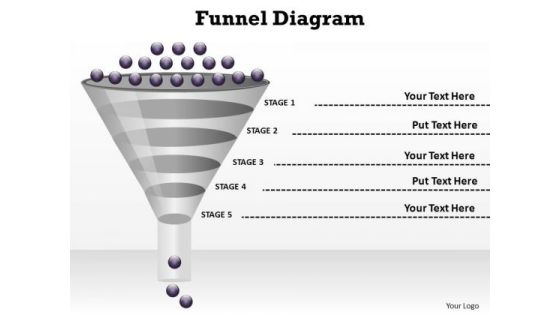
PowerPoint Templates Chart Funnel Diagram Ppt Backgrounds
PowerPoint Templates Chart Funnel Diagram PPT Backgrounds-Pyramids are truly wonders of the world. Thus a wonderful graphic to impress your audience with your business/professional ideas that are broad based but funnel or narrow down to specific groups, issues or goals. Reach the peak with this graphic.-These amazing PowerPoint pre-designed slides and PowerPoint templates have been carefully created by our team of experts to help you impress your audience. Our stunning collection of Powerpoint slides are 100% editable and can easily fit in any PowerPoint presentations. By using these animations and graphics in PowerPoint and you can easily make professional presentations. Any text can be entered at any point in the PowerPoint template or slide. Just DOWNLOAD our awesome PowerPoint templates and you are ready to go.
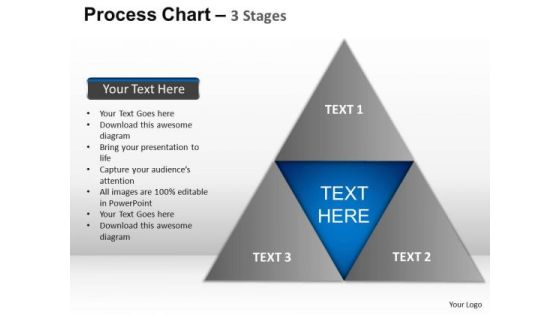
PowerPoint Slides Teamwork Process Chart Ppt Designs
PowerPoint Slides Teamwork Process Chart PPT Designs Business Power Points-Pyramids are truly wonders of the world. Thus a wonderful graphic to impress your audience with your business/professional ideas that are broad based but funnel or narrow down to specific groups, issues or goals. Reach the peak with this graphic.-These amazing PowerPoint pre-designed slides and PowerPoint templates have been carefully created by our team of experts to help you impress your audience. Our stunning collection of Powerpoint slides are 100% editable and can easily fit in any PowerPoint presentations. By using these animations and graphics in PowerPoint and you can easily make professional presentations. Any text can be entered at any point in the PowerPoint template or slide. Just DOWNLOAD our awesome PowerPoint templates and you are ready to go.

Competitor Analysis Chart Ppt PowerPoint Presentation Visuals
This is a competitor analysis chart ppt powerpoint presentation visuals. This is a five stage process. The stages in this process are revenue, profit, market share, main activity, number of employee, product quality.

PowerPoint Slides Pyramid Process Chart Ppt Theme
PowerPoint Slides pyramid Process Chart PPT Theme-This Pyramid Diagram may be defined as representation of data in the form of a triangle separated by horizontal lines. The widest section may contain the general topic while the narrowest section may contain a much more specific topic-business, chart, color, concept, conceptual, construction, corporate, creating, data, design, diagram, direction, focus, graph, group, growth, hierarchy, illustration, information, isolated, layer, layered, level, manage, management, model, object, organization, performance, population, presentation, principal, process, progress, pyramid, rank, resource, shape, stage, structure, support, symbol, top, triangle, vector-PowerPoint Slides pyramid Process Chart PPT Theme
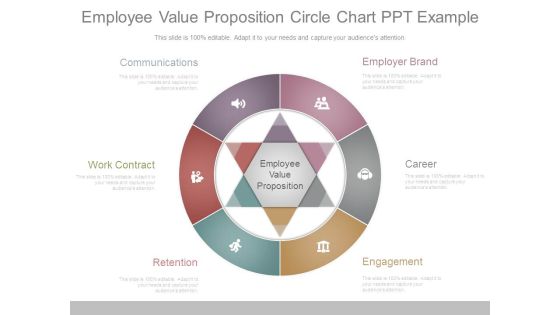
Employee Value Proposition Circle Chart Ppt Example
This is a employee value proposition circle chart ppt example. This is a six stage process. The stages in this process are employer brand, career, engagement, retention, work contract, communications.
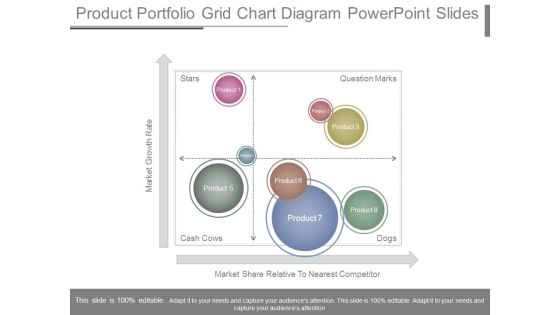
Product Portfolio Grid Chart Diagram Powerpoint Slides
This is a product portfolio grid chart diagram powerpoint slides. This is a four stage process. The stages in this process are market growth rate, market share relative to nearest competitor, stars, cash cows, dogs, question marks, product.

Product Planning Process Chart Presentation Diagrams
This is a product planning process chart presentation diagrams. This is a eight stage process. The stages in this process are product plan, idea generation, technical roadmap, implementation options, product screening, development, high level vision, product analysis.
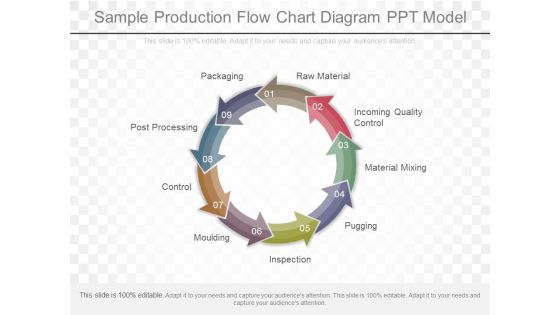
Sample Production Flow Chart Diagram Ppt Model
This is a sample production flow chart diagram ppt model. This is a nine stage process. The stages in this process are raw material, incoming quality control, material mixing, pugging, inspection, moulding, control, post processing, packaging.
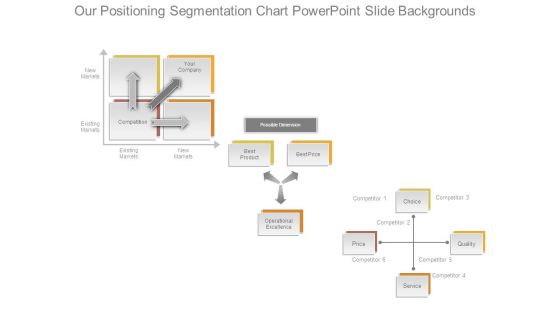
Our Positioning Segmentation Chart Powerpoint Slide Backgrounds
This is a our positioning segmentation chart powerpoint slide backgrounds. This is a three stage process. The stages in this process are new markets, existing markets, your company, competition, possible dimension, best product, operational excellence, service, price, choice.

Sipoc Process Infogarphic Chart Powerpoint Slide Influencers
This is a sipoc process infogarphic chart powerpoint slide influencers. This is a five stage process. The stages in this process are suppliers, input, process, output, customer, start, finish, sipoc.
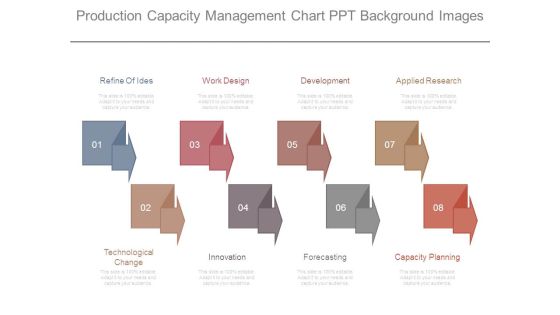
Production Capacity Management Chart Ppt Background Images
This is a production capacity management chart ppt background images. This is a eight stage process. The stages in this process are refine of ides, work design, development, applied research, technological change, innovation, forecasting, capacity planning.
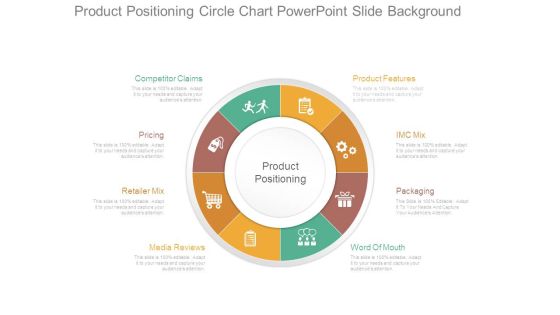
Product Positioning Circle Chart Powerpoint Slide Background
This is a product positioning circle chart powerpoint slide background. This is a eight stage process. The stages in this process are competitor claims, pricing, retailer mix, media reviews, product positioning, product features, imc mix, packaging, word of mouth.
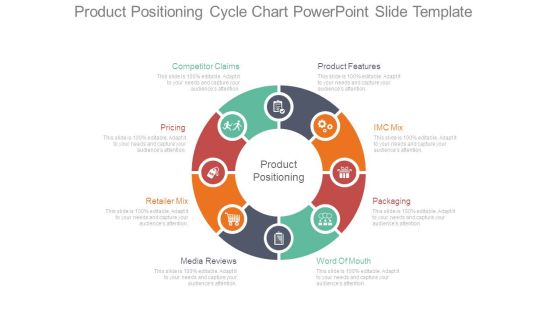
Product Positioning Cycle Chart Powerpoint Slide Template
This is a product positioning cycle chart powerpoint slide template. This is a eight stage process. The stages in this process are product features, imc mix, packaging, word of mouth, media reviews, retailer mix, pricing, competitor claims, product positioning.
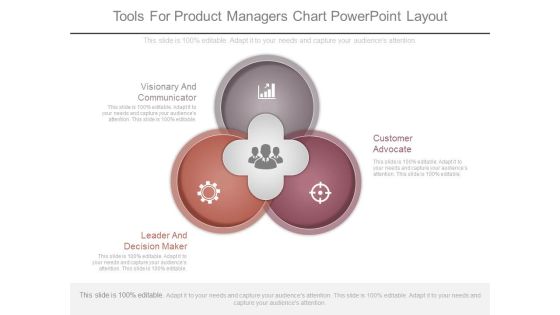
Tools For Product Managers Chart Powerpoint Layout
This is a tools for product managers chart powerpoint layout. This is a three stage process. The stages in this process are visionary and communicator, leader and decision maker, customer advocate.

Business To Business Sales Chart Presentation Images
This is a business to business sales chart presentation images. This is a six stage process. The stages in this process are your business, marketing, reactive existing customers, culture, reach new customers, sales.

Company Product Sales Forecast Chart Icons PDF
This slide shows the Product sales forecast table with Product names along with price per unit and total units sold for the current as well as the projected period till the year 2023. Deliver an awe inspiring pitch with this creative company product sales forecast chart icons pdf bundle. Topics like company product sales forecast chart can be discussed with this completely editable template. It is available for immediate download depending on the needs and requirements of the user.

Company Product Sales Forecast Chart Download PDF
This slide shows the Product sales forecast table with Product names along with price per unit and total units sold for the current as well as the projected period till the year 2023. Deliver an awe inspiring pitch with this creative company product sales forecast chart download pdf bundle. Topics like company product sales forecast chart can be discussed with this completely editable template. It is available for immediate download depending on the needs and requirements of the user.
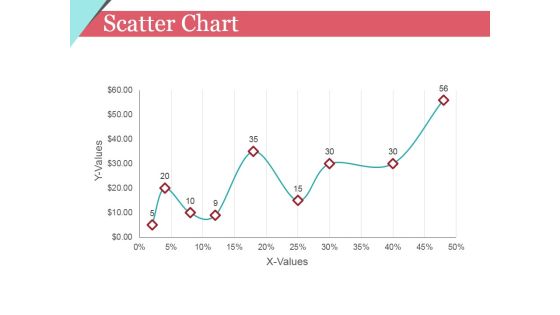
Scatter Chart Ppt PowerPoint Presentation Model Template
This is a scatter chart ppt powerpoint presentation model template. This is a nine stage process. The stages in this process are x values, y values, graph, growth, success.

Bar Chart Ppt PowerPoint Presentation Icon Demonstration
This is a bar chart ppt powerpoint presentation icon demonstration. This is a seven stage process. The stages in this process are product, sales in percentage, financial year, graph.

Effectively Integrating Systems Chart Ppt Sample
This is a effectively integrating systems chart ppt sample. This is a four stage process. The stages in this process are action, insight, coordination, result, behavior, knowledge, aligned incentives.\n\n\n\n\n\n\n\n\n\n\n\n\n\n\n\n\n\n

Banking Operations Management Chart Good Ppt Example
This is a banking operations management chart good ppt example. This is a seven stage process. The stages in this process are results, accountability, focused action, commitment, roles and responsibilities, communication and collaboration, trust.

Category Management Training Chart Ppt Slides Styles
This is a category management training chart ppt slides styles. This is a four stage process. The stages in this process are category prioritization and assessment, result tracking and reporting, category strategy development, supplier relationship.
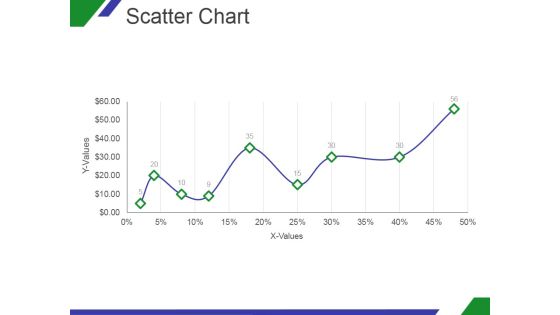
Scatter Chart Ppt PowerPoint Presentation Designs Download
This is a scatter chart ppt powerpoint presentation designs download. This is a nine stage process. The stages in this process are x values, y values, graph, growth, success.

Bar Chart Ppt PowerPoint Presentation Outline Backgrounds
This is a bar chart ppt powerpoint presentation outline backgrounds. This is a one stage process. The stages in this process are sales in percentage, financial years, product, bar graph, finance.

Comprehensive Competition Analysis Chart Ppt Example
This is a comprehensive competition analysis chart ppt example. This is a four stage process. The stages in this process are competitors objectives, competitors strategy, competitors capabilities, competitors assumptions.
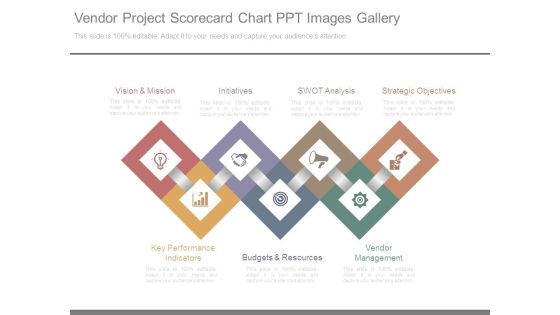
Vendor Project Scorecard Chart Ppt Images Gallery
This is a vendor project scorecard chart ppt images gallery. This is a seven stage process. The stages in this process are vision and mission, initiatives, swot analysis, strategic objectives, vendor management, budgets and resources, key performance indicators.

Column Chart For Financial Analysis Powerpoint Slides
This PowerPoint template has been designed with graphics of column chart with percentage values. You may use this business slide design for topics like financial analysis and planning. This PPT slide is powerful tool to describe your ideas.

 Home
Home