Gauge
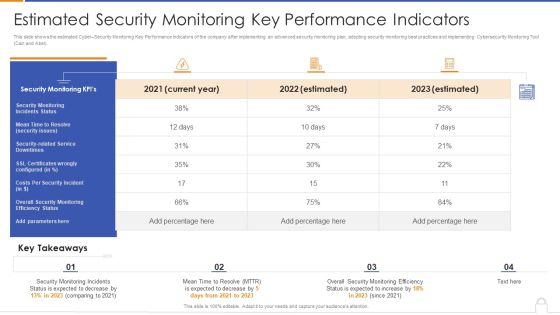
Estimated Security Monitoring Key Performance Indicators Diagrams PDF
Deliver and pitch your topic in the best possible manner with this estimated security monitoring key performance indicators diagrams pdf. Use them to share invaluable insights on security monitoring, security related service downtimes, overall security monitoring and impress your audience. This template can be altered and modified as per your expectations. So, grab it now.

Key Performance Indicators Related To Upsell Structure PDF
Deliver an awe inspiring pitch with this creative key performance indicators related to upsell structure pdf bundle. Topics like product manufactured, target can be discussed with this completely editable template. It is available for immediate download depending on the needs and requirements of the user.
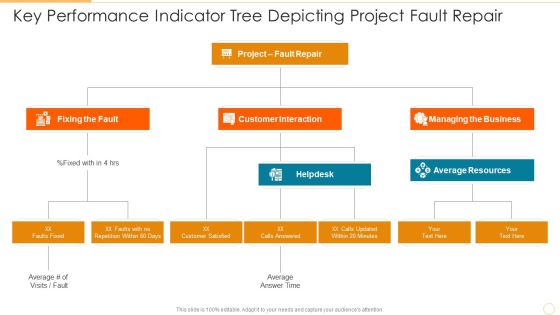
Key Performance Indicator Tree Depicting Project Fault Repair Diagrams PDF
Presenting key performance indicator tree depicting project fault repair diagrams pdf to dispense important information. This template comprises three stages. It also presents valuable insights into the topics including customer interaction, managing the business, fixing the fault. This is a completely customizable PowerPoint theme that can be put to use immediately. So, download it and address the topic impactfully.
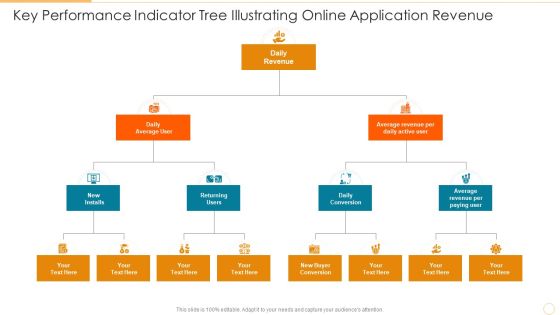
Key Performance Indicator Tree Illustrating Online Application Revenue Download PDF
Presenting key performance indicator tree illustrating online application revenue download pdf to dispense important information. This template comprises three stages. It also presents valuable insights into the topics including daily conversion, returning users, daily revenue. This is a completely customizable PowerPoint theme that can be put to use immediately. So, download it and address the topic impactfully.

Financial Statement Indicating Company Book Value Mockup PDF
Showcasing this set of slides titled financial statement indicating company book value mockup pdf. The topics addressed in these templates are book value statement, assets, liabilities. All the content presented in this PPT design is completely editable. Download it and make adjustments in color, background, font etc. as per your unique business setting.

Key Performance Indicators Of The Company Ppt Professional Skills PDF
Deliver and pitch your topic in the best possible manner with this key performance indicators of the company ppt professional skills pdf. Use them to share invaluable insights on gross profit, turnover, gross profit margin, operating profit and impress your audience. This template can be altered and modified as per your expectations. So, grab it now.

Corporate Identity Icon Indicating Business Card And Letterhead Diagrams PDF
Presenting Corporate Identity Icon Indicating Business Card And Letterhead Diagrams PDF to dispense important information. This template comprises four stages. It also presents valuable insights into the topics including Business, Letterhead, Corporate. This is a completely customizable PowerPoint theme that can be put to use immediately. So, download it and address the topic impactfully.

Analysis Architecture Indicating Business Impact On Economic Development Background PDF
Pitch your topic with ease and precision using this Analysis Architecture Indicating Business Impact On Economic Development Background PDF. This layout presents information on Profitability Increases, Economy Witnesses, Existing Businesses. It is also available for immediate download and adjustment. So, changes can be made in the color, design, graphics or any other component to create a unique layout.
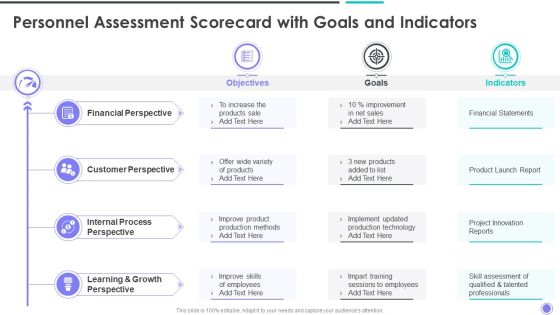
Personnel Assessment Scorecard With Goals And Indicators Microsoft PDF
Deliver and pitch your topic in the best possible manner with this Personnel Assessment Scorecard With Goals And Indicators Microsoft PDF. Use them to share invaluable insights on Financial Perspective, Customer Perspective, Internal Process and impress your audience. This template can be altered and modified as per your expectations. So, grab it now.

2023 Business Calendar Indicating Business Meeting Agenda Download PDF
Presenting 2023 Business Calendar Indicating Business Meeting Agenda Download PDF to dispense important information. This template comprises tweleve stages. It also presents valuable insights into the topics including Marketing Meeting, Market Opportunities, Check Goal Status. This is a completely customizable PowerPoint theme that can be put to use immediately. So, download it and address the topic impactfully.

2023 Business Calendar Indicating Project Management Planning Brochure PDF
Presenting 2023 Business Calendar Indicating Project Management Planning Brochure PDF to dispense important information. This template comprises one stages. It also presents valuable insights into the topics including Design Specifications, Finalize Budget Report, Develop Cost. This is a completely customizable PowerPoint theme that can be put to use immediately. So, download it and address the topic impactfully.

Sales Operating Cycle Key Performance Indicators Professional PDF
Presenting Sales Operating Cycle Key Performance Indicators Professional PDF to dispense important information. This template comprises three stages. It also presents valuable insights into the topics including Sales Comparison, Lead Conversation, Quality Product. This is a completely customizable PowerPoint theme that can be put to use immediately. So, download it and address the topic impactfully.
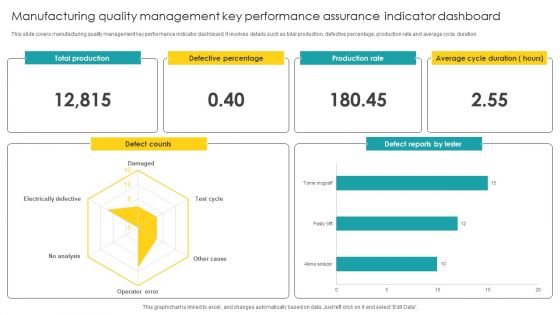
Manufacturing Quality Management Key Performance Assurance Indicator Dashboard Microsoft PDF
Pitch your topic with ease and precision using this Manufacturing Quality Management Key Performance Assurance Indicator Dashboard Microsoft PDF. This layout presents information on Quality Management, Key Performance Assurance. It is also available for immediate download and adjustment. So, changes can be made in the color, design, graphics or any other component to create a unique layout.

Framework Indicating Bdd Automated Testing Design Ppt Gallery Ideas PDF
This slide showcase framework indicating BDD test automation design which can be referred by analysts who want to streamline the process of making changes in the system through advanced methods. It includes information about product owners, business analysts, self service catalogue, database, files, mainframe, developers, etc. Persuade your audience using this Framework Indicating Bdd Automated Testing Design Ppt Gallery Ideas PDF. This PPT design covers four stages, thus making it a great tool to use. It also caters to a variety of topics including Example Data, Data Table, Product Owners, Business Analysts. Download this PPT design now to present a convincing pitch that not only emphasizes the topic but also showcases your presentation skills.

Key Performance Indicators Highlighting Yearly Business Performance Portrait PDF
This slide includes key components such as website visit, blog traffic, conversion rate, social share, click through rate, etc. which help businesses to measure website performance, number of customer converted and retained to estimate current situation of business. Create an editable Key Performance Indicators Highlighting Yearly Business Performance Portrait PDF that communicates your idea and engages your audience. Whether you are presenting a business or an educational presentation, pre designed presentation templates help save time. Key Performance Indicators Highlighting Yearly Business Performance Portrait PDF is highly customizable and very easy to edit, covering many different styles from creative to business presentations. Slidegeeks has creative team members who have crafted amazing templates. So, go and get them without any delay.

Vehicle Maintenance Dashboard Indicating Trips And Compliances Structure PDF
This slide showcases dashboard which can help fleet managers in carefully monitoring their vehicle status. It provides details about vehicle conditions, free vehicles, moving vehicles, insurance, permit, license validity, trip alerts, etc. Here you can discover an assortment of the finest PowerPoint and Google Slides templates. With these templates, you can create presentations for a variety of purposes while simultaneously providing your audience with an eye-catching visual experience. Download Vehicle Maintenance Dashboard Indicating Trips And Compliances Structure PDF to deliver an impeccable presentation. These templates will make your job of preparing presentations much quicker, yet still, maintain a high level of quality. Slidegeeks has experienced researchers who prepare these templates and write high-quality content for you. Later on, you can personalize the content by editing the Vehicle Maintenance Dashboard Indicating Trips And Compliances Structure PDF.

Analyzing Brands Key Financial Indicators Ppt Infographic Template Slides PDF
This slide showcases assessing key indicators for measuring financial performance of brand. It provides details about turnover, marketing costs, sales, administrative expenses, profit, percentage turnover, trade debtor days, headcount, etc. Are you in need of a template that can accommodate all of your creative concepts This one is crafted professionally and can be altered to fit any style. Use it with Google Slides or PowerPoint. Include striking photographs, symbols, depictions, and other visuals. Fill, move around, or remove text boxes as desired. Test out color palettes and font mixtures. Edit and save your work, or work with colleagues. Download Analyzing Brands Key Financial Indicators Ppt Infographic Template Slides PDF and observe how to make your presentation outstanding. Give an impeccable presentation to your group and make your presentation unforgettable.
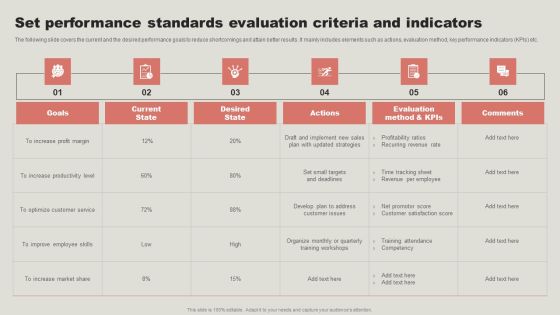
Set Performance Standards Evaluation Criteria And Indicators Brochure PDF
The following slide covers the current and the desired performance goals to reduce shortcomings and attain better results. It mainly includes elements such as actions, evaluation method, key performance indicators KPIs etc. Welcome to our selection of the Set Performance Standards Evaluation Criteria And Indicators Brochure PDF. These are designed to help you showcase your creativity and bring your sphere to life. Planning and Innovation are essential for any business that is just starting out. This collection contains the designs that you need for your everyday presentations. All of our PowerPoints are 100 percent editable, so you can customize them to suit your needs. This multi purpose template can be used in various situations. Grab these presentation templates today.

Performance Indicators For Successful Client Onboarding Demonstration PDF
This slide showcases KPIs that showcases success of user onboarding. Major KPIs included are customer engagement, retention and count, average response time, completion and free trial conversion rate. Do you have to make sure that everyone on your team knows about any specific topic I yes, then you should give Performance Indicators For Successful Client Onboarding Demonstration PDF a try. Our experts have put a lot of knowledge and effort into creating this impeccable Performance Indicators For Successful Client Onboarding Demonstration PDF. You can use this template for your upcoming presentations, as the slides are perfect to represent even the tiniest detail. You can download these templates from the Slidegeeks website and these are easy to edit. So grab these today.

Performance Indicators For Effective Traditional Marketing Ppt Show Influencers PDF
This slide showcases key metrics of traditional media for marketers. Major indicators covered are cost per lead, customer retention, marketing ROI. Sales revenue, customer lifetime value and website traffic. Coming up with a presentation necessitates that the majority of the effort goes into the content and the message you intend to convey. The visuals of a PowerPoint presentation can only be effective if it supplements and supports the story that is being told. Keeping this in mind our experts created Performance Indicators For Effective Traditional Marketing Ppt Show Influencers PDF to reduce the time that goes into designing the presentation. This way, you can concentrate on the message while our designers take care of providing you with the right template for the situation.
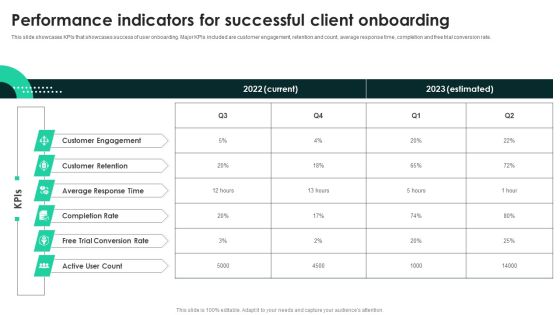
Performance Indicators For Successful Client Onboarding Themes PDF
This slide showcases KPIs that showcases success of user onboarding. Major KPIs included are customer engagement, retention and count, average response time, completion and free trial conversion rate. If you are looking for a format to display your unique thoughts, then the professionally designed Performance Indicators For Successful Client Onboarding Themes PDF is the one for you. You can use it as a Google Slides template or a PowerPoint template. Incorporate impressive visuals, symbols, images, and other charts. Modify or reorganize the text boxes as you desire. Experiment with shade schemes and font pairings. Alter, share or cooperate with other people on your work. Download Performance Indicators For Successful Client Onboarding Themes PDF and find out how to give a successful presentation. Present a perfect display to your team and make your presentation unforgettable.

Annual Financial Key Performance Indicators Before RPA Download PDF
This slide covers current annual financial indicators of organization before the implementation of automation. It includes gross margin, return on sales, equity ratio, dynamic gearing, changes in unit sales, operating profit, cash flow, inventory turnover, return on equity before tax, etc. Slidegeeks is one of the best resources for PowerPoint templates. You can download easily and regulate Annual Financial Key Performance Indicators Before RPA Download PDF for your personal presentations from our wonderful collection. A few clicks is all it takes to discover and get the most relevant and appropriate templates. Use our Templates to add a unique zing and appeal to your presentation and meetings. All the slides are easy to edit and you can use them even for advertisement purposes.

Current Scenario Of Organizations Operational Performance Indicators Professional PDF
This slide showcases the present situation of technical and operational performance parameters. It includes KPIs such as average downtime cost, safety incidents rate, utilization rate, quality rate, customer satisfaction rating etc Whether you have daily or monthly meetings, a brilliant presentation is necessary. Current Scenario Of Organizations Operational Performance Indicators Professional PDF can be your best option for delivering a presentation. Represent everything in detail using Current Scenario Of Organizations Operational Performance Indicators Professional PDF and make yourself stand out in meetings. The template is versatile and follows a structure that will cater to your requirements. All the templates prepared by Slidegeeks are easy to download and edit. Our research experts have taken care of the corporate themes as well. So, give it a try and see the results.

Addressing Communication Tools Output And Result Indicators Infographics PDF
This slide provides information regarding different communication tools such as website, email, media tools output and result indicators associated to them. Are you in need of a template that can accommodate all of your creative concepts This one is crafted professionally and can be altered to fit any style. Use it with Google Slides or PowerPoint. Include striking photographs, symbols, depictions, and other visuals. Fill, move around, or remove text boxes as desired. Test out color palettes and font mixtures. Edit and save your work, or work with colleagues. Download Addressing Communication Tools Output And Result Indicators Infographics PDF and observe how to make your presentation outstanding. Give an impeccable presentation to your group and make your presentation unforgettable.

Evaluation For Success Indicators In Stakeholder Assessment Guidelines PDF
This slide covers the stakeholders assessment success measure with evaluation areas, methods, sources of information, success looks like, etc.Deliver and pitch your topic in the best possible manner with this evaluation for success indicators in stakeholder assessment guidelines pdf. Use them to share invaluable insights on stakeholder category, weekly issues resolved, support for pm at quarterly reviews and impress your audience. This template can be altered and modified as per your expectations. So, grab it now.
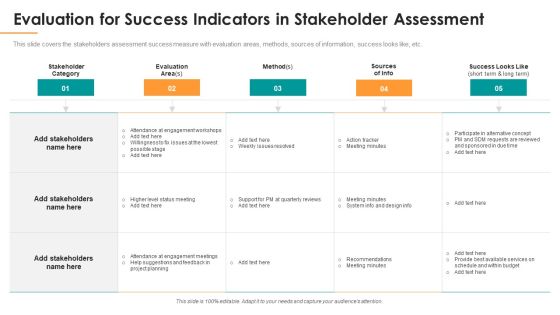
Evaluation For Success Indicators In Stakeholder Assessment Formats PDF
This slide covers the stakeholders assessment success measure with evaluation areas, methods, sources of information, success looks like, etc. Deliver an awe inspiring pitch with this creative evaluation for success indicators in stakeholder assessment formats pdf bundle. Topics like stakeholder category, evaluation area, project planning can be discussed with this completely editable template. It is available for immediate download depending on the needs and requirements of the user.
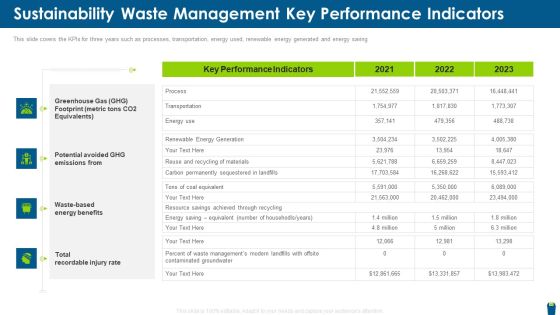
Sustainability Waste Management Key Performance Indicators Summary PDF
This slide covers the KPIs for three years such as processes, transportation, energy used, renewable energy generated and energy saving. Deliver an awe inspiring pitch with this creative sustainability waste management key performance indicators summary pdf bundle. Topics like metric, equivalent, rate, management, performance can be discussed with this completely editable template. It is available for immediate download depending on the needs and requirements of the user.
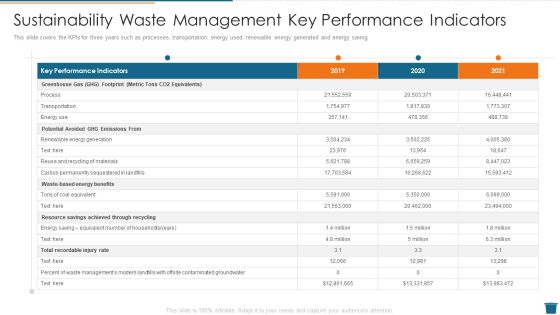
Sustainability Waste Management Key Performance Indicators Inspiration PDF
This slide covers the KPIs for three years such as processes, transportation, energy used, renewable energy generated and energy saving Deliver and pitch your topic in the best possible manner with this sustainability waste management key performance indicators inspiration pdf. Use them to share invaluable insights on recycling of materials, achieved, potential and impress your audience. This template can be altered and modified as per your expectations. So, grab it now.
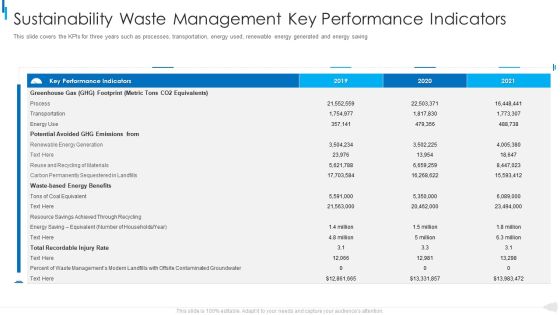
MSW Management Sustainability Waste Management Key Performance Indicators Download PDF
This slide covers the KPIs for three years such as processes, transportation, energy used, renewable energy generated and energy saving. Deliver and pitch your topic in the best possible manner with this MSW Management Sustainability Waste Management Key Performance Indicators Download Pdf. Use them to share invaluable insights on greenhouse, potential avoided, recordable and impress your audience. This template can be altered and modified as per your expectations. So, grab it now.

Product Launch Goals And Performance Indicators Guidelines PDF
This slides shows table to specify measurable, observable and time specific goals such as revenue generated, subscribers gained etc. This is a product launch goals and performance indicators guidelines pdf template with various stages. Focus and dispense information on one stages using this creative set, that comes with editable features. It contains large content boxes to add your information on topics like revenue, goal, customer retention. You can also showcase facts, figures, and other relevant content using this PPT layout. Grab it now.
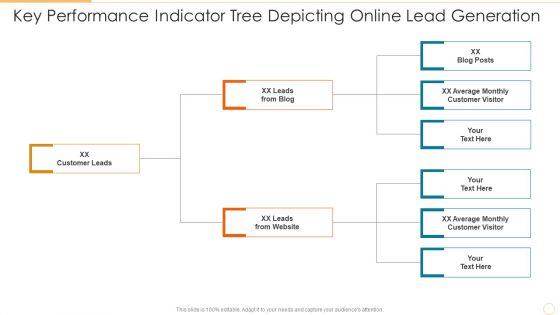
Key Performance Indicator Tree Depicting Online Lead Generation Information PDF
Persuade your audience using this key performance indicator tree depicting online lead generation information pdf. This PPT design covers three stages, thus making it a great tool to use. It also caters to a variety of topics including customer leads, leads from blog, leads from website. Download this PPT design now to present a convincing pitch that not only emphasizes the topic but also showcases your presentation skills.

Key Performance Indicator Tree For Application Performance Management Background PDF
Persuade your audience using this key performance indicator tree for application performance management background pdf. This PPT design covers six stages, thus making it a great tool to use. It also caters to a variety of topics including collaboration platforms, competency development, knowledge management programmers. Download this PPT design now to present a convincing pitch that not only emphasizes the topic but also showcases your presentation skills.
Project Key Performance Indicator Tree Illustrating Customer Satisfaction Icons PDF
Persuade your audience using this project key performance indicator tree illustrating customer satisfaction icons pdf. This PPT design covers four stages, thus making it a great tool to use. It also caters to a variety of topics including total customer complaints, total customer notifications, customer satisfaction project. Download this PPT design now to present a convincing pitch that not only emphasizes the topic but also showcases your presentation skills.

Digital Dashboard Indicating Insurance Agent Sales Performance Portrait PDF
This slide illustrates insurance agent sales performance digital dashboard. It provides information about total proposals, policies, accident, claims, sales revenue, rewards, etc. Pitch your topic with ease and precision using this Digital Dashboard Indicating Insurance Agent Sales Performance Portrait PDF. This layout presents information on Sales Revenue, Reward And Recognition. It is also available for immediate download and adjustment. So, changes can be made in the color, design, graphics or any other component to create a unique layout.
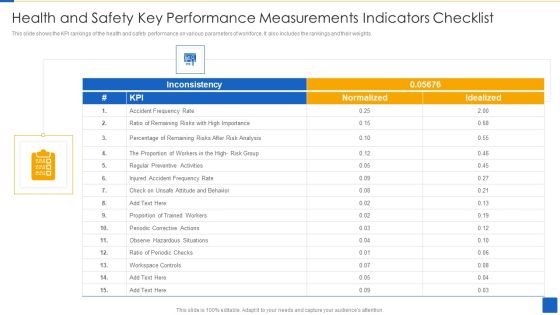
Health And Safety Key Performance Measurements Indicators Checklist Brochure PDF
This slide shows the KPI rankings of the health and safety performance on various parameters of workforce. It also includes the rankings and their weights. Pitch your topic with ease and precision using this Health And Safety Key Performance Measurements Indicators Checklist Brochure PDF This layout presents information on Injured Accident, Inconsistency, Proportion Trained Workers It is also available for immediate download and adjustment. So, changes can be made in the color, design, graphics or any other component to create a unique layout.
HR Dashboard Indicating Weekly Professional Counselling Kpis Icons PDF
This slide illustrates HR career counselling dashboard. It provides information about hours of consultation, satisfaction rate, per consultant rate, popular counselors, etc. Showcasing this set of slides titled HR Dashboard Indicating Weekly Professional Counselling Kpis Icons PDF. The topics addressed in these templates are Specialization, Hours Of Consultation, Popular Counselors. All the content presented in this PPT design is completely editable. Download it and make adjustments in color, background, font etc. as per your unique business setting.

Finance Metrics Dashboard Indicating Portfolio Performance Microsoft PDF
This graph or chart is linked to excel, and changes automatically based on data. Just left click on it and select edit data. Pitch your topic with ease and precision using this Finance Metrics Dashboard Indicating Portfolio Performance Microsoft PDF. This layout presents information on Portfolio Performance Portfolio, Asset Management Manager, Top 10 Assets. It is also available for immediate download and adjustment. So, changes can be made in the color, design, graphics or any other component to create a unique layout.
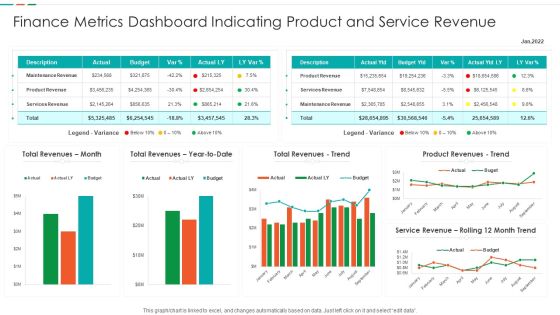
Finance Metrics Dashboard Indicating Product And Service Revenue Designs PDF
This graph or chart is linked to excel, and changes automatically based on data. Just left click on it and select edit data. Showcasing this set of slides titled Finance Metrics Dashboard Indicating Product And Service Revenue Designs PDF. The topics addressed in these templates are Maintenance Revenue Product, Revenue Product Revenues, Service Revenue Rolling. All the content presented in this PPT design is completely editable. Download it and make adjustments in color, background, font etc. as per your unique business setting.

Finance Metrics Dashboard Indicating Short Term Assets Download PDF
This graph or chart is linked to excel, and changes automatically based on data. Just left click on it and select edit data. Pitch your topic with ease and precision using this Finance Metrics Dashboard Indicating Short Term Assets Download PDF. This layout presents information on Short Term Assets, Global Financial Performance, Revenue YTD 2022. It is also available for immediate download and adjustment. So, changes can be made in the color, design, graphics or any other component to create a unique layout.

Key Performance Indicators For Smarketing Ppt Icon Graphic Images PDF
This slide shows various KPIs which can be used to measure marketing and sales alignment. These are overall revenue, sales cycle length, marketing qualified leads, etc. Presenting Key Performance Indicators For Smarketing Ppt Icon Graphic Images PDF to dispense important information. This template comprises one stages. It also presents valuable insights into the topics including KPIs, Overall Revenue, Sales Cycle Length. This is a completely customizable PowerPoint theme that can be put to use immediately. So, download it and address the topic impactfully.

Comparative Assessment Based On Procurement Target Financial Indicators Icons PDF
This slide represents comparative analysis for acquisition target key financial parameters. It includes growth, probability, leverage, size and liquidity.Showcasing this set of slides titled Comparative Assessment Based On Procurement Target Financial Indicators Icons PDF. The topics addressed in these templates are Companies, Growth, Profitability. All the content presented in this PPT design is completely editable. Download it and make adjustments in color, background, font etc. as per your unique business setting.

Company Financial Accounting Key Performance Indicators Ppt Slides PDF
This slide shows the key metrics of finance used in every organization. It includes profitability, liquidity, leverage, efficiency and valuation ratios. Presenting Company Financial Accounting Key Performance Indicators Ppt Slides PDF to dispense important information. This template comprises five stages. It also presents valuable insights into the topics including Profitability, Liquidity, Leverage. This is a completely customizable PowerPoint theme that can be put to use immediately. So, download it and address the topic impactfully.
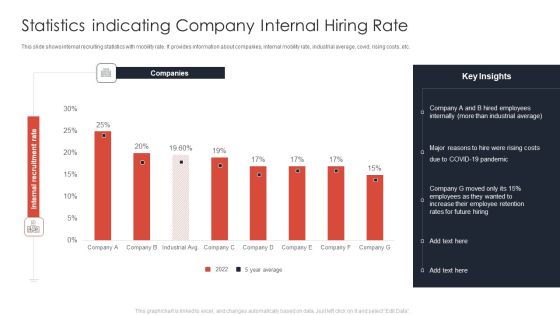
Statistics Indicating Company Internal Hiring Rate Ppt Ideas Templates PDF
This slide shows internal recruiting statistics with mobility rate. It provides information about companies, internal mobility rate, industrial average, covid, rising costs, etc. Showcasing this set of slides titled Statistics Indicating Company Internal Hiring Rate Ppt Ideas Templates PDF. The topics addressed in these templates are Companies, Employees Internally, COVID 19 Pandemic. All the content presented in this PPT design is completely editable. Download it and make adjustments in color, background, font etc. as per your unique business setting.

Key Equity Indicators Of Brand M And A Summary PDF
This slide showcases brand M andA equity factors to be considered prior merger. It depicts ratings for key factors which includes positioning, competitive edge, loyalty, awareness and association and purpose. Showcasing this set of slides titled Key Equity Indicators Of Brand M And A Summary PDF. The topics addressed in these templates are Positioning, Loyalty, Purpose. All the content presented in this PPT design is completely editable. Download it and make adjustments in color, background, font etc. as per your unique business setting.
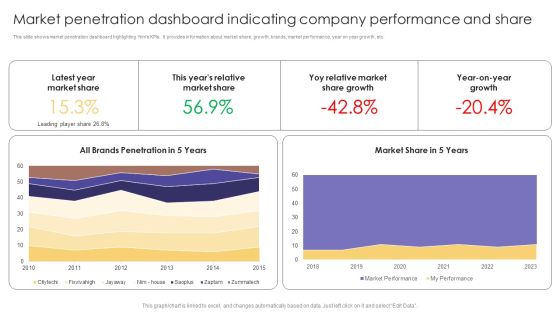
Market Penetration Dashboard Indicating Company Performance And Share Formats PDF
This slide shows market penetration dashboard highlighting firms KPIs. It provides information about market share, growth, brands, market performance, year on year growth, etc. Showcasing this set of slides titled Market Penetration Dashboard Indicating Company Performance And Share Formats PDF. The topics addressed in these templates are Latest Year, Market Share, Market Share Growth. All the content presented in this PPT design is completely editable. Download it and make adjustments in color, background, font etc. as per your unique business setting.

Asset Assessment Dashboard Indicating Revenue And Productivity Infographics PDF
This slide showcases asset valuation dashboard highlighting company revenue and productivity index. It provides information about geographical evaluation, development cost, commercial cost, etc.Pitch your topic with ease and precision using this Asset Assessment Dashboard Indicating Revenue And Productivity Infographics PDF. This layout presents information on Projected Development, Productivity Index, Geographical Evaluation. It is also available for immediate download and adjustment. So, changes can be made in the color, design, graphics or any other component to create a unique layout.
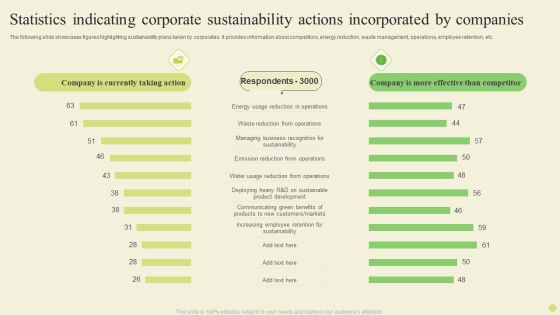
Statistics Indicating Corporate Sustainability Actions Incorporated By Companies Diagrams PDF
The following slide showcases figures highlighting sustainability plans taken by corporates. It provides information about competitors, energy reduction, waste management, operations, employee retention, etc.Pitch your topic with ease and precision using this Statistics Indicating Corporate Sustainability Actions Incorporated By Companies Diagrams PDF. This layout presents information on Energy Reduction, Emission Reduction, Increasing Employee. It is also available for immediate download and adjustment. So, changes can be made in the color, design, graphics or any other component to create a unique layout.

Performance Indicators Of PPC Marketing Campaigns Themes PDF
This slide exhibits elements of pay per click campaigns that helps to increase website advertisement traffic. It contains three points search engine marketing, ad rank and cost per mille. Presenting Performance Indicators Of PPC Marketing Campaigns Themes PDF to dispense important information. This template comprises three stages. It also presents valuable insights into the topics including Determines, Search Engine Marketing, Advertisement. This is a completely customizable PowerPoint theme that can be put to use immediately. So, download it and address the topic impactfully.

Leadership Effectiveness Framework Indicating Employee Behaviors Elements PDF
This slide showcases the framework containing key leadership behaviors for getting growth in the business. It includes organize, innovate, connect, enjoy and voice. Presenting Leadership Effectiveness Framework Indicating Employee Behaviors Elements PDF to dispense important information. This template comprises five stages. It also presents valuable insights into the topics including Organize, Innovate, Connect, Enjoy, Voice. This is a completely customizable PowerPoint theme that can be put to use immediately. So, download it and address the topic impactfully.
Indication Traffic Direction PowerPoint Slides And Ppt Diagram Templates
Indication Traffic Direction PowerPoint Slides And PPT Diagram Templates-These high quality powerpoint pre-designed slides and powerpoint templates have been carefully created by our professional team to help you impress your audience. All slides have been created and are 100% editable in powerpoint. Each and every property of any graphic - color, size, orientation, shading, outline etc. can be modified to help you build an effective powerpoint presentation. Any text can be entered at any point in the powerpoint template or slide. Simply DOWNLOAD, TYPE and PRESENT!

3 Months Roadmap For Organization Development With Key Indicators Guidelines
Presenting the 3 months roadmap for organization development with key indicators guidelines. The template includes a roadmap that can be used to initiate a strategic plan. Not only this, the PowerPoint slideshow is completely editable and you can effortlessly modify the font size, font type, and shapes according to your needs. This PPT slide can be easily reached in standard screen and widescreen aspect ratios. The set is also available in various formats like PDF, PNG, and JPG. So download and use it multiple times as per your knowledge.

5 Year Roadmap For Organization Development With Key Indicators Clipart
Presenting the 5 year roadmap for organization development with key indicators clipart. The template includes a roadmap that can be used to initiate a strategic plan. Not only this, the PowerPoint slideshow is completely editable and you can effortlessly modify the font size, font type, and shapes according to your needs. This PPT slide can be easily reached in standard screen and widescreen aspect ratios. The set is also available in various formats like PDF, PNG, and JPG. So download and use it multiple times as per your knowledge.

6 Months Roadmap For Organization Development With Key Indicators Topics
Presenting the 6 months roadmap for organization development with key indicators topics. The template includes a roadmap that can be used to initiate a strategic plan. Not only this, the PowerPoint slideshow is completely editable and you can effortlessly modify the font size, font type, and shapes according to your needs. This PPT slide can be easily reached in standard screen and widescreen aspect ratios. The set is also available in various formats like PDF, PNG, and JPG. So download and use it multiple times as per your knowledge.
Half Yearly Roadmap For Organization Development With Key Indicators Icons
Presenting the half yearly roadmap for organization development with key indicators icons. The template includes a roadmap that can be used to initiate a strategic plan. Not only this, the PowerPoint slideshow is completely editable and you can effortlessly modify the font size, font type, and shapes according to your needs. This PPT slide can be easily reached in standard screen and widescreen aspect ratios. The set is also available in various formats like PDF, PNG, and JPG. So download and use it multiple times as per your knowledge.

Quarterly Roadmap For Organization Development With Key Indicators Sample
Presenting the quarterly roadmap for organization development with key indicators sample. The template includes a roadmap that can be used to initiate a strategic plan. Not only this, the PowerPoint slideshow is completely editable and you can effortlessly modify the font size, font type, and shapes according to your needs. This PPT slide can be easily reached in standard screen and widescreen aspect ratios. The set is also available in various formats like PDF, PNG, and JPG. So download and use it multiple times as per your knowledge.
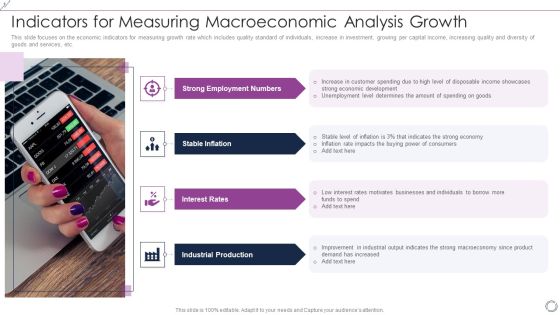
Indicators For Measuring Macroeconomic Analysis Growth Slides PDF
This slide focuses on the economic indicators for measuring growth rate which includes quality standard of individuals, increase in investment, growing per capital income, increasing quality and diversity of goods and services, etc. PresentingIndicators For Measuring Macroeconomic Analysis Growth Slides PDF to dispense important information. This template comprises four stages. It also presents valuable insights into the topics including Strong Employment Numbers, Stable Inflation, Interest Rates, Industrial Production. This is a completely customizable PowerPoint theme that can be put to use immediately. So, download it and address the topic impactfully.
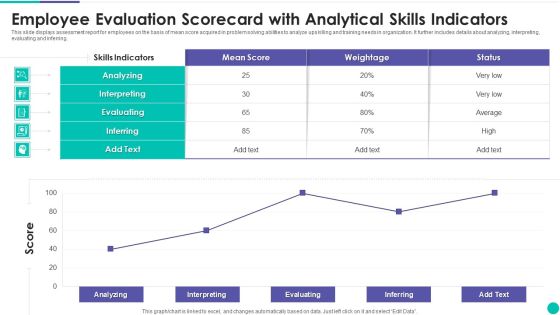
Employee Evaluation Scorecard With Analytical Skills Indicators Clipart PDF
This slide displays assessment report for employees on the basis of mean score acquired in problem solving abilities to analyze upskilling and training needs in organization. It further includes details about analyzing, interpreting, evaluating and inferring. Pitch your topic with ease and precision using this Employee Evaluation Scorecard With Analytical Skills Indicators Clipart PDF. This layout presents information on Analyzing, Interpreting, Evaluating. It is also available for immediate download and adjustment. So, changes can be made in the color, design, graphics or any other component to create a unique layout.
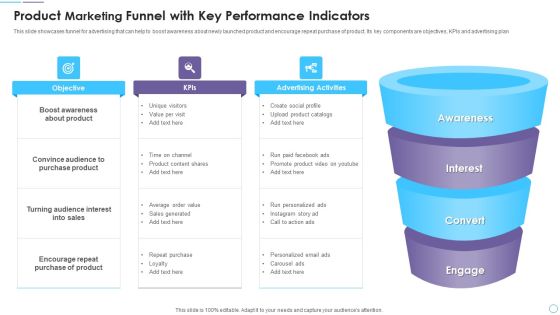
Product Marketing Funnel With Key Performance Indicators Guidelines PDF
This slide showcases funnel for advertising that can help to boost awareness about newly launched product and encourage repeat purchase of product. Its key components are objectives, KPIs and advertising plan. Presenting Product Marketing Funnel With Key Performance Indicators Guidelines PDF to dispense important information. This template comprises four stages. It also presents valuable insights into the topics including Awareness, Interest, Convert, Engage. This is a completely customizable PowerPoint theme that can be put to use immediately. So, download it and address the topic impactfully.
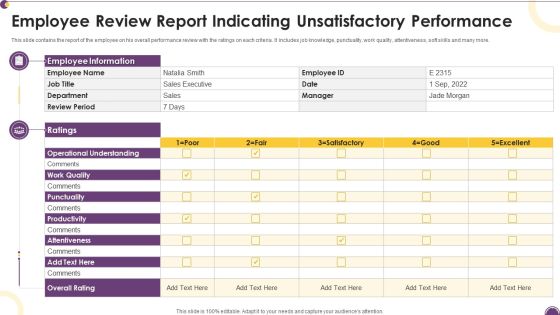
Employee Review Report Indicating Unsatisfactory Performance Themes PDF
This slide contains the report of the employee on his overall performance review with the ratings on each criteria. It includes job knowledge, punctuality, work quality, attentiveness, soft skills and many more.Pitch your topic with ease and precision using this Employee Review Report Indicating Unsatisfactory Performance Themes PDF. This layout presents information on Operational Understanding, Employee Information, Punctuality. It is also available for immediate download and adjustment. So, changes can be made in the color, design, graphics or any other component to create a unique layout.

Prospective Buyer Retention Dashboard With Key Performance Indicators Themes PDF
This slide shows the dashboard representing the key performance metrics for retention of potential customers of the organization. It shows no. of active users, churn rate, cost of customer acquisition, their life time value, monthly recurring revenue etc.Pitch your topic with ease and precision using this Prospective Buyer Retention Dashboard With Key Performance Indicators Themes PDF. This layout presents information on Recurring Revenue, Revenue Growth, Customer Acquisition. It is also available for immediate download and adjustment. So, changes can be made in the color, design, graphics or any other component to create a unique layout.

Cyber Security Key Performance Indicators Metrics Dashboard Mockup PDF
This slide covers cyber security health status dashboard . It also includes audit and compliance, controls health, project status, incident response process, vulnerability patching schedule, investigation process and training compliance. Pitch your topic with ease and precision using this Cyber Security Key Performance Indicators Metrics Dashboard Mockup PDF. This layout presents information on Cyber Security, Vulnerability Patching Schedule, Compliance Investigation Process. It is also available for immediate download and adjustment. So, changes can be made in the color, design, graphics or any other component to create a unique layout.

Key Performance Indicators Of Service Desk Problem Management Elements PDF
This slide showcases key metrics tracked and measured for incident management. Metrics included are incident response time, number of unresolved incidents, reopen rate, total cost per contact, customer satisfaction and first call resolution rate. Presenting Key Performance Indicators Of Service Desk Problem Management Elements PDF to dispense important information. This template comprises eight stages. It also presents valuable insights into the topics including Incident Response Time, Number Of Unresolved Incidents, Number Of Contacts Handled. This is a completely customizable PowerPoint theme that can be put to use immediately. So, download it and address the topic impactfully.

Measuring Training And Development Program Key Performance Indicators Template PDF
The purpose of this slide is to showcase certain KPIs to measure the effectiveness of a training and development program. The specific measuring criteria include training skill assessment, recognizing change, employee engagement and training feedback. Persuade your audience using this Measuring Training And Development Program Key Performance Indicators Template PDF. This PPT design covers five stages, thus making it a great tool to use. It also caters to a variety of topics including Training Skill Assessment, Recognizing Change, Employee Engagement. Download this PPT design now to present a convincing pitch that not only emphasizes the topic but also showcases your presentation skills.

Yearly Sales Assessment With Key Performance Indicator Matrix Introduction PDF
This slide covers quarterly product units sold through out a financial year in an organization with growth in revenue, profit and number of customer from previous years sales. It includes product sold and growth rate. Presenting Yearly Sales Assessment With Key Performance Indicator Matrix Introduction PDF to dispense important information. This template comprises four stages. It also presents valuable insights into the topics including Sold Growth Rate, Customers, Growth In Profit. This is a completely customizable PowerPoint theme that can be put to use immediately. So, download it and address the topic impactfully.

Business Expansion Geography Indicating Market Size Inspiration PDF
The slide demonstrates market size geography to identify potential areas to expand business. The slides includes a geographical map representing areas of market expansion. Persuade your audience using this Business Expansion Geography Indicating Market Size Inspiration PDF. This PPT design covers four stages, thus making it a great tool to use. It also caters to a variety of topics including Potential Markets, Business Expansion, Growth Opportunities. Download this PPT design now to present a convincing pitch that not only emphasizes the topic but also showcases your presentation skills.

B2C Content Marketing Statistics Indicating Usage Of Techniques Sample PDF
This slide showcases business to consumer B2C content marketing figures highlighting usage of key strategies. It provides information about targeting, editorial calendar, promotion, website UI, social media, service development, etc. Pitch your topic with ease and precision using this B2C Content Marketing Statistics Indicating Usage Of Techniques Sample PDF. This layout presents information on Strategies, Marketers, Content Team. It is also available for immediate download and adjustment. So, changes can be made in the color, design, graphics or any other component to create a unique layout.
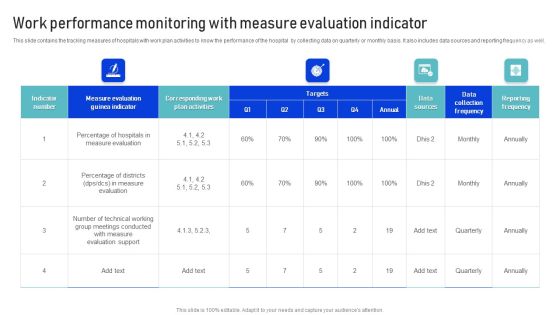
Work Performance Monitoring With Measure Evaluation Indicator Download PDF
This slide contains the tracking measures of hospitals with work plan activities to know the performance of the hospital by collecting data on quarterly or monthly basis. It also includes data sources and reporting frequency as well. Pitch your topic with ease and precision using this Work Performance Monitoring With Measure Evaluation Indicator Download PDF. This layout presents information on Measure Evaluation, Targets, Work Performance Monitoring. It is also available for immediate download and adjustment. So, changes can be made in the color, design, graphics or any other component to create a unique layout.

Key Performance Indicators Of Release And Deployment Management Demonstration PDF
This slide represents the key metrics to measure performance of change deploy and release management. It includes performance metrics such as number of pending changes for future system releases outages caused by release, releases delivered on time for quality assurance testing etc.Pitch your topic with ease and precision using this Key Performance Indicators Of Release And Deployment Management Demonstration PDF. This layout presents information on System Releases, Assurance Testing, Outages Caused. It is also available for immediate download and adjustment. So, changes can be made in the color, design, graphics or any other component to create a unique layout.
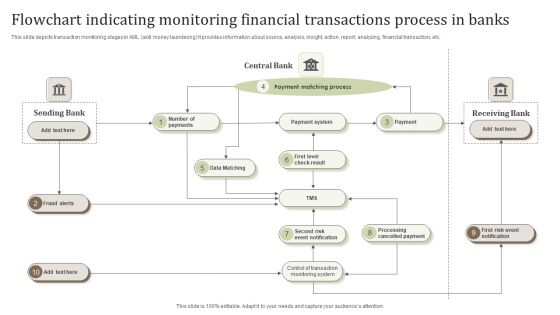
Flowchart Indicating Monitoring Financial Transactions Process In Banks Pictures PDF
This slide depicts transaction monitoring stages in AML anti money laundering It provides information about source, analysis, insight, action, report, analyzing, financial transaction, etc.Persuade your audience using this Flowchart Indicating Monitoring Financial Transactions Process In Banks Pictures PDF. This PPT design covers one stage, thus making it a great tool to use. It also caters to a variety of topics including Payment Matching Process, Cancelled Payment, Cancelled Payment. Download this PPT design now to present a convincing pitch that not only emphasizes the topic but also showcases your presentation skills.
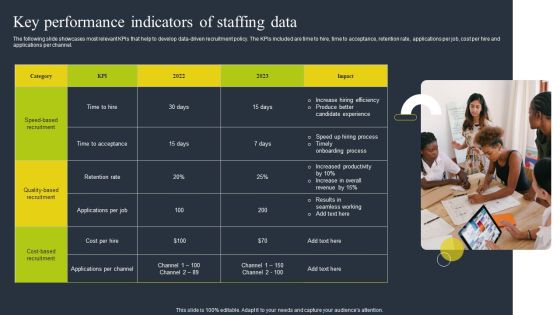
Key Performance Indicators Of Staffing Data Download PDF
The following slide showcases most relevant KPIs that help to develop data driven recruitment policy. The KPIs included are time to hire, time to acceptance, retention rate, applications per job, cost per hire and applications per channel. Persuade your audience using this Key Performance Indicators Of Staffing Data Download PDF. This PPT design covers one stages, thus making it a great tool to use. It also caters to a variety of topics including Quality Based Recruitment, Cost, Applications Per Channel. Download this PPT design now to present a convincing pitch that not only emphasizes the topic but also showcases your presentation skills.

Five Warehouse Key Efficiency Management Indicators Analysis Table Demonstration PDF
This slide shows the table representing the key metrics for measurement of performance of warehouse system of an organization. It includes data related to five activities of receiving, put away, storage, order picking and shipping of products. Showcasing this set of slides titled Five Warehouse Key Efficiency Management Indicators Analysis Table Demonstration PDF. The topics addressed in these templates are Activity, Received, Storage. All the content presented in this PPT design is completely editable. Download it and make adjustments in color, background, font etc. as per your unique business setting.

Warehouse Key Efficiency Indicators For Operations Management Slides PDF
This slide shows the table representing key metrics for measuring the performance of warehouse by the operations management team. It includes performance measurement of four activities of receiving, pick and pack, shipping and overall management of orders. Pitch your topic with ease and precision using this Warehouse Key Efficiency Indicators For Operations Management Slides PDF. This layout presents information on Operations Mgmt Shipping, Operations Mgmt. Receiving. It is also available for immediate download and adjustment. So, changes can be made in the color, design, graphics or any other component to create a unique layout.

Real Estate Business Sales Pipeline With Performance Indicators Background PDF
This slide showcases a sales funnel for real estate company to generate and acquire leads and maximize business profitability. It includes key components such as lead enters funnel, lead qualification, newsletter signup, schedule showing, negotiation, close, real estate deal won, etc. Presenting Real Estate Business Sales Pipeline With Performance Indicators Background PDF to dispense important information. This template comprises eight stages. It also presents valuable insights into the topics including Budget Preference, Newsletter Signup, Real Estate Deal Won. This is a completely customizable PowerPoint theme that can be put to use immediately. So, download it and address the topic impactfully.
Key Performance Indicators For Tracking Social Media Strategy Elements PDF
This slide presents multiple KPIs used to track progress of social media strategy helpful in checking content progress. Total reach, total subscribers, social shares, bounce rate and conversion rate are important in tracking the growth of brand and branded content. Pitch your topic with ease and precision using this Key Performance Indicators For Tracking Social Media Strategy Elements PDF. This layout presents information on Community Growth Kpis, Engagement Rate Kpis, Product Advertisement. It is also available for immediate download and adjustment. So, changes can be made in the color, design, graphics or any other component to create a unique layout.

Key Performance Indicators For Fulfilment Strategy Slides PDF
The following slide displays major obstacles faced by organizations in shipping and fulfilling orders received. It includes information about supply chain issues, seasonal and international fulfilment and inventory management. Persuade your audience using this Key Performance Indicators For Fulfilment Strategy Slides PDF. This PPT design covers six stages, thus making it a great tool to use. It also caters to a variety of topics including Transportation Costs, Picking Accuracy, Order Accuracy. Download this PPT design now to present a convincing pitch that not only emphasizes the topic but also showcases your presentation skills.
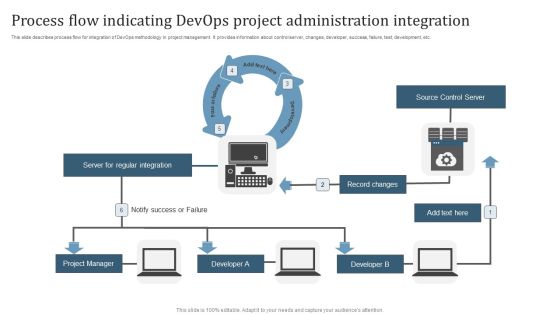
Process Flow Indicating Devops Project Administration Integration Microsoft PDF
This slide describes process flow for integration of DevOps methodology in project management. It provides information about control server, changes, developer, success, failure, test, development, etc. Presenting Process Flow Indicating Devops Project Administration Integration Microsoft PDF to dispense important information. This template comprises three stages. It also presents valuable insights into the topics including Server For Regular Integration, Source Control Server, Record Changes. This is a completely customizable PowerPoint theme that can be put to use immediately. So, download it and address the topic impactfully.
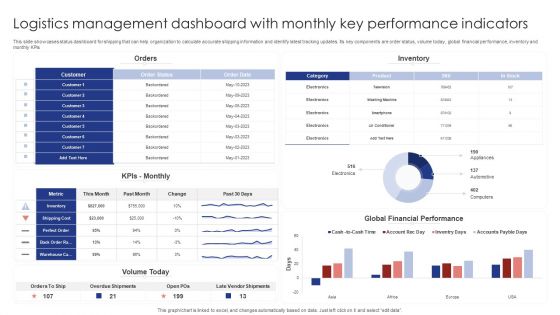
Logistics Management Dashboard With Monthly Key Performance Indicators Rules PDF
This slide showcases status dashboard for shipping that can help organization to calculate accurate shipping information and identify latest tracking updates. Its key components are order status, volume today, global financial performance, inventory and monthly KPIs. Pitch your topic with ease and precision using this Logistics Management Dashboard With Monthly Key Performance Indicators Rules PDF. This layout presents information on Orders, Inventory, Kpis Monthly. It is also available for immediate download and adjustment. So, changes can be made in the color, design, graphics or any other component to create a unique layout.

Share Market Dashboard Indicating Candlestick Time Series Formats PDF
Following slide showcase stock market KPI dashboard which will assist company to understand stock performance. It provides information about open, close, highest and lowest price of stock on particular day, candlestick time series etc. Pitch your topic with ease and precision using this Share Market Dashboard Indicating Candlestick Time Series Formats PDF. This layout presents information on Candlestick Time Series, Stock Change, US Sector. It is also available for immediate download and adjustment. So, changes can be made in the color, design, graphics or any other component to create a unique layout.

Performance Indicators For Strategic Resource Evaluation Icons PDF
This slide provides an overview of the various sourcing performance metrics used to analyze and measure the status. Major KPIs covered are purchase order cycle time, inventory turnover, total supply chain cost, number of suppliers and supplier lead time. Showcasing this set of slides titled Performance Indicators For Strategic Resource Evaluation Icons PDF. The topics addressed in these templates are Purchasing, Supply Chain Management, Vendor Management. All the content presented in this PPT design is completely editable. Download it and make adjustments in color, background, font etc. as per your unique business setting.
Sales By Lead Source Performance Indicator Icons PDF
Are you in need of a template that can accommodate all of your creative concepts This one is crafted professionally and can be altered to fit any style. Use it with Google Slides or PowerPoint. Include striking photographs, symbols, depictions, and other visuals. Fill, move around, or remove text boxes as desired. Test out color palettes and font mixtures. Edit and save your work, or work with colleagues. Download Sales By Lead Source Performance Indicator Icons PDF and observe how to make your presentation outstanding. Give an impeccable presentation to your group and make your presentation unforgettable.

Employee Experience Key Performance Indicators During Work Journey Topics PDF
The slide highlights various metrices to measure track progress overtime and build the best possible employee experience. It covers employee satisfaction , productivity, wellness, retention and net promoter score. Presenting Employee Experience Key Performance Indicators During Work Journey Topics PDF to dispense important information. This template comprises five stages. It also presents valuable insights into the topics including Employee Productivity, Employee Retention, Employee Satisfaction. This is a completely customizable PowerPoint theme that can be put to use immediately. So, download it and address the topic impactfully.

Performance Indicators For Successful Client Onboarding Template PDF
This slide showcases KPIs that showcases success of user onboarding. Major KPIs included are customer engagement, retention and count, average response time, completion and free trial conversion rate. If your project calls for a presentation, then Slidegeeks is your go-to partner because we have professionally designed, easy-to-edit templates that are perfect for any presentation. After downloading, you can easily edit Performance Indicators For Successful Client Onboarding Template PDF and make the changes accordingly. You can rearrange slides or fill them with different images. Check out all the handy templates

Forecasted Impact Of Strategies On Key Performance Indicators Slides PDF
Mentioned slide provides information about predicted affects on marketing communication strategies on business metrics. It includes KPIs such as website visit, blog traffic, conversion rate, social share, click through rate, bounce rate, impression, etc. Boost your pitch with our creative Forecasted Impact Of Strategies On Key Performance Indicators Slides PDF. Deliver an awe inspiring pitch that will mesmerize everyone. Using these presentation templates you will surely catch everyones attention. You can browse the ppts collection on our website. We have researchers who are experts at creating the right content for the templates. So you do not have to invest time in any additional work. Just grab the template now and use them.

Key Performance Indicators For Advertising And Promotion Plan Background PDF
This slide shows KPIs for measuring effectiveness of advertising and promotion plan for increasing overall revenue. It include KPIs such as conversion rate, cost per lead and social media management, etc. Persuade your audience using this Key Performance Indicators For Advertising And Promotion Plan Background PDF. This PPT design covers five stages, thus making it a great tool to use. It also caters to a variety of topics including Conversion Rate, Cost Per Lead, Social Media Management. Download this PPT design now to present a convincing pitch that not only emphasizes the topic but also showcases your presentation skills.
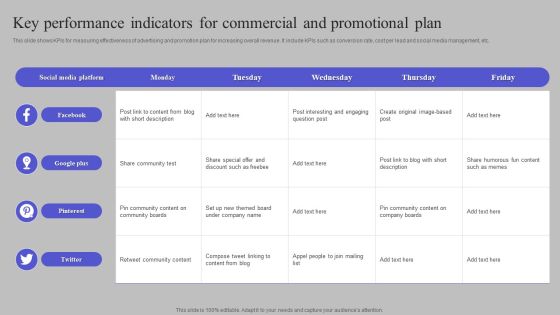
Key Performance Indicators For Commercial And Promotional Plan Information PDF
This slide shows KPIs for measuring effectiveness of advertising and promotion plan for increasing overall revenue. It include KPIs such as conversion rate, cost per lead and social media management, etc. Showcasing this set of slides titled Key Performance Indicators For Commercial And Promotional Plan Information PDF. The topics addressed in these templates are Facebook, Google Plus, Pinterest. All the content presented in this PPT design is completely editable. Download it and make adjustments in color, background, font etc. as per your unique business setting.

Ad Campaign Performance Indicators Tracking Dashboard Diagrams PDF
This slide covers dashboard to measure the performance of ad campaigns on LinkedIn platform. The purpose of this template is to provide the company an overview on the outcomes of running ad campaigns on LinkedIn. It includes performance based on impressions, CTR, engagement rates, CPC, CPM, etc. Find a pre designed and impeccable Ad Campaign Performance Indicators Tracking Dashboard Diagrams PDF. The templates can ace your presentation without additional effort. You can download these easy to edit presentation templates to make your presentation stand out from others. So, what are you waiting for Download the template from Slidegeeks today and give a unique touch to your presentation.

Human Resources Performance Indicators Setting Process Diagram Infographics PDF
Following slide includes employee assessment flow chart which can be used to determine staff performance and productivity. It includes cross functioning between personals such as employees, department head, deputy manager, general manager and comprehensive department. Presenting Human Resources Performance Indicators Setting Process Diagram Infographics PDF to dispense important information. This template comprises one stages. It also presents valuable insights into the topics including Head Of Department, Deputy Manager, Reporting Manager, Team Leader. This is a completely customizable PowerPoint theme that can be put to use immediately. So, download it and address the topic impactfully.

Stoplight Traffic Signal Go Indication Ppt PowerPoint Presentation Complete Deck
This stoplight traffic signal go indication ppt powerpoint presentation complete deck acts as backup support for your ideas, vision, thoughts, etc. Use it to present a thorough understanding of the topic. This PPT slideshow can be utilized for both in-house and outside presentations depending upon your needs and business demands. Entailing twelve slides with a consistent design and theme, this template will make a solid use case. As it is intuitively designed, it suits every business vertical and industry. All you have to do is make a few tweaks in the content or any other component to design unique presentations. The biggest advantage of this complete deck is that it can be personalized multiple times once downloaded. The color, design, shapes, and other elements are free to modify to add personal touches. You can also insert your logo design in this PPT layout. Therefore a well-thought and crafted presentation can be delivered with ease and precision by downloading this stoplight traffic signal go indication ppt powerpoint presentation complete deck PPT slideshow.

Progress Indicator Ring Ppt PowerPoint Presentation Complete Deck With Slides
This progress indicator ring ppt powerpoint presentation complete deck with slides acts as backup support for your ideas, vision, thoughts, etc. Use it to present a thorough understanding of the topic. This PPT slideshow can be utilized for both in-house and outside presentations depending upon your needs and business demands. Entailing twelve slides with a consistent design and theme, this template will make a solid use case. As it is intuitively designed, it suits every business vertical and industry. All you have to do is make a few tweaks in the content or any other component to design unique presentations. The biggest advantage of this complete deck is that it can be personalized multiple times once downloaded. The color, design, shapes, and other elements are free to modify to add personal touches. You can also insert your logo design in this PPT layout. Therefore a well-thought and crafted presentation can be delivered with ease and precision by downloading this progress indicator ring ppt powerpoint presentation complete deck with slides PPT slideshow.

Performance Indicators For Successful Client Onboarding Brochure PDF
This slide showcases KPIs that showcases success of user onboarding. Major KPIs included are customer engagement, retention and count, average response time, completion and free trial conversion rate. Retrieve professionally designed Performance Indicators For Successful Client Onboarding Brochure PDF to effectively convey your message and captivate your listeners. Save time by selecting pre made slideshows that are appropriate for various topics, from business to educational purposes. These themes come in many different styles, from creative to corporate, and all of them are easily adjustable and can be edited quickly. Access them as PowerPoint templates or as Google Slides themes. You do not have to go on a hunt for the perfect presentation because Slidegeeks got you covered from everywhere.

Current Key Account Management Performance Indicators Pictures PDF
The following slide provides information about the current key account management KPIs of the company which are shown in the form of graphs and for the past 5 years. The KPIs are key account satisfaction rate, key account interaction rate, key account churn rate and key account upsell rate. Are you in need of a template that can accommodate all of your creative concepts This one is crafted professionally and can be altered to fit any style. Use it with Google Slides or PowerPoint. Include striking photographs, symbols, depictions, and other visuals. Fill, move around, or remove text boxes as desired. Test out color palettes and font mixtures. Edit and save your work, or work with colleagues. Download Current Key Account Management Performance Indicators Pictures PDF and observe how to make your presentation outstanding. Give an impeccable presentation to your group and make your presentation unforgettable.

Impact Of RPA On Organizations Operational Performance Indicators Topics PDF
This slide showcases the overall impact of RPA implementation on operational performance parameters of an organization. It incorporates parameters such as downtime cost, safety incidents, utilization rate, product quality, Recall rate, cycle time, throughput rate etc. The Impact Of RPA On Organizations Operational Performance Indicators Topics PDF is a compilation of the most recent design trends as a series of slides. It is suitable for any subject or industry presentation, containing attractive visuals and photo spots for businesses to clearly express their messages. This template contains a variety of slides for the user to input data, such as structures to contrast two elements, bullet points, and slides for written information. Slidegeeks is prepared to create an impression.

Stock Photo Arrow Indicating Solution Path Of Maze Pwerpoint Slide
This conceptual image is designed with graphic of maze and arrow. In this image maze shows the concept of problem while arrow is reflecting the idea of solution. Build a innovative presentation for displaying the complexity of problem solving topic. Use this image for business, sales and marketing related presentations.

Business Diagram Multiple Cells For Charging Indication Diagram Presentation Template
Graphic of multiple cells is used to decorate this power point template slide. This PPt slide contains the concept of charging and power consumption. Use this PPT slide and explain these topics in a graphical manner.
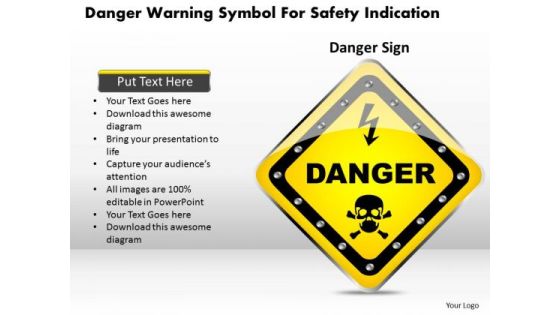
Business Diagram Danger Warning Symbol For Safety Indication Presentation Template
This Power Point template has been designed with graphic of danger board. This diagram contains the concept of safety warning for danger area. Use this diagram for your warning and safety related presentation.
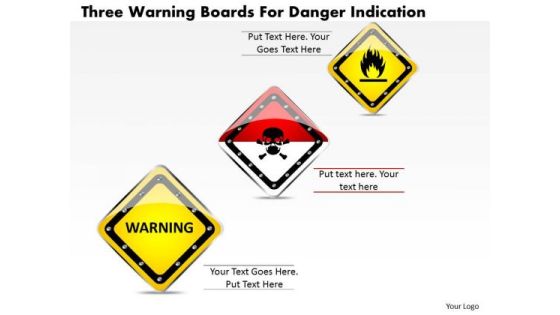
Business Diagram Three Warning Boards For Danger Indication Presentation Template
This Power Point image template has been designed with graphic of three different sign boards. These signs are designed to identify dangerous places. Use this diagram for safety and prevention related topics.

Business Diagram Human Hand Indicating On Multiple Apps PowerPoint Template
Graphic of human hand with multiple apps has been used to craft this PPT. This PPT diagram contains the concept of app usage. Use this PPT for your technology and data related topics in any presentation.

Business Diagram Thermometer Graphics Indicating Progress Presentation Template
This power point template diagram has been designed with graphic of thermometer and bar graph. This PPT contains the concept of growth analysis. Use this PPT for business and marketing related presentations.
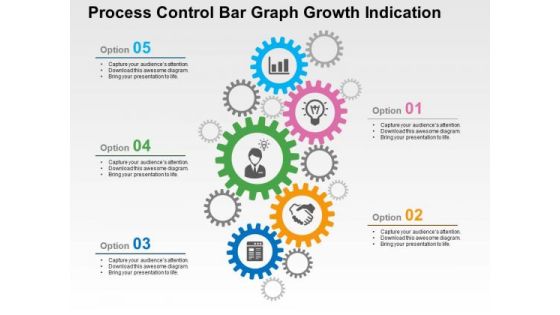
Process Control Bar Graph Growth Indication PowerPoint Template
Download our business slide with gear graphics to convincingly convey your important ideas in presentations. It also contains graphics of business icons. Create captivating presentations using this template

Eight Tags For Business Process Indication Powerpoint Template
Our above PPT slide contains graphics of eight text tags with icons. This PowerPoint template may be used to display business process steps. Use this diagram to impart more clarity to data and to create more sound impact on viewers.
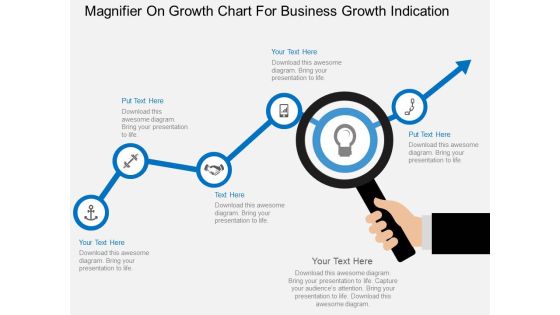
Magnifier On Growth Chart For Business Growth Indication Powerpoint Template
This business slide contains graphics of magnifier on growth chart. This PowerPoint template helps to display business planning and analysis. Use this diagram to impart more clarity to concept and to create more sound impact on viewers.

Plant With Bulb Education Growth Indication Powerpoint Template
This PowerPoint slide has been designed with graphics of plant and bulb. This diagram is designed to display education and growth. This professional slide helps in making an instant impact on viewers.

Three Arrows For Business Process Indication Powerpoint Template
This business slide displays diagram of three arrows with icons. Download this diagram to display information in visual manner. Visual effect of this diagram helps in maintaining the flow of the discussion and provides more clarity to the subject.

Three Dashboard For Financial Reporting Ppt Summary
This is a three dashboard for financial reporting ppt summary. This is a three stage process. The stages in this process are business, marketing, speed, dashboard, meter.
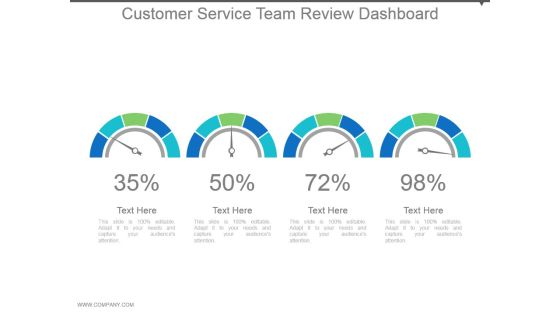
Customer Service Team Review Dashboard Powerpoint Slide Rules
This is a customer service team review dashboard powerpoint slide rules. This is a four stage process. The stages in this process are dashboard, meter, financials, speed, measure.

Dashboard Ppt PowerPoint Presentation Show
This is a dashboard ppt powerpoint presentation show. This is a three stage process. The stages in this process are speed, meter, measure, needle, calculate.
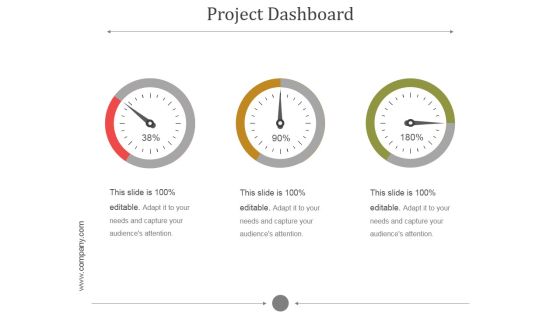
Project Dashboard Ppt PowerPoint Presentation Clipart
This is a project dashboard ppt powerpoint presentation clipart. This is a three stage process. The stages in this process are speed, meter, measure, needle, calculate.

Dashboard Ppt PowerPoint Presentation Microsoft
This is a dashboard ppt powerpoint presentation microsoft. This is a three stage process. The stages in this process are dashboard, business, marketing, speed, meter.

Dashboard Ppt PowerPoint Presentation Images
This is a dashboard ppt powerpoint presentation images. This is a one stage process. The stages in this process are dashboard, meter, speed, measure, business.

Dashboard Ppt PowerPoint Presentation Styles
This is a dashboard ppt powerpoint presentation styles. This is a three stage process. The stages in this process are dashboard, business, marketing, meter, speed.

Dashboard Ppt PowerPoint Presentation Outline Icon
This is a dashboard ppt powerpoint presentation outline icon. This is a three stage process. The stages in this process are speed, meter, business, marketing, equipment.

Dashboard Ppt PowerPoint Presentation Layouts Elements
This is a dashboard ppt powerpoint presentation layouts elements. This is a three stage process. The stages in this process are speed, meter, business, marketing, equipment.

Dashboard Ppt PowerPoint Presentation Pictures Portfolio
This is a dashboard ppt powerpoint presentation pictures portfolio. This is a three stage process. The stages in this process are speed, meter, business, marketing, equipment.

Dashboard Ppt PowerPoint Presentation Infographic Template Model
This is a dashboard ppt powerpoint presentation infographic template model. This is a four stage process. The stages in this process are business, marketing, meter, speed, measure.

Dashboard Ppt PowerPoint Presentation Visual Aids Professional
This is a dashboard ppt powerpoint presentation visual aids professional. This is a three stage process. The stages in this process are speed, meter, business, marketing, equipment.

Dashboard Ppt PowerPoint Presentation Infographics Introduction
This is a dashboard ppt powerpoint presentation infographics introduction. This is a four stage process. The stages in this process are dashboard, meter, business, marketing, finance.

Dashboard Ppt PowerPoint Presentation Model Inspiration
This is a dashboard ppt powerpoint presentation model inspiration. This is a five stage process. The stages in this process are dashboard, business, marketing, strategy, meter.

Dashboard Ppt PowerPoint Presentation Inspiration File Formats
This is a dashboard ppt powerpoint presentation inspiration file formats. This is a three stage process. The stages in this process are speed, meter, business, marketing, equipment.

Dashboard Ppt PowerPoint Presentation Infographics Format Ideas
This is a dashboard ppt powerpoint presentation infographics format ideas. This is a three stage process. The stages in this process are speed, meter, business, marketing, equipment.

Dashboard Ppt PowerPoint Presentation Infographics Sample
This is a dashboard ppt powerpoint presentation infographics sample. This is a one stage process. The stages in this process are speed, meter, business, marketing, equipment.

Dashboard Ppt PowerPoint Presentation Gallery Layouts
This is a dashboard ppt powerpoint presentation gallery layouts. This is a two stage process. The stages in this process are speed, meter, business, marketing, equipment.

Dashboard Ppt PowerPoint Presentation Summary Example Topics
This is a dashboard ppt powerpoint presentation summary example topics. This is a one stage process. The stages in this process are speed, meter, business, marketing, equipment.

Dashboard Ppt PowerPoint Presentation Layouts Diagrams
This is a dashboard ppt powerpoint presentation layouts diagrams. This is a one stage process. The stages in this process are speed, meter, business, marketing, equipment.

Dashboard Ppt PowerPoint Presentation Pictures Outfit
This is a dashboard ppt powerpoint presentation pictures outfit. This is a two stage process. The stages in this process are speed, meter, business, marketing, equipment.

Dashboard Ppt PowerPoint Presentation Slides Styles
This is a dashboard ppt powerpoint presentation slides styles. This is a four stage process. The stages in this process are speed, meter, business, marketing, equipment.

Monitoring Impact Ppt PowerPoint Presentation Ideas Guide
This is a monitoring impact ppt powerpoint presentation ideas guide. This is a four stage process. The stages in this process are speed, meter, business, marketing, equipment.

Dashboard Ppt PowerPoint Presentation File Background
This is a dashboard ppt powerpoint presentation file background. This is a three stage process. The stages in this process are speed, meter, business, marketing, equipment.

Dashboard Ppt PowerPoint Presentation Portfolio Demonstration
This is a dashboard ppt powerpoint presentation portfolio demonstration. This is a two stage process. The stages in this process are dashboard, finance, percentage, meter, speed.
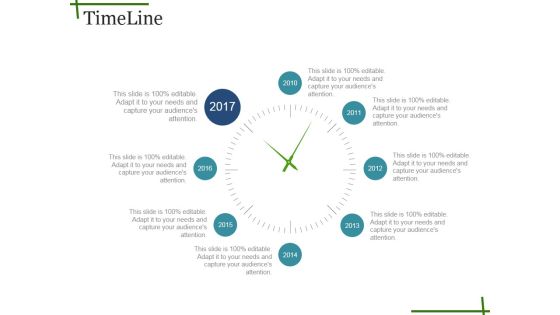
Timeline Ppt PowerPoint Presentation Show Template
This is a timeline ppt powerpoint presentation show template. This is a eight stage process. The stages in this process are measure, years, timeline, meter, watch.

Dashboard Ppt PowerPoint Presentation Summary Format
This is a dashboard ppt powerpoint presentation summary format. This is a one stage process. The stages in this process are speed, meter, dashboard, measure, planning.

Dashboard Ppt PowerPoint Presentation Pictures Icon
This is a dashboard ppt powerpoint presentation pictures icon. This is a six stage process. The stages in this process are dashboard, meter, measure, speed, marketing.

Dashboard Ppt PowerPoint Presentation Model Layout
This is a dashboard ppt powerpoint presentation model layout. This is a three stage process. The stages in this process are dashboard, meter, finance, speed, marketing.

Dashboard Ppt PowerPoint Presentation Model Slide Download
This is a dashboard ppt powerpoint presentation model slide download. This is a one stage process. The stages in this process are finance, planning, meter, speed, dashboard.

Dashboard Ppt PowerPoint Presentation Styles Themes
This is a dashboard ppt powerpoint presentation styles themes. This is a three stage process. The stages in this process are dashboard, speed, meter, business, marketing.

Dashboard Ppt PowerPoint Presentation Summary Maker
This is a dashboard ppt powerpoint presentation summary maker. This is a one stage process. The stages in this process are dashboard, marketing, speed, planning, meter.

Cyber Risk Report With Risk Indicator And Affected Systems Brochure PDF
This slide highlights the cyber threat risk indicator which include risk level, risk indication, likelihood, impacts and potential affected system. Pitch your topic with ease and precision using this cyber risk report with risk indicator and affected systems brochure pdf. This layout presents information on risk indication, risk level, key risk indicator. It is also available for immediate download and adjustment. So, changes can be made in the color, design, graphics or any other component to create a unique layout.
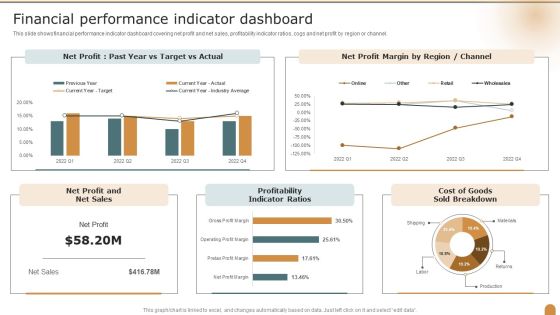
Financial Performance Indicator Dashboard Company Performance Evaluation Using KPI Structure PDF
This slide shows financial performance indicator dashboard covering net profit and net sales, profitability indicator ratios, cogs and net profit by region or channel. Deliver and pitch your topic in the best possible manner with this Financial Performance Indicator Dashboard Company Performance Evaluation Using KPI Structure PDF. Use them to share invaluable insights on Financial Performance, Indicator Dashboard, Profitability Indicator and impress your audience. This template can be altered and modified as per your expectations. So, grab it now.

Performance Indicator Business Opportunity Marketing Mix Collections Management Ppt PowerPoint Presentation Infographic Template Backgrounds
This is a performance indicator business opportunity marketing mix collections management ppt powerpoint presentation infographic template backgrounds. This is a three stage process. The stages in this process are performance indicator, business opportunity, marketing mix, collections management.
Key Performance Indicators Accounting Ppt Powerpoint Presentation Portfolio Master Slide Cpb
This is a key performance indicators accounting ppt powerpoint presentation portfolio master slide cpb. This is a five stage process. The stages in this process are key performance indicators accounting.
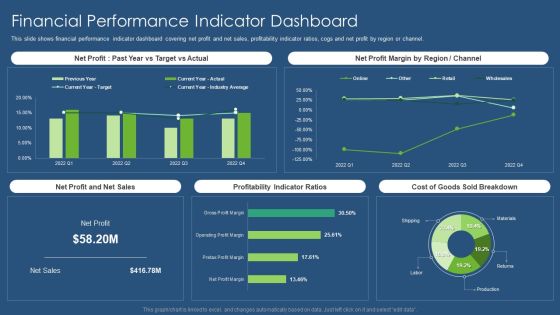
Sustainability Calculation With KPI Financial Performance Indicator Dashboard Infographics PDF Template PDF
This slide shows financial performance indicator dashboard covering net profit and net sales, profitability indicator ratios, cogs and net profit by region or channel. Deliver an awe inspiring pitch with this creative sustainability calculation with kpi financial performance indicator dashboard infographics pdf bundle. Topics like net profit margin, net profit and net sales, profitability indicator ratios, sold breakdown can be discussed with this completely editable template. It is available for immediate download depending on the needs and requirements of the user.
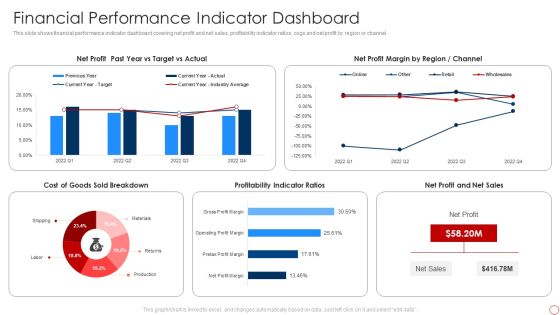
Kpis For Evaluating Business Sustainability Financial Performance Indicator Dashboard Demonstration PDF
This slide shows financial performance indicator dashboard covering net profit and net sales, profitability indicator ratios, cogs and net profit by region or channel. Deliver and pitch your topic in the best possible manner with this Kpis For Evaluating Business Sustainability Financial Performance Indicator Dashboard Demonstration PDF. Use them to share invaluable insights on Net Profit, Net Profit Margin, Profitability Indicator Ratios and impress your audience. This template can be altered and modified as per your expectations. So, grab it now.
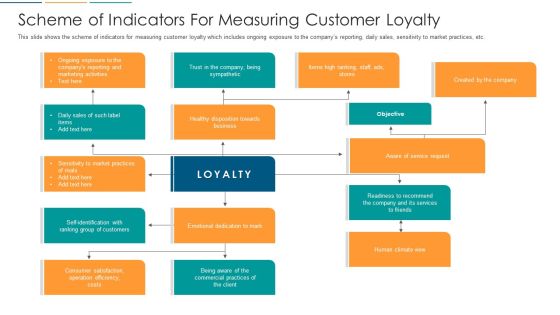
Scheme Of Indicators For Measuring Customer Loyalty Ppt Infographics Graphics Pictures PDF
This slide shows the scheme of indicators for measuring customer loyalty which includes ongoing exposure to the companys reporting, daily sales, sensitivity to market practices, etc. Deliver and pitch your topic in the best possible manner with this scheme of indicators for measuring customer loyalty ppt infographics graphics pictures pdf. Use them to share invaluable insights on scheme of indicators for measuring customer loyalty and impress your audience. This template can be altered and modified as per your expectations. So, grab it now.

Iot Digital Twin Technology Post Covid Expenditure Management Key Performance Indicators Background PDF
This slide focuses on the key performance indicators in oil and gas industry which includes loss of primary containment, oil spills, greenhouse gas emissions, etc. Deliver an awe inspiring pitch with this creative iot digital twin technology post covid expenditure management key performance indicators background pdf bundle. Topics like key performance indicators in oil and gas industry can be discussed with this completely editable template. It is available for immediate download depending on the needs and requirements of the user.

International Organization Standardization 270001 Performance Indicators To Measure Information Security Controls Clipart PDF
Following slide illustrates performance indicators for measuring information security controls. It includes controls details, performance indicator formula, target and periodicity. Deliver and pitch your topic in the best possible manner with this international organization standardization 270001 performance indicators to measure information security controls clipart pdf. Use them to share invaluable insights on information security policy, information security training, incident response and impress your audience. This template can be altered and modified as per your expectations. So, grab it now.

Price Benefit Internet Things Digital Twins Execution After Covid Key Performance Indicators In Oil Slides PDF
This slide focuses on the key performance indicators in oil and gas industry which includes loss of primary containment, oil spills, greenhouse gas emissions, etc. Deliver an awe inspiring pitch with this creative price benefit internet things digital twins execution after covid key performance indicators in oil slides pdf bundle. Topics like key performance indicators in oil and gas industry can be discussed with this completely editable template. It is available for immediate download depending on the needs and requirements of the user.

Hoshin Kanri Pitch Deck Key Performance Indicators Bowling Chart Introduction PDF
This bowling chart template covers quality, delivery, cost, safety and moral key performance indicators along with plan and actual budget Deliver an awe inspiring pitch with this creative hoshin kanri pitch deck key performance indicators bowling chart introduction pdf bundle. Topics like key performance indicators bowling chart can be discussed with this completely editable template. It is available for immediate download depending on the needs and requirements of the user.

Info Safety And ISO 27001 Performance Indicators To Measure Information Security Sample PDF
Following slide illustrates performance indicators for measuring information security controls. It includes controls details, performance indicator formula, target and periodicity. Deliver and pitch your topic in the best possible manner with this Info Safety And ISO 27001 Performance Indicators To Measure Information Security Sample PDF. Use them to share invaluable insights on Information Security Policy, Information Security Training, Asset Inventory and impress your audience. This template can be altered and modified as per your expectations. So, grab it now.

Confidential Information Memorandum Key Performance Indicators Of The Company Inspiration PDF
This slide provides information about the key performance indicators of the company for 5 years in terms of turnover, gross profit, operating profit margin etc. Deliver an awe inspiring pitch with this creative Confidential Information Memorandum Key Performance Indicators Of The Company Inspiration PDF bundle. Topics like Key Performance Indicators, Turnover Gross Profit, Gross Profit Margin can be discussed with this completely editable template. It is available for immediate download depending on the needs and requirements of the user.
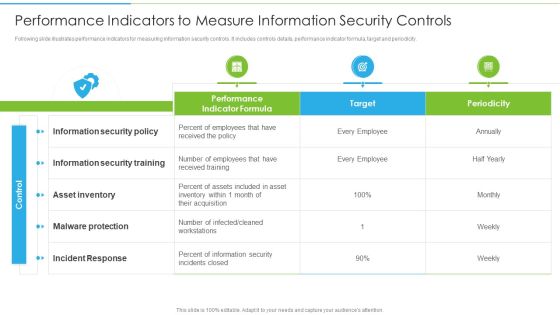
Ways To Accomplish ISO 27001 Accreditation Performance Indicators To Measure Information Summary PDF
Following slide illustrates performance indicators for measuring information security controls. It includes controls details, performance indicator formula, target and periodicity. Deliver an awe inspiring pitch with this creative Ways To Accomplish ISO 27001 Accreditation Performance Indicators To Measure Information Summary PDF bundle. Topics like Information Security, Asset Inventory, Malware Protection can be discussed with this completely editable template. It is available for immediate download depending on the needs and requirements of the user.

Metrics To Measure Business Performance Financial Performance Indicator Dashboard Pictures PDF
This slide shows financial performance indicator dashboard covering net profit and net sales, profitability indicator ratios, cogs and net profit by region or channel. Deliver an awe inspiring pitch with this creative Metrics To Measure Business Performance Financial Performance Indicator Dashboard Pictures PDF bundle. Topics like Net Profit, Net Sales, Cost Goods, Sold Breakdown can be discussed with this completely editable template. It is available for immediate download depending on the needs and requirements of the user.

Indicators And Ways To Business Sales Training Success Measurement Topics PDF
The following slide illustrates indicators and techniques to track sales training effectiveness. It provides information about certification, audience satisfaction, behavior change, leading, lagging, etc. Showcasing this set of slides titled Indicators And Ways To Business Sales Training Success Measurement Topics PDF. The topics addressed in these templates are Indicator Type, Certification Results, Audience Satisfaction. All the content presented in this PPT design is completely editable. Download it and make adjustments in color, background, font etc. as per your unique business setting.
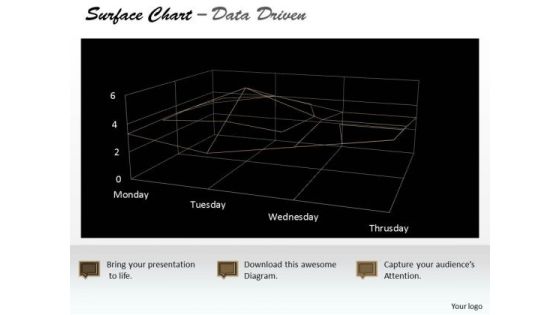
Data Analysis Template Driven Surface Chart Indicating Areas PowerPoint Slides Templates
Highlight Your Drive With Our data analysis template driven surface chart indicating areas powerpoint slides Templates . Prove The Fact That You Have Control.

Current People Engagement Performance Indicators In The Company Ppt Model Portfolio PDF
This slide shows the current People Engagement Performance Indicators in the Company that are compared for 3 years. Some indicators are Employee Turnover Rate, Internal Promotion Rate, Absenteeism Rate, Employee Satisfaction Index, NPS Net Promoter Score etc. Deliver and pitch your topic in the best possible manner with this current people engagement performance indicators in the company ppt model portfolio pdf. Use them to share invaluable insights on performance indicators, employee turnover rate, overall company sales, employee absenteeism rate and impress your audience. This template can be altered and modified as per your expectations. So, grab it now.

Estimated People Engagement Performance Indicators In The Company After Strategy Implementation Ppt Portfolio Influencers PDF
This slide shows the estimated and improved People Engagement Performance Indicators in the Company after strategy implementation for the coming 3 years. Some of the indicators are Employee Turnover Rate, Internal Promotion Rate, Absenteeism Rate, Employee Satisfaction Index, NPS Net Promoter Score etc. Deliver and pitch your topic in the best possible manner with this estimated people engagement performance indicators in the company after strategy implementation ppt portfolio influencers pdf. Use them to share invaluable insights on internal promotion rate, employee turnover rate, overall company sales, performance indicators and impress your audience. This template can be altered and modified as per your expectations. So, grab it now.
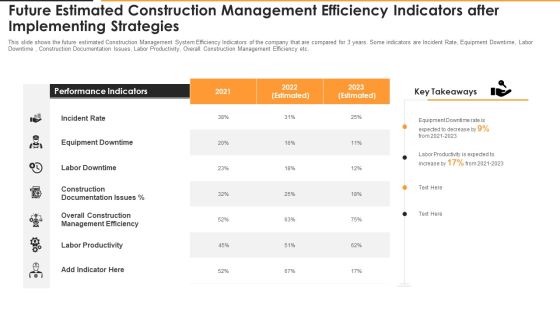
Future Estimated Construction Management Efficiency Indicators After Implementing Strategies Graphics PDF
This slide shows the future estimated Construction Management System Efficiency Indicators of the company that are compared for 3 years. Some indicators are Incident Rate, Equipment Downtime, Labor Downtime , Construction Documentation Issues, Labor Productivity, Overall Construction Management Efficiency etc. Deliver an awe inspiring pitch with this creative future estimated construction management efficiency indicators after implementing strategies graphics pdf bundle. Topics like incident rate, performance indicators, equipment downtime, management efficiency can be discussed with this completely editable template. It is available for immediate download depending on the needs and requirements of the user.

Current Vendor Management System Efficiency Indicators In The Company Microsoft PDF
This slide shows the current Vendor Management System Efficiency Indicators of the company that are compared for 3 years. Some indicators are Timely Order Fulfilment, Communication Time Lags, Delivery Lead Time, Vendor Availability, Supplier Risk etc. Deliver an awe-inspiring pitch with this creative current vendor management system efficiency indicators in the company microsoft pdf bundle. Topics like performance indicators, key takeaways can be discussed with this completely editable template. It is available for immediate download depending on the needs and requirements of the user.

Current Integrated Logistics Management Efficiency Indicators In The Company Clipart PDF
This slide shows the current Integrated Logistics Management System Efficiency Indicators of the company that are compared for 3 years. Some indicators are order accuracy rate, on time delivery, average cycle time , inventory accuracy, perfect order rate, overall integrated logistics efficiency etc. Deliver and pitch your topic in the best possible manner with this current integrated logistics management efficiency indicators in the company clipart pdf. Use them to share invaluable insights on performance indicators, average, inventory, rate and impress your audience. This template can be altered and modified as per your expectations. So, grab it now.

Future Integrated Logistics Management Efficiency Indicators In The Company Ideas PDF
This slide shows the current Integrated Logistics Management System Efficiency Indicators of the company that are compared for 3 years. Some indicators are order accuracy rate, on time delivery, average cycle time , inventory accuracy, perfect order rate, overall integrated logistics efficiency etc. Deliver and pitch your topic in the best possible manner with this future integrated logistics management efficiency indicators in the company ideas pdf. Use them to share invaluable insights on average, inventory accuracy, performance indicators and impress your audience. This template can be altered and modified as per your expectations. So, grab it now.

Current HR Service Delivery System Efficiency Indicators Ppt Outline Clipart PDF
This slide shows the current HR Service Delivery System Efficiency Indicators of the company that are compared for 3 years. Some indicators are self service resolution rate, training effectiveness status, performance of new hires, SLA achievement rate, employee satisfaction rate etc. Deliver an awe inspiring pitch with this creative current hr service delivery system efficiency indicators ppt outline clipart pdf bundle. Topics like current hr service delivery system efficiency indicators in the company can be discussed with this completely editable template. It is available for immediate download depending on the needs and requirements of the user.
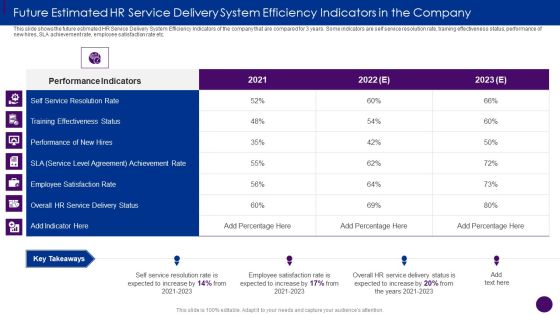
Future Estimated HR Service Delivery System Efficiency Indicators Ppt Outline Smartart PDF
This slide shows the future estimated HR Service Delivery System Efficiency Indicators of the company that are compared for 3 years. Some indicators are self service resolution rate, training effectiveness status, performance of new hires, SLA achievement rate, employee satisfaction rate etc. Deliver and pitch your topic in the best possible manner with this future estimated hr service delivery system efficiency indicators ppt outline smartart pdf. Use them to share invaluable insights on future estimated hr service delivery system efficiency indicators in the company and impress your audience. This template can be altered and modified as per your expectations. So, grab it now.

Consumer Retention Techniques Current Patient Satisfaction Indicators At The Medical Topics PDF
This slide shows the current Patient Satisfaction Indicators at the Medical Facility that are compared for 3 years. Some indicators are Average Patient Waiting Time, Patients Record Confidentiality Status, Increase in Treatment Costs, Proper Patient-Doctor Communication etc. Deliver and pitch your topic in the best possible manner with this consumer retention techniques current patient satisfaction indicators at the medical topics pdf. Use them to share invaluable insights on performance indicators, average patient waiting time, inefficient staff resources and impress your audience. This template can be altered and modified as per your expectations. So, grab it now.

Estimated Employee Engagement Performance Indicators In The Company After Strategy Implementation Microsoft PDF
This slide shows the estimated and improved Employee Engagement Performance Indicators in the Company after strategy implementation for the coming 3 years. Some of the indicators are Employee Turnover Rate, Internal Promotion Rate, Absenteeism Rate, Employee Satisfaction Index, NPS Net Promoter Score etc. Deliver an awe inspiring pitch with this creative Estimated Employee Engagement Performance Indicators In The Company After Strategy Implementation Microsoft PDF bundle. Topics like Performance Indicators, Internal Promotion, Employee Satisfaction can be discussed with this completely editable template. It is available for immediate download depending on the needs and requirements of the user.

Current HR Service Delivery System Efficiency Indicators In The Company Rules PDF
This slide shows the current HR Service Delivery System Efficiency Indicators of the company that are compared for 3 years. Some indicators are self service resolution rate, training effectiveness status, performance of new hires, SLA achievement rate, employee satisfaction rate etc. Deliver an awe inspiring pitch with this creative Current HR Service Delivery System Efficiency Indicators In The Company Rules PDF bundle. Topics like Performance Indicators, Training Effectiveness, Employee Satisfaction can be discussed with this completely editable template. It is available for immediate download depending on the needs and requirements of the user.

Accounts Receivable Key Performance Indicators Ppt PowerPoint Presentation Visual Aids Model Cpb
Presenting this set of slides with name accounts receivable key performance indicators ppt powerpoint presentation visual aids model cpb. This is a three stage process. The stages in this process are accounts receivable key performance indicators. This is a completely editable PowerPoint presentation and is available for immediate download. Download now and impress your audience.
Key Performance Indicators Examples Marketing Ppt PowerPoint Presentation Ideas Clipart Cpb
Presenting this set of slides with name key performance indicators examples marketing ppt powerpoint presentation ideas clipart cpb. This is a four stage process. The stages in this process are key performance indicators examples marketing. This is a completely editable PowerPoint presentation and is available for immediate download. Download now and impress your audience.

Closed Loop Supply Chain Management Key Performing Indicators In Reverse Logistics Average Ppt Infographic PDF
Presenting this set of slides with name closed loop supply chain management key performing indicators in reverse logistics average ppt infographic pdf. The topics discussed in these slides are Indicators, Industry Average, Firm Average. This is a completely editable PowerPoint presentation and is available for immediate download. Download now and impress your audience.

Closed Loop Supply Chain Management Key Performing Indicators In Reverse Logistics Product Ppt Summary PDF
Presenting this set of slides with name closed loop supply chain management key performing indicators in reverse logistics product ppt summary pdf. The topics discussed in these slides are Indicators, Industry Average, Firm Average. This is a completely editable PowerPoint presentation and is available for immediate download. Download now and impress your audience.
Speedometer Performance Indicator Vector Icon Ppt PowerPoint Presentation Show Deck PDF
Presenting this set of slides with name speedometer performance indicator vector icon ppt powerpoint presentation show deck pdf. This is a three stage process. The stages in this process are speedometer performance indicator vector icon. This is a completely editable PowerPoint presentation and is available for immediate download. Download now and impress your audience.
Red Light Indicating Stop Vector Icon Ppt PowerPoint Presentation Gallery Topics PDF
Presenting this set of slides with name red light indicating stop vector icon ppt powerpoint presentation gallery topics pdf. The topics discussed in these slide is red light indicating stop vector icon. This is a completely editable PowerPoint presentation and is available for immediate download. Download now and impress your audience.
Picture Indicating Yes Or No Business Options Ppt PowerPoint Presentation Styles Elements PDF
Presenting this set of slides with name picture indicating yes or no business options ppt powerpoint presentation styles elements pdf. This is a two stage process. The stages in this process are picture indicating yes or no business options. This is a completely editable PowerPoint presentation and is available for immediate download. Download now and impress your audience.

Women Football Referee Indicating Rule Breaking Punishment Ppt PowerPoint Presentation Gallery Slide PDF
Presenting this set of slides with name women football referee indicating rule breaking punishment ppt powerpoint presentation gallery slide pdf. The topics discussed in these slide is women football referee indicating rule breaking punishment. This is a completely editable PowerPoint presentation and is available for immediate download. Download now and impress your audience.

Key Performance Indicators Field Service Management Ppt PowerPoint Presentation Gallery Rules PDF
Presenting this set of slides with name key performance indicators field service management ppt powerpoint presentation gallery rules pdf. The topics discussed in these slide is key performance indicators field service management. This is a completely editable PowerPoint presentation and is available for immediate download. Download now and impress your audience.
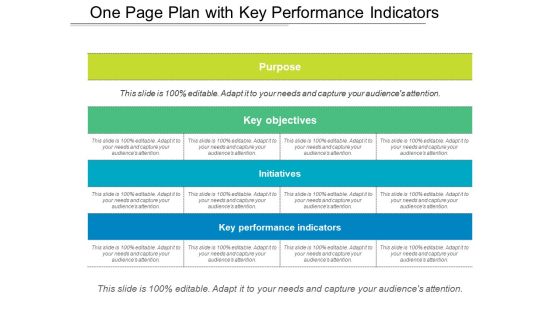
One Page Plan With Key Performance Indicators Ppt PowerPoint Presentation Model Smartart PDF
Presenting this set of slides with name one page plan with key performance indicators ppt powerpoint presentation model smartart pdf. The topics discussed in these slides are purpose, key objectives, initiatives, key performance indicators. This is a completely editable PowerPoint presentation and is available for immediate download. Download now and impress your audience.

Chart Indicating Two Years Business Performance Analysis Ppt PowerPoint Presentation File Grid PDF
Showcasing this set of slides titled chart indicating two years business performance analysis ppt powerpoint presentation file grid pdf. The topics addressed in these templates are chart indicating two years business performance analysis. All the content presented in this PPT design is completely editable. Download it and make ajustments in color, background, font etc. as per your unique business setting.
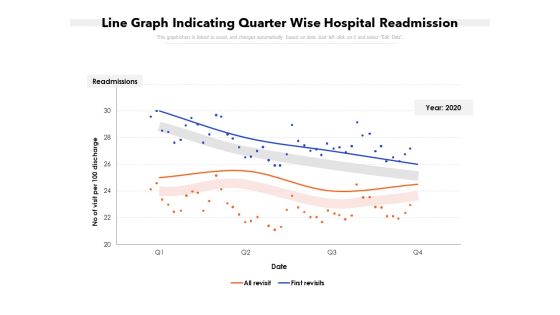
Line Graph Indicating Quarter Wise Hospital Readmission Ppt PowerPoint Presentation Gallery Layouts PDF
Showcasing this set of slides titled line graph indicating quarter wise hospital readmission ppt powerpoint presentation gallery layouts pdf. The topics addressed in these templates are line graph indicating quarter wise hospital readmission. All the content presented in this PPT design is completely editable. Download it and make ajustments in color, background, font etc. as per your unique business setting.
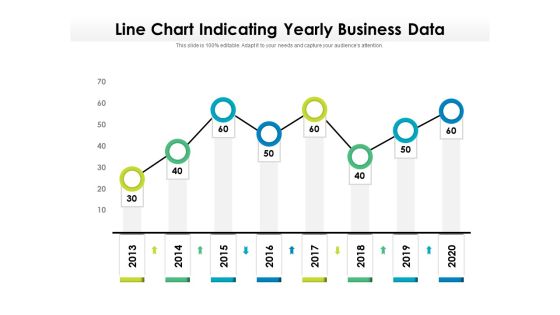
Line Chart Indicating Yearly Business Data Ppt PowerPoint Presentation Styles Deck PDF
Showcasing this set of slides titled line chart indicating yearly business data ppt powerpoint presentation styles deck pdf. The topics addressed in these templates are line chart indicating yearly business data, 2013 to 2020. All the content presented in this PPT design is completely editable. Download it and make adjustments in color, background, font etc. as per your unique business setting.
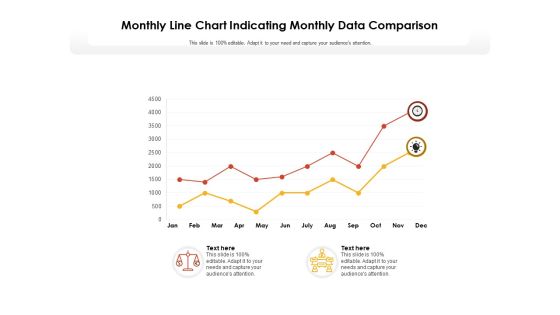
Monthly Line Chart Indicating Monthly Data Comparison Ppt PowerPoint Presentation Model Slide Portrait
Showcasing this set of slides titled monthly line chart indicating monthly data comparison ppt powerpoint presentation model slide portrait. The topics addressed in these templates are monthly line chart indicating monthly data comparison. All the content presented in this PPT design is completely editable. Download it and make adjustments in color, background, font etc. as per your unique business setting.

Digital Marketing Progress Key Performance Indicators Goal Ppt Slides Example PDF
Deliver an awe inspiring pitch with this creative digital marketing progress key performance indicators goal ppt slides example pdf bundle. Topics like goal, key performance, indicators can be discussed with this completely editable template. It is available for immediate download depending on the needs and requirements of the user.

Assessment Of Website Key Performance Indicators Ppt PowerPoint Presentation Gallery Visual Aids PDF
Showcasing this set of slides titled assessment of website key performance indicators ppt powerpoint presentation gallery visual aids pdf. The topics addressed in these templates are assessment of website key performance indicators. All the content presented in this PPT design is completely editable. Download it and make adjustments in color, background, font etc. as per your unique business setting.
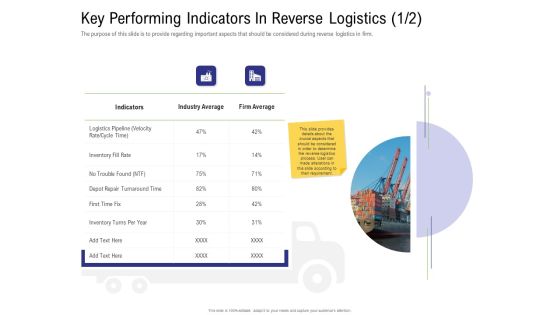
Strategy For Managing Ecommerce Returns Key Performing Indicators In Reverse Logistics Cycle Background PDF
Deliver an awe inspiring pitch with this creative strategy for managing ecommerce returns key performing indicators in reverse logistics cycle background pdf bundle. Topics like indicators, industry average, firm average, inventory can be discussed with this completely editable template. It is available for immediate download depending on the needs and requirements of the user.
 Home
Home