Gauge

Balanced Scorecard Leading And Lagging Indicators Powerpoint Slide
This is a balanced scorecard leading and lagging indicators powerpoint slide. This is a four stage process. The stages in this process are dashboard, business, marketing, technology, meter.
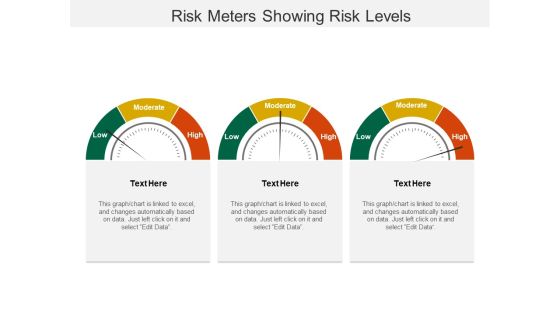
Risk Meters Showing Risk Levels Ppt PowerPoint Presentation Summary Example
This is a risk meters showing risk levels ppt powerpoint presentation summary example. This is a three stage process. The stages in this process are risk meter, risk speedometer, hazard meter.

Three Levels Risk Assessment Meter Ppt PowerPoint Presentation Infographics Themes
This is a three levels risk assessment meter ppt powerpoint presentation infographics themes. This is a three stage process. The stages in this process are risk meter, risk speedometer, hazard meter.

Sales Team Performance Meter Ppt PowerPoint Presentation Diagrams
This is a sales team performance meter ppt powerpoint presentation diagrams. This is a five stage process. The stages in this process are business, meter, speed, time, sales.

Glauco Meter Medical PowerPoint Background And Template 1210
Microsoft PowerPoint Template and Background with Digital illustration of glucose meter in color background.

Stock Photo 3d Meter With Maximum Value PowerPoint Slide
This image of 3d meter is very useful for presentations about growth and success. This high quality image has graphics of 3d meter pointing at maximum value. Create eye-catching presentation using this image.
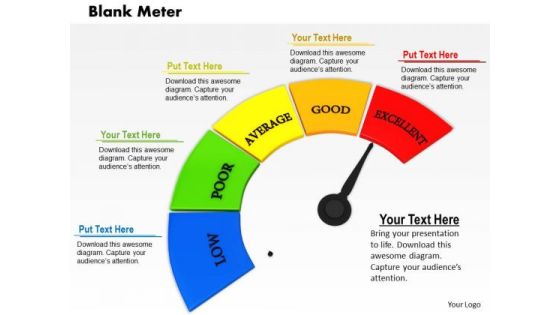
Stock Photo Meter With Red Maximum Value PowerPoint Slide
This image of 3d meter is very useful for presentations about growth and success. This high quality image has graphics of 3d meter pointing at maximum value. Create eye-catching presentation using this image.
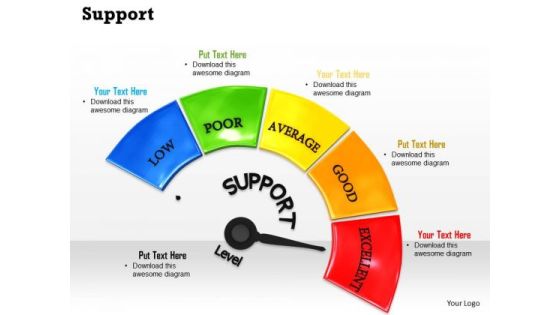
Stock Photo Support Meter With Excellent Level Pwerpoint Slide
This graphic image has been crafted with graphic of meter which have text support. This image shows the excellent level on the meter. Judge the quality of support for any business and display it in your presentation.

Business Diagram Meter Pointing On Poor Word Presentation Template
Graphic of meter has been used to design this power point template. This diagram contains the graphic of meter to display performance levels. Use this business diagram to make attractive presentations.

Strategy Diagram Meter Design For Business Progress Sales Diagram
Our Strategy Diagram Meter Design For Business Progress Sales Diagram Powerpoint Templates Abhor Doodling. They Never Let The Interest Flag.

Consulting Diagram Business Dashboard Progress Meter Business Diagram
Be The Doer With Our Consulting Diagram Business Dashboard Progress Meter Business Diagram Powerpoint Templates. Put Your Thoughts Into Practice.
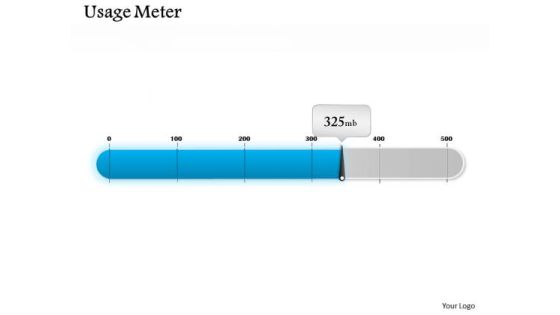
Mba Models And Frameworks Usage Meter Dashboard Design Consulting Diagram
Doll Up Your Thoughts With Our MBA Models And Frameworks Usage Meter Dashboard Design Consulting Diagram Powerpoint Templates. They Will Make A Pretty Picture.

Strategic Management Progress Meter Dashboard Design Marketing Diagram
Be A Donor Of Great Ideas. Display Your Charity On Our Strategic Management Progress Meter Dashboard Design Marketing Diagram Powerpoint Templates.

Business Framework Model Dashboard Business Meter Design Sales Diagram
Our Business Framework Model Dashboard Business Meter Design Sales Diagram Powerpoint Templates Team Are A Dogged Lot. They Keep At It Till They Get It Right.

Sales Diagram Dashboard Meter For Business Information Business Diagram
Our Sales Diagram Dashboard Meter For Business Information Business Diagram Powerpoint Templates Deliver At Your Doorstep. Let Them In For A Wonderful Experience.
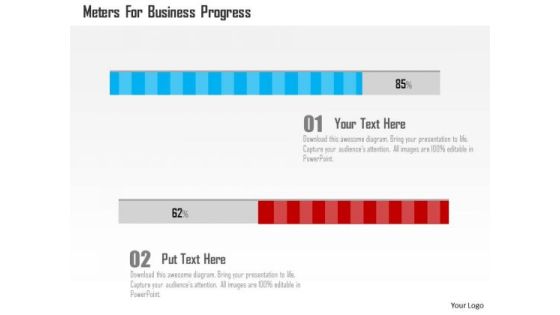
Business Diagram Meters For Business Progress Presentation Template
This business slide contains graphics of meter. You may use this slide to depict business progress. Download our above diagram to express information in a visual way.

Stock Photo Business Meter Displaying Maximum Value PowerPoint Slide
This PowerPoint slide displays business meter displaying maximum value. This image slide has been crafted with graphic of business meter with values. This image depicts business progress. Use this image slide to express views on success and achievements in your presentations. This image slide may also be used to display successful business model. Enhance the quality of your presentations using this image.

Dashboard Meter On Excel Ppt PowerPoint Presentation Icon Slides PDF
Showcasing this set of slides titled dashboard meter on excel ppt powerpoint presentation icon slides pdf. The topics addressed in these templates are dashboard meter on excel. All the content presented in this PPT design is completely editable. Download it and make adjustments in color, background, font etc. as per your unique business setting.
Fuel Meter Vector Icon Ppt PowerPoint Presentation Professional Examples PDF
Persuade your audience using this fuel meter vector icon ppt powerpoint presentation professional examples pdf. This PPT design covers four stages, thus making it a great tool to use. It also caters to a variety of topics including fuel meter vector icon. Download this PPT design now to present a convincing pitch that not only emphasizes the topic but also showcases your presentation skills.

Workforce Performance Measurement Meter Icon Ppt Portfolio Layouts PDF
Presenting Workforce Performance Measurement Meter Icon Ppt Portfolio Layouts PDF to dispense important information. This template comprises one stages. It also presents valuable insights into the topics including Workforce, Performance Measurement, Meter Icon. This is a completely customizable PowerPoint theme that can be put to use immediately. So, download it and address the topic impactfully.
Employee Work Performance Monitoring Meter Icon Background PDF
Showcasing this set of slides titled Employee Work Performance Monitoring Meter Icon Background PDF. The topics addressed in these templates are Monitoring Meter Icon, Employee Work Performance. All the content presented in this PPT design is completely editable. Download it and make adjustments in color, background, font etc. as per your unique business setting.
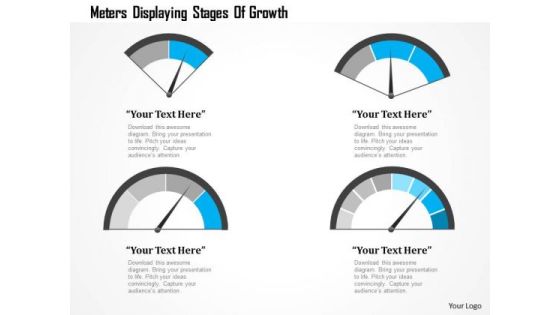
Business Diagram Meters Displaying Stages Of Growth Presentation Template
Graphic of four different meters has been used to craft this power point template. This PPT contains the concept of speed calculation. Use this PPT for your technology and mechanical topics in any presentations.
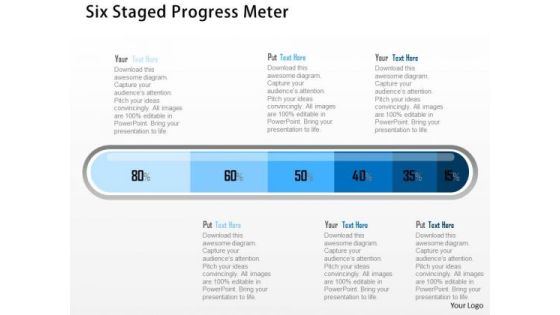
Business Diagram Six Staged Progress Meter Presentation Template
Our above business slide displays graphics of progress meter. This slide can be used as value chain example. This diagram provides an effective way of displaying information you can edit text, color, shade and style as per you need.

Business Diagram Meter For Strategy Implementation Process Presentation Template
This business diagram has been designed with graphic of meter displaying YTD growth. Use this slide to exhibit strategy implementation process. Use this slide for your business and marketing related presentations.

Product Quality Assurance Meter Ppt PowerPoint Presentation Slide Download
This is a product quality assurance meter ppt powerpoint presentation slide download. This is a five stage process. The stages in this process are bad, poor, average, good, excellent.

Accelerator Meter Speed Icon Ppt Powerpoint Presentation Professional Good
This is a accelerator meter speed icon ppt powerpoint presentation professional good. This is a three stage process. The stages in this process are accelerator, seed accelerators, startup accelerator.

Accelerator Speed Meter Icon Ppt Powerpoint Presentation Outline Layout
This is a accelerator speed meter icon ppt powerpoint presentation outline layout. This is a four stage process. The stages in this process are accelerator, seed accelerators, startup accelerator.
Speed Level Meter Icon Ppt Powerpoint Presentation Inspiration Slides
This is a speed level meter icon ppt powerpoint presentation inspiration slides. This is a four stage process. The stages in this process are accelerator, seed accelerators, startup accelerator.
Speed Meter Vector Icon Ppt Powerpoint Presentation Model Inspiration
This is a speed meter vector icon ppt powerpoint presentation model inspiration. This is a four stage process. The stages in this process are accelerator, seed accelerators, startup accelerator.
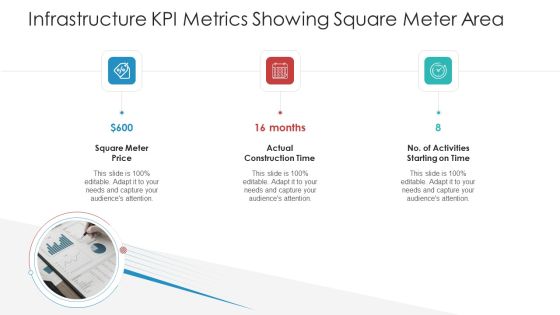
Infrastructure KPI Metrics Showing Square Meter Area Introduction PDF
This is a infrastructure kpi metrics showing square meter area introduction pdf template with various stages. Focus and dispense information on three stages using this creative set, that comes with editable features. It contains large content boxes to add your information on topics like square meter price actual, construction time, no of activities starting on time. You can also showcase facts, figures, and other relevant content using this PPT layout. Grab it now.

Stock Photo Meter Showing Excellent Level Of Quality PowerPoint Slide
This image is designed with 3d meter with business quality representation. Use this image in any business presentations to display various quality levels. This image is a powerful tool for business processes to exhibit quality and its levels along with its factors.

Current Detecting Meter Vector Icon Ppt PowerPoint Presentation Introduction
Presenting this set of slides with name current detecting meter vector icon ppt powerpoint presentation introduction. The topics discussed in these slides are Marketing, Business, Management, Planning, Strategy. This is a completely editable PowerPoint presentation and is available for immediate download. Download now and impress your audience.
Digits Meter Vector Icon Ppt Powerpoint Presentation Inspiration Portfolio
Presenting this set of slides with name digits meter vector icon ppt powerpoint presentation inspiration portfolio. The topics discussed in these slides are number icon, mathematical, number bar vector. This is a completely editable PowerPoint presentation and is available for immediate download. Download now and impress your audience.

Odograph Scrolling Meter Speed Ppt PowerPoint Presentation Complete Deck
Boost your confidence and team morale with this well-structured odograph scrolling meter speed ppt powerpoint presentation complete deck. This prefabricated set gives a voice to your presentation because of its well-researched content and graphics. Our experts have added all the components very carefully, thus helping you deliver great presentations with a single click. Not only that, it contains a set of twelven slides that are designed using the right visuals, graphics, etc. Various topics can be discussed, and effective brainstorming sessions can be conducted using the wide variety of slides added in this complete deck. Apart from this, our PPT design contains clear instructions to help you restructure your presentations and create multiple variations. The color, format, design anything can be modified as deemed fit by the user. Not only this, it is available for immediate download. So, grab it now.

Credit Score Meter Ppt PowerPoint Presentation Complete Deck With Slides
If designing a presentation takes a lot of your time and resources and you are looking for a better alternative, then this Credit Score Meter Ppt PowerPoint Presentation Complete Deck With Slides is the right fit for you. This is a prefabricated set that can help you deliver a great presentation on the topic. All the ten slides included in this sample template can be used to present a birds-eye view of the topic. These slides are also fully editable, giving you enough freedom to add specific details to make this layout more suited to your business setting. Apart from the content, all other elements like color, design, theme are also replaceable and editable. This helps in designing a variety of presentations with a single layout. Not only this, you can use this PPT design in formats like PDF, PNG, and JPG once downloaded. Therefore, without any further ado, download and utilize this sample presentation as per your liking.

Leading Indicators Lagging Indicators Graphics Ppt Slides
This is a leading indicators lagging indicators graphics ppt slides. This is a two stage process. The stages in this process are lagging indicator, employee engagement, management ability, leading indicator, process improvement, financial performance, customer loyalty.
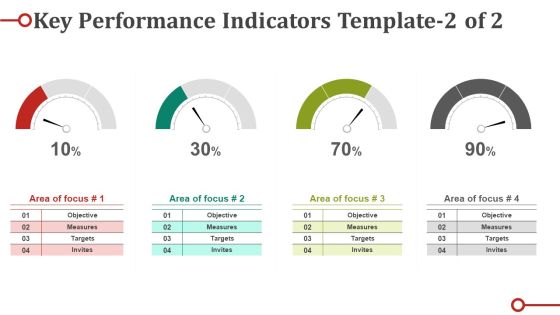
Key Performance Indicators Template 1 Ppt PowerPoint Presentation Styles Mockup
This is a key performance indicators template 1 ppt powerpoint presentation styles mockup. This is a four stage process. The stages in this process are dashboard, meter, business, marketing, speed.

Profit Business PowerPoint Template 0910
beautiful woman posing near profit loss meter
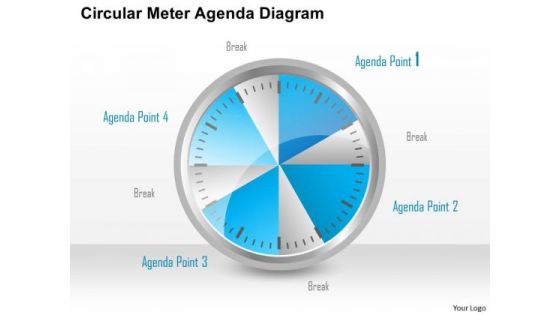
Consulting Slides Circular Meter Agenda Diagram Business Presentation
This circular process layout helps to describe the ordered set of steps required to complete a task. You can download this diagram to make awesome presentations in PowerPoint.
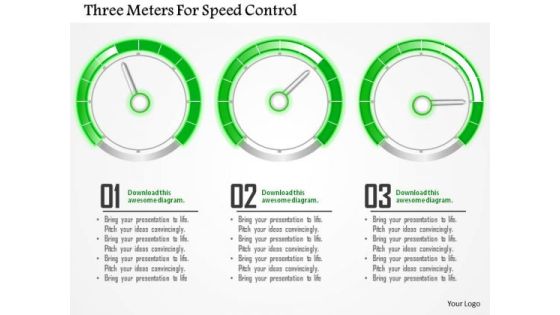
Business Diagram Three Meters For Speed Control Presentation Template
Graphic of three speedometers has been used to design this power point template. This diagram contains the concept of speed control. Amplify your thoughts via this appropriate business template.

Business Process Performance Indicators Ppt Slide Design
This is a business process performance indicators ppt slide design. This is a four stage process. The stages in this process are focus, objective, measures, targets, invites, vision and strategy, area of focus, metrics, targets, objectives.

Business Framework Performance Optimization PowerPoint Presentation
Explain the concept of performance optimization with this exclusive template slide. This PPT diagram slide contains the graphic of two meters with maximum ratings. Use this PPT diagram slide and build exclusive presentation for your viewers.

Key Performance Indicators Template 2 Ppt PowerPoint Presentation Ideas Background Images
This is a key performance indicators template 2 ppt powerpoint presentation ideas background images. This is a four stage process. The stages in this process are objective, measures, targets, invites.
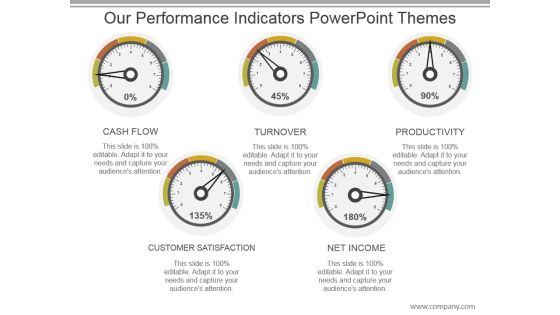
Our Performance Indicators Powerpoint Themes
This is a our performance indicators powerpoint themes. This is a five stage process. The stages in this process are cash flow, turnover, productivity, customer satisfaction, net income.

Customer Satisfaction Levels High Medium Low Indicator Dashboard Ppt PowerPoint Presentation Icon Show
This is a customer satisfaction levels high medium low indicator dashboard ppt powerpoint presentation icon show. This is a six stage process. The stages in this process are performance dashboard, performance meter, performance kpi.

Low High Performance Measurement Indicator Dashboard Ppt PowerPoint Presentation Summary Images
This is a low high performance measurement indicator dashboard ppt powerpoint presentation summary images. This is a five stage process. The stages in this process are performance dashboard, performance meter, performance kpi.

Hazard Meter Showing Three Danger Levels Ppt PowerPoint Presentation Infographic Template Examples
This is a hazard meter showing three danger levels ppt powerpoint presentation infographic template examples. This is a five stage process. The stages in this process are risk meter, risk speedometer, hazard meter.

Meter Showing Moderate Level Of Risk Ppt PowerPoint Presentation Model Summary
This is a meter showing moderate level of risk ppt powerpoint presentation model summary. This is a four stage process. The stages in this process are risk meter, risk speedometer, hazard meter.

Risk Meter With Pointer In Center Showing Medium Level Ppt PowerPoint Presentation Portfolio Templates
This is a risk meter with pointer in center showing medium level ppt powerpoint presentation portfolio templates. This is a three stage process. The stages in this process are risk meter, risk speedometer, hazard meter.
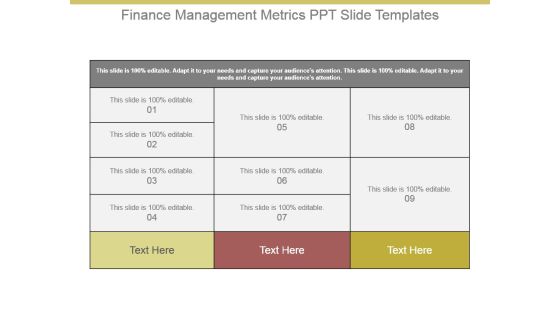
Finance Management Metrics Ppt Slide Templates
This is a finance management metrics ppt slide templates. This is a nine stage process. The stages in this process are business, marketing, management, table.

Key Metrics For Business Leadership Team Ppt Diagrams
This is a key metrics for business leadership team ppt diagrams. This is a five stage process. The stages in this process are kpi.
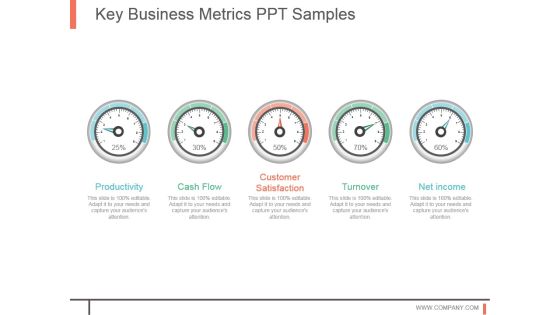
Key Business Metrics Ppt Samples
This is a key business metrics ppt samples. This is a five stage process. The stages in this process are productivity, cash flow, customer satisfaction, turnover, net income.

Balanced Scorecard Kpi S Ppt Slide Examples
This is a balanced scorecard kpi s ppt slide examples. This is a four stage process. The stages in this process are learning and growth, customer, financial, internal business processes.

Customer Satisfaction Framework Ppt Slide
This is a customer satisfaction framework ppt slide. This is a seven stage process. The stages in this process are task items, item.

Business Performance Measures Powerpoint Slide
This is a business performance measures powerpoint slide designs. This is a three stage process. The stages in this process are business, marketing, performance, presentation, management.
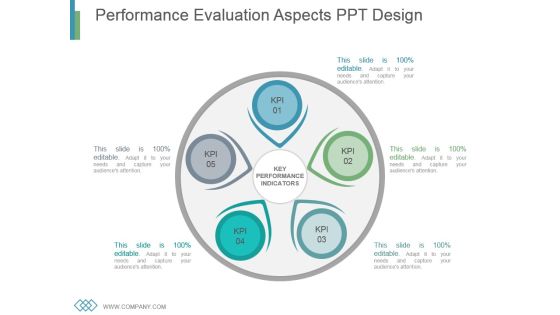
Performance Evaluation Aspects Ppt Design
This is a performance evaluation aspects ppt design. This is a five stage process. The stages in this process are business, marketing, process, strategy, management.

Business Improvement Metrics Example Ppt Presentation
This is a business improvement metrics example ppt presentation. This is a four stage process. The stages in this process are focus, area of focus, metrics, targets, objectives.

Company Accounts Planning Strategy Powerpoint Guide
This is a company accounts planning strategy powerpoint guide. This is a four stage process. The stages in this process are goal, target, planning, strategy, company.
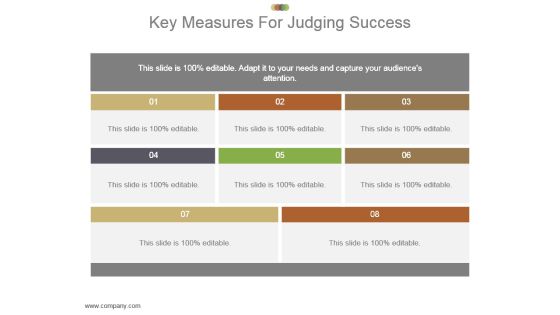
Key Measures For Judging Success Powerpoint Slide Ideas
This is a key measures for judging success powerpoint slide ideas. This is a eight stage process. The stages in this process are marketing, management, strategy, success, business.
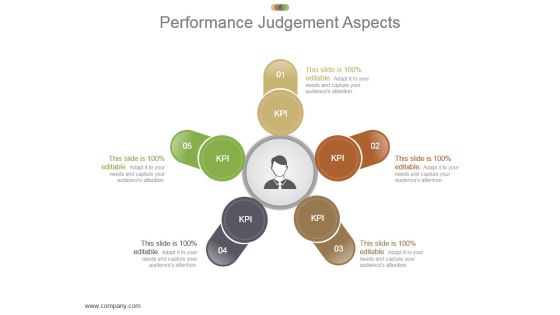
Performance Judgement Aspects Powerpoint Slide Information
This is a performance judgement aspects powerpoint slide information. This is a five stage process. The stages in this process are process, management, strategy, business, marketing.

 Home
Home