Gauge Chart

Representing Diverging Circular Flow Chart Relative Cycle Arrow Diagram PowerPoint Slides
We present our representing diverging circular flow chart Relative Cycle Arrow Diagram PowerPoint Slides.Present our Ring charts PowerPoint Templates because the world over it is a priority for many. Along with it there are so many oppurtunities waiting to be utilised. Download and present our Circle charts PowerPoint Templates because you know that the core of any organisation is the people who work for it. Use our Process and Flows PowerPoint Templates because you can Be the cynosure of all eyes with our template depicting . Download and present our Business PowerPoint Templates because infrastructure growth is an obvious requirement of today.inform your group on how exactly this potential is tailor made for you. Download and present our Marketing PowerPoint Templates because you know Coincidentally it will always point to the top.Use these PowerPoint slides for presentations relating to Button,cerulean, circle, circulation, cobalt,colorful, cyan, cycle, element,emblem, grayshadow, green,icon, indicator, interface, internet, label,link, load, marker, motion, movement,navigationpanel, next, orientation, pagsite, pink, pointer, previous, process, reload, rotation, satined, sign, signpost,smooth, sticker, sticky, symbol. The prominent colors used in the PowerPoint template are Gray, Black, White. Customers tell us our representing diverging circular flow chart Relative Cycle Arrow Diagram PowerPoint Slides are Vintage. We assure you our colorful PowerPoint templates and PPT Slides provide great value for your money. Be assured of finding the best projection to highlight your words. PowerPoint presentation experts tell us our representing diverging circular flow chart Relative Cycle Arrow Diagram PowerPoint Slides are Second to none. People tell us our cycle PowerPoint templates and PPT Slides are Zippy. We assure you our representing diverging circular flow chart Relative Cycle Arrow Diagram PowerPoint Slides are Magnificent. Use our circle PowerPoint templates and PPT Slides are Majestic.
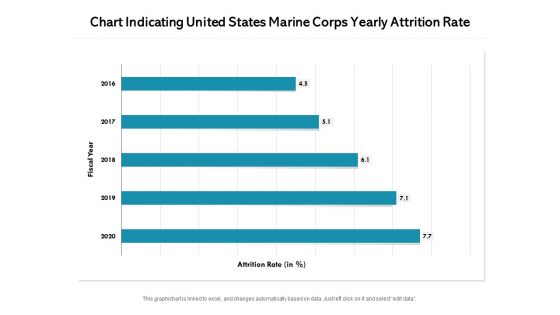
Chart Indicating United States Marine Corps Yearly Attrition Rate Ppt PowerPoint Presentation File Background Images PDF
Pitch your topic with ease and precision using this chart indicating united states marine corps yearly attrition rate ppt powerpoint presentation file background images pdf. This layout presents information on hart indicating united states marine corps yearly attrition rate. It is also available for immediate download and adjustment. So, changes can be made in the color, design, graphics or any other component to create a unique layout.
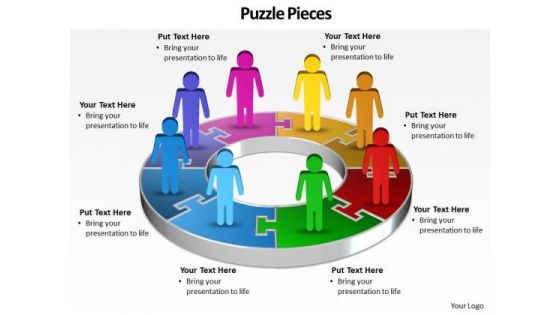
Ppt A Team Of Business People Standing On Pie PowerPoint Bar Chart Ks2 Pieces Templates
PPT a team of business people standing on pie powerpoint bar chart ks2 pieces Templates-This Business PowerPoint Diagram shows 3d linear abstraction to represent Business related issues. It uses three steps. It indicates employment, field, function, game, line, and livelihood. It is helpful to organize information. -PPT a team of business people standing on pie powerpoint bar chart ks2 pieces Templates-Abstract, Arrow, Art, Artistic, Background, Business, Colorful, Communication, Computer-Graphics, Concept, Creation, Data, Decoration, Decorative, Design, Design-Element, Digital, Direction, Effect, Elegance, Element, Energy, Flow, Go, Idea, Illustration, Modern, Movement, Network, Symbol
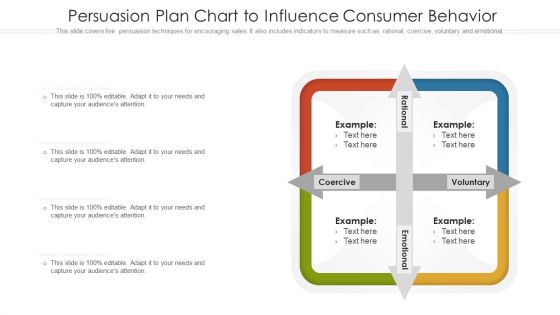
Persuasion Plan Chart To Influence Consumer Behavior Ppt PowerPoint Presentation Summary Design Templates PDF
This slide covers five persuasion techniques for encouraging sales. It also includes indicators to measure such as rational, coercive, voluntary and emotional. Persuade your audience using this persuasion plan chart to influence consumer behavior ppt powerpoint presentation summary design templates pdf. This PPT design covers four stages, thus making it a great tool to use. It also caters to a variety of topics including persuasion plan chart to influence consumer behavior. Download this PPT design now to present a convincing pitch that not only emphasizes the topic but also showcases your presentation skills.
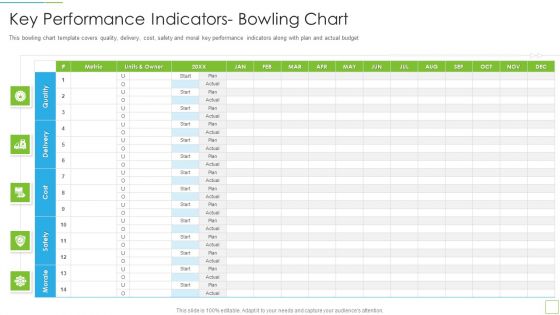
Hoshin Kanri Pitch Deck Key Performance Indicators Bowling Chart Introduction PDF
This bowling chart template covers quality, delivery, cost, safety and moral key performance indicators along with plan and actual budget Deliver an awe inspiring pitch with this creative hoshin kanri pitch deck key performance indicators bowling chart introduction pdf bundle. Topics like key performance indicators bowling chart can be discussed with this completely editable template. It is available for immediate download depending on the needs and requirements of the user.

Line Chart Indicating Yearly Business Data Ppt PowerPoint Presentation Styles Deck PDF
Showcasing this set of slides titled line chart indicating yearly business data ppt powerpoint presentation styles deck pdf. The topics addressed in these templates are line chart indicating yearly business data, 2013 to 2020. All the content presented in this PPT design is completely editable. Download it and make adjustments in color, background, font etc. as per your unique business setting.
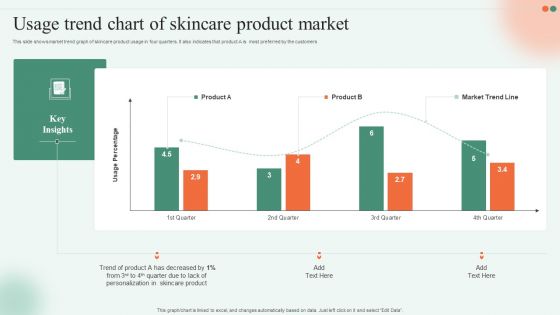
Usage Trend Chart Of Skincare Product Market Ppt Slides Graphics Download PDF
This slide shows market trend graph of skincare product usage in four quarters. It also indicates that product A is most preferred by the customers. Pitch your topic with ease and precision using this Usage Trend Chart Of Skincare Product Market Ppt Slides Graphics Download PDF. This layout presents information on Trend Product, Skincare Product, Quarter Due. It is also available for immediate download and adjustment. So, changes can be made in the color, design, graphics or any other component to create a unique layout.

Supplier Scorecard Supplier Comparison Scorecard With Key Performance Indicator Chart Formats PDF
This is a supplier scorecard supplier comparison scorecard with key performance indicator chart formats pdf template with various stages. Focus and dispense information on one stages using this creative set, that comes with editable features. It contains large content boxes to add your information on topics like supplier comparison scorecard, key performance, indicator chart. You can also showcase facts, figures, and other relevant content using this PPT layout. Grab it now.
Statistics Chart Indicating RD Expenditure Ppt PowerPoint Presentation Icon Example PDF
Presenting this set of slides with name statistics chart indicating rd expenditure ppt powerpoint presentation icon example pdf. The topics discussed in these slides are revenue, expenditure, competitor. This is a completely editable PowerPoint presentation and is available for immediate download. Download now and impress your audience.
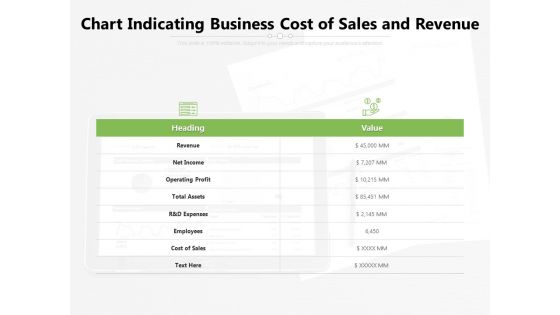
Chart Indicating Business Cost Of Sales And Revenue Ppt PowerPoint Presentation File Gridlines PDF
Presenting this set of slides with name chart indicating business cost of sales and revenue ppt powerpoint presentation file gridlines pdf. The topics discussed in these slides are revenue, operating, assets. This is a completely editable PowerPoint presentation and is available for immediate download. Download now and impress your audience.

Chart Showing Business Five Year Key Performance Indicators Ppt PowerPoint Presentation File Infographics PDF
Presenting this set of slides with name chart showing business five year key performance indicators ppt powerpoint presentation file infographics pdf. The topics discussed in these slides are liabilities, equity, assets. This is a completely editable PowerPoint presentation and is available for immediate download. Download now and impress your audience.

Number Of Processes And Their Stages Cycle Motion Chart PowerPoint Templates
We present our number of processes and their stages Cycle Motion Chart PowerPoint templates.Download our Symbol PowerPoint Templates because they are the indicators of the path you have in mind. Download and present our Arrows PowerPoint Templates because you can get advantage to prioritise your ideas. Present our Business PowerPoint Templates because you too have got the framework of your companys growth in place. Download our Shapes PowerPoint Templates because knowledge is power goes the popular saying. Download and present our Process and Flows PowerPoint Templates because the ideas and plans are on your finger tips.Use these PowerPoint slides for presentations relating to Abstract, Arrows, Blank, Business, Central, Centralized, Chart, Circle, Circular, Circulation, Concept, Conceptual, Converging, Design, Diagram, Empty, Executive, Five, Icon, Idea, Illustration, Management, Map, Mapping, Organization, Outwards, Pointing, Procedure, Process, Relationship, Strategy, Template. The prominent colors used in the PowerPoint template are White, Gray, Black. Use our number of processes and their stages Cycle Motion Chart PowerPoint templates are Festive. We assure you our Centralized PowerPoint templates and PPT Slides are Beautiful. People tell us our number of processes and their stages Cycle Motion Chart PowerPoint templates provide great value for your money. Be assured of finding the best projection to highlight your words. PowerPoint presentation experts tell us our Blank PowerPoint templates and PPT Slides are Colorful. PowerPoint presentation experts tell us our number of processes and their stages Cycle Motion Chart PowerPoint templates are Endearing. Use our Blank PowerPoint templates and PPT Slides are Stunning.
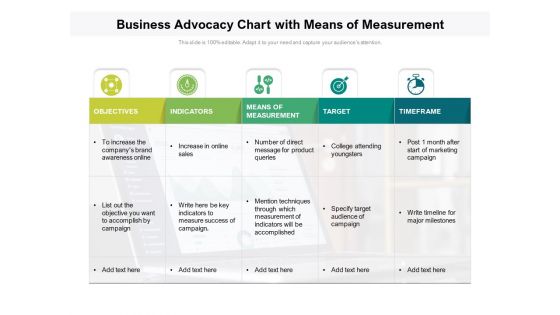
Business Advocacy Chart With Means Of Measurement Ppt PowerPoint Presentation Layouts Designs Download PDF
Presenting this set of slides with name business advocacy chart with means of measurement ppt powerpoint presentation layouts designs download pdf. The topics discussed in these slides are objectives, indicators, means of measurement, target, timeframe. This is a completely editable PowerPoint presentation and is available for immediate download. Download now and impress your audience.

Hoshin Kanri Strategic Planning System Chart With Annual Goals Ppt PowerPoint Presentation Gallery Graphics Design PDF
This slide illustrates the timeline for executing annual strategic goals and actions to be measured with key performance indicators. Showcasing this set of slides titled hoshin kanri strategic planning system chart with annual goals ppt powerpoint presentation gallery graphics design pdf. The topics addressed in these templates are product design, product development, annual goals. All the content presented in this PPT design is completely editable. Download it and make adjustments in color, background, font etc. as per your unique business setting.
Project Management Under Supervision Projects Tracking Chart With Multiple Stages Ideas PDF
This dashboard indicates the progress of multiple projects with completion status during different stages and client feedback. Deliver and pitch your topic in the best possible manner with this project management under supervision projects tracking chart with multiple stages ideas pdf. Use them to share invaluable insights on analysis, design, development, testing, live and impress your audience. This template can be altered and modified as per your expectations. So, grab it now.

Organization Chart And Corporate Model Transformation Restructuring Organization Risk Identification Inspiration PDF
This slide covers the challenge in reporting several performance indices is to assess whether an improvement in one is comparable with that in another. The indices in the chosen set are each given a usually estimated weighting to reflect their relative importance. Deliver an awe inspiring pitch with this creative organization chart and corporate model transformation restructuring organization risk identification inspiration pdf bundle. Topics like financials, customers, internal processes, learning and growth can be discussed with this completely editable template. It is available for immediate download depending on the needs and requirements of the user.
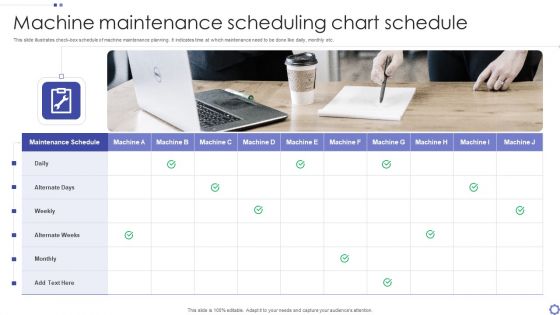
Machine Maintenance Scheduling Chart Schedule Ppt PowerPoint Presentation Ideas Design Ideas PDF
This slide illustrates check box schedule of machine maintenance planning. It indicates time at which maintenance need to be done like daily, monthly etc.Persuade your audience using this Machine Maintenance Scheduling Chart Schedule Ppt PowerPoint Presentation Ideas Design Ideas PDF This PPT design covers one stage, thus making it a great tool to use. It also caters to a variety of topics including Maintenance Schedule, Alternate Weeks, Machine Download this PPT design now to present a convincing pitch that not only emphasizes the topic but also showcases your presentation skills.

3d Linear Flow Navigation Arrow 2 Stages Ppt Working Chart PowerPoint Slides
We present our 3d linear flow navigation arrow 2 stages ppt working chart PowerPoint Slides. Use our Arrows PowerPoint Templates because; Highlight the key components of your entire manufacturing/ business process. Use our Symbol PowerPoint Templates because, guaranteed to focus the minds of your team. Use our Shapes PowerPoint Templates because, they are indicators of the path you have in mind. Use our Business PowerPoint Templates because, Shine the light on these thoughts and motivate your team to improve the quality of celebration for all around you. Use our Process and Flows PowerPoint Templates because, You sure have something unique, so use this template to expound on it and be rest assured that soon there will be an enthusiastic response and a purposeful Aye- Aye Sir. Use these PowerPoint slides for presentations relating to abstract, arrow, arrows business, chart, design, development, diagram, direction, element, flow, flowchart, graph, linear, management, model, motion, organization, plan, process, program, section, segment, set, sign, solution, strategy, symbol, technology. The prominent colors used in the PowerPoint template are Blue, Gray, and Black
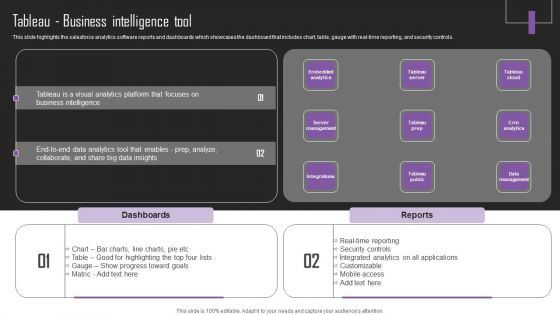
Web Hosting Software Company Outline Tableau Business Intelligence Tool Sample PDF
This slide highlights the salesforce analytics software reports and dashboards which showcases the dashboard that includes chart, table, gauge with real-time reporting, and security controls. This Web Hosting Software Company Outline Tableau Business Intelligence Tool Sample PDF from Slidegeeks makes it easy to present information on your topic with precision. It provides customization options, so you can make changes to the colors, design, graphics, or any other component to create a unique layout. It is also available for immediate download, so you can begin using it right away. Slidegeeks has done good research to ensure that you have everything you need to make your presentation stand out. Make a name out there for a brilliant performance.
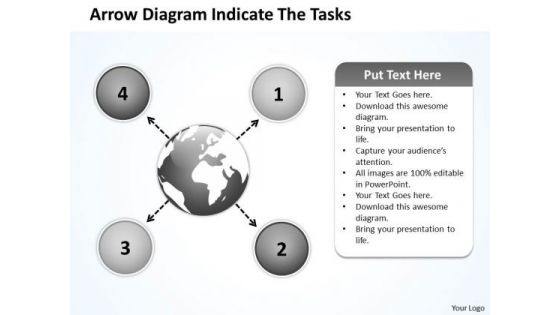
Arrow Diagram Indicate The Tasks Ppt Charts And PowerPoint Templates
We present our arrow diagram indicate the tasks ppt Charts and PowerPoint templates.Use our Process and Flows PowerPoint Templates because a lot of hard work has gone in and you are almost there. Download our Arrows PowerPoint Templates because you have the ideas, you have got a brainwave. Use our Business PowerPoint Templates because your thoughts are pointed and sharp as arrows. Download our Circle Charts PowerPoint Templates because you can Show them how you can save the day. Present our Flow Charts PowerPoint Templates because you have some excellent plans to spread some more of it across your community.Use these PowerPoint slides for presentations relating to Arrows, choice, connect, design, direction, flows, four, info graph, instruction, layout, manual, marketing, modern, one, option, order, page, paper, pointing, process, product, promotion, sequence, simple, special, step, symbol. The prominent colors used in the PowerPoint template are Black, White, Gray. Presenters tell us our arrow diagram indicate the tasks ppt Charts and PowerPoint templates will help them to explain complicated concepts. Professionals tell us our flows PowerPoint templates and PPT Slides are Enchanting. PowerPoint presentation experts tell us our arrow diagram indicate the tasks ppt Charts and PowerPoint templates are effectively colour coded to prioritise your plans They automatically highlight the sequence of events you desire. The feedback we get is that our four PowerPoint templates and PPT Slides are Beautiful. Use our arrow diagram indicate the tasks ppt Charts and PowerPoint templates are Efficient. Use our connect PowerPoint templates and PPT Slides are Ultra.

Project Administration Strategy Dashboard With Pie Charts Sample PDF
This slide cover a dashboard which includes indicators such as schedule, risk details, Status, alignment. It also includes issues, resource allocations and actuals. Pitch your topic with ease and precision using this Project Administration Strategy Dashboard With Pie Charts Sample PDF. This layout presents information on Communication Goal, Communication Tool, Increase Revenue. It is also available for immediate download and adjustment. So, changes can be made in the color, design, graphics or any other component to create a unique layout.

Steps Layout With Converging Arrows Pointing To Center Charts And Diagrams PowerPoint Slides
We present our steps layout with converging arrows pointing to center Charts and Diagrams PowerPoint Slides.Present our Arrows PowerPoint Templates because it focuses the light on the path to sure shot success. Download and present our Circle Charts PowerPoint Templates because you have a good idea of the roadmap to your desired destination. Download and present our Shapes PowerPoint Templates because this diagram provides trainers a tool to teach the procedure in a highly visual, engaging way. Present our Business PowerPoint Templates because it enlightens your team and colleagues on the critical factors involved. Present our Flow Charts PowerPoint Templates because it outlines the process with this innovative graphic to authenticate your plan of achieving the goal of added value/profit.Use these PowerPoint slides for presentations relating to 3d, abstract, all, around, arrow, aspect, attention, attract, blue, center, collect, colorful, conceptual, converge, course, cutout, direct, direction, factor, gather, globalization, go, green, guide, illustration, indicate, integration, isolated, location, many, movement, point, pointer, rainbow, reach, red, round, show, sides, sign, source, sphere, strategy, summon, symbol, target, unity, way, white, yellow. The prominent colors used in the PowerPoint template are Blue, Gray, Black. Presenters tell us our steps layout with converging arrows pointing to center Charts and Diagrams PowerPoint Slides are Royal. The feedback we get is that our aspect PowerPoint templates and PPT Slides are Clever. Presenters tell us our steps layout with converging arrows pointing to center Charts and Diagrams PowerPoint Slides are designed to make your presentations professional. You can be sure our attention PowerPoint templates and PPT Slides are Spectacular. People tell us our steps layout with converging arrows pointing to center Charts and Diagrams PowerPoint Slides are Ultra. PowerPoint presentation experts tell us our attract PowerPoint templates and PPT Slides are Endearing.

Steps Layout With Converging Arrows Pointing To Center Charts And Diagrams PowerPoint Slide
We present our steps layout with converging arrows pointing to center Charts and Diagrams PowerPoint Slide.Download our Arrows PowerPoint Templates because health of the determines the quality of our lives. Download and present our Circle Charts PowerPoint Templates because Our PowerPoint Templates and Slides will provide weight to your words. They will bring out the depth of your thought process. Use our Shapes PowerPoint Templates because it enlightens your team and colleagues on the critical factors involved. Download and present our Business PowerPoint Templates because this layout helps you to bring some important aspects of your business process to the notice of all concerned. Streamline the flow of information across the board. Download our Flow Charts PowerPoint Templates because Our PowerPoint Templates and Slides will let Your superior ideas hit the target always and everytime.Use these PowerPoint slides for presentations relating to 3d, abstract, all, around, arrow, aspect, attention, attract, blue, center, collect, colorful, conceptual, converge, course, cutout, direct, direction, factor, gather, globalization, go, green, guide, illustration, indicate, integration, isolated, location, many, movement, point, pointer, rainbow, reach, red, round, show, sides, sign, source, sphere, strategy, summon, symbol, target, unity, way, white, yellow. The prominent colors used in the PowerPoint template are Blue, Gray, Black. Presenters tell us our steps layout with converging arrows pointing to center Charts and Diagrams PowerPoint Slide are Quaint. The feedback we get is that our blue PowerPoint templates and PPT Slides are Great. Presenters tell us our steps layout with converging arrows pointing to center Charts and Diagrams PowerPoint Slide are designed by professionals You can be sure our arrow PowerPoint templates and PPT Slides are Whimsical. People tell us our steps layout with converging arrows pointing to center Charts and Diagrams PowerPoint Slide are Lush. PowerPoint presentation experts tell us our all PowerPoint templates and PPT Slides are Luxurious.
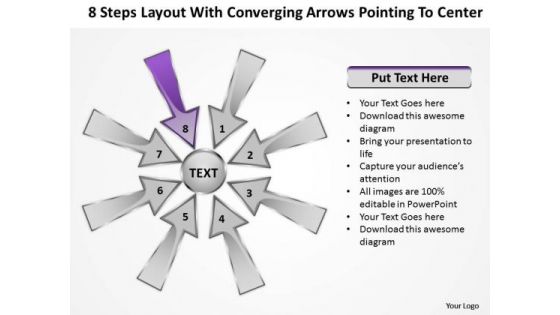
Steps Layout With Converging Arrow Pointing To Center Ppt Charts And Diagrams PowerPoint Slides
We present our steps layout with converging arrow pointing to center ppt Charts and Diagrams PowerPoint Slides.Present our Arrows PowerPoint Templates because Our PowerPoint Templates and Slides are the chords of your song. String them along and provide the lilt to your views. Use our Circle Charts PowerPoint Templates because you have a clear vision of the cake you want. Download our Shapes PowerPoint Templates because they will help you to organise the logic of your views. Present our Business PowerPoint Templates because you are ready to flap your wings and launch off. All poised are you to touch the sky with glory. Use our Flow Charts PowerPoint Templates because you are ready to flap your wings and launch off. All poised are you to touch the sky with glory.Use these PowerPoint slides for presentations relating to 3d, abstract, all, around, arrow, aspect, attention, attract, blue, center, collect, colorful, conceptual, converge, course, cutout, direct, direction, factor, gather, globalization, go, green, guide, illustration, indicate, integration, isolated, location, many, movement, point, pointer, rainbow, reach, red, round, show, sides, sign, source, sphere, strategy, summon, symbol, target, unity, way, white, yellow. The prominent colors used in the PowerPoint template are Purple, Gray, Black. Presenters tell us our steps layout with converging arrow pointing to center ppt Charts and Diagrams PowerPoint Slides are Chic. The feedback we get is that our all PowerPoint templates and PPT Slides are Swanky. Presenters tell us our steps layout with converging arrow pointing to center ppt Charts and Diagrams PowerPoint Slides are Pretty. You can be sure our aspect PowerPoint templates and PPT Slides are incredible easy to use. People tell us our steps layout with converging arrow pointing to center ppt Charts and Diagrams PowerPoint Slides are Graceful. PowerPoint presentation experts tell us our aspect PowerPoint templates and PPT Slides are Charming.

Steps Layout With Converging Arrows Pointing To Center Ppt Charts And Diagrams PowerPoint Slides
We present our steps layout with converging arrows pointing to center ppt Charts and Diagrams PowerPoint Slides.Present our Arrows PowerPoint Templates because this slide can help to bullet point your views. Download our Circle Charts PowerPoint Templates because you know your business and have a vision for it. Download and present our Shapes PowerPoint Templates because with the help of our Slides you can Illustrate these thoughts with this slide. Use our Business PowerPoint Templates because maximising sales of your product is the intended destination. Present our Flow Charts PowerPoint Templates because you require care and diligence to function well.Use these PowerPoint slides for presentations relating to 3d, abstract, all, around, arrow, aspect, attention, attract, blue, center, collect, colorful, conceptual, converge, course, cutout, direct, direction, factor, gather, globalization, go, green, guide, illustration, indicate, integration, isolated, location, many, movement, point, pointer, rainbow, reach, red, round, show, sides, sign, source, sphere, strategy, summon, symbol, target, unity, way, white, yellow. The prominent colors used in the PowerPoint template are Purple, Gray, Black. Presenters tell us our steps layout with converging arrows pointing to center ppt Charts and Diagrams PowerPoint Slides are Amazing. The feedback we get is that our attention PowerPoint templates and PPT Slides are second to none. Presenters tell us our steps layout with converging arrows pointing to center ppt Charts and Diagrams PowerPoint Slides are visually appealing. You can be sure our aspect PowerPoint templates and PPT Slides are Multicolored. People tell us our steps layout with converging arrows pointing to center ppt Charts and Diagrams PowerPoint Slides are Endearing. PowerPoint presentation experts tell us our around PowerPoint templates and PPT Slides are Majestic.
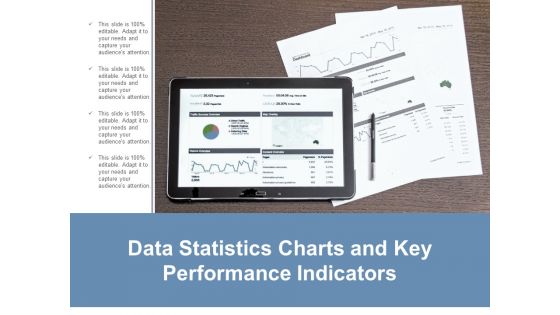
Data Statistics Charts And Key Performance Indicators Ppt Powerpoint Presentation Layouts Guide
This is a data statistics charts and key performance indicators ppt powerpoint presentation layouts guide. This is a four stage process. The stages in this process are business metrics, business kpi, business dashboard.

8 Stages Involved Course Of Action Ppt Production Flow Charts PowerPoint Slides
We present our 8 stages involved course of action ppt production flow charts PowerPoint Slides.Download our Leadership PowerPoint Templates because this diagram can be used to illustrate the logical path or system. Download our Shapes PowerPoint Templates because it Educates your team with your thoughts and logic. Present our Signs PowerPoint Templates because some opportunities are bound to be highly profitable for you to follow up. Use our Arrows PowerPoint Templates because we all know that alphabetical order is a time honoured concept. Download our Process and Flows PowerPoint Templates because this slide helps you to give your team an overview of your capability and insight into the minute details of the overall picture highlighting the interdependence at every operational level.Use these PowerPoint slides for presentations relating to Around, Arrows, artistic, bevel, bright, concept, conceptual, decrease, design, direction, down, ecology, high, icon, illustration, increase, indication, isolated, low, motion, movement, nature, opposite, point, protection, recycling, red, reflection, renewable, reuse, set, shinning, sign, stylish, symbol. The prominent colors used in the PowerPoint template are White, Black, Gray. The feedback we get is that our 8 stages involved course of action ppt production flow charts PowerPoint Slides are Youthful. People tell us our decrease PowerPoint templates and PPT Slides are Wistful. We assure you our 8 stages involved course of action ppt production flow charts PowerPoint Slides are Striking. Presenters tell us our design PowerPoint templates and PPT Slides are Gorgeous. We assure you our 8 stages involved course of action ppt production flow charts PowerPoint Slides are Charming. Use our concept PowerPoint templates and PPT Slides are Dynamic.
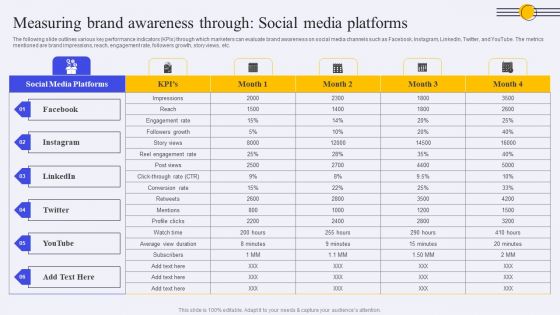
Measuring Brand Awareness Through Social Media Platforms Ppt PowerPoint Presentation Diagram Graph Charts PDF
The following slide outlines various key performance indicators KPIs through which marketers can evaluate brand awareness on social media channels such as Facebook, Instagram, LinkedIn, Twitter, and YouTube. The metrics mentioned are brand impressions, reach, engagement rate, followers growth, story views, etc. The best PPT templates are a great way to save time, energy, and resources. Slidegeeks have 100 percent editable powerpoint slides making them incredibly versatile. With these quality presentation templates, you can create a captivating and memorable presentation by combining visually appealing slides and effectively communicating your message. Download Measuring Brand Awareness Through Social Media Platforms Ppt PowerPoint Presentation Diagram Graph Charts PDF from Slidegeeks and deliver a wonderful presentation.

Ppt Theme 3d Illustration Of Straightaway Arrow Flow Activity Charts Diagram 7 Image
We present our PPT Theme 3d illustration of straightaway arrow flow activity charts diagram 7 Image. Use our Arrows PowerPoint Templates because, Like your thoughts arrows are inherently precise and true. Use our Symbol PowerPoint Templates because; represent the progress in our lives. Use our Business PowerPoint Templates because, You have the process in your head, our template design showing will illuminate your thoughts. Use our Process and Flows PowerPoint Templates because, you have analyzed the illness and know the need. Use our Marketing PowerPoint Templates because, now fire the arrows to emblazon the desired path by which you will achieve anticipated results. Use these PowerPoint slides for presentations relating to Aim, Angle, Arrow, Arrowheads, Badge, Banner, Connection, Curve, Design, Direction, Download, Element, Fuchsia, Icon, Illustration, Indicator, Internet, Label, Link, Magenta, Mark, Marker, Next, Object, Orientation, Pointer, Shadow, Shape, Signs, Symbol. The prominent colors used in the PowerPoint template are Green, Gray, and Black

Ppt Series Of Continual Free Custom Presentation PowerPoint Charts Plan 4 Image
We present our PPT series of continual free custom presentation PowerPoint charts plan 4 Image. Use our Symbol PowerPoint Templates because, Brilliant ideas are your forte. Use our Shapes PowerPoint Templates because, Focus on each one and investigate which one would be the best fit for your needs. Use our Signs PowerPoint Templates because; Focus the light on the path to sure shot success. Use our Business PowerPoint Templates because; now imprint them on the minds of your audience via our slides. Use our Arrows PowerPoint Templates because; educate your staff on the means to provide the required support for speedy recovery. Use these PowerPoint slides for presentations relating to arrow, arrowheads, badge, banner, cerulean, colored, colorful, connection, design element, designator, directional, download, emblem, indicator, interface, internet, magenta, marker, matted, menu tool, navigation panel, next, orientation, page site, pictogram, pointer, sign. The prominent colors used in the PowerPoint template are Yellow, Gray, and White

Ppt Theme Beeline Flow Manner Charts Arrow Ishikawa Diagram PowerPoint Template 9 Design
We present our PPT Theme beeline flow manner charts arrow ishikawa diagram PowerPoint template 9 design. Use our Arrows PowerPoint Templates because, you have a great training programmed in mind to upgrade the skills of your staff. Use our Symbol PowerPoint Templates because, to achieve sure shot success they need to come together at the right time, place and manner. Use our Business PowerPoint Templates because, Marketing Strategy Business Template: - Maximizing sales of your product is the intended destination. Use our Process and Flows PowerPoint Templates because, our ready backdrops leave a lasting impression. Use our Marketing PowerPoint Templates because, you have the people in place, selected the team leaders and all are raring to go. Use these PowerPoint slides for presentations relating to Aim, Angle, Arrow, Arrowheads, Badge, Banner, Connection, Curve, Design, Direction, Download, Element, Fuchsia, Icon, Illustration, Indicator, Internet, Label, Link, Magenta, Mark, Marker, Next, Object, Orientation, Pointer, Shadow, Shape, Signs, Symbol. The prominent colors used in the PowerPoint template are Blue, Gray, and Black

Data Center Architecture Management Best Practices Introduction PDF
This slide covers data center infrastructure management best practices. It involves gauge resource requirements, adopt consistence system of record, implement monitoring and patch servers. Persuade your audience using this Data Center Architecture Management Best Practices Introduction PDF. This PPT design covers four stages, thus making it a great tool to use. It also caters to a variety of topics including Implement Ongoing Monitoring, Consistence System Of Record, Gauge Resource Requirements. Download this PPT design now to present a convincing pitch that not only emphasizes the topic but also showcases your presentation skills.

PR Plan Approaches With Rethink Goals Ppt PowerPoint Presentation Summary Slide Download
Presenting this set of slides with name pr plan approaches with rethink goals ppt powerpoint presentation summary slide download. This is a three stage process. The stages in this process are rethink goals, gauge impact on search, long term narrative vs episodic campaign. This is a completely editable PowerPoint presentation and is available for immediate download. Download now and impress your audience.
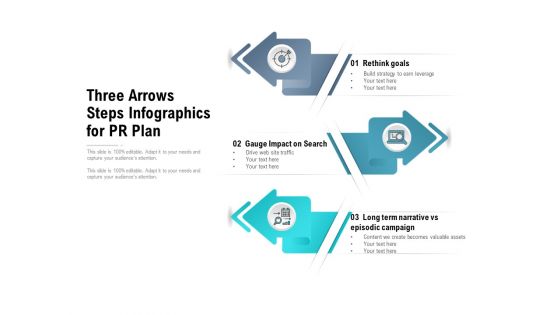
Three Arrows Steps Infographics For PR Plan Ppt PowerPoint Presentation Slides Design Templates
Presenting this set of slides with name three arrows steps infographics for pr plan ppt powerpoint presentation slides design templates. This is a three stage process. The stages in this process are rethink goals, gauge impact on search, long term narrative vs episodic campaign. This is a completely editable PowerPoint presentation and is available for immediate download. Download now and impress your audience.

Employee Work Time Utilization Analysis Graph Mockup PDF
The following slide highlights the employee work time assessment to gauge their productivity. It includes activities such as daily tasks, research, meetings, reports, contracting, travel, etc. Showcasing this set of slides titled Employee Work Time Utilization Analysis Graph Mockup PDF. The topics addressed in these templates are Employee Work Time, Utilization Analysis Graph. All the content presented in this PPT design is completely editable. Download it and make adjustments in color, background, font etc. as per your unique business setting.

Measuring Influencer Marketing ROI Metric Brand Engagement Total Themes PDF
Analyze which posts drew the best engagement likes and comments. The feedback by customers help you gauge customers reactions to your products. Deliver an awe-inspiring pitch with this creative measuring influencer marketing roi metric brand engagement total themes pdf bundle. Topics like engagement over time, total engagement, engagement by content type can be discussed with this completely editable template. It is available for immediate download depending on the needs and requirements of the user.
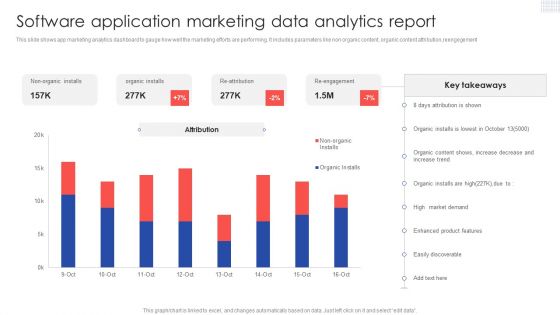
Software Application Marketing Data Analytics Report Mockup PDF
This slide shows app marketing analytics dashboard to gauge how well the marketing efforts are performing. It includes parameters like non organic content, organic content attribution,reengegement. Showcasing this set of slides titled Software Application Marketing Data Analytics Report Mockup PDF. The topics addressed in these templates are Software Application, Marketing Data, Analytics Report. All the content presented in this PPT design is completely editable. Download it and make adjustments in color, background, font etc. as per your unique business setting.
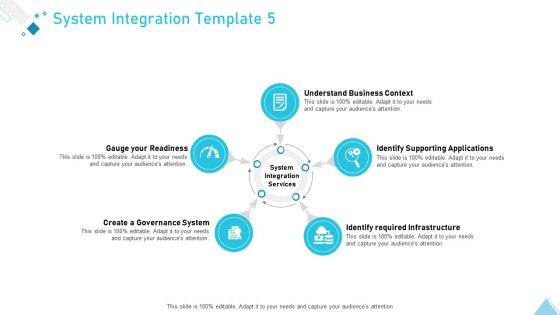
Business Strategy Planning Model System Integration Services Ppt Inspiration Microsoft PDF
This is a business strategy planning model system integration services ppt inspiration microsoft pdf template with various stages. Focus and dispense information on five stages using this creative set, that comes with editable features. It contains large content boxes to add your information on topics like business context, supporting applications, system integration services, governance system, gauge your readiness. You can also showcase facts, figures, and other relevant content using this PPT layout. Grab it now.
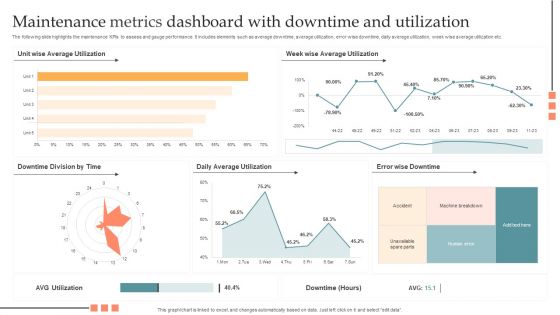
Maintenance Metrics Dashboard With Downtime And Utilization Pictures PDF
The following slide highlights the maintenance KPIs to assess and gauge performance. It includes elements such as average downtime, average utilization, error wise downtime, daily average utilization, week wise average utilization etc. Showcasing this set of slides titled Maintenance Metrics Dashboard With Downtime And Utilization Pictures PDF. The topics addressed in these templates are Maintenance Metrics Dashboard, Downtime And Utilization. All the content presented in this PPT design is completely editable. Download it and make adjustments in color, background, font etc. as per your unique business setting.
Budget Benchmark Report For Oncology Clinical Studies At Global Level Icons PDF
The slide showcases budget benchmarking to gauge and improve financial results by selecting few operating ratios by which company wants to measure its results and manage assets. Showcasing this set of slides titled Budget Benchmark Report For Oncology Clinical Studies At Global Level Icons PDF. The topics addressed in these templates are Benchmark Source, Key Insights, Actual Budget. All the content presented in this PPT design is completely editable. Download it and make adjustments in color, background, font etc. as per your unique business setting.

Dashboard For Measuring And Assessing Communication Tactics Information PDF
This slide represents dashboard to assess and gauge internal communication approaches which benefits industries in assessing strategy, plan gaps and build efficient employee engagement. Elements included in this slide are engagement score, employee satisfaction rate, communication tools and strategies, etc. Showcasing this set of slides titled Dashboard For Measuring And Assessing Communication Tactics Information PDF. The topics addressed in these templates are Employee Engagement, Employee Response Rate, Communication Effectiveness. All the content presented in this PPT design is completely editable. Download it and make adjustments in color, background, font etc. as per your unique business setting.
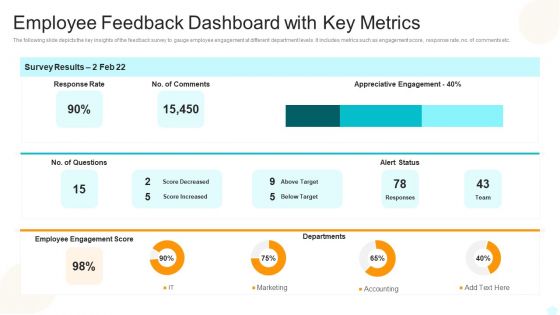
Employee Feedback Dashboard With Key Metrics Elements PDF
The following slide depicts the key insights of the feedback survey to gauge employee engagement at different department levels. It includes metrics such as engagement score, response rate, no. of comments etc.Showcasing this set of slides titled Employee Feedback Dashboard With Key Metrics Elements PDF The topics addressed in these templates are Employee Feedback Dashboard With Key Metrics All the content presented in this PPT design is completely editable. Download it and make adjustments in color, background, font etc. as per your unique business setting.
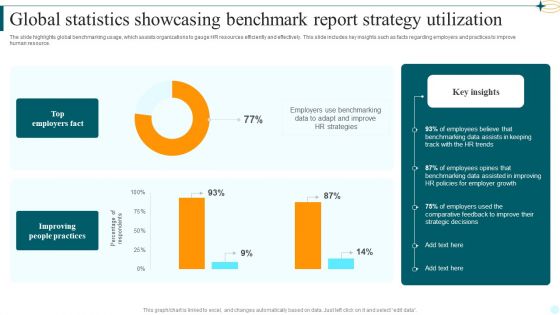
Global Statistics Showcasing Benchmark Report Strategy Utilization Mockup PDF
The slide highlights global benchmarking usage, which assists organizations to gauge HR resources efficiently and effectively. This slide includes key insights such as facts regarding employers and practices to improve human resource. Showcasing this set of slides titled Global Statistics Showcasing Benchmark Report Strategy Utilization Mockup PDF. The topics addressed in these templates are Top Employers Fact, Improving People Practices, Employers Use Benchmarking. All the content presented in this PPT design is completely editable. Download it and make adjustments in color, background, font etc. as per your unique business setting.
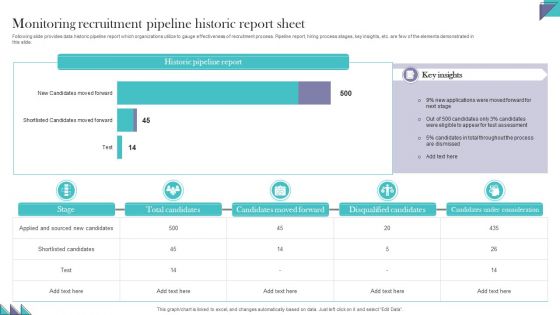
Monitoring Recruitment Pipeline Historic Report Sheet Pictures PDF
Following slide provides data historic pipeline report which organizations utilize to gauge effectiveness of recruitment process. Pipeline report, hiring process stages, key insights, etc. are few of the elements demonstrated in this slide. Pitch your topic with ease and precision using this Monitoring Recruitment Pipeline Historic Report Sheet Pictures PDF. This layout presents information on Candidates Moved Forward, Disqualified Candidates, Candidates Under Consideration. It is also available for immediate download and adjustment. So, changes can be made in the color, design, graphics or any other component to create a unique layout
Data Centre Architecture Model Management Best Practices Ppt Icon Design Inspiration PDF
This slide covers data centre architecture model management best practices to improve the efficiency of the overall process. It involves gauging resource requirements, adopting a consistent system of record, and implementing monitoring and patching servers. Persuade your audience using this Data Centre Architecture Model Management Best Practices Ppt Icon Design Inspiration PDF. This PPT design covers four stages, thus making it a great tool to use. It also caters to a variety of topics including Gauge Resource Requirements, Consistence System Record, Implement Ongoing Monitoring, Patch Servers. Download this PPT design now to present a convincing pitch that not only emphasizes the topic but also showcases your presentation skills.

Essential Metrics For Loyalty Incentives Program Performance Microsoft PDF
This slide represents the key metrics to gauge customer satisfaction with a loyalty program. It includes information on four parameters, including the customer engagement score, net promoter score, and customer loyalty index, among others.Persuade your audience using this Essential Metrics For Loyalty Incentives Program Performance Microsoft PDF. This PPT design covers four stages, thus making it a great tool to use. It also caters to a variety of topics including Net Promoter Score, Customer Engagement Score. Download this PPT design now to present a convincing pitch that not only emphasizes the topic but also showcases your presentation skills.

Export Process Checklist To Evaluate Progress Sample PDF
This slide showcases the checklist for the export process to gauge progress. It incudes activities such as conduct SWOT analysis, develop plan, obtain an order. Obtain export license, checking inventory to manufacture, prepare and send invoice and documentation. Showcasing this set of slides titled Export Process Checklist To Evaluate Progress Sample PDF. The topics addressed in these templates are Checking Supply Availability, Confirm Sale Terms, Packing Slip. All the content presented in this PPT design is completely editable. Download it and make adjustments in color, background, font etc. as per your unique business setting.

Improving Buyer Journey Through Strategic Customer Engagement Post Purchase Customer Satisfaction Survey Sample PDF
This slide depicts a customer survey to gauge customer satisfaction levels and identify potential areas for development. It includes questions related to services provided by the company and the ranking system. Want to ace your presentation in front of a live audience Our Improving Buyer Journey Through Strategic Customer Engagement Post Purchase Customer Satisfaction Survey Sample PDF can help you do that by engaging all the users towards you.. Slidegeeks experts have put their efforts and expertise into creating these impeccable powerpoint presentations so that you can communicate your ideas clearly. Moreover, all the templates are customizable, and easy-to-edit and downloadable. Use these for both personal and commercial use.
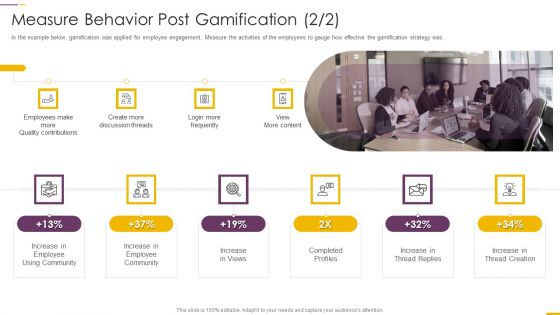
How Build Gamification Advertising Plan Measure Behavior Post Gamification Ppt File Example PDF
In the example below, gamification was applied for employee engagement. Measure the activities of the employees to gauge how effective the gamification strategy was. Presenting how build gamification advertising plan measure behavior post gamification ppt file example pdf to provide visual cues and insights. Share and navigate important information on six stages that need your due attention. This template can be used to pitch topics like measure behavior post gamification. In addtion, this PPT design contains high resolution images, graphics, etc, that are easily editable and available for immediate download.
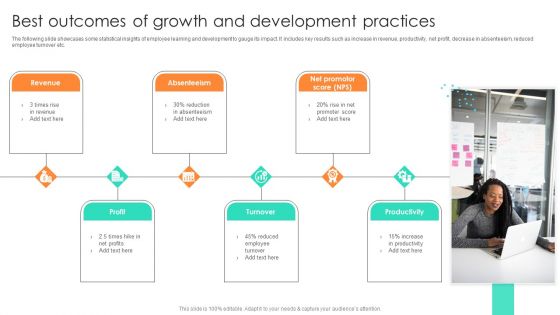
Best Outcomes Of Growth And Development Practices Template PDF
The following slide showcases some statistical insights of employee learning and development to gauge its impact. It includes key results such as increase in revenue, productivity, net profit, decrease in absenteeism, reduced employee turnover etc. Presenting Best Outcomes Of Growth And Development Practices Template PDF to dispense important information. This template comprises six stages. It also presents valuable insights into the topics including Revenue, Absenteeism, Profit. This is a completely customizable PowerPoint theme that can be put to use immediately. So, download it and address the topic impactfully.

Strategies To Optimize Export Logistic Process Graphics PDF
This slide showcases the checklist for the export process to gauge progress. It incudes activities such as conduct SWOT analysis, develop plan, obtain an order. Obtain export license, checking inventory to manufacture, prepare and send invoice and documentation. Persuade your audience using this Strategies To Optimize Export Logistic Process Graphics PDF. This PPT design covers Three stages, thus making it a great tool to use. It also caters to a variety of topics including Transportation, Automation, People Management. Download this PPT design now to present a convincing pitch that not only emphasizes the topic but also showcases your presentation skills.

Community Outreach Steps For Non Building A Winning Community Outreach Strategy SS V
This slide covers activities to reach audience of different communities by non profits. The purpose of this template is to provide an overview of different steps such as listing down community goals, consulting with donors and recipients, ensuring to work together, setting standards to gauge result, encouraging discussion to forge relationships, etc. Slidegeeks is here to make your presentations a breeze with Community Outreach Steps For Non Building A Winning Community Outreach Strategy SS V With our easy-to-use and customizable templates, you can focus on delivering your ideas rather than worrying about formatting. With a variety of designs to choose from, you are sure to find one that suits your needs. And with animations and unique photos, illustrations, and fonts, you can make your presentation pop. So whether you are giving a sales pitch or presenting to the board, make sure to check out Slidegeeks first
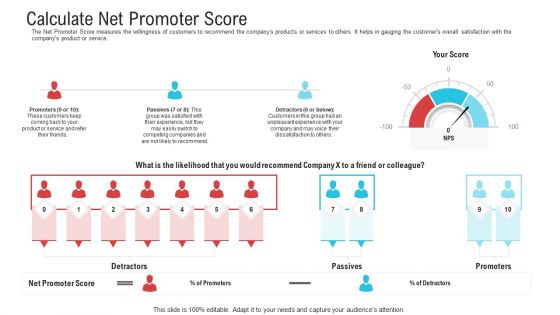
Objective To Improve Customer Experience Calculate Net Promoter Score Slides PDF
The Net Promoter Score measures the willingness of customers to recommend the companys products or services to others. It helps in gauging the customers overall satisfaction with the companys product or service.Deliver an awe-inspiring pitch with this creative objective to improve customer experience calculate net promoter score slides pdf. bundle. Topics like calculate net promoter score can be discussed with this completely editable template. It is available for immediate download depending on the needs and requirements of the user.
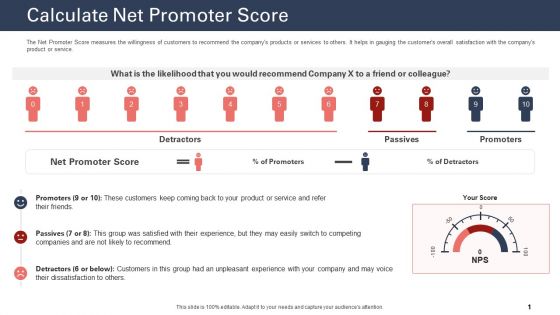
Techniques To Increase Customer Satisfaction Calculate Net Promoter Score Diagrams PDF
The Net Promoter Score measures the willingness of customers to recommend the companys products or services to others. It helps in gauging the customers overall satisfaction with the companys product or service. Deliver an awe inspiring pitch with this creative techniques to increase customer satisfaction calculate net promoter score diagrams pdf bundle. Topics like calculate net promoter score, product or service, net promoter score can be discussed with this completely editable template. It is available for immediate download depending on the needs and requirements of the user.
Calculate Net Promoter Score Steps To Improve Customer Engagement For Business Development Icons PDF
The Net Promoter Score measures the willingness of customers to recommend the companys products or services to others. It helps in gauging the customers overall satisfaction with the companys product or service.Deliver an aweinspiring pitch with this creative calculate net promoter score steps to improve customer engagement for business development icons pdf bundle. Topics like detractors, passives, promoters, net promoter score can be discussed with this completely editable template. It is available for immediate download depending on the needs and requirements of the user.
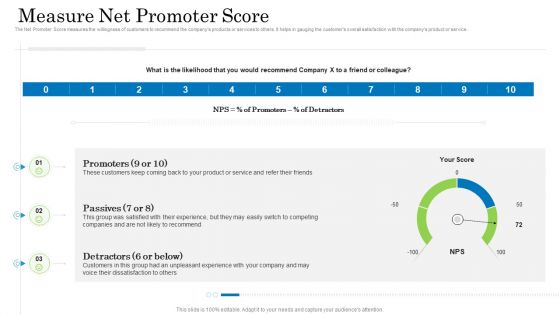
Customer Behavioral Data And Analytics Measure Net Promoter Score Mockup PDF
The Net Promoter Score measures the willingness of customers to recommend the companys products or services to others. It helps in gauging the customers overall satisfaction with the companys product or service. Deliver and pitch your topic in the best possible manner with this customer behavioral data and analytics measure net promoter score mockup pdf. Use them to share invaluable insights on promoters, passives, detractors and impress your audience. This template can be altered and modified as per your expectations. So, grab it now.

Cloud Readiness Evaluation Index Ppt Model Shapes Pdf
The slide showcases maturity and readiness assessment index that assist in gauging organizations cloud strategy across business operations. It contains points such as ad hoc, defined, managed, optimized. Showcasing this set of slides titled Cloud Readiness Evaluation Index Ppt Model Shapes Pdf. The topics addressed in these templates are HOC, Defined, Managed, Optimized. All the content presented in this PPT design is completely editable. Download it and make adjustments in color, background, font etc. as per your unique business setting.
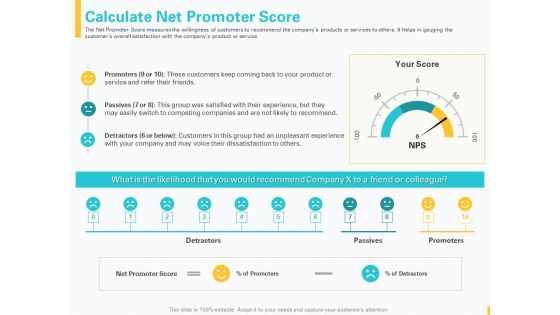
Designing Great Client Experience Action Plan Calculate Net Promoter Score Ppt Gallery Ideas PDF
The Net Promoter Score measures the willingness of customers to recommend the companys products or services to others. It helps in gauging the customers overall satisfaction with the companys product or service. This is a designing great client experience action plan calculate net promoter score ppt gallery ideas pdf template with various stages. Focus and dispense information on one stages using this creative set, that comes with editable features. It contains large content boxes to add your information on topics like promoters, passives, detractors, customers, net promoter score. You can also showcase facts, figures, and other relevant content using this PPT layout. Grab it now.
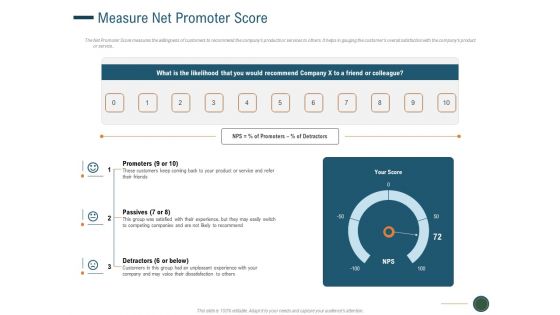
Enhance Profit Client Journey Analysis Measure Net Promoter Score Clipart PDF
The Net Promoter Score measures the willingness of customers to recommend the companys products or services to others. It helps in gauging the customers overall satisfaction with the companys product or service. This is a enhance profit client journey analysis measure net promoter score clipart pdf template with various stages. Focus and dispense information on three stages using this creative set, that comes with editable features. It contains large content boxes to add your information on topics like promoters, passives, detractors. You can also showcase facts, figures, and other relevant content using this PPT layout. Grab it now.
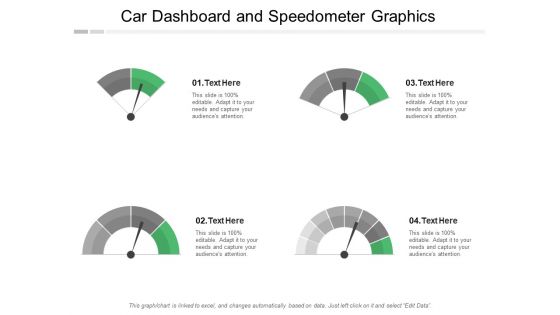
Car Dashboard And Speedometer Graphics Ppt PowerPoint Presentation File Graphics Template
This is a car dashboard and speedometer graphics ppt powerpoint presentation file graphics template. This is a four stage process. The stages in this process are fuel gauge, gas gauge, fuel containers.

 Home
Home