Funnel Outputs

Traction What Have We Achieved So Far Ppt PowerPoint Presentation Visuals
This is a traction what have we achieved so far ppt powerpoint presentation visuals. This is a three stage process. The stages in this process are product ready, partners in 25 countries.

Competitive Analysis Template 1 Ppt PowerPoint Presentation Clipart
This is a competitive analysis template 1 ppt powerpoint presentation clipart. This is a five stage process. The stages in this process are competitive factor, years of existence, location, products or service, business reputation.
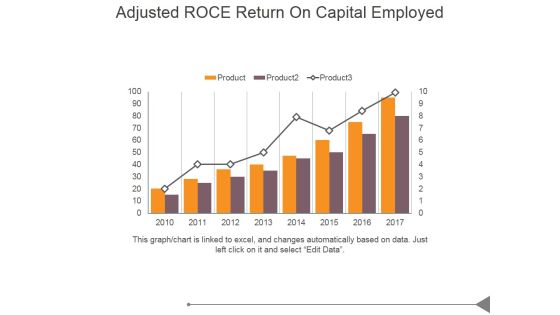
Adjusted Roce Return On Capital Employed Ppt PowerPoint Presentation Tips
This is a adjusted roce return on capital employed ppt powerpoint presentation tips. This is a eight stage process. The stages in this process are business, marketing, success, product, growth.

Market Budget Ppt PowerPoint Presentation Infographics
This is a market budget ppt powerpoint presentation infographics. This is a five stage process. The stages in this process are marketing objectives, target marketing, business opportunities, competition, product and services.

Stacked Area Clustered Column Ppt PowerPoint Presentation Clipart
This is a stacked area clustered column ppt powerpoint presentation clipart. This is a four stage process. The stages in this process are in percentage, stacked area clustered column, product.
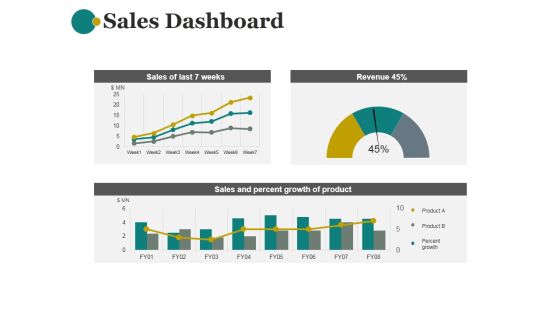
Sales Dashboard Template 1 Ppt PowerPoint Presentation Show
This is a sales dashboard template 1 ppt powerpoint presentation show. This is a three stage process. The stages in this process are sales of last 7 weeks, revenue, sales and percent growth of product.
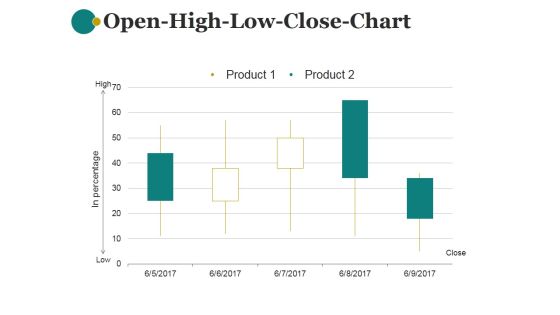
Open High Low Close Chart Ppt PowerPoint Presentation Information
This is a open high low close chart ppt powerpoint presentation information. This is a five stage process. The stages in this process are product, in percentage, close, low, high.
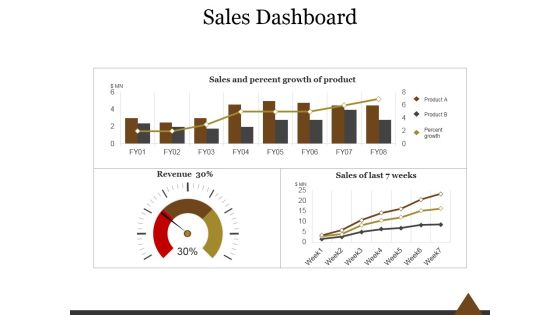
Sales Dashboard Template 1 Ppt PowerPoint Presentation Layouts
This is a sales dashboard template 1 ppt powerpoint presentation layouts. This is a three stage process. The stages in this process are sales and percent growth of product, sales of last weeks, percent growth.
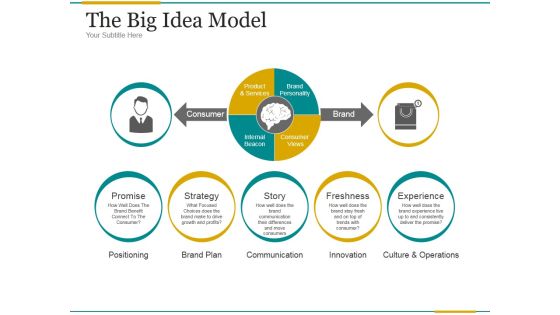
The Big Idea Model Ppt PowerPoint Presentation Guide
This is a the big idea model ppt powerpoint presentation guide. This is a four stage process. The stages in this process are services, product, brand personality, brand, brand consumer, views internal, beacon, consumer, promise, strategy, story, freshness, experience.

What Is A Brand Ppt PowerPoint Presentation Background Images
This is a what is a brand ppt powerpoint presentation background images. This is a four stage process. The stages in this process are research, development, product line, internal culture, consumer segmentation.

Bar Chart Template 1 Ppt PowerPoint Presentation Background Images
This is a bar chart template 1 ppt powerpoint presentation background images. This is a twelve stage process. The stages in this process are product, bar chart, dollars, year.

Combo Chart Ppt PowerPoint Presentation Design Ideas
This is a combo chart ppt powerpoint presentation design ideas. This is a eight stage process. The stages in this process are market size, combo chart, in years, product, growth rate.

Crm Dashboard Sales Dashboard Ppt PowerPoint Presentation Themes
This is a crm dashboard sales dashboard ppt powerpoint presentation themes. This is a four stage process. The stages in this process are month over month closing trend, lead owner breakdown, total lead ownership, sales by product march 2017.

Combo Chart Ppt PowerPoint Presentation Gallery Visual Aids
This is a combo chart ppt powerpoint presentation gallery visual aids. This is a three stage process. The stages in this process are combo chart, in years, market size, product.

Stacked Line Ppt PowerPoint Presentation Summary Master Slide
This is a stacked line ppt powerpoint presentation summary master slide. This is a three stage process. The stages in this process are revenue in percentage, stacked line, product.

Project Progress And Reasons For Delay Ppt PowerPoint Presentation Portfolio Portrait
This is a project progress and reasons for delay ppt powerpoint presentation portfolio portrait. This is a two stage process. The stages in this process are product, marketing, business, process, success.

Bar Graph Ppt PowerPoint Presentation Model Graphic Tips
This is a bar graph ppt powerpoint presentation model graphic tips. This is a two stage process. The stages in this process are we are dollars in millions, financials years, bar graph, product, business.

Bar Graph Ppt PowerPoint Presentation Gallery Skills
This is a bar graph ppt powerpoint presentation gallery skills. This is a four stage process. The stages in this process are in percentage, bar graph, business, marketing, product.
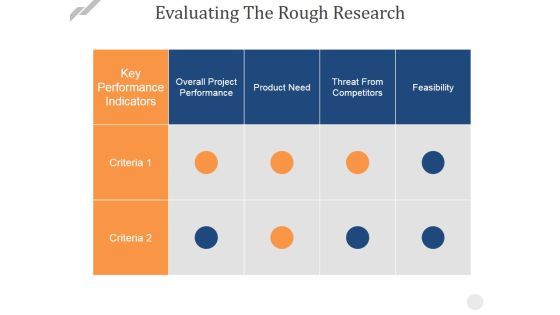
Evaluating The Rough Research Ppt PowerPoint Presentation Pictures Visuals
This is a evaluating the rough research ppt powerpoint presentation pictures visuals. This is a four stage process. The stages in this process are product need, threat from competitors, feasibility, overall project performance.

Stacked Line Ppt PowerPoint Presentation Professional Graphics
This is a stacked line ppt powerpoint presentation professional graphics. This is a three stage process. The stages in this process are revenue in percentage, product, business, marketing, success.

Benchmarking Competitive Intelligence Ppt PowerPoint Presentation Inspiration Master Slide
This is a benchmarking competitive intelligence ppt powerpoint presentation inspiration master slide. This is a four stage process. The stages in this process are price, quality, low, high, product.

Combo Chart Ppt PowerPoint Presentation Summary Design Templates
This is a combo chart ppt powerpoint presentation summary design templates. This is a four stage process. The stages in this process are units sold, product, combo chart, years, planning.

Area Chart Ppt PowerPoint Presentation Summary Templates
This is a area chart ppt powerpoint presentation summary templates. This is a two stage process. The stages in this process are product, in percentage, bar graph, growth, business.

Clustered Column Ppt PowerPoint Presentation Icon Design Inspiration
This is a clustered column ppt powerpoint presentation icon design inspiration. This is a two stage process. The stages in this process are product, financial year, sales in percentage, clustered column.
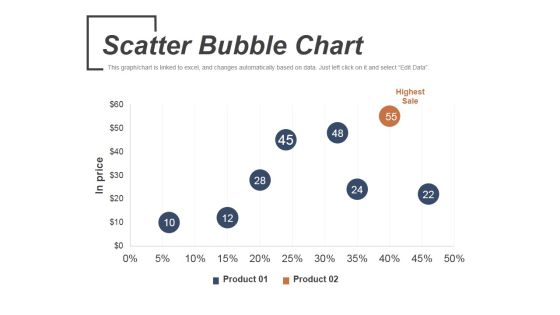
Scatter Bubble Chart Ppt PowerPoint Presentation Infographic Template Graphics
This is a scatter bubble chart ppt powerpoint presentation infographic template graphics. This is a two stage process. The stages in this process are highest sale, product, in price.

Stacked Bar Chart Ppt PowerPoint Presentation Inspiration Ideas
This is a stacked bar chart ppt powerpoint presentation inspiration ideas. This is a four stage process. The stages in this process are product, highest, business, marketing, bar graph.

Stacked Bar Template 1 Ppt PowerPoint Presentation Infographic Template Format
This is a stacked bar template 1 ppt powerpoint presentation infographic template format. This is a four stage process. The stages in this process are product, stacked bar, business, marketing, bar graph.
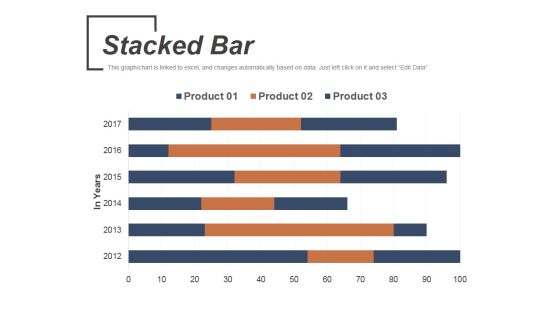
Stacked Bar Template 2 Ppt PowerPoint Presentation Slides Introduction
This is a stacked bar template 2 ppt powerpoint presentation slides introduction. This is a six stage process. The stages in this process are product, stacked bar, business, marketing, in years.

Area Chart Ppt PowerPoint Presentation Infographics Graphics Tutorials
This is a area chart ppt powerpoint presentation infographics graphics tutorials. This is a two stage process. The stages in this process are product, area chart, sales in percentage.

Bar Chart Ppt PowerPoint Presentation Slides Design Ideas
This is a bar chart ppt powerpoint presentation slides design ideas. This is a six stage process. The stages in this process are product, bar chart, sales in percentage.

Clustered Column Line Ppt PowerPoint Presentation File Examples
This is a clustered column line ppt powerpoint presentation file examples. This is a three stage process. The stages in this process are sales in percentage, product, business, marketing, success.
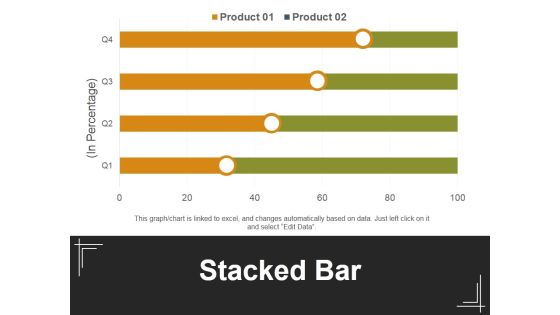
Stacked Bar Template 1 Ppt PowerPoint Presentation Inspiration Background Designs
This is a stacked bar template 1 ppt powerpoint presentation inspiration background designs. This is a four stage process. The stages in this process are in percentage, stacked bar, product, business, marketing.
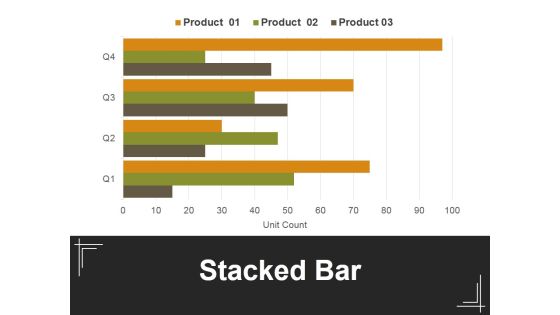
Stacked Bar Template 2 Ppt PowerPoint Presentation Professional Example
This is a stacked bar template 2 ppt powerpoint presentation professional example. This is a four stage process. The stages in this process are in percentage, stacked bar, product, business, marketing.

Bar Graph Ppt PowerPoint Presentation Infographic Template Template
This is a bar graph ppt powerpoint presentation infographic template template. This is a three stage process. The stages in this process are bar graph, sales in percentage, product, planning, business.

Clustered Column Line Chart Ppt PowerPoint Presentation File Pictures
This is a clustered column line chart ppt powerpoint presentation file pictures. This is a four stage process. The stages in this process are clustered bar, product, planning, business, sales in percentage.

Clustered Column Ppt PowerPoint Presentation Inspiration Pictures
This is a clustered column ppt powerpoint presentation inspiration pictures. This is a two stage process. The stages in this process are clustered bar, product, planning, business, in price.

Combo Chart Ppt PowerPoint Presentation Infographics Summary
This is a combo chart ppt powerpoint presentation infographics summary. This is a three stage process. The stages in this process are market size, product, combo chart, years, business.
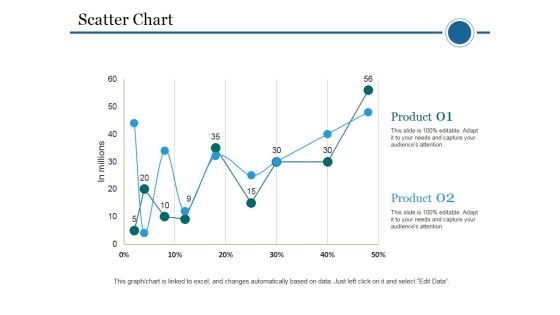
Scatter Chart Template 2 Ppt PowerPoint Presentation Portfolio Skills
This is a scatter chart template 2 ppt powerpoint presentation portfolio skills. This is a two stage process. The stages in this process are scatter chart, in millions, product, business, marketing.

Bar Chart Ppt PowerPoint Presentation Professional Files
This is a bar chart ppt powerpoint presentation professional files. This is a seven stage process. The stages in this process are bar chart, product, sales in percentage, financial years.

Column Chart Ppt PowerPoint Presentation Gallery Design Inspiration
This is a column chart ppt powerpoint presentation gallery design inspiration. This is a two stage process. The stages in this process are column chart, product, sales in percentage, financial years.

Combo Chart Ppt PowerPoint Presentation Summary Background Image
This is a combo chart ppt powerpoint presentation summary background image. This is a three stage process. The stages in this process are combo chart, product, growth rate, market size.
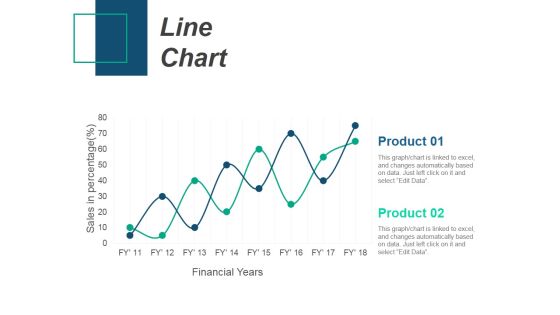
Line Chart Ppt PowerPoint Presentation Infographic Template Introduction
This is a line chart ppt powerpoint presentation infographic template introduction. This is a two stage process. The stages in this process are product, sales in percentage, financial years, line chart.

Area Chart Ppt PowerPoint Presentation Styles Images
This is a area chart ppt powerpoint presentation styles images. This is a two stage process. The stages in this process are sales in percentage, product, graph, business, marketing.

Clustered Column Line Ppt PowerPoint Presentation Model Images
This is a clustered column line ppt powerpoint presentation model images. This is a four stage process. The stages in this process are sales in percentage, product, business, marketing, bar graph.
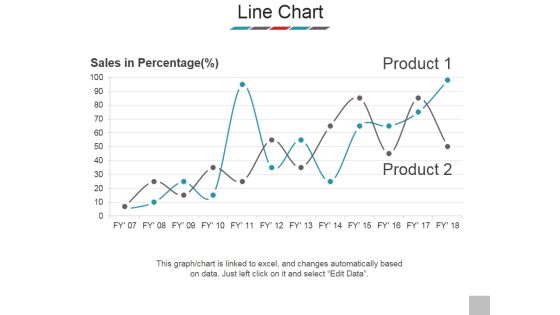
Line Chart Ppt PowerPoint Presentation Outline Samples
This is a line chart ppt powerpoint presentation outline samples. This is a two stage process. The stages in this process are sales in percentage, product, business, marketing, success.

Bar Graph Ppt PowerPoint Presentation Model Clipart
This is a bar graph ppt powerpoint presentation model clipart. This is a six stage process. The stages in this process are sales in percentage, product, bar graph, business, marketing.

Area Chart Ppt PowerPoint Presentation Inspiration Rules
This is a area chart ppt powerpoint presentation inspiration rules. This is a two stage process. The stages in this process are area chart, business, marketing, sales in percentage, product.

Combo Chart Ppt PowerPoint Presentation Layouts Portfolio
This is a combo chart ppt powerpoint presentation layouts portfolio. This is a three stage process. The stages in this process are combo chart, product, market size, growth rate.
Line Chart Ppt PowerPoint Presentation Infographic Template Icons
This is a line chart ppt powerpoint presentation infographic template icons. This is a two stage process. The stages in this process are sales in percentage, financial years, product, line chart.
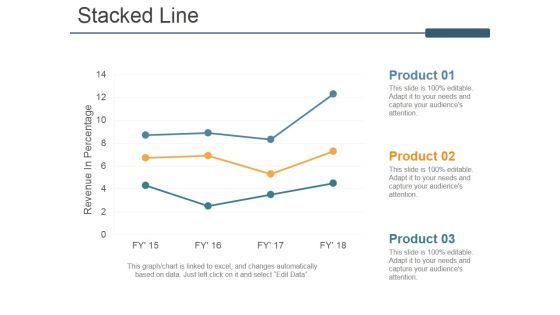
Stacked Line Ppt PowerPoint Presentation Ideas Model
This is a stacked line ppt powerpoint presentation ideas model. This is a three stage process. The stages in this process are revenue in percentage, stacked line, product, business, marketing.

Area Chart Ppt PowerPoint Presentation Inspiration Themes
This is a area chart ppt powerpoint presentation inspiration themes. This is a two stage process. The stages in this process are sales in percentage, product, area chart, business, marketing.

Bar Graph Ppt PowerPoint Presentation Outline Layout
This is a bar graph ppt powerpoint presentation outline layout. This is a four stage process. The stages in this process are sales in percentage, product, bar graph, business, marketing.

Clustered Column Line Ppt PowerPoint Presentation Outline Infographic Template
This is a clustered column line ppt powerpoint presentation outline infographic template. This is a three stage process. The stages in this process are product, sales in percentage, business, marketing, success.
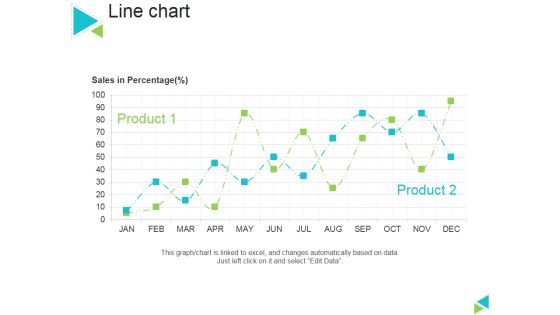
Line Chart Ppt PowerPoint Presentation Gallery Master Slide
This is a line chart ppt powerpoint presentation gallery master slide. This is a two stage process. The stages in this process are sales in percentage, product, line chart.

Scatter Chart Template 2 Ppt PowerPoint Presentation Styles Visual Aids
This is a scatter chart template 2 ppt powerpoint presentation styles visual aids. This is a two stage process. The stages in this process are product, business, marketing, in percentage, growth.
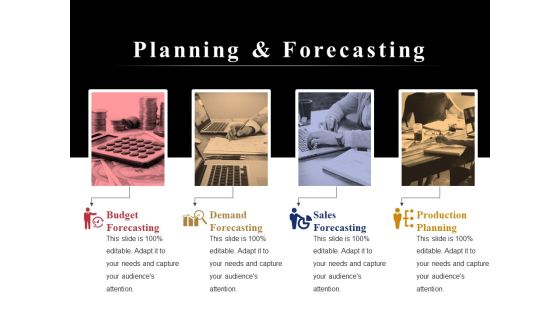
Planning And Forecasting Ppt PowerPoint Presentation Infographic Template Graphics Tutorials
This is a planning and forecasting ppt powerpoint presentation infographic template graphics tutorials. This is a four stage process. The stages in this process are budget forecasting, demand forecasting, sales forecasting, production planning.

Cost Analysis Ppt PowerPoint Presentation Inspiration Aids
This is a cost analysis ppt powerpoint presentation inspiration aids. This is a three stage process. The stages in this process are product and operation cost analysis, marketing and launch cost analysis, business and financial analysis, cost analysis.
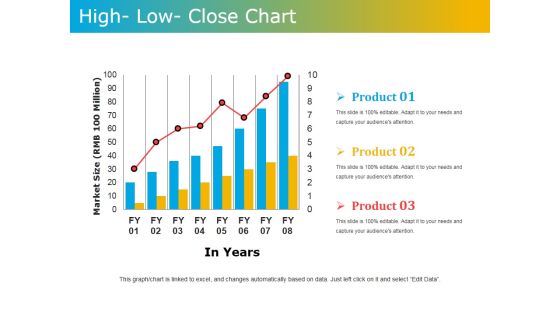
High Low Close Chart Ppt PowerPoint Presentation Model Graphics Tutorials
This is a high low close chart ppt powerpoint presentation model graphics tutorials. This is a three stage process. The stages in this process are market size, in years, product.
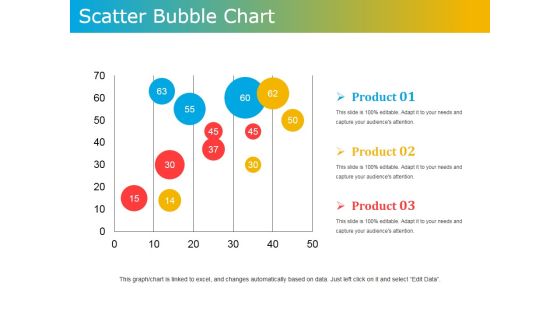
Scatter Bubble Chart Ppt PowerPoint Presentation Ideas Design Templates
This is a scatter bubble chart ppt powerpoint presentation ideas design templates. This is a three stage process. The stages in this process are product, scatter, bubble chart, business, marketing.
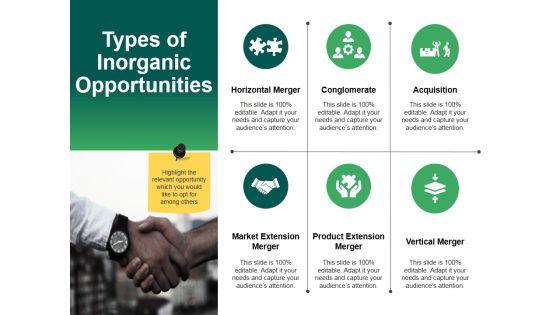
Types Of Inorganic Opportunities Template 2 Ppt PowerPoint Presentation Infographics Example
This is a types of inorganic opportunities template 2 ppt powerpoint presentation infographics example. This is a six stage process. The stages in this process are horizontal merger, conglomerate, acquisition, market extension merger, product extension merger, vertical merger.
 Home
Home