Funnel Icon

Pita Model To Determine Brand Growth Opportunities Pictures PDF
This slide represents PITA model for assessing customers that helps managers their product potential in the market. It includes population, incidence, transaction rate and amount. Present like a pro with Pita Model To Determine Brand Growth Opportunities Pictures PDF Create beautiful presentations together with your team, using our easy to use presentation slides. Share your ideas in real time and make changes on the fly by downloading our templates. So whether you are in the office, on the go, or in a remote location, you can stay in sync with your team and present your ideas with confidence. With Slidegeeks presentation got a whole lot easier. Grab these presentations today.
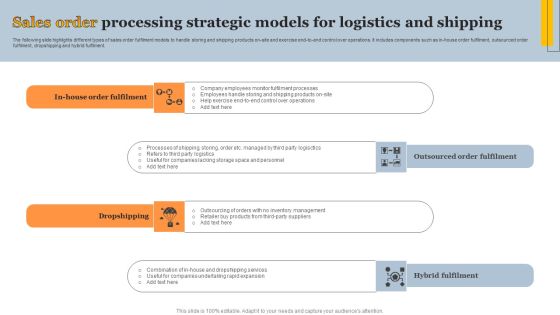
Sales Order Processing Strategic Models For Logistics And Shipping Elements PDF
The following slide highlights different types of sales order fulfilment models to handle storing and shipping products on-site and exercise end-to-end control over operations. It includes components such as in-house order fulfilment, outsourced order fulfilment, dropshipping and hybrid fulfliment. Presenting Sales Order Processing Strategic Models For Logistics And Shipping Elements PDF to dispense important information. This template comprises four stages. It also presents valuable insights into the topics including Outsourced Order Fulfilment, Dropshipping, Hybrid Fulfilment. This is a completely customizable PowerPoint theme that can be put to use immediately. So, download it and address the topic impactfully.
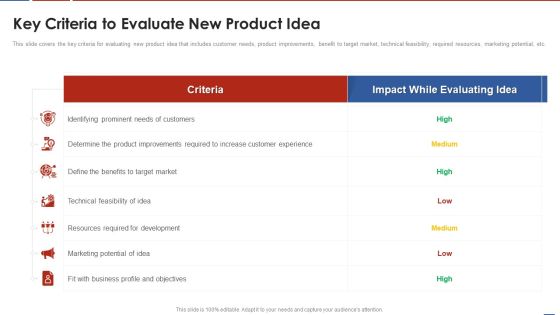
Formulating Product Development Action Plan To Enhance Client Experience Key Criteria To Evaluate New Diagrams PDF
This slide covers the key criteria for evaluating new product idea that includes customer needs, product improvements, benefit to target market, technical feasibility, required resources, marketing potential, etc. Deliver an awe inspiring pitch with this creative formulating product development action plan to enhance client experience key criteria to evaluate new diagrams pdf bundle. Topics like business, technical feasibility, product improvements, product improvements, marketing potential can be discussed with this completely editable template. It is available for immediate download depending on the needs and requirements of the user.

Deploying And Managing Recurring Different Types Of Revenue Models Themes PDF
The following slide displays various types of revenue models that the company can use. These revenue models are Production model, Rental Model, Advertisement Model, Commission based model, E-commerce model, Licensing Model and subscription-based model. Slidegeeks is here to make your presentations a breeze with Deploying And Managing Recurring Different Types Of Revenue Models Themes PDF With our easy-to-use and customizable templates, you can focus on delivering your ideas rather than worrying about formatting. With a variety of designs to choose from, youre sure to find one that suits your needs. And with animations and unique photos, illustrations, and fonts, you can make your presentation pop. So whether youre giving a sales pitch or presenting to the board, make sure to check out Slidegeeks first.

6 Months Roadmap For New Management Development For Software Products Portrait
Introducing our 6 months roadmap for new management development for software products portrait. This PPT presentation is Google Slides compatible, therefore, you can share it easily with the collaborators for measuring the progress. Also, the presentation is available in both standard screen and widescreen aspect ratios. So edit the template design by modifying the font size, font type, color, and shapes as per your requirements. As this PPT design is fully editable it can be presented in PDF, JPG and PNG formats.
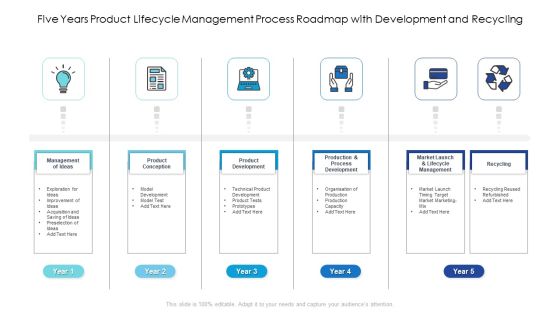
Five Years Product Lifecycle Management Process Roadmap With Development And Recycling Ideas
Introducing our five years product lifecycle management process roadmap with development and recycling ideas. This PPT presentation is Google Slides compatible, therefore, you can share it easily with the collaborators for measuring the progress. Also, the presentation is available in both standard screen and widescreen aspect ratios. So edit the template design by modifying the font size, font type, color, and shapes as per your requirements. As this PPT design is fully editable it can be presented in PDF, JPG and PNG formats.
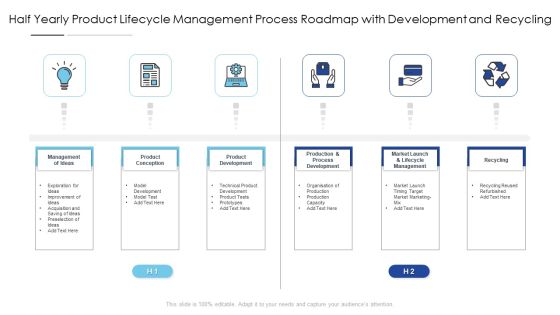
Half Yearly Product Lifecycle Management Process Roadmap With Development And Recycling Infographics
Presenting our innovatively structured half yearly product lifecycle management process roadmap with development and recycling infographics Template. Showcase your roadmap process in different formats like PDF, PNG, and JPG by clicking the download button below. This PPT design is available in both Standard Screen and Widescreen aspect ratios. It can also be easily personalized and presented with modified font size, font type, color, and shapes to measure your progress in a clear way.
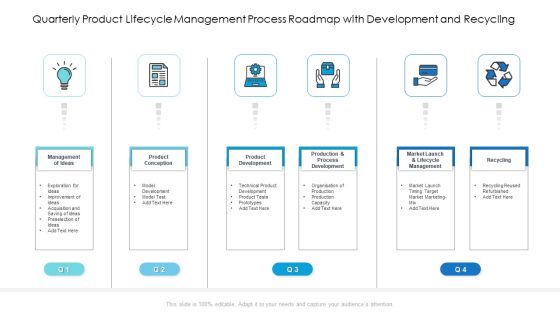
Quarterly Product Lifecycle Management Process Roadmap With Development And Recycling Demonstration
Presenting our innovatively structured quarterly product lifecycle management process roadmap with development and recycling demonstration Template. Showcase your roadmap process in different formats like PDF, PNG, and JPG by clicking the download button below. This PPT design is available in both Standard Screen and Widescreen aspect ratios. It can also be easily personalized and presented with modified font size, font type, color, and shapes to measure your progress in a clear way.

Six Months Product Lifecycle Management Process Roadmap With Development And Recycling Clipart
Presenting our innovatively structured six months product lifecycle management process roadmap with development and recycling clipart Template. Showcase your roadmap process in different formats like PDF, PNG, and JPG by clicking the download button below. This PPT design is available in both Standard Screen and Widescreen aspect ratios. It can also be easily personalized and presented with modified font size, font type, color, and shapes to measure your progress in a clear way.

Three Months Product Lifecycle Management Roadmap With Development And Recycling Background
Introducing our three months product lifecycle management roadmap with development and recycling background. This PPT presentation is Google Slides compatible, therefore, you can share it easily with the collaborators for measuring the progress. Also, the presentation is available in both standard screen and widescreen aspect ratios. So edit the template design by modifying the font size, font type, color, and shapes as per your requirements. As this PPT design is fully editable it can be presented in PDF, JPG and PNG formats.
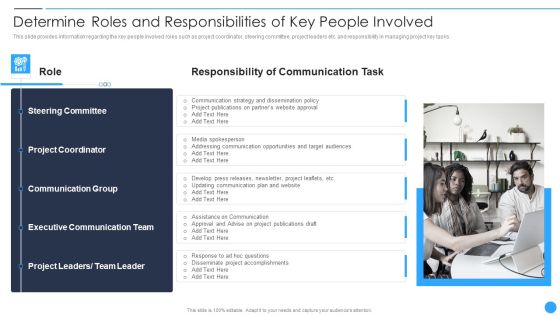
Playbook For Project Product Administration Determine Roles And Responsibilities Of Key People Involved Diagrams PDF
This slide provides information regarding the key people involved roles such as project coordinator, steering committee, project leaders etc. and responsibility in managing project key tasks. This is a Playbook For Project Product Administration Determine Roles And Responsibilities Of Key People Involved Diagrams PDF template with various stages. Focus and dispense information on one stage using this creative set, that comes with editable features. It contains large content boxes to add your information on topics like Project Coordinator, Communication, Executive Communication You can also showcase facts, figures, and other relevant content using this PPT layout. Grab it now.

Optimizing Company Productivity With Employee Management System Ppt PowerPoint Presentation Complete Deck With Slides
This Optimizing Company Productivity With Employee Management System Ppt PowerPoint Presentation Complete Deck With Slides is designed to help you retain your audiences attention. This content-ready PowerPoint Template enables you to take your audience on a journey and share information in a way that is easier to recall. It helps you highlight the crucial parts of your work so that the audience does not get saddled with information download. This fourty seven slide PPT Deck comes prepared with the graphs and charts you could need to showcase your information through visuals. You only need to enter your own data in them. Download this editable PowerPoint Theme and walk into that meeting with confidence.

Cyberspace Simulation Platform Fundraising Elevator Who Are Our Key Customers Topics PDF
The following slide displays the key customer segments which the organization can target, these segments can be private market, business market and potential. This is a cyberspace simulation platform fundraising elevator who are our key customers topics pdf template with various stages. Focus and dispense information on three stages using this creative set, that comes with editable features. It contains large content boxes to add your information on topics like privat markets, business markets, potential markets. You can also showcase facts, figures, and other relevant content using this PPT layout. Grab it now.

Artificial Intelligence Gaming Industry Fund Raising Elevator Who Are Our Key Customers Brochure PDF
The following slide displays the key customer segments which the organization can target, these segments can be private market, business market and potential Presenting artificial intelligence gaming industry fund raising elevator who are our key customers brochure pdf to provide visual cues and insights. Share and navigate important information on three stages that need your due attention. This template can be used to pitch topics like privat markets, business markets, potential markets. In addtion, this PPT design contains high resolution images, graphics, etc, that are easily editable and available for immediate download.
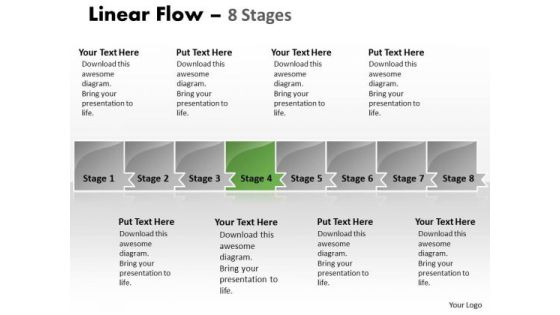
Usa Ppt Theme Parellel Representation Of 8 Issues Business Plan PowerPoint 5 Image
We present our USA PPT Theme parallel representation of 8 issues business plan power point 5 Image. Use our Advertising PowerPoint Templates because, But you have an idea of which you are sure. Use our Shapes PowerPoint Templates because, There are a bucketful of brilliant ideas swirling around within your group. Use our Business PowerPoint Templates because, Marketing Strategy Business Template: - Maximizing sales of your product is the intended destination. Use our Finance PowerPoint Templates because, A healthy is the essence of a sense of happiness. Use our Process and Flows PowerPoint Templates because; educate your team and the attention you have paid. Use these PowerPoint slides for presentations relating to abstract, algorithm, arrow, business, chart, color, connection, design, development, direction, element, flow, graph, linear, management, model, organization, plan, process, program, section, segment, set, sign, solution, strategy, symbol, technology. The prominent colors used in the PowerPoint template are Green, Gray, and Black

Promotional Budget Plan For Manufacturing Firm Information PDF
This slide showcase the allocation of monthly budget for various dimension of product manufacturing and marketing process. It includes budget for Face to face F2F marketing ,banner advertising, cost of hiring sales executives, managing events and promotions, SEO etc. Pitch your topic with ease and precision using this Promotional Budget Plan For Manufacturing Firm Information PDF. This layout presents information on Marketing, Budget, Sales Personnel. It is also available for immediate download and adjustment. So, changes can be made in the color, design, graphics or any other component to create a unique layout.
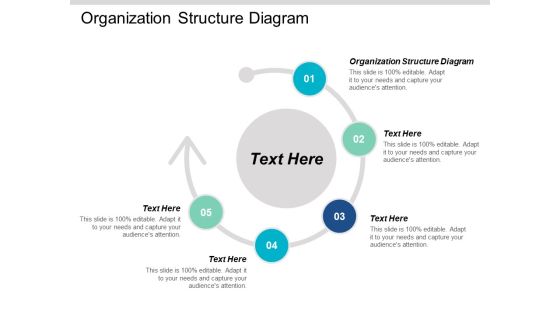
Organization Structure Diagram Ppt PowerPoint Presentation Summary Examples Cpb
Presenting this set of slides with name organization structure diagram ppt powerpoint presentation summary examples cpb. This is an editable Powerpoint five stages graphic that deals with topics like organization structure diagram to help convey your message better graphically. This product is a premium product available for immediate download and is 100 percent editable in Powerpoint. Download this now and use it in your presentations to impress your audience.

Client Infrastructure Diagram Ppt PowerPoint Presentation Layouts Background Image Cpb
Presenting this set of slides with name client infrastructure diagram ppt powerpoint presentation layouts background image cpb. This is an editable Powerpoint six stages graphic that deals with topics like client infrastructure diagram to help convey your message better graphically. This product is a premium product available for immediate download and is 100 percent editable in Powerpoint. Download this now and use it in your presentations to impress your audience.
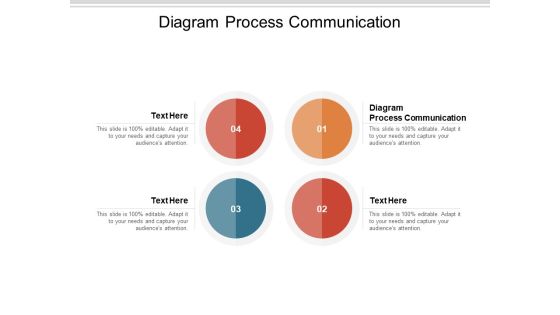
Diagram Process Communication Ppt PowerPoint Presentation Inspiration Graphic Tips Cpb
Presenting this set of slides with name diagram process communication ppt powerpoint presentation inspiration graphic tips cpb. This is an editable Powerpoint four stages graphic that deals with topics like diagram process communication to help convey your message better graphically. This product is a premium product available for immediate download and is 100 percent editable in Powerpoint. Download this now and use it in your presentations to impress your audience.
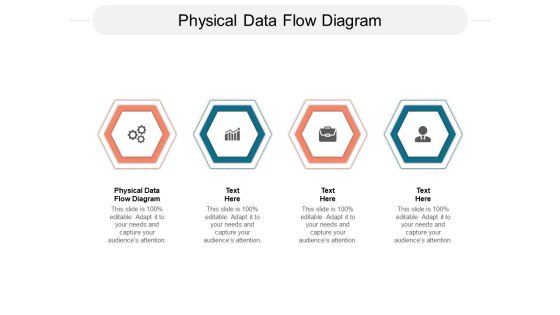
Physical Data Flow Diagram Ppt PowerPoint Presentation Slides Show Cpb
Presenting this set of slides with name physical data flow diagram ppt powerpoint presentation slides show cpb. This is an editable Powerpoint four stages graphic that deals with topics like physical data flow diagram to help convey your message better graphically. This product is a premium product available for immediate download and is 100 percent editable in Powerpoint. Download this now and use it in your presentations to impress your audience.
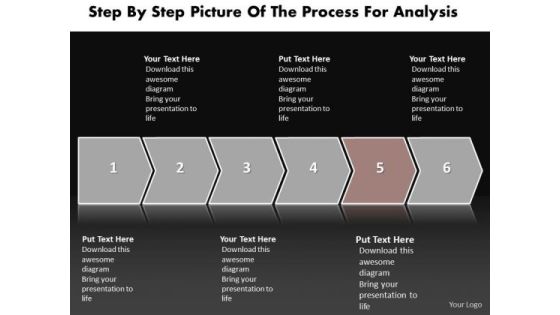
Ppt Linear Practice The PowerPoint Macro Steps Of Process Templates
PPT linear practice the powerpoint macro steps of process Templates-Visually support your Microsoft office PPT Presentation with our above template illustrating arrows as steps.This sequet diagram is a kind of interaction diagram that shows how processes operate with one another and in what order. Deliver amazing presentations with confidence, competence and clarity.-PPT linear practice the powerpoint macro steps of process Templates-Arrow, Background, Banner, Business, Chart, Colorful, Diagram, Direction, Element, Financial, Flow, Gradient, Illustration, Isolated, Marketing, Leadership, Presentation, Process, Steps by Step Symbol

Gated Content Workflow To Increase Lead Generation Diagrams PDF
This slide exhibits email marketing campaign opt-in workflow to acquire information of potential customers. It includes steps that are form submission, download link and article sent, tag allocation and follow-up. Make sure to capture your audiences attention in your business displays with our gratis customizable Gated Content Workflow To Increase Lead Generation Diagrams PDF. These are great for business strategies, office conferences, capital raising or task suggestions. If you desire to acquire more customers for your tech business and ensure they stay satisfied, create your own sales presentation with these plain slides.

Best Training Courses For Google Keyword Assessment Diagrams PDF
This slide showcases keyword research training course with can be opted by marketing managers to improve keyword analytical skills. It includes components such as courses, description, course rating, cost and frequency. Showcasing this set of slides titled Best Training Courses For Google Keyword Assessment Diagrams PDF. The topics addressed in these templates are Keyword Analysis, Traffic Potential, Determine. All the content presented in this PPT design is completely editable. Download it and make adjustments in color, background, font etc. as per your unique business setting.
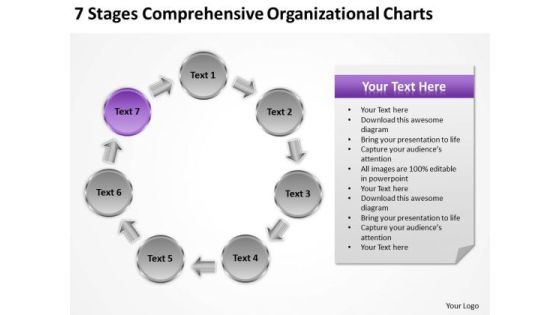
Stages Comprehensive Organizational Charts Ppt Putting Business Plan Together PowerPoint Slides
We present our stages comprehensive organizational charts ppt putting business plan together PowerPoint Slides.Present our Circle Charts PowerPoint Templates because You can Score a slam dunk with our PowerPoint Templates and Slides. Watch your audience hang onto your every word. Download our Arrows PowerPoint Templates because Our PowerPoint Templates and Slides will let you Clearly mark the path for others to follow. Present our Shapes PowerPoint Templates because Our PowerPoint Templates and Slides will provide you the cutting edge. Slice through the doubts in the minds of your listeners. Use our Business PowerPoint Templates because It will let you Set new benchmarks with our PowerPoint Templates and Slides. They will keep your prospects well above par. Present our Process and Flows PowerPoint Templates because Our PowerPoint Templates and Slides will provide weight to your words. They will bring out the depth of your thought process.Use these PowerPoint slides for presentations relating to administrative, analyze, arrow, blue, business, button, change, charter, company, concept, conceptual, control, corporate, design, development, dmaic, enterprise, focus, improve, improvement, industry, information, informative, label, lean, management, manufacturing, measure, measurement, message, methodology, office, performance, process, productive, productivity, profitability, project, quality, sigma, six, symbol, text, words. The prominent colors used in the PowerPoint template are Blue, Gray, Black.

Mhealth Investor Funding Elevator Pitch Deck Key Stats For Our Organziaiton Professional PDF
Purpose of the following slide is to show the key stats of the organization as it displays the organizations growth rate along with its weekly growth and its market share Deliver and pitch your topic in the best possible manner with this mhealth investor funding elevator pitch deck key stats for our organziaiton professional pdf Use them to share invaluable insights on twitter followers, majestic referring domains, organization and impress your audience. This template can be altered and modified as per your expectations. So, grab it now.
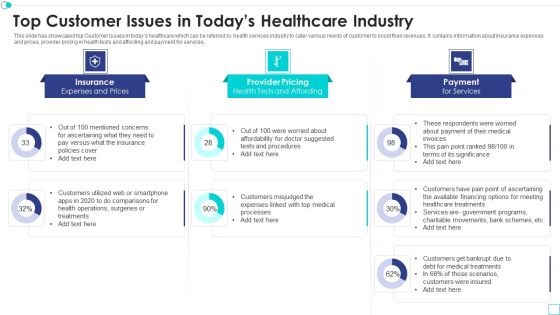
Top Customer Issues In Todays Healthcare Industry Elements PDF
This slide has showcased top Customer Issues in todays healthcare which can be referred by health services industry to cater various needs of customer to boost their revenues. It contains information about insurance expenses and prices, provider pricing in health tests and affording and payment for services. Showcasing this set of slides titled top customer issues in todays healthcare industry elements pdf. The topics addressed in these templates are top customer issues in todays healthcare industry. All the content presented in this PPT design is completely editable. Download it and make adjustments in color, background, font etc. as per your unique business setting.
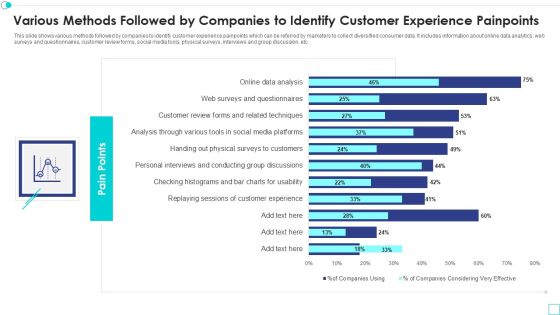
Various Methods Followed By Companies To Identify Customer Experience Painpoints Designs PDF
This slide shows various methods followed by companies to identify customer experience painpoints which can be referred by marketers to collect diversified consumer data. It includes information about online data analytics, web surveys and questionnaires, customer review forms, social media tools, physical surveys, interviews and group discussion, etc. Pitch your topic with ease and precision using this various methods followed by companies to identify customer experience painpoints designs pdf. This layout presents information on various methods followed by companies to identify customer experience painpoints. It is also available for immediate download and adjustment. So, changes can be made in the color, design, graphics or any other component to create a unique layout.
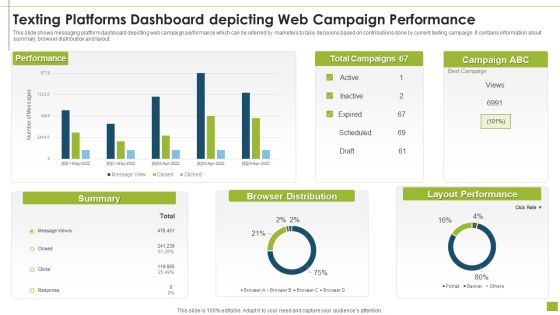
Texting Platforms Dashboard Depicting Web Campaign Performance Pictures PDF
This slide shows messaging platform dashboard depicting web campaign performance which can be referred by marketers to take decisions based on contributions done by current texting campaign. It contains information about summary, browser distribution and layout.Pitch your topic with ease and precision using this texting platforms dashboard depicting web campaign performance pictures pdf This layout presents information on browser distribution, layout performance, summary It is also available for immediate download and adjustment. So, changes can be made in the color, design, graphics or any other component to create a unique layout.

Texting Platforms Dashboard Indicating SMS Marketing Metrics Designs PDF
This slide showcase messaging platforms dashboard indicating sms marketing metrics which can be referred by businesses to check the activity of their current texting campaign. It contains information about consumers, plan, send, campaigns, growth, reports, outgoing and incoming.Pitch your topic with ease and precision using this texting platforms dashboard indicating sms marketing metrics designs pdf This layout presents information on texting platforms dashboard indicating sms marketing metrics It is also available for immediate download and adjustment. So, changes can be made in the color, design, graphics or any other component to create a unique layout.
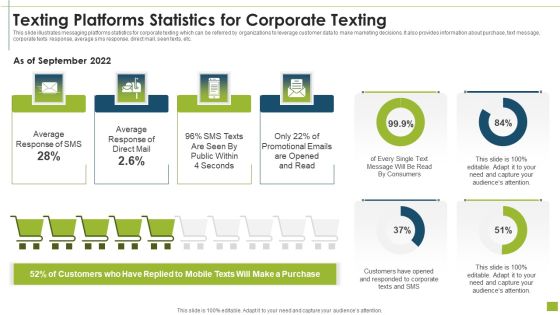
Texting Platforms Statistics For Corporate Texting Formats PDF
This slide illustrates messaging platforms statistics for corporate texting which can be referred by organizations to leverage customer data to make marketing decisions. It also provides information about purchase, text message, corporate texts response, average sms response, direct mail, seen texts, etc.Showcasing this set of slides titled texting platforms statistics for corporate texting formats pdf The topics addressed in these templates are average response, promotional emails, customers have opened All the content presented in this PPT design is completely editable. Download it and make adjustments in color, background, font etc. as per your unique business setting.

Real Estate Property Management Dashboard With Leasing Status Graphics PDF
This slide shows real estate property management dashboard with leasing status which can be referred by companies to have an overview about their performance. It includes information about revenue, properties, recent tasks, expired leases, outstanding balances, etc.Pitch your topic with ease and precision using this real estate property management dashboard with leasing status graphics pdf This layout presents information on property revenue overview, leases which are expiring, recent tasks It is also available for immediate download and adjustment. So, changes can be made in the color, design, graphics or any other component to create a unique layout.

Key Statistics Indicating E Commerce Consumer Demand Professional PDF
This slide showcases key statistics indicating e commerce customer requirements which can be referred by them to identify certain issues and fix them with remedial solutions. It includes information about premium quality, cheap price, convenience, brand value, etc. Showcasing this set of slides titled Key Statistics Indicating E Commerce Consumer Demand Professional PDF. The topics addressed in these templates are E Commerce, Purchased, Product. All the content presented in this PPT design is completely editable. Download it and make adjustments in color, background, font etc. as per your unique business setting.
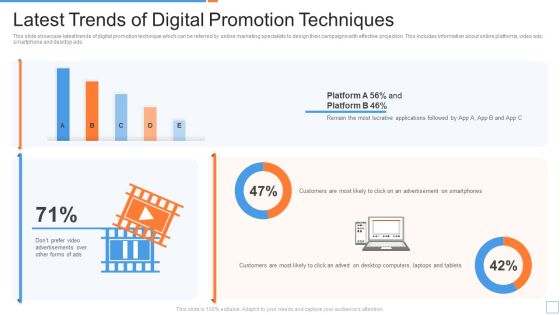
Latest Trends Of Digital Promotion Techniques Ppt PowerPoint Presentation Gallery Sample PDF
This slide showcase latest trends of digital promotion technique which can be referred by online marketing specialists to design their campaigns with effective projection. This includes information about online platforms, video ads, smartphone and desktop ads. Showcasing this set of slides titled Latest Trends Of Digital Promotion Techniques Ppt PowerPoint Presentation Gallery Sample PDF. The topics addressed in these templates are Customers, Advertisement, Smartphones. All the content presented in this PPT design is completely editable. Download it and make adjustments in color, background, font etc. as per your unique business setting.
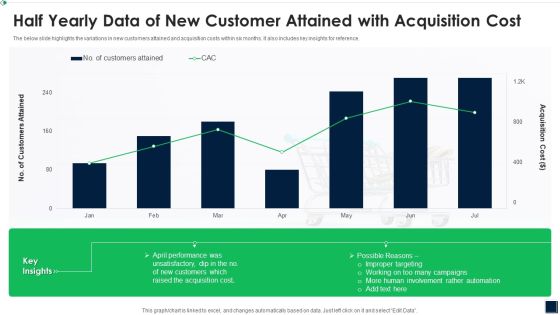
Half Yearly Data Of New Customer Attained With Acquisition Cost Mockup PDF
The below slide highlights the variations in new customers attained and acquisition costs within six months. It also includes key insights for reference.Showcasing this set of slides titled Half Yearly Data Of New Customer Attained With Acquisition Cost Mockup PDF The topics addressed in these templates are Half Yearly Data OF New Customer Attained WITH Acquisition Cost All the content presented in this PPT design is completely editable. Download it and make adjustments in color, background, font etc. as per your unique business setting.

Monthly Actual Vs Expected Sales Results Ppt Show Deck PDF
The following slide highlights the variance in expected and actual sales month wise. It also consists monthly profit trend line along with key insights for reference. Showcasing this set of slides titled Monthly Actual Vs Expected Sales Results Ppt Show Deck PDF. The topics addressed in these templates are Target Expected Sales, Actual Sales Profit, Expected Sales 2022. All the content presented in this PPT design is completely editable. Download it and make adjustments in color, background, font etc. as per your unique business setting.

Information Technology Project Management Dashboard Formats PDF
This slide shows information technology project management dashboard which can be referred by companies looking for efficient outlining and execution of project tasks. It contains information about planning, design, development, testing, project budget, overdue tasks, workload, tasks and deadlines. Showcasing this set of slides titled Information Technology Project Management Dashboard Formats PDF. The topics addressed in these templates are Project Budget Workload, Planning Design Development, Upcoming Deadlines Testing. All the content presented in this PPT design is completely editable. Download it and make adjustments in color, background, font etc. as per your unique business setting.
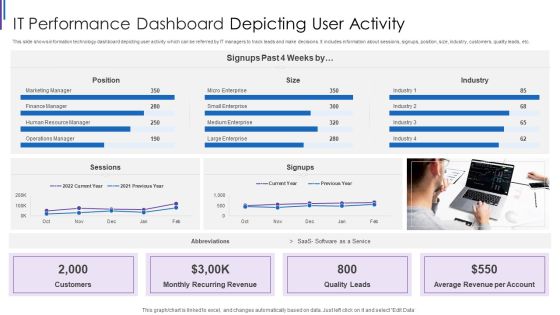
IT Performance Dashboard Depicting User Activity Inspiration PDF
This slide shows information technology dashboard depicting user activity which can be referred by IT managers to track leads and make decisions. It includes information about sessions, signups, position, size, industry, customers, quality leads, etc. Pitch your topic with ease and precision using this IT Performance Dashboard Depicting User Activity Inspiration PDF. This layout presents information on Monthly Recurring Revenue, Average Revenue Per, Account Quality Leads, Customers Position Sessions. It is also available for immediate download and adjustment. So, changes can be made in the color, design, graphics or any other component to create a unique layout.
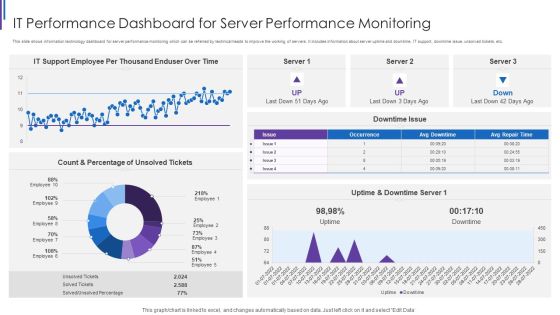
IT Performance Dashboard For Server Performance Monitoring Portrait PDF
This slide shows information technology dashboard for server performance monitoring which can be referred by technical heads to improve the working of servers. It includes information about server uptime and downtime, IT support, downtime issue, unsolved tickets, etc. Showcasing this set of slides titled IT Performance Dashboard For Server Performance Monitoring Portrait PDF. The topics addressed in these templates are IT Support Employee, Per Thousand Enduser, Uptime And Downtime, Count And Percentage. All the content presented in this PPT design is completely editable. Download it and make adjustments in color, background, font etc. as per your unique business setting.
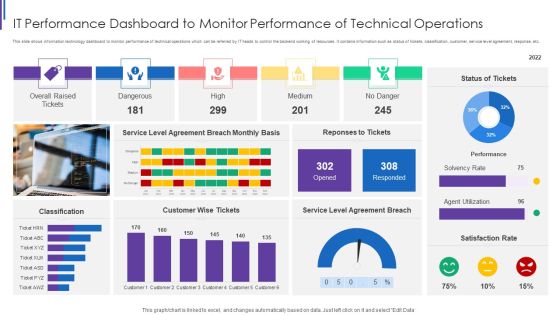
IT Performance Dashboard To Monitor Performance Of Technical Operations Download PDF
This slide shows information technology dashboard to monitor performance of technical operations which can be referred by IT heads to control the backend working of resources. It contains information such as status of tickets, classification, customer, service level agreement, response, etc. Showcasing this set of slides titled IT Performance Dashboard To Monitor Performance Of Technical Operations Download PDF. The topics addressed in these templates are Overall Raised Tickets, Dangerous High Medium, Service Level Agreement, Customer Wise Tickets. All the content presented in this PPT design is completely editable. Download it and make adjustments in color, background, font etc. as per your unique business setting.

KPI Dashboard For Measuring Information Technology Business Performance Designs PDF
This slide shows KPI dashboard for measuring information technology business performance which can be referred by technical organizations to analyze their annual performance. It includes information about monthly recurring revenue, customer acquisition cost, signups and paying customers, visitors and signups, runway, etc. Showcasing this set of slides titled KPI Dashboard For Measuring Information Technology Business Performance Designs PDF. The topics addressed in these templates are Signups And Paying, Customers Monthly Growth, Visitors And Signups, Monthly Average Revenue. All the content presented in this PPT design is completely editable. Download it and make adjustments in color, background, font etc. as per your unique business setting.
Mobile User Interface Issue Tracker Dashboard In Information Technology Ideas PDF
This slide shows mobile user interface issue tracker dashboard in information technology which can be referred by software engineers to rectify smartphone issues. It contains information about project, component, generated vs. completed issues, issue by status, issue count by project and component and incomplete issues. Pitch your topic with ease and precision using this Mobile User Interface Issue Tracker Dashboard In Information Technology Ideas PDF. This layout presents information on Issues Count By, Project And Components, Incomplete Issues By, Priority And Project. It is also available for immediate download and adjustment. So, changes can be made in the color, design, graphics or any other component to create a unique layout.
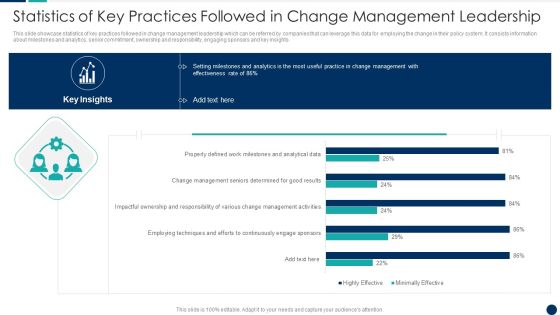
Statistics Of Key Practices Followed In Change Management Leadership Ideas PDF
This slide showcase statistics of key practices followed in change management leadership which can be referred by companies that can leverage this data for employing the change in their policy system. It consists information about milestones and analytics, senior commitment, ownership and responsibility, engaging sponsors and key insights.Pitch your topic with ease and precision using this Statistics Of Key Practices Followed In Change Management Leadership Ideas PDF This layout presents information on Employing Techniques, Efforts Continuously, Engage Sponsors It is also available for immediate download and adjustment. So, changes can be made in the color, design, graphics or any other component to create a unique layout.
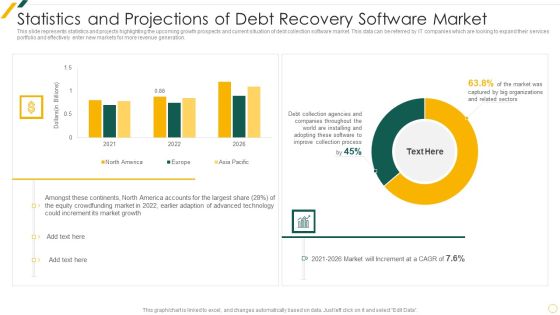
Statistics And Projections Of Debt Recovery Software Market Guidelines PDF
This slide represents statistics and projects highlighting the upcoming growth prospects and current situation of debt collection software market. This data can be referred by IT companies which are looking to expand their services portfolio and effectively enter new markets for more revenue generation.Pitch your topic with ease and precision using this Statistics And Projections Of Debt Recovery Software Market Guidelines PDF This layout presents information on Resuming Aggregable, Agreeable Projected, Allocating Agent It is also available for immediate download and adjustment. So, changes can be made in the color, design, graphics or any other component to create a unique layout.

TCM For Technical Analysis Dashboard Indicating Intervention Time Background PDF
This Slide shows technology change management dashboard indicating Change and Release Management which can be referred by It managers for effective handling of technical change. It includes information about operational, unassigned, overhead, hold, conflicts and rejected change. Showcasing this set of slides titled TCM For Technical Analysis Dashboard Indicating Intervention Time Background PDF. The topics addressed in these templates are Operational Change, Unassigned Changes, Change Overhead. All the content presented in this PPT design is completely editable. Download it and make adjustments in color, background, font etc. as per your unique business setting.
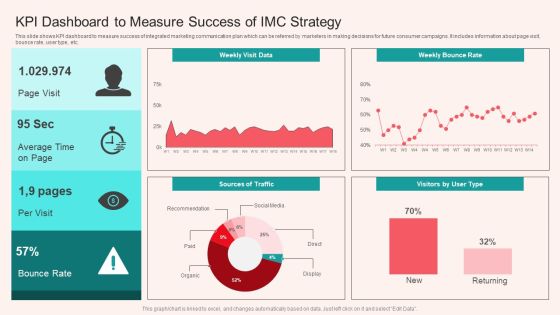
KPI Dashboard To Measure Success Of IMC Strategy Microsoft PDF
This slide shows KPI dashboard to measure success of integrated marketing communication plan which can be referred by marketers in making decisions for future consumer campaigns. It includes information about page visit, bounce rate, user type, etc. Pitch your topic with ease and precision using this KPI Dashboard To Measure Success Of IMC Strategy Microsoft PDF. This layout presents information on Average, Bounce Rate. It is also available for immediate download and adjustment. So, changes can be made in the color, design, graphics or any other component to create a unique layout.

Audience Demographics Dashboard For Customer Targeting Tactics Slides PDF
This slide shows audience demographics dashboard for consumer targeting strategies which can be referred by marketers to plan out their product positioning tactics. It includes details about interests of audience, audience age, gender, globally classified, category of market, usage of smartphone, etc. Showcasing this set of slides titled Audience Demographics Dashboard For Customer Targeting Tactics Slides PDF. The topics addressed in these templates are Globally Classified Audience, Audience Market Category, Audience Age. All the content presented in this PPT design is completely editable. Download it and make adjustments in color, background, font etc. as per your unique business setting.

Individual Customer Behavior Insights Dashboard For Targeting Tactics Slides PDF
This slide shows individual consumer behavior insights dashboard for targeting strategies which can be referred by marketers to make decisions for upcoming sales campaigns. It includes details about timeline, brands, average spending, engagement, details, interests, risk of mixture, customer lifetime value, etc. Showcasing this set of slides titled Individual Customer Behavior Insights Dashboard For Targeting Tactics Slides PDF. The topics addressed in these templates are Customer, Timeline, Interests. All the content presented in this PPT design is completely editable. Download it and make adjustments in color, background, font etc. as per your unique business setting.
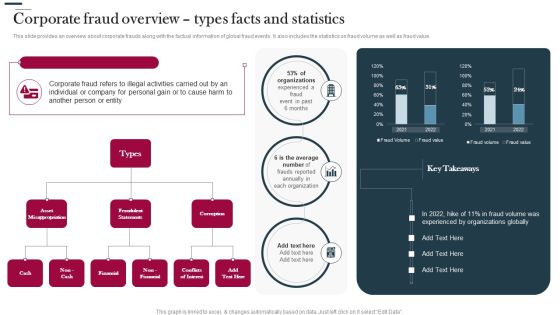
Various Strategies To Prevent Business Corporate Fraud Overview Types Facts And Statistics Rules PDF
This slide provides an overview about corporate frauds along with the factual information of global fraud events. It also includes the statistics on fraud volume as well as fraud value. Deliver an awe inspiring pitch with this creative Various Strategies To Prevent Business Corporate Fraud Overview Types Facts And Statistics Rules PDF bundle. Topics like Corporate Fraud Refers, Illegal Activities, Statements can be discussed with this completely editable template. It is available for immediate download depending on the needs and requirements of the user.
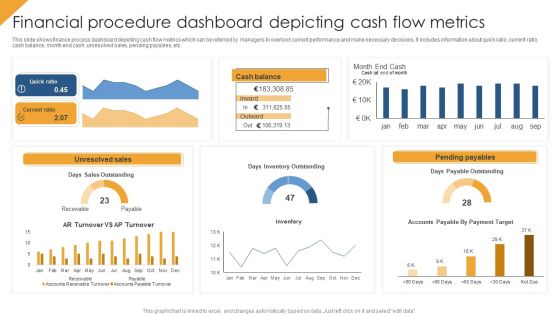
Financial Procedure Dashboard Depicting Cash Flow Metrics Structure PDF
This slide shows finance process dashboard depicting cash flow metrics which can be referred by managers to overlook current performance and make necessary decisions. It includes information about quick ratio, current ratio, cash balance, month end cash, unresolved sales, pending payables, etc. Pitch your topic with ease and precision using this Financial Procedure Dashboard Depicting Cash Flow Metrics Structure PDF. This layout presents information on Quick Ratio, Unresolved Sales, Pending Payables. It is also available for immediate download and adjustment. So, changes can be made in the color, design, graphics or any other component to create a unique layout.

Dashboard Highlighting Product Kpis For Enhancement Strategy Structure PDF
This slide illustrates dashboard indicating product kpis for improvement plan which can be referred by organizations to review sales campaign performance. It includes information about top products in revenue, online vs. Offline transactions, increased sales by campaign and cost of products sold. Showcasing this set of slides titled Dashboard Highlighting Product Kpis For Enhancement Strategy Structure PDF. The topics addressed in these templates are Revenue, Products, Cost. All the content presented in this PPT design is completely editable. Download it and make adjustments in color, background, font etc. as per your unique business setting.

Monthly Business Operational Expenditure Bar Graph With Projected And Actual Expenses Introduction PDF
This slide shows monthly operating expenditure opex with projected and actual expenses which can be referred by companies to align budget with expenses effectively. It also provides information about machinery rent, personnel benefits, building rent, equipment, professional fees, etc. Pitch your topic with ease and precision using this Monthly Business Operational Expenditure Bar Graph With Projected And Actual Expenses Introduction PDF. This layout presents information on Projected Expenses, Costs, Service. It is also available for immediate download and adjustment. So, changes can be made in the color, design, graphics or any other component to create a unique layout.
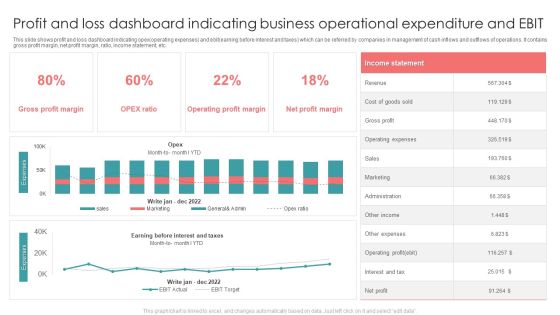
Profit And Loss Dashboard Indicating Business Operational Expenditure And EBIT Formats PDF
This slide shows profit and loss dashboard indicating opex operating expenses and ebit earning before interest and taxes which can be referred by companies in management of cash inflows and outflows of operations. It contains gross profit margin, net profit margin, ratio, income statement, etc. Showcasing this set of slides titled Profit And Loss Dashboard Indicating Business Operational Expenditure And EBIT Formats PDF. The topics addressed in these templates are Revenue, Gross Profit, Sales. All the content presented in this PPT design is completely editable. Download it and make adjustments in color, background, font etc. as per your unique business setting.

Business Operational Expenditure Dashboard Indicating Revenue And Costs Metrics Pictures PDF
This slide shows operating expenses OPEX dashboard indicating revenue and costs metrics which can be referred by companies to manage various operating expenses of various departments. It contains information about cost center, revenue per company, company code, etc. Pitch your topic with ease and precision using this Business Operational Expenditure Dashboard Indicating Revenue And Costs Metrics Pictures PDF. This layout presents information on Business Operational, Costs Metrics, Revenue. It is also available for immediate download and adjustment. So, changes can be made in the color, design, graphics or any other component to create a unique layout.

Business Revenue Bar Graph With Business Operational Expenditure Details Summary PDF
This slide represents business revenue bar graph with OPEX details which can be referred by companies to earn more revenue by controlling expenditures. It also provides information about marketing and sales, research and development, administration, total revenue, etc. Pitch your topic with ease and precision using this Business Revenue Bar Graph With Business Operational Expenditure Details Summary PDF. This layout presents information on Cost Of Marketing, Sales, Highest Amount. It is also available for immediate download and adjustment. So, changes can be made in the color, design, graphics or any other component to create a unique layout.

Touchpoints To Assess Technology Impact Across Alternative Asset Management Value Chain Demonstration PDF
This slide shows information on the touchpoints that firm will refer to assess technology impact across alternative asset management value chain. Slidegeeks is one of the best resources for PowerPoint templates. You can download easily and regulate Touchpoints To Assess Technology Impact Across Alternative Asset Management Value Chain Demonstration PDF for your personal presentations from our wonderful collection. A few clicks is all it takes to discover and get the most relevant and appropriate templates. Use our Templates to add a unique zing and appeal to your presentation and meetings. All the slides are easy to edit and you can use them even for advertisement purposes.

Data Profiling Solutions Dashboard Indicating Row And Column Analysis Summary PDF
This slide illustrates data profiling dashboard indicating row and column analysis which can be referred by IT managers to manager to maintain quality and consistency of data. It contains information about reports, checking, evolution, overview, comparative, etc. Showcasing this set of slides titled Data Profiling Solutions Dashboard Indicating Row And Column Analysis Summary PDF. The topics addressed in these templates are Overview Analysis, Column Evaluation, Comparative Evaluation. All the content presented in this PPT design is completely editable. Download it and make adjustments in color, background, font etc. as per your unique business setting.
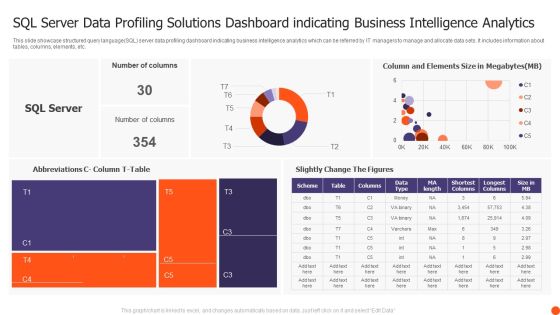
SQL Server Data Profiling Solutions Dashboard Indicating Business Intelligence Analytics Structure PDF
This slide showcase structured query language SQL server data profiling dashboard indicating business intelligence analytics which can be referred by IT managers to manage and allocate data sets. It includes information about tables, columns, elements, etc. Showcasing this set of slides titled SQL Server Data Profiling Solutions Dashboard Indicating Business Intelligence Analytics Structure PDF. The topics addressed in these templates are Number Columns, Slightly Change Figures, SQL Server. All the content presented in this PPT design is completely editable. Download it and make adjustments in color, background, font etc. as per your unique business setting.

Continuous Integration Dashboard For Automated Testing Framework Ppt Layouts Layout Ideas PDF
This slide shows continuous integration dashboard for test automation framework which can be referred by authors to review their testing performance. It contains information about weekly change volume by author, monthly change volume by author, repository, etc. Pitch your topic with ease and precision using this Continuous Integration Dashboard For Automated Testing Framework Ppt Layouts Layout Ideas PDF. This layout presents information on Total Changes Volume, Monthly Change Volume, Weekly Change Volume. It is also available for immediate download and adjustment. So, changes can be made in the color, design, graphics or any other component to create a unique layout.

Dashboard Depicting Client And Employee Customer NPS Metric Ppt Gallery Deck PDF
This slide shows dashboard depicting client and employee net promoter score NPS. It contains information about customer refer probability, recent service review and repeated use of service. Showcasing this set of slides titled Dashboard Depicting Client And Employee Customer NPS Metric Ppt Gallery Deck PDF. The topics addressed in these templates are Client NPS, Employee NPS, Customer Probability. All the content presented in this PPT design is completely editable. Download it and make adjustments in color, background, font etc. as per your unique business setting.
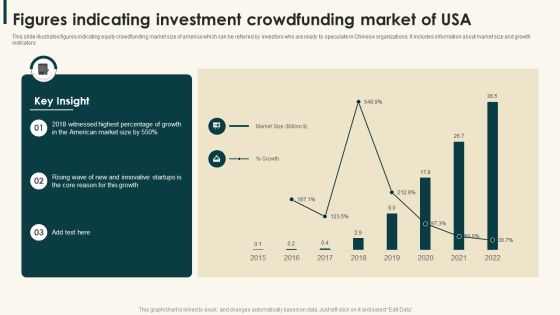
Figures Indicating Investment Crowdfunding Market Of Usa Information PDF
This slide illustrates figures indicating equity crowdfunding market size of america which can be referred by investors who are ready to speculate in Chinese organizations. It includes information about market size and growth indicators,Pitch your topic with ease and precision using this Figures Indicating Investment Crowdfunding Market Of Usa Information PDF. This layout presents information on Witnessed Highest, American Market, Innovative Startups. It is also available for immediate download and adjustment. So, changes can be made in the color, design, graphics or any other component to create a unique layout.
 Home
Home