Funding
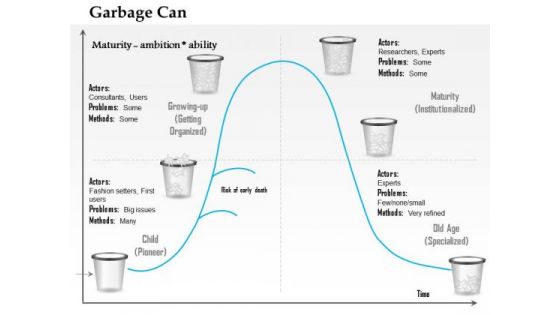
Business Framework Garbage Can Life Cycle Model PowerPoint Presentation
This image slide has been designed to display garbage can model of organizational choice. This image slide has been designed with graph having garbage line to calculate maturity. Use this image slide in business and marketing presentations. This image slide will enhance the quality of your presentations.
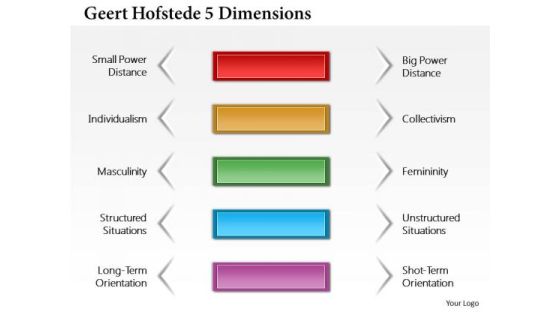
Business Framework Geert Hofstede 5 Dimensions PowerPoint Presentation
This image slide has been designed to displays Geert Hofstede five dimensions diagram. Use this image slide in business, social and marketing presentations to depict cultural dimension theory. This image slide will help you make professional presentations.
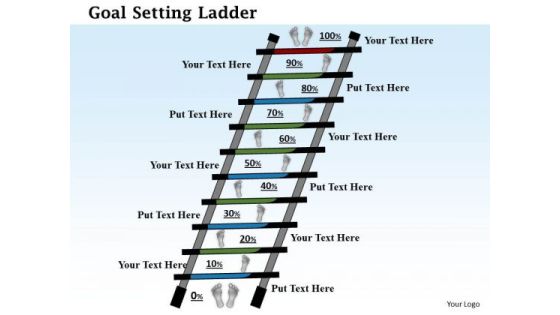
Business Framework Goal Setting Ladder PowerPoint Presentation
This image slide has been designed to express views on goals, targets and achievements. This image slide displays goal setting ladder with percentage steps. This image slide will enhance the quality of your presentations.

Business Framework Grand Strategy Selection Matrix PowerPoint Presentation
This image slide displays grand strategy selection matrix. This image slide has been designed with selection matrix with internal, maximize strength, overcome weakness and external attributes Use this image slide, in your presentations to express views on strategies, strengths, challenges and solutions. This image slide will help you express your views to target audience.

Business Framework Groupthink Model PowerPoint Presentation
This image slide displays group think model. This image slide has been crafted with flow model having antecedents and observable consequences attributes. Use this image slide in business, marketing and social presentations. This image slide will help you express your views to target audience.

Business Framework Hawthorn Effect PowerPoint Presentation
This image slide displays Hawthorn effect. The Hawthorne effect refers to a phenomenon whereby individuals improve or modify an aspect of their behavior in response to their awareness of being observed. This image slide may be used in business, social and marketing presentations. This image slide will enhance the quality of your presentations.

Business Framework Hawthorn Effect PowerPoint Presentation 2
This image slide displays Hawthorn effect. The Hawthorne effect refers to a phenomenon whereby individuals improve or modify an aspect of their behavior in response to their awareness of being observed. This image slide may be used in business, social and marketing presentations. This image slide will enhance the quality of your presentations.
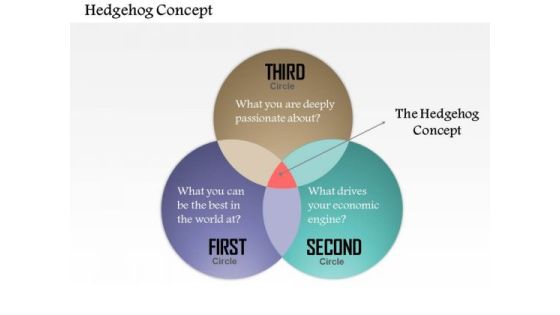
Business Framework Hedgehog Concept PowerPoint Presentation
This image slide displays Hedgehog concept diagram. Use this image slide to express views on understanding of what you can be best at. This image slide may be used in business, social and marketing presentations. This image slide will help you make professional presentations.
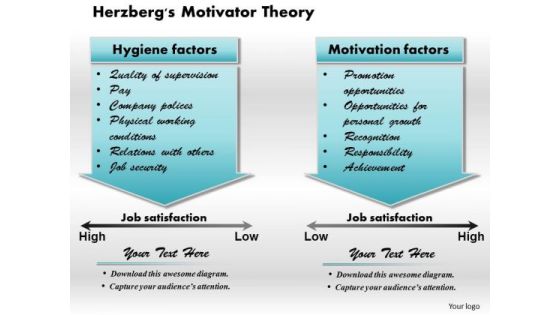
Business Framework Herzberg Motivator Theory PowerPoint Presentation
This image slide has been designed to display Herzberg's motivational and hygiene theory diagram. This image slide displays the factors for job satisfaction. Use this image slide to enhance the quality of your presentations.
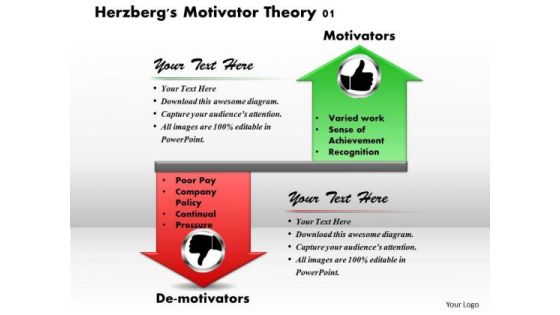
Business Framework Herzberg Motivator Theory PowerPoint Presentation 1
This image slide has been designed to display Herzberg's motivator theory innovative diagram. This image slide displays the concept of motivators and de-motivators in job satisfaction. Use this image slide to enhance the quality of your presentations.

Business Framework Put Option Long PowerPoint Presentation
Our above diagram helps to represent data graphically. Use this put option long diagram for stock market related topics. This diagram has area for your own text to assist you get your point across.
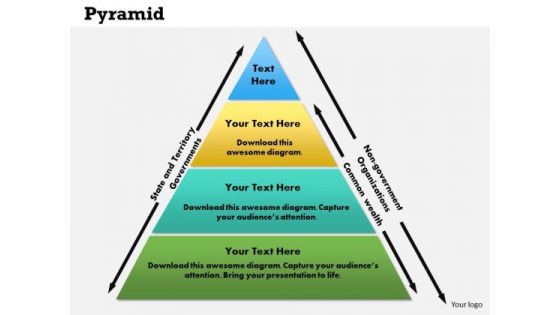
Business Framework Pyramid PowerPoint Presentation
This slide displays business framework pyramid diagram. Above diagram can be used for business illustrations, presentations, planning, design and strategy. For an effective impact on the viewers, Use this stunning diagram for business presentations.

Business Framework Qualitative Market Research PowerPoint Presentation
Use our above diagram to make presentations on qualitative market research. Methods of qualitative research can be defined with this professional diagram. Use this stunning diagram for business presentations.
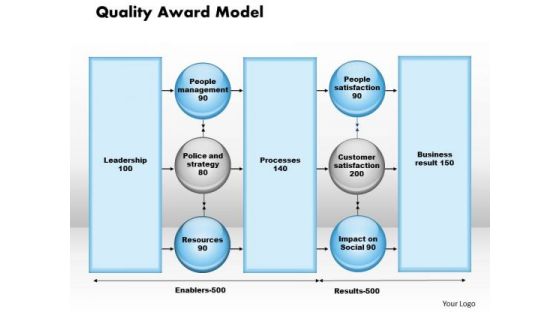
Business Framework Quality Award Model PowerPoint Presentation
Use this quality award model for strategic planning. It is an excellent graphic to attract the attention of your audience. Download this professional diagram for your business presentations.

Business Framework Quality Improvement PowerPoint Presentation
Download our above diagram to display quality improvement activities in your presentations. This diagram is really a good option if you are interested in quality improvement projects.

Business Framework Quality Improvement Template PowerPoint Presentation
Download our above diagram to display quality improvement activities in your presentations. This diagram is really a good option if you are interested in quality improvement projects.

Business Framework Question Mark Template PowerPoint Presentation
This business framework image slide displays graphics of question mark. Download question mark slide to take a quiz of your class. This is suitable for educational or academic presentations, and also works during an investigation in a meeting.
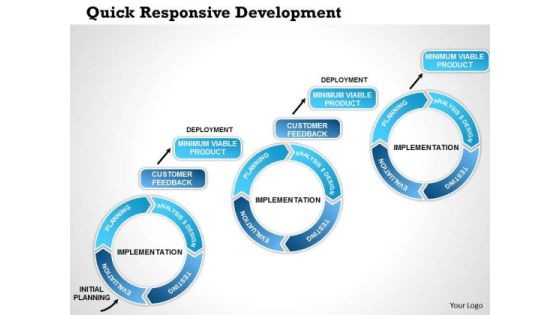
Business Framework Quick Responsive Development PowerPoint Presentation
This quick responsive development slide can be used in business presentations. Use this diagram in your presentation and make it more effective. This pre designed high quality business diagram will make your presentation simply the best.
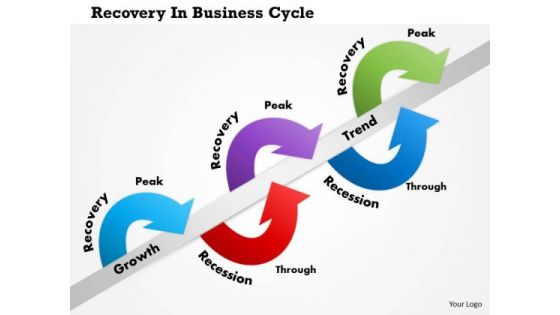
Business Framework Recovery In Business Cycle PowerPoint Presentation
This diagram display recovery in business cycle. This professional diagram depicts four phases of a business cycle are recession, recovery, growth and decline. This diagram helps you to grab the attention of your listener.
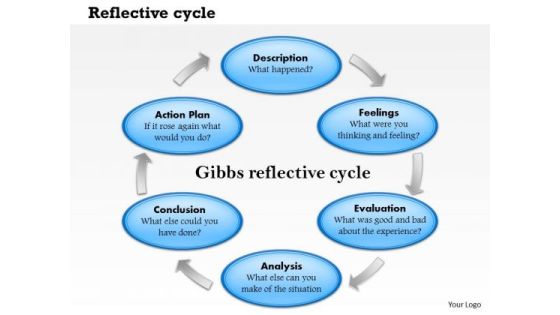
Business Framework Reflective Cycle PowerPoint Presentation
This reflective cycle diagram provides a general framework which helps to guide the reflection on action and way of thought. This pre designed high quality business diagram will make your presentation simply the best.

Business Framework Relationship Diagram PowerPoint Presentation
This diagram is an effective tool to convey processes, relationships and connections. Use this diagram to present a clear visual structure to your audience so that you can highlight important points. This diagram will help you catch your audiences attention.
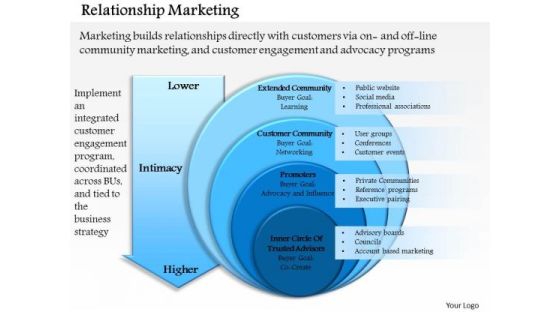
Business Framework Relationship Marketing 1 PowerPoint Presentation
This business framework diagram displays layout of relationship marketing. Use this diagram in your presentations to express views on relationship marketing. This diagram is perfect to make professional presentations.
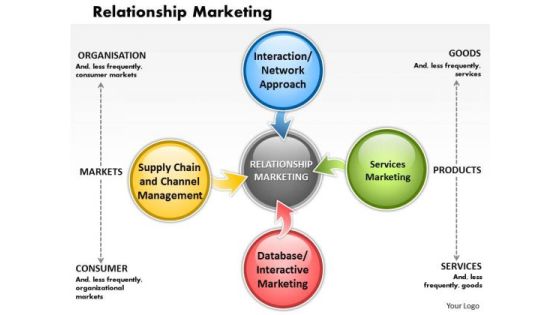
Business Framework Relationship Marketing PowerPoint Presentation
This business framework diagram displays layout of relationship marketing. Use this diagram in your presentations to express views on relationship marketing. This diagram is perfect to make professional presentations.
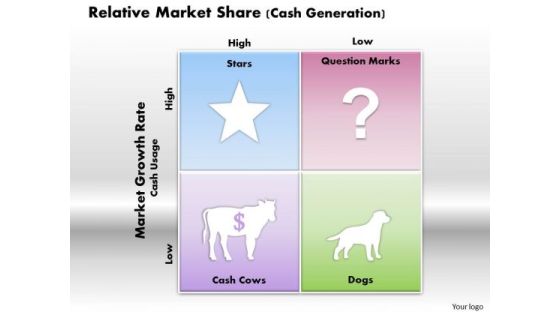
Business Framework Relative Market Share Cash Generation PowerPoint Presentation
Our above diagram is designed with concept of relative market share. Relative market share is comparing market shares of companies. This diagram also helps to explain concepts of market growth rate and cash generation.
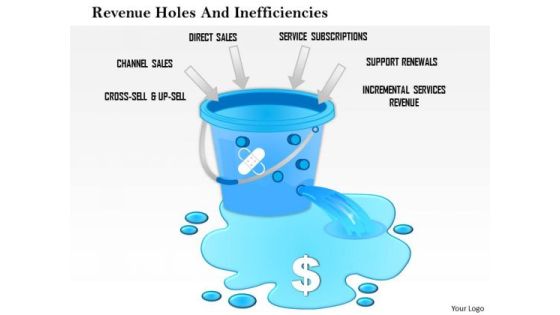
Business Framework Revenue Holes And Inefficiencies PowerPoint Presentation
Use this diagram in business presentations to display revenue holes and inefficiencies. You can use this diagram to make awesome presentations and describe the entire process in an impressive manner.

Business Framework Revenue Holes And Inefficiencies PowerPoint Presentation 1
Use this diagram in business presentations to display revenue holes and inefficiencies. You can use this diagram to make awesome presentations and describe the entire process in an impressive manner.
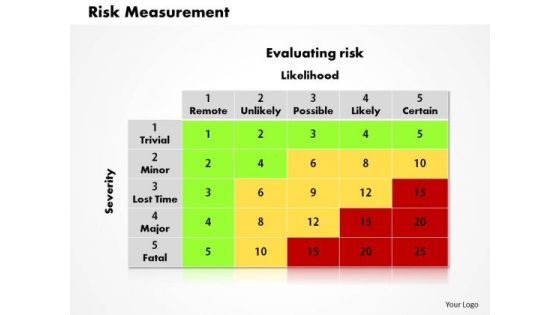
Business Framework Risk Measurement PowerPoint Presentation
The above slide has framework of risk measurement. Use this diagram for giving a clear message in a structured manner. This template helps you to grab the attention of your listener.
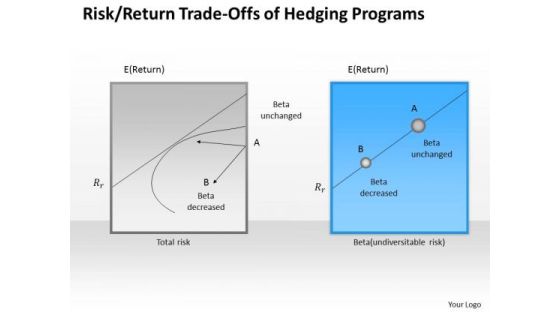
Business Framework Risk Return Trade Offs Of Hedging Programs PowerPoint Presentation
This diagram displays risk return tradeoffs of hedging programs. Use this diagram in your presentation and make it more effective. This pre designed high quality business diagram will make your presentation simply the best.
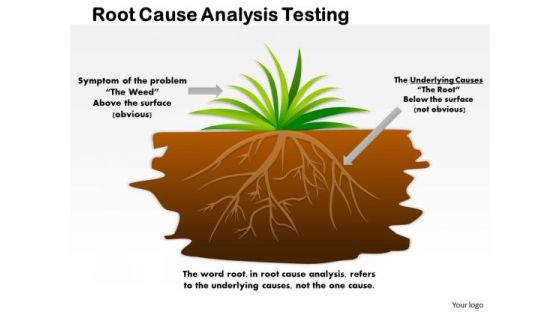
Business Framework Root Cause Analysis Testing PowerPoint Presentation
The purpose of root cause analysis is to strike at the root of a problem by finding and resolving its root causes. This diagram provides framework of root cause analysis. This template helps you to grab the attention of your listener.
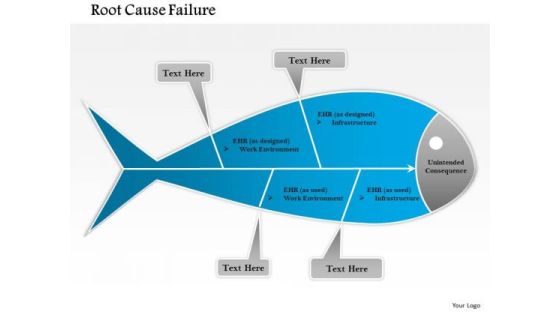
Business Framework Root Cause Failure PowerPoint Presentation
Use this fish bone diagram to explain root cause failure. Use this diagram in your presentation and make it more effective. This pre designed high quality business diagram will make your presentation simply the best.

Business Framework Sales Force Sizing PowerPoint Presentation
This diagrams displays graphical representations of sales force sizing. Optimizing size and structure of your sales force is important to overall business success. Make interactive presentations with this slide.
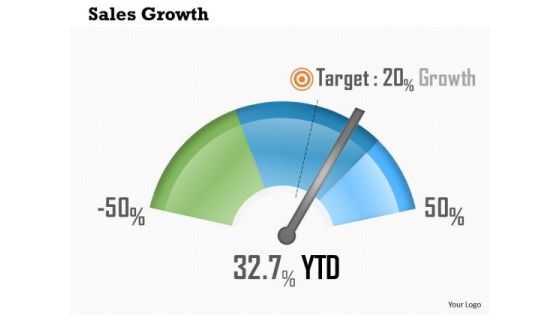
Business Framework Sales Growth PowerPoint Presentation
Download this diagram to display sales growth in business presentations. This diagram enables the users to create their own display of the required processes in an easy way.

Business Framework Sales Pipeline Tool PowerPoint Presentation
This sales pipeline tool diagram can be used to prepare a business presentation or sales strategy presentation. This pipeline diagrams to represent sales pipeline tools. Use this professional and customized business diagram for PowerPoint.

Business Framework Sales Planning Tools PowerPoint Presentation
This sales planning tool diagram can be used to prepare a business presentation or sales strategy presentation. This diagrams represent sales planning tools. Use this professional and customized business diagram for PowerPoint.
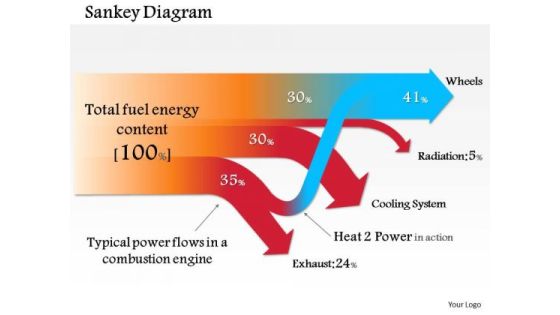
Business Framework Sankey Diagram 1 PowerPoint Presentation
Sankey diagram represent different types of flows in a business for example to show communication flows or any other process flow of information and then help to visualize the contributions to an overall flow.

Business Framework Sankey Diagram PowerPoint Presentation
Sankey diagram represent different types of flows in a business for example to show communication flows or any other process flow of information and then help to visualize the contributions to an overall flow.
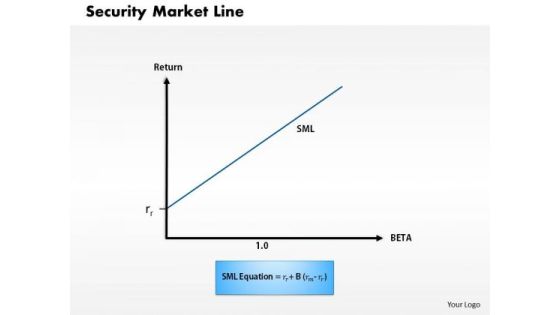
Business Framework Security Market Line 1 PowerPoint Presentation
This diagram displays graph of security market line. You can use line graph to plot changes in data over time, such as monthly revenue and earnings changes or daily changes in stock market prices.

Business Framework Security Market Line 11 PowerPoint Presentation
This diagram displays graph of security market line. You can use line graph to plot changes in data over time, such as monthly revenue and earnings changes or daily changes in stock market prices.
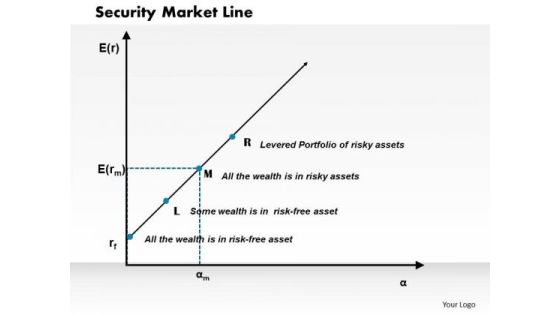
Business Framework Security Market Line PowerPoint Presentation
This diagram displays graph of security market line. You can use line graph to plot changes in data over time, such as monthly revenue and earnings changes or daily changes in stock market prices.
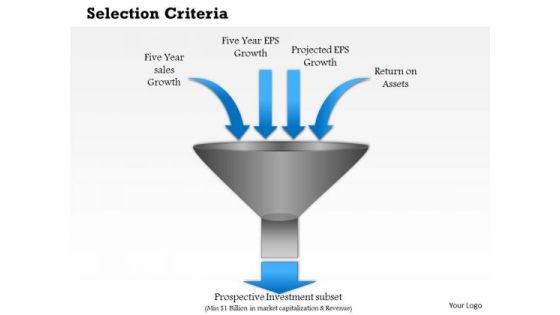
Business Framework Selection Criteria PowerPoint Presentation
This funnel diagram represents selection criteria and sales growth. You can use this funnel diagram in business and sales related presentations. Use this professional and customized business diagram for PowerPoint.

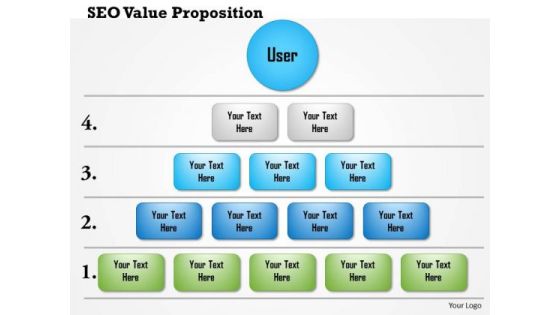
Business Framework Seo Value Proposition 4 Layers PowerPoint Presentation
Download this business diagram to give presentations on search engine optimization. Above diagram displays SEO value proposition with 4 layers. Use this professional and customized business diagram for PowerPoint.
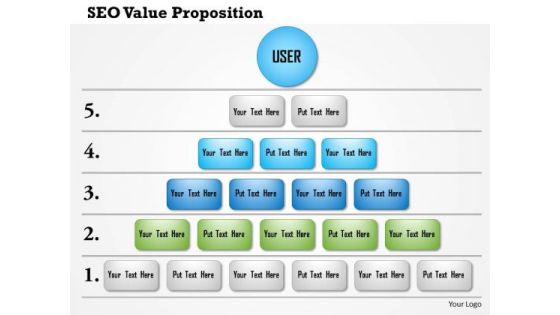
Business Framework Seo Value Proposition 5 Layers PowerPoint Presentation
Download this business diagram to give presentations on search engine optimization. Above diagram displays SEO value proposition with 5 layers. Use this professional and customized business diagram for PowerPoint.
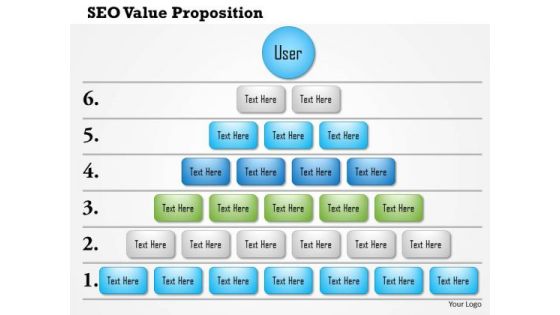
Business Framework Seo Value Proposition 6 Layers PowerPoint Presentation
Download this business diagram to give presentations on search engine optimization. Above diagram displays SEO value proposition with 6 layers. Use this professional and customized business diagram for PowerPoint.
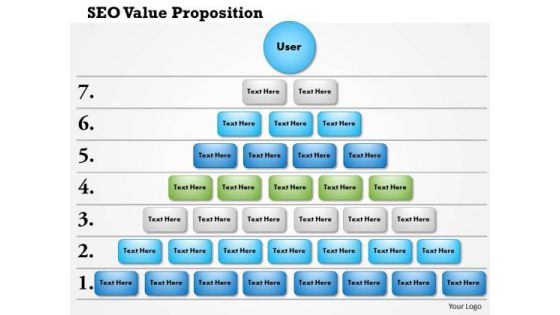
Business Framework Seo Value Proposition 7 Layers PowerPoint Presentation
Download this business diagram to give presentations on search engine optimization. Above diagram displays SEO value proposition with 7 layers. Use this professional and customized business diagram for PowerPoint.
Business Framework Seo Value Proposition 8 Layers PowerPoint Presentation
Download this business diagram to give presentations on search engine optimization. Above diagram displays SEO value proposition with 8 layers. Use this professional and customized business diagram for PowerPoint.
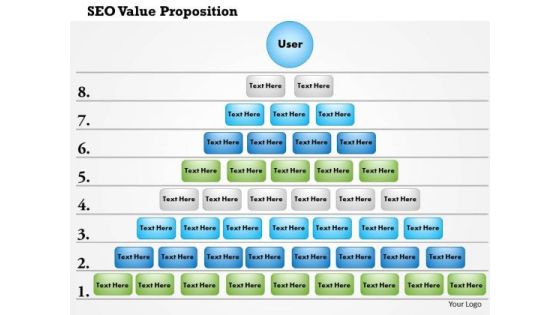
Business Framework Seo Value Proposition 9 Layers PowerPoint Presentation
Download this business diagram to give presentations on search engine optimization. Above diagram displays SEO value proposition with 9 layers. Use this professional and customized business diagram for PowerPoint.
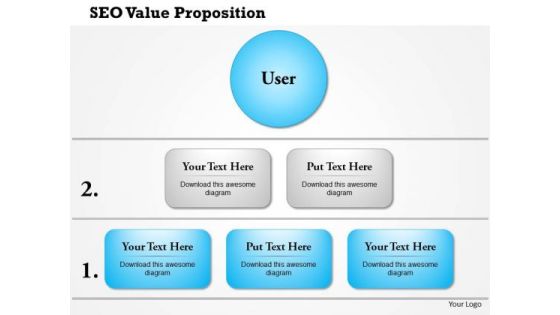
Business Framework Seo Value Proposition PowerPoint Presentation
Download this business diagram to give presentations on search engine optimization. Above diagram displays SEO value proposition. Use this professional and customized business diagram for PowerPoint.
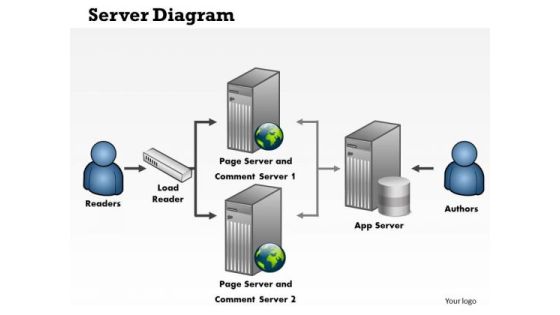
Business Framework Server Diagram PowerPoint Presentation
This business diagram displays framework of servers. Use this professional diagram in technology and network related topics. Make interactive presentations with this slide.

Stock Photo New Year Black Chess Pawn PowerPoint Slide
This image slide displays new year text with chess pawn. This image slide has been crafted with graphic of black color new year text with knight chess piece on green carpet. Use this image slide to express views on championship, competition and event. This image slide may be used to represent chess game. Make outstanding presentations using this image slide.

Stock Photo New Year Chess Pawn PowerPoint Slide
This image slide displays new year text with chess pawn. This image slide has been crafted with graphic of red color new year text with knight chess piece on green carpet. Use this image slide to express views on championship, competition and event. This image slide may be used to represent chess game. Make outstanding presentations using this image slide.
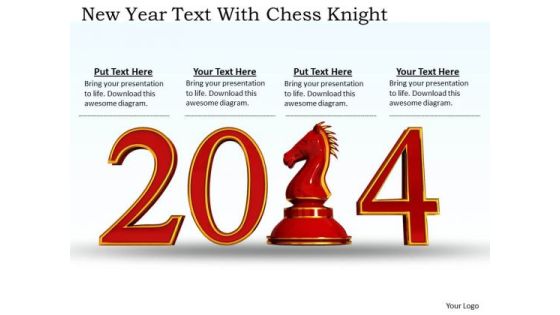
Stock Photo New Year Text With Chess Knight PowerPoint Slide
This image slide displays new year text with chess pawn. This image slide has been crafted with graphic of red color new year text with knight chess piece on white background. Use this image slide to express views on championship, competition and event. This image slide may be used to represent chess game. Make outstanding presentations using this image slide.
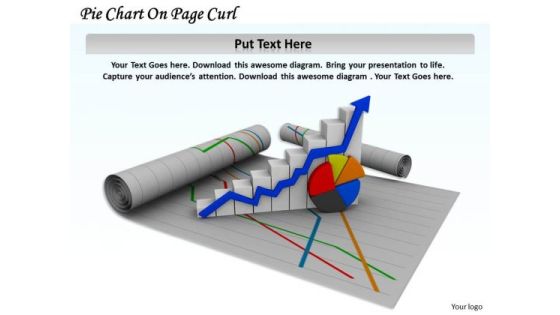
Stock Photo Pie Chart On Page Curl Arrow PowerPoint Slide
This image slide displays pie chart and growth bar graph on page curl. Use this image slide, in your presentations to express views on progress, growth and achievements. This image slide may also be used to depict strategic business planning. Make professional presentations using this image slide.

Stock Photo Pie Chart On Page Curl PowerPoint Slide
This image slide displays pie chart and growth bar graph on page curl on blue shaded background. Use this image slide, in your presentations to express views on progress, growth and achievements. This image slide may also be used to depict strategic business planning. Make professional presentations using this image slide.

Stock Photo Pieces Of Chess PowerPoint Slide
This image slide displays chess pieces. This image slide has been crafted with graphic of king and queen chess pawns on blue shaded background. Use this imager slide, in your presentations to express views on leadership , strategy and business success. This image slide will enhance the quality of your presentations.
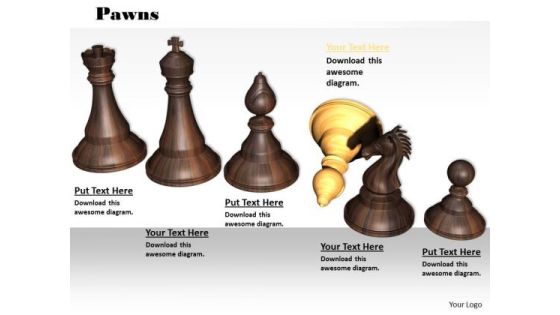
Stock Photo Wooden Chess Pawns PowerPoint Slide
This image slide displays chess pieces. This image slide has been crafted with graphic of wooden chess pawns on grey shaded background. Use this image slide, in your presentations to express views on leadership , teamwork, strategy and business success. This image slide will enhance the quality of your presentations.

Stock Photo Wooden Chess Pieces PowerPoint Slide
This image slide displays chess pieces. This image slide has been crafted with graphic of blue and white chess knight pawns on grey shaded background. Use this image slide, in your presentations to express views on leadership , teamwork, strategy and business success. This image slide will enhance the quality of your presentations.
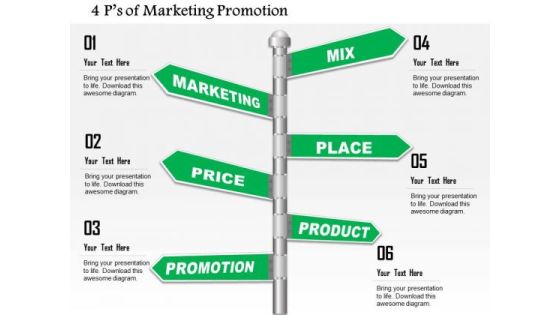
Business Diagram 4 P S Of Marketing Promotion PowerPoint Ppt Presentation
This slide displays business diagram of 4ps of marketing promotion. This contains diagram of green road signs reflecting 4ps of marketing mix. These 4ps are place, price, product and promotion. Use this professional and customized business diagram in your marketing presentations.

Stock Photo Usa Baseball Isolated On White Background PowerPoint Slide
Develop competitive advantage with this image which contains Baseball Bat with Flag of America. This image clearly defines the concepts of patriotism, baseballs, USA and sports. Special effects of this image will surely interest the audience.

Stock Photo Usa Flag And Basketball For Sports PowerPoint Slide
Develop competitive advantage with this image which contains USA Flag with basket ball. This image clearly defines the concepts of patriotism, basketball, USA and sports. Special effects of this image will surely interest the audience.

Business Diagram Percentage Pie Chart On Computer Tablet Presentation Slide Template
This business diagram power point template has been designed with graphic of pie chart. This pie chart contains the various percentage values for business result analysis. Use this pie chart for your business result display related presentations.
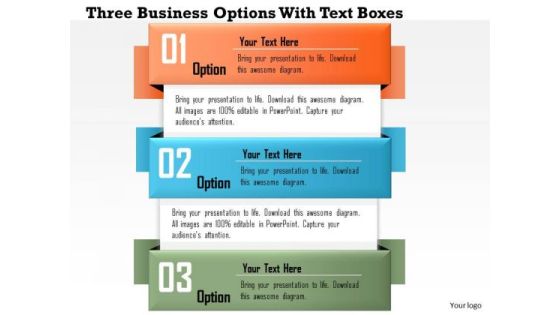
Business Diagram Three Business Options With Text Boxes Presentation Slide Template
this business power point diagram slide has been designed with graphic of three text boxes. All these boxes are used to show business options. Use this diagram slide for your business and marketing related presentations.

Business Diagram Percentage Pie Chart On Computer Tablet Presentation Template
This image slide displays business consulting diagram of percentage pie chart on computer tablet. This image has been made with 3d colorful graphic of pie chart on black tablet. Use this PowerPoint template, in your presentations to express various views like growth, achievements, success in business. This image slide will make your presentations outshine.

Business Diagram Pie Chart Showing Percentages Presentation Template
This image slide displays business consulting diagram of pie chart showing percentage. Pie Charts can be used to display a wide variety of information. When data is represented in the form of a pie chart the human eye finds it very easy to compare the data and quickly draw conclusions. In short they are a great visual aid and will add a touch of professionalism to any presentation which requires the display of data.

Business Framework The Commitment Trust Theory Of Online Relationship Marketing PowerPoint Presentat
This diagram displays framework for commitment trust theory of online relationship marketing. It contains diagram of partnerships depicting online supplier partnerships, online lateral partnerships, online internal partnerships and online buyer partnerships. Download this awesome diagram to capture your audiences attention.
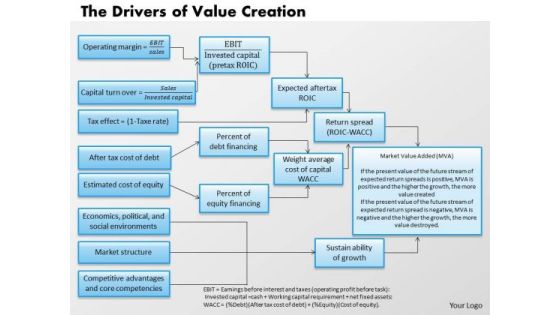
Business Framework The Drivers Of Value Creation PowerPoint Presentation
Above diagram provides framework for the drivers of value creation. It contains flow-chart depicting formula and steps for value creation. Use this professional and customized business diagram for PowerPoint presentations.
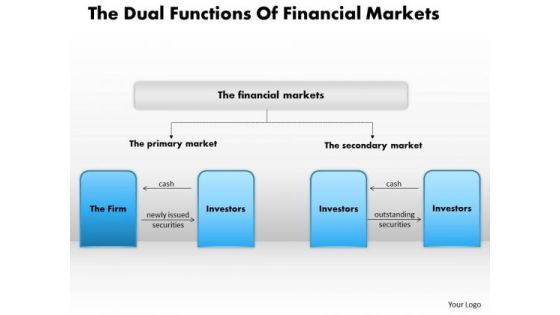
Business Framework The Dual Functions Of Financial Markets PowerPoint Presentation
Above slide displays framework for dual functions of financial markets. It contains chart for financial markets depicting primary market and secondary market. Make interactive presentations with this slide.

Business Diagram Business Step Process Diagram PowerPoint Ppt Presentation
This slide has been designed with business step process diagram. Use this diagram to displays steps of business process. Make amazing presentations with this diagram.
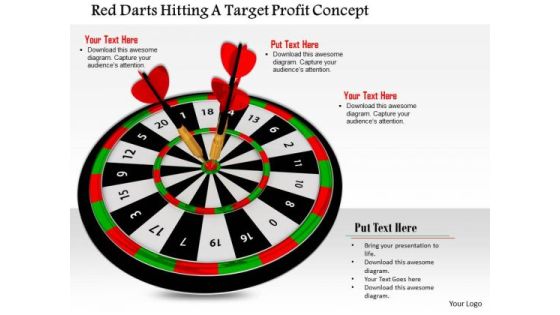
Stock Photo Red Darts Hitting A Target Profit Concept PowerPoint Slide
This image slide is designed with red darts hitting a target. This image contains darts on target board depicting concepts of business achievements and targets. Use this amazing layout to make outstanding presentations.

Stock Photo Road Arrow To Target Board PowerPoint Slide
This image slide displays road with target board. This image contains continuous road with target board in end to present vision of a desired destination and the best road to take to reach that goal. Make an impressive presentation by using this image.

Stock Photo Smartphone Shopping Cart Credit Card PowerPoint Slide
This image slide is designed with graphics of smart phone with credit card. This image depicts shopping through mobile apps. You may use this layout to display your content in an interesting, eye-catching manner.

Stock Photo Basketball White Grey Background PowerPoint Slide
This image slide has been crafted with graphic of basketball and white grey background. This slide contains the concept of gaming and success. Use this image for entertainment and game related presentations.

Stock Photo Basketballs In Line White Background Game PowerPoint Slide
This PowerPoint slide has been designed with graphic of basketballs in line on white background. This slide contains the concept of basketball game. Use this image for your success and game related presentations.
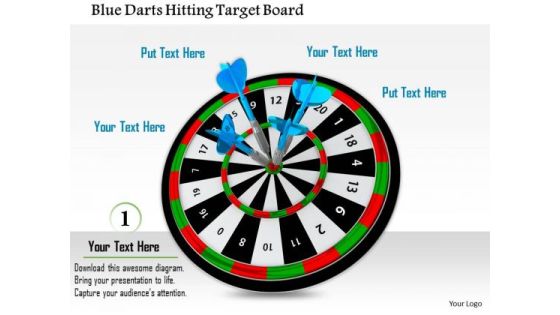
Stock Photo Blue Darts Hitting Target Board PowerPoint Slide
Explain the concept of target achievement with this innovative image slide. This slide contains the graphic of blue darts hitting the target board. Make an exclusive presentation for your viewers with this slide design.

Business Diagram Business Man With Debt Info Graphic Presentation Template
This template has graphics of 3d man falling down with heavy debt stone. This professional diagram signifies the concept of loss, struggle, and debt burden etc. Download this awesome diagram to capture your audiences attention.

Business Diagram Arrangement Of Business Steps And Text Boxes Presentation Template
This image slide displays business consulting diagram of arrangement of business steps and textboxes. In this slide, there is graphic of alphabetic colorful textboxes with different icons in steps. This image slide depicts planning. Use this PowerPoint template, in your presentations to express growth, teamwork and planning in business. This image slide will make your presentations attractive.
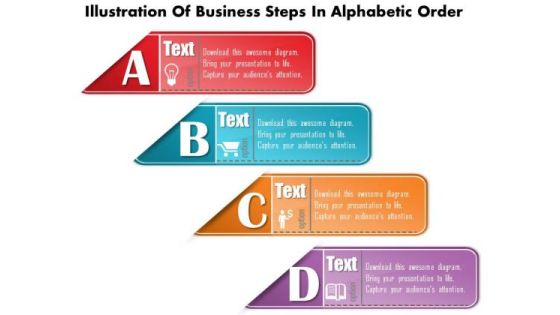
Business Diagram Illustration Of Business Steps In Alphabetic Order Presentation Template
This image slide displays business consulting diagram illustration of business steps in alphabetic order. This image slide depicts stepwise process. Use this PowerPoint template, in your presentations to express views on various business activities. This image slide will make your presentations colorful.

Black Target Board With Three Darts For Business Targets Presentation Template
This unique PPT has been crafted with graphic of target board with three darts. Explain the importance of business targets with this exclusive PPT and build quality presentation for your viewers.
Stock Photo Coffee With Financial Calculator And Business Paper PowerPoint Slide
This image slide is designed with graphic of financial calculator with coffee cup and news paper. This image explains the concept of workplace and coffee break with its suitable graphics. Use this image to make business presentations.
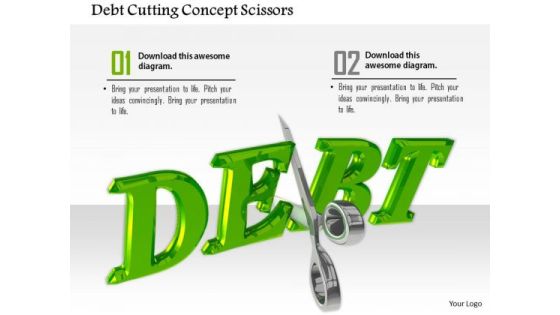
Stock Photo Debt Cutting Concept Scissors PowerPoint Slide
This image slide is designed with scissors cutting the debt word. This image contains the graphic debt cutting scissors depicting how to reduce your debt. This image is suitable for business and marketing related presentations.
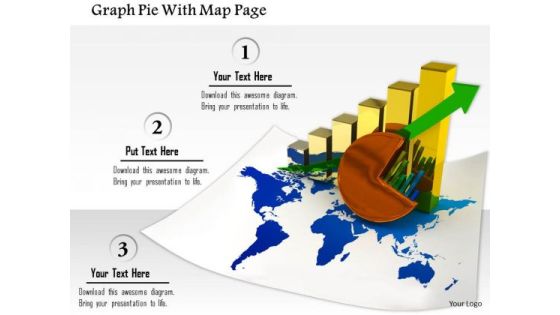
Stock Photo Graph Pie With Map Page PowerPoint Slide
This image slide contains business charts on world map. This image is designed with bar graph and pie chart on world map depicting global economy. Use this image slide to represent financial growth in any business presentation.

Business Diagram Pstm Mobile Network With Base Stations And Atm Bsc Presentation Template
This lside displays pstm mobile network with base stations and atm bsc. explain the working of pstm mobile network with base station. This diagram also include atm bsc process. Use this diagram slide to build quality presentation.
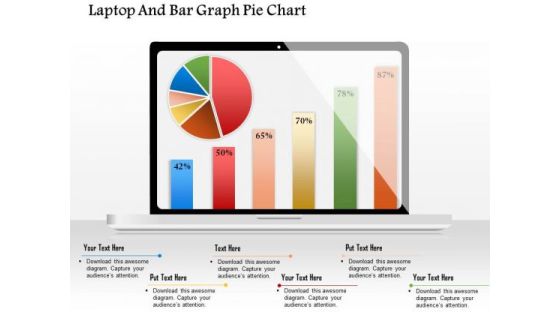
Business Diagram Laptop And Bar Graph Pie Chart Presentation Template
This Power Point template has been designed with graphic of target dart. This PPT diagram contains the concept of information communication. Use this PPT in your business communication related presentations.
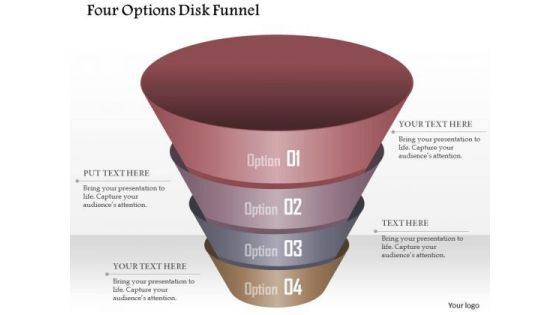
Business Diagram Our Options Disk Funnel Presentation Template
Explain the concept of making milestones in business and life with this exclusive PPT. This Power Point template diagram slide has been designed with graphic of mountains and red flags. These flags are showing four steps of milestones of each stage.
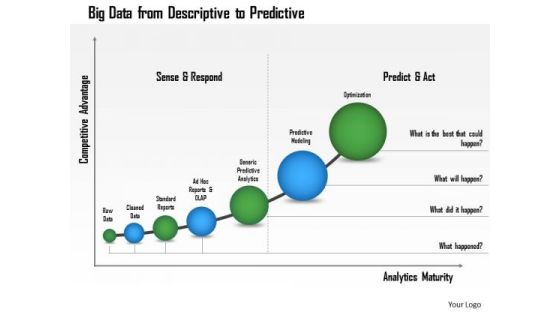
Business Framework Big Data From Descriptive To Predictive PowerPoint Presentation
Two funnel diagrams with text boxes are used to design this Power point template slide. This PPT slide contains the concept of AIDA marketing. Use this PPT for marketing and business presentations.
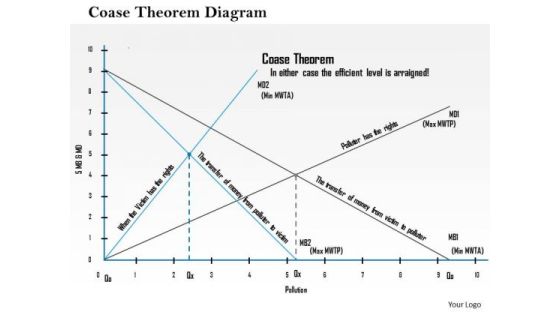
Business Framework Coase Theorem Diagram PowerPoint Presentation
This professional power point template has been crafted with graphic of cloud with laptop and application icons. This PPt shows the concept of cloud computing for devices. Use this PPT for your technology and business related topics.

Business Diagram 3d Graphic Colored Bar Graph For Business Result Analysis Presentation Template
This Power Point template has been designed with graphic of 3d graphic and colored bar graph. Use this slide to represent six steps of any business process. Use this diagram for your business presentations and get exclusive comments on your efforts.

Business Diagram Bar Graph For Result Display On Mobile Presentation Template
This Power Point template has been designed with graphic of bar graph on mobile phone. This business diagram can be used to make business reports. Download this Power Point slide to build quality presentation for your viewers.
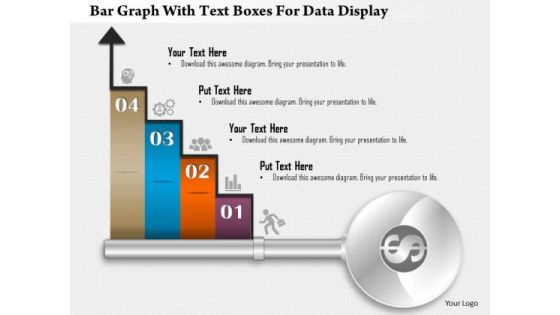
Business Diagram Bar Graph With Text Boxes For Data Display Presentation Template
Our above business diagram displays bar graph. It contains four steps on bar graph with icons. Use this diagram to display four stages of business growth. Download this Power Point slide to build quality presentation for your viewers.
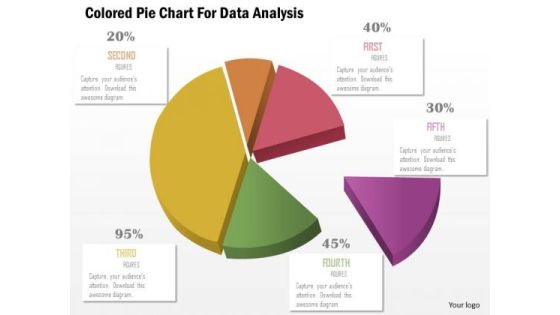
Business Diagram Colored Pie Chart For Data Analysis Presentation Template
This business slide displays pie chart. This diagram is a data visualization tool that gives you a simple way to present statistical information. This slide helps your audience examine and interpret the data you present.
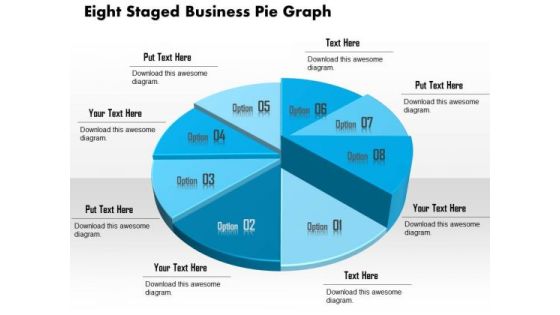
Business Diagram Eight Staged Business Pie Graph Presentation Template
This business slide displays eight staged pie chart. This diagram is a data visualization tool that gives you a simple way to present statistical information. This slide helps your audience examine and interpret the data you present.
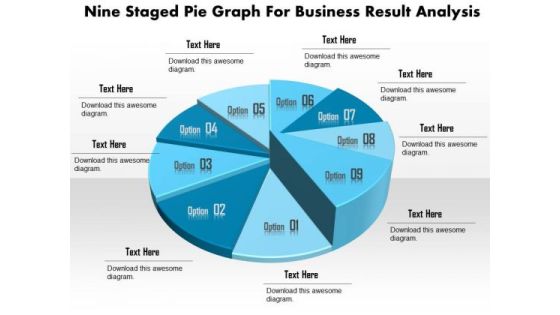
Business Diagram Nine Staged Pie Graph For Business Result Analysis Presentation Template
This business slide displays nine staged pie chart. This diagram is a data visualization tool that gives you a simple way to present statistical information. This slide helps your audience examine and interpret the data you present.

Stock Photo Balloons Inside The Gift Box Fo Celebration PowerPoint Slide
Concept of celebration has been displayed in this power point template. This slide contains the graphic of balloons and gift box. Use this image slide to express your views on party and celebrations.

Stock Photo Dollar On Tablet For Financial Growth PowerPoint Slide
Graphic of dollar on tablet has been displayed in this image slide. This image contains the concept of financial growth. Use this editable design to depict financial transactions.

Stock Photo Dollars Covered With Lock And Chain PowerPoint Slide
This Power Point image template has been designed with graphic of dollar and chain. In this image dollar is covered with chain which shows the concept of safety. Use this image template financial security related presentations.

Business Diagram Golden Silver And Gold Trophy For Champions And Gold Medal Presentation Template
This business diagram has been designed with graphic of trophies. This business slide contains the concept of success and victory. Use this diagram to present your views in a wonderful manner.
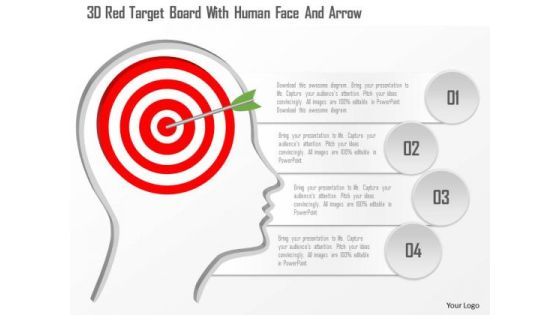
Busines Diagram 3d Red Target Board With Human Face And Arrow Presentation Template
This business diagram has been designed with graphic of 3d red target board on human face. This business slide helps to portray the concept of target achievement. Use this awesome slide for business and marketing target related presentations.
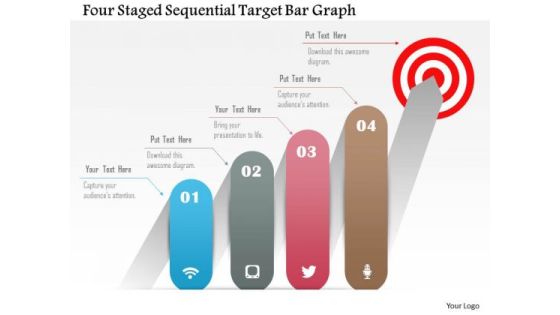
Business Diagram Four Staged Sequential Target Bar Graph Presentation Template
This business diagram has been designed with graphic of four steps towards target achievement. Use this diagram, in your presentations to express views on strategies, policies, success, achievements and opportunities. Create professional presentations using this diagram slide.
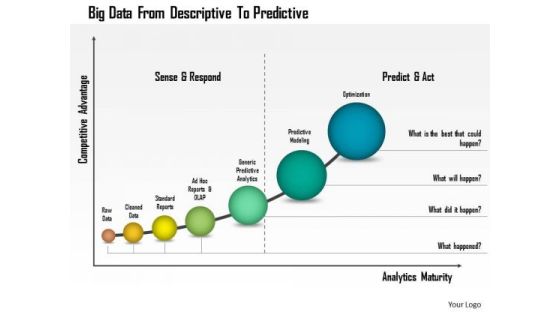
Business Diagram Big Data From Descriptive To Predictive Presentation Template
This business diagram has been designed with graphic of linear bar graph. This growing bar graph depicts the concept of big data analysis. Use this professional diagram for your financial and business analysis.
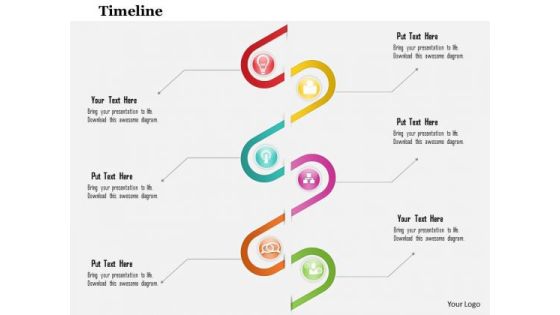
Business Diagram Six Staged Spiral Diagram For Data Flow Presentation Template
This business slide depicts six staged spiral diagram. This diagram provides an effective way of displaying information you can edit text, color, shade and style as per you need. Present your views using this innovative slide and be assured of leaving a lasting impression.
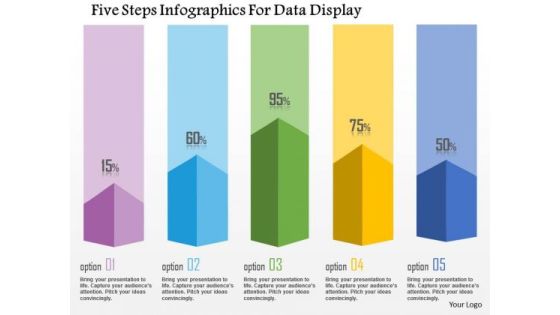
Business Diagram Five Steps Infographics For Data Display Presentation Template
This business diagram has been designed with graphic of five staged info graphics. This diagram can be used to display statistical information. Use this bar graph for your business and sales related presentations.
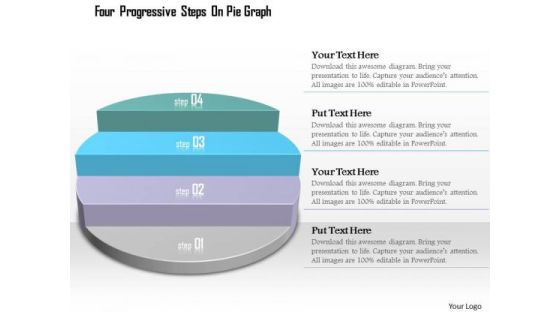
Business Diagram Four Progressive Steps On Pie Graph Presentation Template
This diagram displays progressive steps on pie chart. It contains graphic of pie graph with four steps. Use this diagram, in your presentations to express views on process, steps, stages, progress, targets, goals, success and achievements. Give professional appearance to your presentations using this business slide.

Business Diagram Three Podium Style Text Boxes Presentation Template
Three podiums are used to design this business diagram. This business slide depicts concept of victory and achievement. Use this slide for your game and success related presentations.

Business Diagram Four Staged Web Design Diagram With Trophy Presentation Template
This business diagram has been designed with graphic of four staged web design diagram with trophy. Download this diagram to depict success and victory concepts. This diagram offers a way for your audience to visually conceptualize the process.

Business Diagram Human Hand With Credit Card Text Boxes For Data Representation Ppt Template
This power point template has been crafted with graphic of human hand and credit card style text boxes. his PPT diagram contains the concept of data representation. This PPT is suitable for your business and marketing presentations.
Business Diagram Five Staged Business Process Diagram With Icons Presentation Template
Our above slide displays five staged business process diagram. Download our above diagram to express information in a visual way. Use this diagram and get good comments for data related presentations.

Business Diagram Four Sections Pyramid Layout For Business Presentation Template
Our above slide displays four sections pyramid layout. It helps to depict workflow or a process. This diagram offers a way for your audience to visually conceptualize the process.
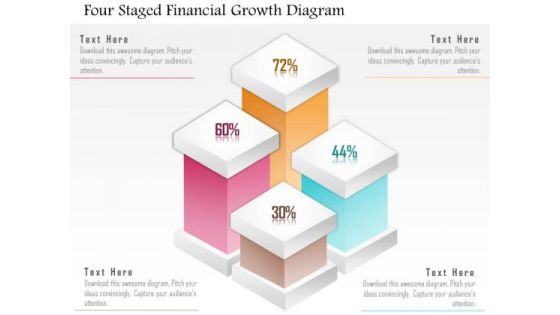
Business Diagram Four Staged Financial Growth Diagram Presentation Template
Our above slide displays four staged financial growth diagram. It helps to depict workflow or a process. This diagram offers a way for your audience to visually conceptualize the process.
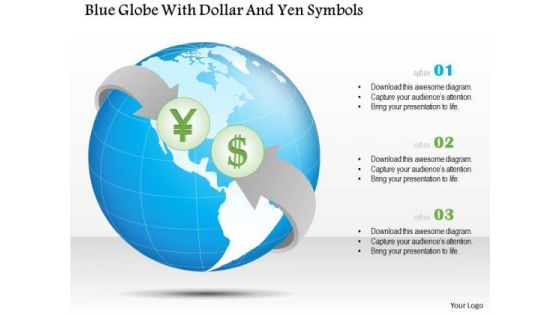
Business Diagram Blue Globe With Dollar And Yen Symbols Presentation Template
Graphic of blue globe with dollar and yen symbol has been used in this business diagram. This slide is helpful to represent topics like global economy and business. Display your strategy in your presentation with this exclusive diagram.
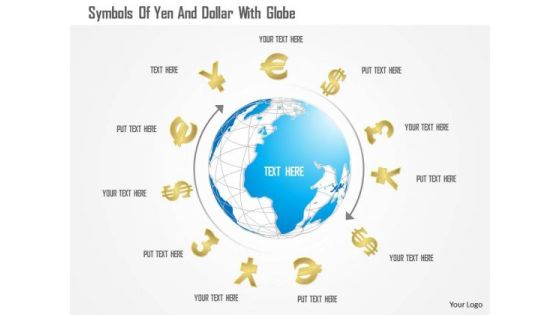
Business Diagram Symbols Of Yen And Dollar With Globe Presentation Template
Symbols of Yen and dollar around globe have been used in this business diagram. This slide is helpful to represent topics like global economy and business. Display your strategy in your presentation with this exclusive diagram.

Business Diagram Bull And Bear Marketing Technology Presentation Template
This power point template slide has been designed with graphic of bull and bear. This PPT contains the concept of growth and decay. Use this PPT for business and marketing related presentations.

Business Diagram Thermometer Graphics Indicating Progress Presentation Template
This power point template diagram has been designed with graphic of thermometer and bar graph. This PPT contains the concept of growth analysis. Use this PPT for business and marketing related presentations.
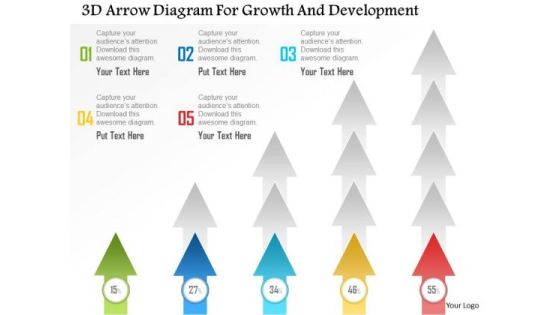
Business Diagram 3d Arrow Diagram For Growth And Development Presentation Template
This power point template diagram has been designed with graphic of 3d arrow. This PPt contains the concept of growth and development. Use this PPT for business and marketing related presentations.

Business Diagram Balancing Scale With Two Dices For Opposite Choices Presentation Template
Graphic of balancing scale with two dices has been used to decorate this power point template slide. This diagram slide contains the concept of opposite choices and balance. Use this PPT for business and game related topics in any presentation.
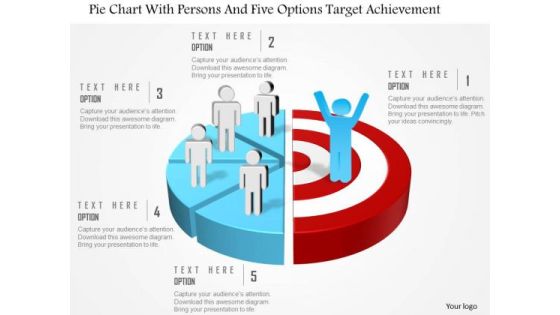
Business Diagram Pie Chart With Persons And Five Options Target Achievement Presentation Template
This power point template slide has been crafted with graphic of pie chart, persons and five options. This PPT contains the concept of option representation for target achievement. Use this PPT diagram for business and marketing targets related topics in any presentations.
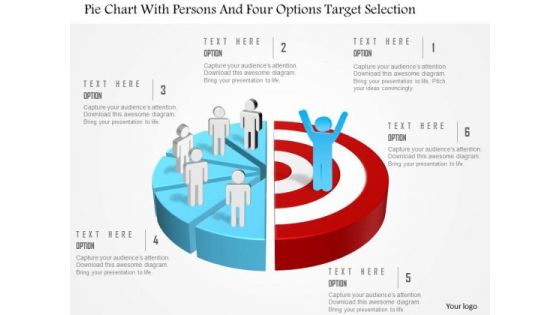
Business Diagram Pie Chart With Persons And Four Options Target Selection Presentation Template
This power point template slide has been crafted with graphic of pie chart ,persons and four options. This PPT contains the concept of option representation for targets selection. This PPT diagram is can be used business and sales presentations.
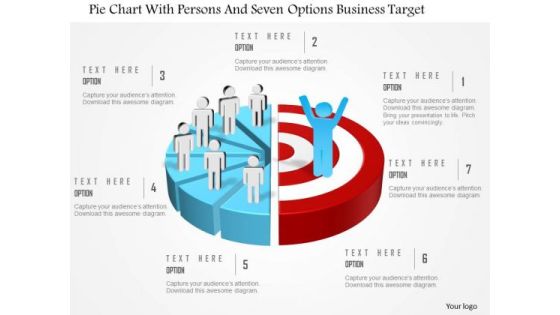
Business Diagram Pie Chart With Persons And Seven Options Business Target Presentation Template
This power point template slide has been crafted with graphic of pie chart ,persons and seven options. This PPT contains the concept of option representation for business targets. This PPT diagram is can be used business and marketing presentations.

Business Diagram Pie Chart With Persons And Three Options Marketing Targets Presentation Template
This power point template slide has been crafted with graphic of pie chart and three persons. This PPT contains the concept of option representation for marketing targets. This PPT diagram is suitable for marketing presentations.
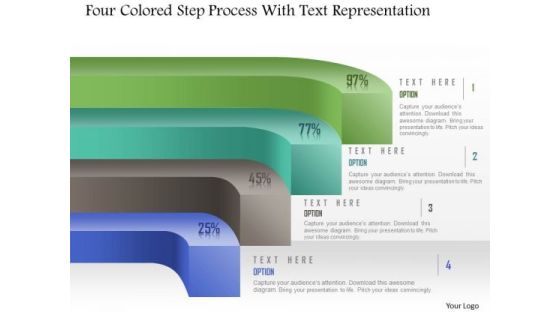
Business Diagram Four Colored Step Process With Text Representation PowerPoint Template
Four colored step process diagram has been used to craft this power point template. This PPT contains the concept of process flow. Use this PPT for your business and marketing related presentations and make your viewers happy.
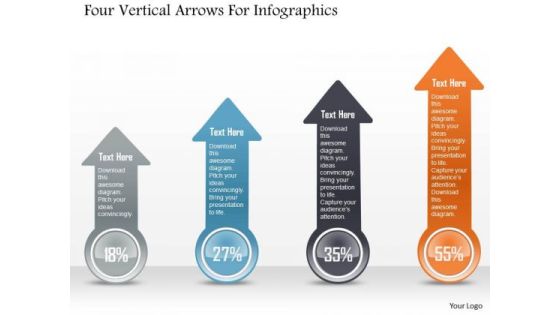
Business Diagram Four Vertical Arrows For Infographics PowerPoint Template
Four vertical arrows are used to craft this power point template. This PPT slide contains the concept of information representation. Display your information in any presentation with this professional PPT slide.
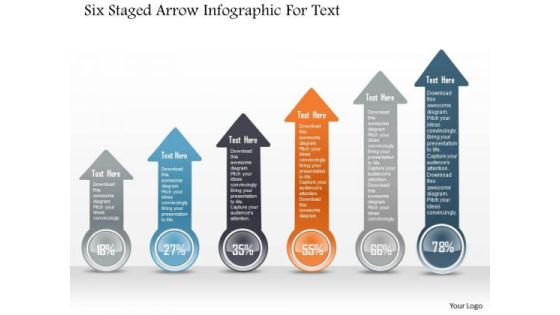
Business Diagram Six Staged Arrow Infographic For Text PowerPoint Template
Six staged colored arrow info graphics diagram has been used to craft this power point template. This PPT contains the concept of business process flow and information representation. Display any process flow in your presentation with this professional PPT slide.
Business Diagram Three Icons Arrow Text Boxes PowerPoint Template
Graphic of three icons and arrow text boxes are used to craft this power point template slide. This PPT contains the concept of business growth. This PPT slide is suitable for business and marketing data flow related presentations.
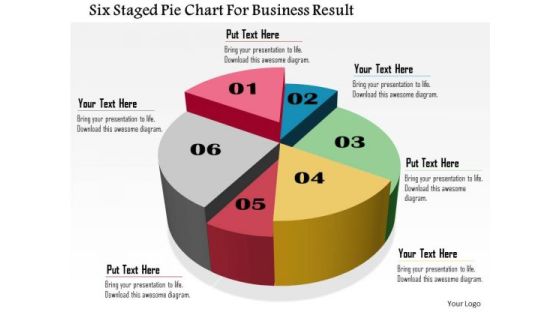
Business Daigram Six Staged Pie Chart For Business Result Presentation Templets
Six staged pie chart is used to design this business slide. Download this diagram to make business and financial reports. Use our above diagram to express information in a visual way.

Business Diagram Pencils For 4 Financial Statements Presentation Template
Emphatically define your message with this slide which contains a graphic of pencils. Above image may be used to display four financial statements. Use this slide to build exclusive presentations for your viewers.
Business Diagram Pie Chart With Icons For Financial Analysis Presentation Template
This professional business diagram slide has been designed with pie chart and icons. It contains concept of financial analysis. Use this slide to build exclusive presentations for your viewers.
Business Diagram Tabs With Business Icons For Planning Presentation Template
Our above slide displays tabs with business icons. It helps to depict workflow or a process. Download our above diagram to express information in a visual way.
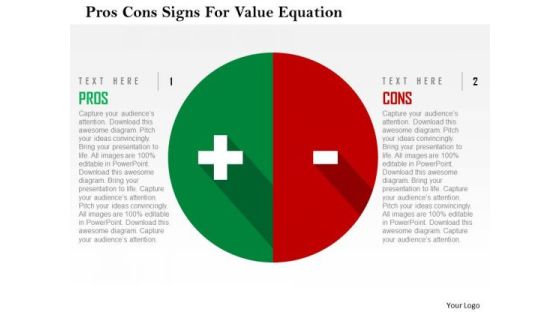
Business Diagram Pros Cons Signs For Value Equation Presentation Template
This business diagram is designed with pros and cons signs. You may use this business slide to present value equation. This diagram provides an effective way of displaying information you can edit text, color, shade and style as per you need.
Business Diagram Icons In Semi Circle For Timeline Presentation Template
This business diagram displays icons in semicircle. This diagram slide contains the concepts of business timeline. Download this diagram slide to make impressive presentations.
Business Diagram Pencil With Icons For Good Marketing Strategy Presentation Template
This Business slide has been designed with pencil with icons. This diagram can be used to displays good marketing strategy. Download this diagram slide to make professional presentations.
Business Diagram Steps With Icons For Success Presentation Template
This business slide displays icons on stairs. Use this diagram slide, in your presentations to depict growth and progress steps. Make your presentations outshine using this professional slide.
Business Diagram Six Icons For Communication Presentation Template
Our above business diagram has been designed with six business icons. You may present market analysis using this diagram. Pressure cooks your views with this diagram. You will hear whistles of appreciation.

Business Diagram Six Options In Pyramid Presentation Template
Sales process can be explained with this pyramid diagram. This diagram contains the graphic of pyramid chart with six options. This diagram provides an effective way of displaying information.

Stock Photo Bar Graph With Growth Arrow PowerPoint Slide
This creative image displays design of Bar Graph with Growth Arrow. This image has been designed to depict business on an Upward Trend. Create an impact with this quality image and make professional presentations.
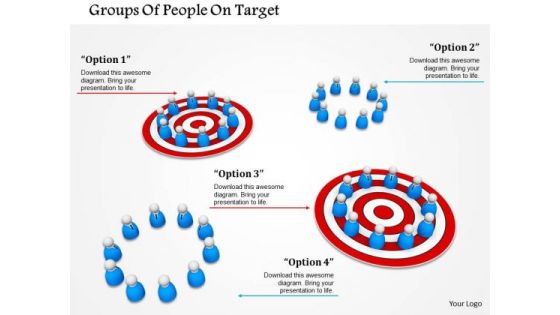
Stock Photo Groups Of People On Target PowerPoint Slide
This image slide contains groups of people on target. Download this image to portray concepts like team targets and communication. Use this image to enhance the beauty of your words.
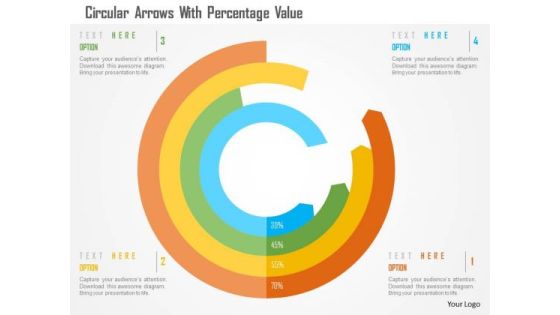
Business Diagram Circular Arrows With Percentage Value Presentation Template
This business slide has been designed with circular arrows. You may download this diagram to display percentage growth data. This template is innovatively designed to highlight your worthy views
Business Diagram Cloud Icon For Data Storage Presentation Template
Concept of cloud computing and data storage has been defined in this power point template. This business diagram contains the graphic of clouds. Use this diagram for business and technology related presentations.

Business Diagram Folders For Financial Review Presentation Template
This business diagram has been designed with graphics of colored folders. You may download this slide for financial review. Use this slide to create an impact on your viewers.

Men On Boats For Competition Presentation Template
Concept of competition can be explained with this PowerPoint template. It contains graphics of men in boat race. Above slide provides the ideal backdrop to make interactive presentations.
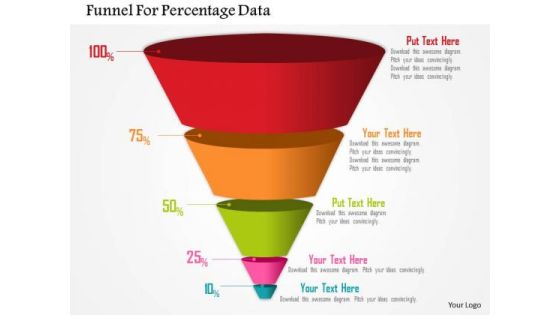
Business Diagram Funnel For Percentage Data Presentation Template
Four staged funnel diagram has been used to design this power point template. This diagram contains the concept of filtration. Present your views and ideas with this impressive image.
Business Diagram Icons For Good Marketing Strategy Presentation Template
This power point template has been designed with graphic of bar graph, suitcase and meeting business icons. These business icons are used to display the concept of business result analysis and meeting. Use this diagram for business related topics in any presentations.
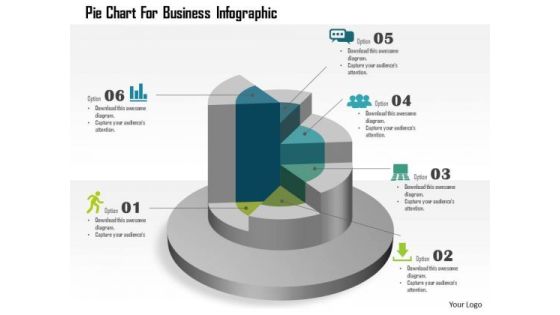
Business Diagram Pie Chart For Business Infographic Presentation Template
This template displays pie chart business infographic. You may download this business slide for result analysis. Amplify your thoughts via this appropriate business template.
Business Diagram Modern Icons On Pie Chart Presentation Template
Download this diagram to displays marketing strategy. This business diagram contains the graphic of icons on pie graph. Use this template to highlight the key issues of your presentation.

Business Diagram Pencil Graph For Statistics Presentation Template
The above template contains graphics of pencil graph. This diagram may be used to display statistical information. This diagram slide will
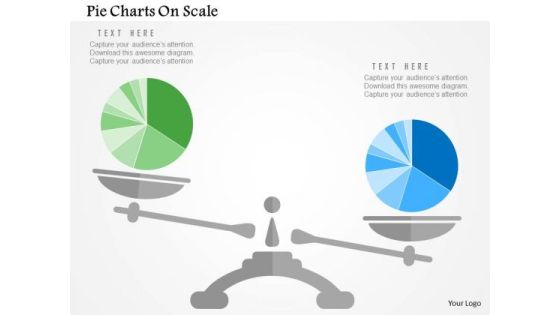
Business Diagram Pie Charts On Scale Presentation Template
Our above slide display graphics of pie chart on a scale. Download this diagram slide to display competitive analysis of business. Adjust the above diagram in your business presentations to visually support your content.

Business Diagram Bar Graph For Growth And Progress Presentation Template
This business slide has been designed with graphics of bar chart. You may download this diagram to display concepts like growth, progress and success in business. Download this diagram slide to make impressive presentations.

Business Diagram Bars For Profit Percentages Presentation Template
Download this exclusive business diagram to present profit in percentage ratio. This slide contains the graphic of bars. This diagram can be useful for business presentations.
Business Diagram Icons Around Pie Chart Presentation Template
Strategy and planning can be displayed with this business diagram. This slide contains the graphic of icons around pie chart Use this editable slide to build quality presentation for your viewers.
Circles With Icons For Communication PowerPoint Template
The above template displays a diagram of circles with icons. This diagram has been professionally designed to emphasize on concept of competitive strategy. Grab centre stage with this slide. Capture the attention of your audience.
Business Diagram Icons And Charts For Business Growth Presentation Template
Our above slide contains graphics of business charts and icons. It helps to display business reports and analysis. Use this diagram to impart more clarity to data and to create more sound impact on viewers.
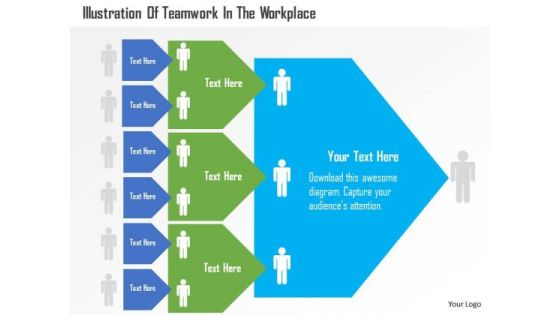
Business Diagram Illustration Of Teamwork In The Workplace Presentation Template
Our above business diagram illustrates teamwork in workplace. This slide is suitable for teamwork related presentations. Use this business diagram to present your work in a more smart and precise manner.

Business Diagram Matrix Chart For Financial Review Presentation Template
Our above business diagram has been designed with graphics of matrix chart. This slide is suitable to present financial review. Use this business diagram to present your work in a more smart and precise manner.

Timeline With Year Based Analysis And Business Apps PowerPoint Template
Create dynamic presentations with our professional template containing graphics of timeline with business icons. This diagram may be used to display planning and analysis. Download this template to leave permanent impression on your audience.
Icons For Cloud Computing PowerPoint Template
Develop competitive advantage with our above template which contains a diagram of cloud network. This diagram may used to depict concepts like cloud computing and technology. This slide provides an effective way of displaying information.

Pie Chart For Financial Ratio Analysis PowerPoint Template
Deliver amazing presentations with our above template showing pie chart. You may download this slide to display financial ratio analysis. Capture the attention of your audience using this diagram.
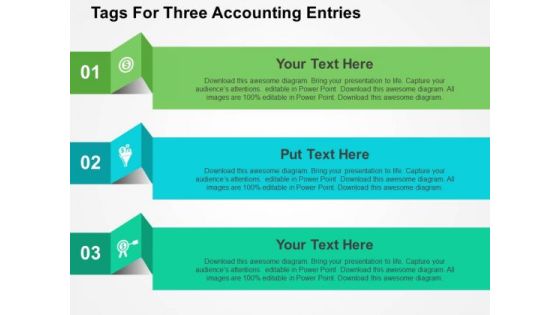
Tags For Three Accounting Entries PowerPoint Template
Visually support your presentation with our above template showing graphics of three tags. This slide has been professionally designed to display accounting entries. This template offers an excellent background to build impressive presentation.
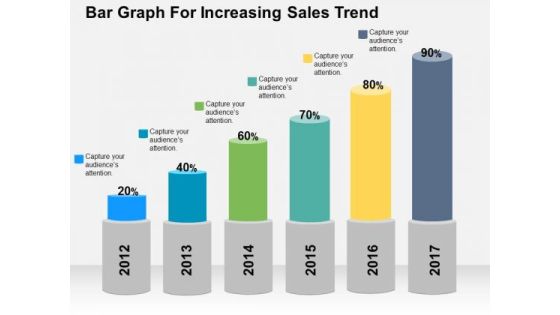
Bar Graph For Increasing Sales Trend PowerPoint Template
Deliver amazing presentations with our above template showing bar graph with percentage values. You may download this slide to depict increase in sales trends. Capture the attention of your audience using this diagram.
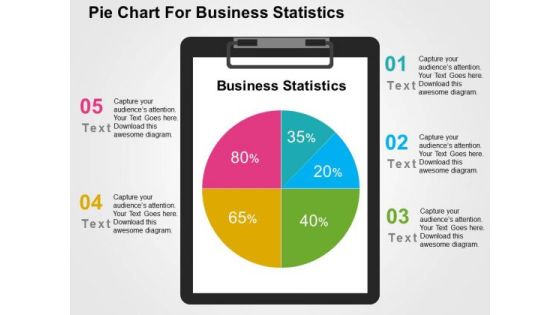
Pie Chart For Business Statistics PowerPoint Template
Visually support your presentation with our above template showing pie chart. This slide has been professionally designed to present business statistics. This template offers an excellent background to build impressive presentation.
Business Man Draws Financial Data For Analysis PowerPoint Templates
This PowerPoint slide has a theme for financial data analysis. This image has been designed to display concept of financial planning and analysis. Deliver amazing presentations to mesmerize your audience using this image
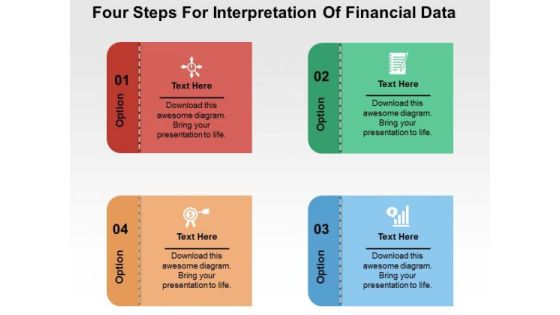
Four Steps For Interpretation Of Financial Data PowerPoint Templates
Our PPT above slide displays graphics of four text boxes with icons. This template may be used to depict interpretation of financial data. You can present your opinions using this impressive slide.

Scorecard For Companys Performance And Financial Condition PowerPoint Templates
Use this PPT slide to display companies performance financial planning. This slide contains graphics of circular scorecard. Trigger the imagination of your audience with this professional diagram.

Bars Displaying Percentage Growth PowerPoint Templates
Our above PPT slide contains bar graph displaying percentage growth. This diagram of bar graph helps to depict statistical information. Use this diagram to impart more clarity to data and to create more sound impact on viewers.
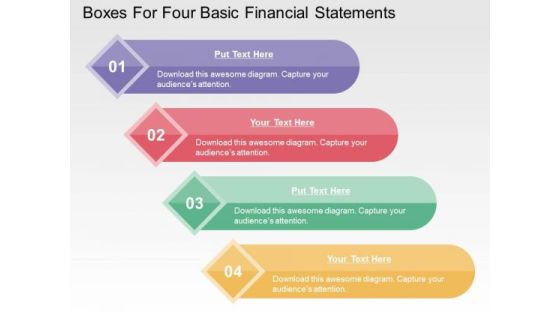
Boxes For Four Basic Financial Statements PowerPoint Templates
This business slide contains graphics of four text boxes. This diagram is suitable to present four basic financial statements. Visual effect of this diagram helps in maintaining the flow of the discussion and provides more clarity to the subject.

Graph Showing Economy Crash PowerPoint Templates
This business slide contains design of graph. This diagram is suitable to present downfall and economy crash. Visual effect of this diagram helps in maintaining the flow of the discussion and provides more clarity to the subject.
Hexagons With Business Icons PowerPoint Templates
This PowerPoint slide contains hexagons with business icons. This diagram is designed to make impressive presentations on various business processes. This professional slide helps in making an instant impact on viewers.

Illustration Of Dollar Growth Graph PowerPoint Template
This business slide contains graphics of dollar symbols on graph. This diagram helps to portray concept of financial planning. Present your views using this innovative slide and be assured of leaving a lasting impression.

Infographic For Mission Vision And Values PowerPoint Template
This slide contains the infographic diagram. Download this exclusive business diagram to present business mission, vision and values. This diagram can be useful for business presentations.
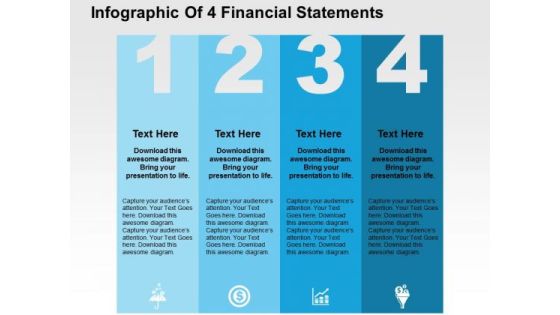
Infographic Of 4 Financial Statements PowerPoint Template
Four financial statements can be displayed in this business diagram. This slide contains the graphic of four text boxes with icons Use this editable slide to build quality presentation for your viewers.
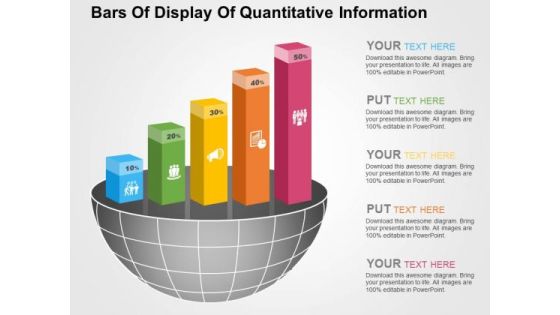
Bars Of Display Of Quantitative Information PowerPoint Templates
Visually support your presentation with our above template illustrating quantitative information. It contains graphics of bars. Etch your views in the brains of your audience with this diagram slide.
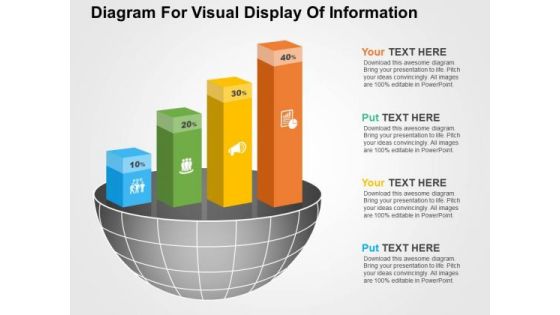
Diagram For Visual Display Of Information PowerPoint Templates
Visually support your presentation with our above template illustrating quantitative information. It contains graphics of bars. Etch your views in the brains of your audience with this diagram slide.

Four Staged Arrows Design PowerPoint Templates
This PowerPoint template has been designed with arrows infographic. You can easily impart your information with help of this PowerPoint template. The slide can be customized as per requirements of business education or any other theme.

Percentage Data Growth Chart Powerpoint Slides
This PowerPoint template has been designed with percentage data growth chart. Download this PPT chart to depict financial ratio analysis. This PowerPoint slide is of great help in the business sector to make realistic presentations and provides effective way of presenting your newer thoughts.
Four Pencils Bar Graph And Icons Powerpoint Template
Develop competitive advantage with our above template which contains a diagram of five pencils bar graph. This diagram provides an effective way of displaying business information. You can edit text, color, shade and style as per you need.

Circular Steps For Market Entry Strategy Powerpoint Slides
This PowerPoint template contains graphics of circular steps. You may download this PPT slide design to display market entry strategy. You can easily customize this template to make it more unique as per your need.

Bar Graph For Statistical Analysis Powerpoint Slides
This PowerPoint template has been designed with bar chart and percentage values. You may download this PPT slide to depict statistical analysis. Add this slide to your presentation and impress your superiors.

Battery Chart With Percentage Values For Comparison PowerPoint Slides
This year?s sales has matched up with your expectations. Now match this slide with your presentation to show the same. Show your company?s performance or business growth with this four staged battery chart PowerPoint template. With this slide, you can easily convince your colleagues how your company gave a tremendous growth over the years or months. Perfect illustration to show that the targets are achieved. This PPT template is easy to edit. You can choose the color of your choice. Your colleagues are already impressed with the sales growth. Now impress others and choose this PPT innovative designed template.

Dashboard With Increasing Values Powerpoint Slides
This innovative, stunningly beautiful dashboard has been designed for data visualization. It contains pie charts with increasing percentage values. This PowerPoint template helps to display your information in a useful, simple and uncluttered way.
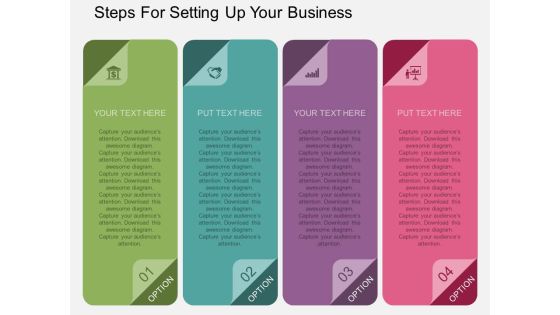
Steps For Setting Up Your Business Powerpoint Template
Our compelling template consists with diagram of text boxes. This slide has been professionally designed to display text information. This template offers an excellent background to build impressive presentation.

Circle Chart For Value Analysis Powerpoint Slides
This PowerPoint template has been designed for business presentations and corporate slides. The PowerPoint template has a high quality design. You can download this PowerPoint slide for corporate presentations or annual meeting and business plans.
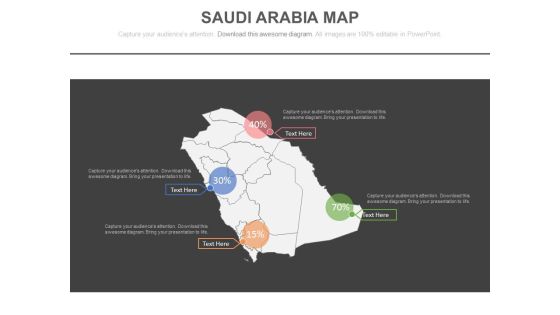
Saudi Arabia Map For Financial Strategy Analysis Powerpoint Slides
This PowerPoint template has been designed with Saudi Arabia Map. You may use this slide to display financial strategy analysis. This diagram provides an effective way of displaying information you can edit text, color, shade and style as per you need.
Saudi Arabia Map With Percentage Values And Icons Powerpoint Slides
This PowerPoint template has been designed with Saudi Arabia Map with percentage values and icons. You may use this slide to display financial strategy analysis. This diagram provides an effective way of displaying information you can edit text, color, shade and style as per you need.

Bar Graph For Year Based Analysis Powerpoint Slides
This PowerPoint template has been designed with year based bar graph. This diagram may be used to display yearly statistical analysis. Use this PPT slide design to make impressive presentations.


 Continue with Email

 Home
Home


