Funding

Competitor Comparison Template 2 Ppt PowerPoint Presentation Infographics Objects
This is a competitor comparison template 2 ppt powerpoint presentation infographics objects. This is a five stage process. The stages in this process are business, marketing, graph, finance, strategy.

Competitor Market Share And Sales Revenues Ppt PowerPoint Presentation Summary Influencers
This is a competitor market share and sales revenues ppt powerpoint presentation summary influencers. This is a four stage process. The stages in this process are business, marketing, graph, finance, strategy.
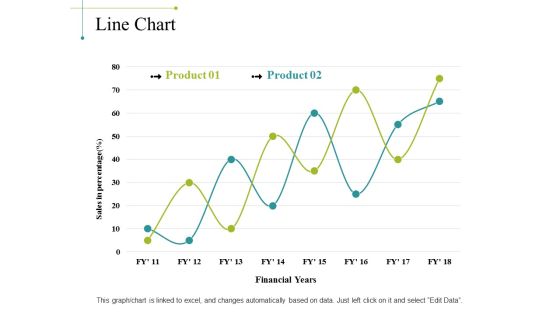
Line Chart Ppt PowerPoint Presentation Portfolio Background Image
This is a line chart ppt powerpoint presentation portfolio background image. This is a two stage process. The stages in this process are sales in percentage, financial years, chart, business, marketing, finance.

Summary Financials Wc Analysis Roce Roe Ppt PowerPoint Presentation Design Templates
This is a summary financials wc analysis roce roe ppt powerpoint presentation design templates. This is a two stage process. The stages in this process are business, marketing, working capital analysis, roce and roe, finance.

Combo Chart Ppt PowerPoint Presentation Gallery Graphics Tutorials
This is a Combo Chart Ppt PowerPoint Presentation Gallery Graphics Tutorials. This is a three stage process. The stages in this process are combo chart, finance, marketing, strategy, analysis.
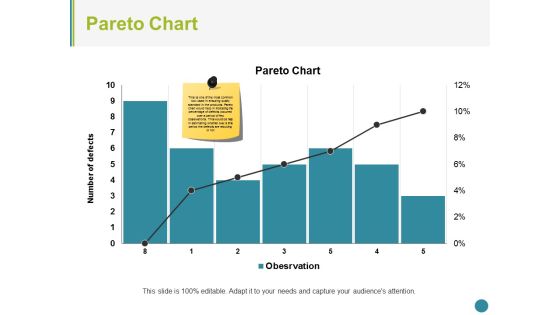
Pareto Chart Ppt PowerPoint Presentation Summary Structure
This is a pareto chart ppt powerpoint presentation summary structure. This is a seven stage process. The stages in this process are pareto chart, finance, marketing, strategy, analysis, business.

Bar Graph Ppt PowerPoint Presentation Summary Format
This is a bar graph ppt powerpoint presentation summary format. This is a three stage process. The stages in this process are bar graph, business, marketing, years, percentage, finance.

Competitor Comparison Template 1 Ppt PowerPoint Presentation Layouts Slide Portrait
This is a competitor comparison template 1 ppt powerpoint presentation layouts slide portrait. This is a four stage process. The stages in this process are business, marketing, graph, finance, strategy.

Competitor Comparison Template 2 Ppt PowerPoint Presentation Inspiration Images
This is a competitor comparison template 2 ppt powerpoint presentation inspiration images. This is a five stage process. The stages in this process are business, marketing, graph, finance, strategy.

Competitor Market Share And Sales Revenues Ppt PowerPoint Presentation File Demonstration
This is a competitor market share and sales revenues ppt powerpoint presentation file demonstration. This is a six stage process. The stages in this process are business, marketing, finance, your figures, development.

Area Chart Ppt PowerPoint Presentation Ideas Professional
This is a area chart ppt powerpoint presentation ideas professional. This is a two stage process. The stages in this process are business, sales in percentage, area chart, marketing, finance.

Column Chart Ppt PowerPoint Presentation Outline Design Ideas
This is a column chart ppt powerpoint presentation outline design ideas. This is a two stage process. The stages in this process are business, years, expenditure in, marketing, finance.

Revenue Split By Product Segment Template 2 Ppt PowerPoint Presentation Gallery Example File
This is a revenue split by product segment template 2 ppt powerpoint presentation gallery example file. This is a four stage process. The stages in this process are business, marketing, graph, finance, revenue split.

Donut Pie Chart Ppt PowerPoint Presentation Professional Graphic Images
This is a donut pie chart ppt powerpoint presentation professional graphic images. This is a three stage process. The stages in this process are percentage, finance, donut, business, marketing.

Clustered Column Ppt PowerPoint Presentation Inspiration Introduction
This is a clustered column ppt powerpoint presentation inspiration introduction. This is a two stage process. The stages in this process are business, marketing, in percentage, finance, graph, strategy.

Combo Chart Ppt PowerPoint Presentation Gallery Design Ideas
This is a combo chart ppt powerpoint presentation gallery design ideas. This is a three stage process. The stages in this process are business, financial years, sales in percentage, finance, graph.
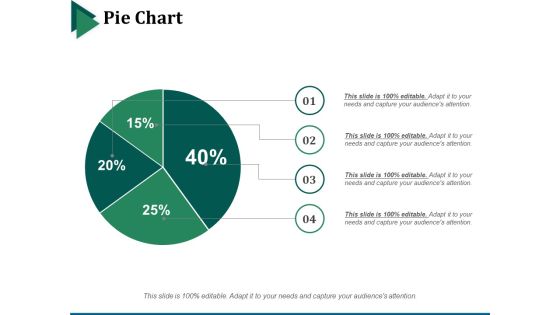
Pie Chart Ppt PowerPoint Presentation Infographic Template Backgrounds
This is a pie chart ppt powerpoint presentation infographic template backgrounds. This is a four stage process. The stages in this process are pie chart, marketing, strategy, finance, analysis.

Combo Chart Ppt PowerPoint Presentation Infographics Sample
This is a combo chart ppt powerpoint presentation infographics sample. This is a three stage process. The stages in this process are combo chart, finance, analysis, marketing, strategy, business.
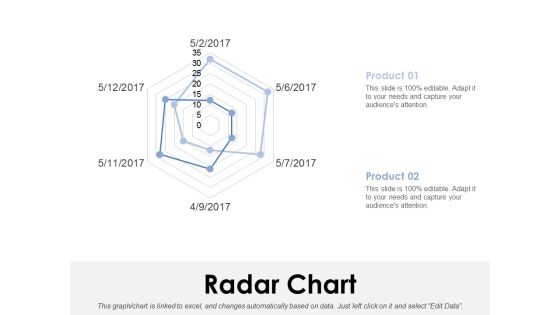
Radar Chart Ppt PowerPoint Presentation Model Clipart Images
This is a radar chart ppt powerpoint presentation model clipart images. This is a two stage process. The stages in this process are radar chart, finance, analysis, marketing, strategy, business.

Area Chart Ppt PowerPoint Presentation Outline Graphics Pictures
This is a area chart ppt powerpoint presentation outline graphics pictures. This is a two stage process. The stages in this process are financial year, in percentage, business, marketing, finance.

Bar Chart Ppt PowerPoint Presentation Layouts Template
This is a bar chart ppt powerpoint presentation layouts template. This is a two stage process. The stages in this process are financial year, sales in percentage, business, marketing, finance.
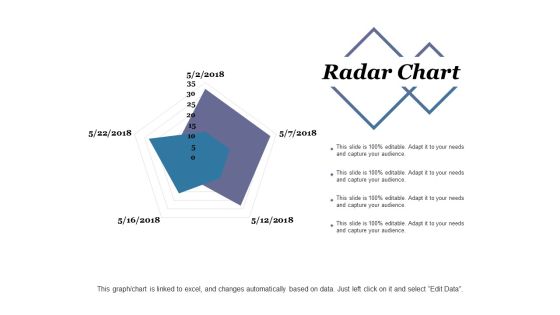
Radar Chart Ppt PowerPoint Presentation Infographic Template Sample
This is a radar chart ppt powerpoint presentation infographic template sample. This is a two stage process. The stages in this process are radar chart, finance, marketing, strategy, analysis.
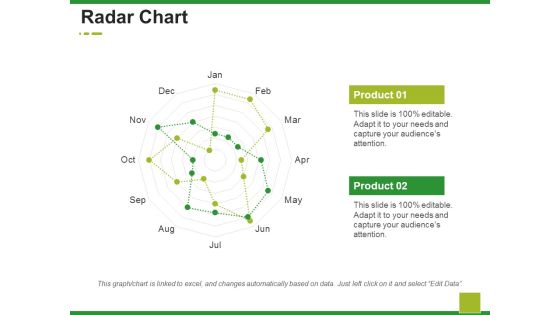
Radar Chart Ppt PowerPoint Presentation Ideas Design Ideas
This is a radar chart ppt powerpoint presentation ideas design ideas. This is a two stage process. The stages in this process are business, marketing, radar chart, finance, strategy.

Area Chart Ppt PowerPoint Presentation Layouts Graphic Images
This is a area chart ppt powerpoint presentation layouts graphic images. This is a three stage process. The stages in this process are business, in years, marketing, in percentage, finance, graph.

Bar Graph Ppt PowerPoint Presentation Layouts Influencers
This is a bar graph ppt powerpoint presentation layouts influencers. This is a two stage process. The stages in this process are business, marketing, in bar graph, sales in percentage, finance.

Clustered Bar Ppt PowerPoint Presentation Icon Professional
This is a clustered bar ppt powerpoint presentation icon professional. This is a two stage process. The stages in this process are business, marketing, profit, clustered bar, finance, strategy.

Revenue Split By Product Segment Template 2 Ppt PowerPoint Presentation Summary Good
This is a revenue split by product segment template 2 ppt powerpoint presentation summary good. This is a four stage process. The stages in this process are business, marketing, finance, strategy, graph.
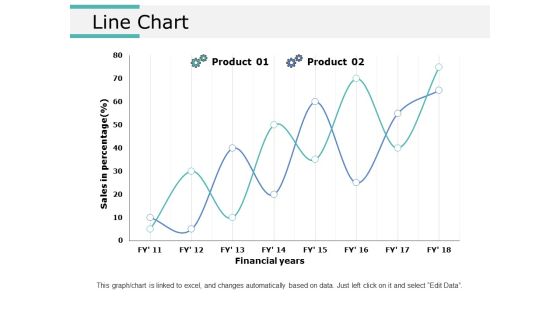
Line Chart Ppt PowerPoint Presentation Ideas Graphics Tutorials
This is a line chart ppt powerpoint presentation ideas graphics tutorials. This is a two stage process. The stages in this process are line chart, marketing, strategy, planning, finance.
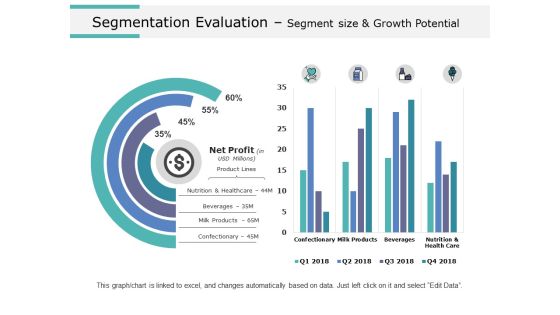
Segmentation Evaluation Segment Size And Growth Potential Ppt PowerPoint Presentation Styles Background Images
This is a segmentation evaluation segment size and growth potential ppt powerpoint presentation styles background images. This is a two stage process. The stages in this process are business, marketing, strategy, planning, finance.
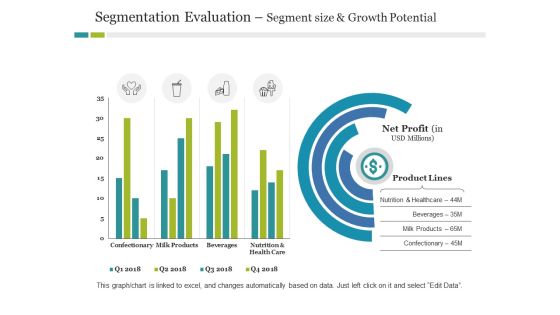
Segmentation Evaluation Segment Size And Growth Potential Ppt PowerPoint Presentation Infographic Template Outline
This is a segmentation evaluation segment size and growth potential ppt powerpoint presentation infographic template outline. This is a two stage process. The stages in this process are business, product lines, finance, marketing, strategy.

Volume High Low Close Chart Ppt PowerPoint Presentation Visual Aids Slides
This is a volume high low close chart ppt powerpoint presentation visual aids slides. This is a two stage process. The stages in this process are bar graph, marketing, strategy, finance, planning.
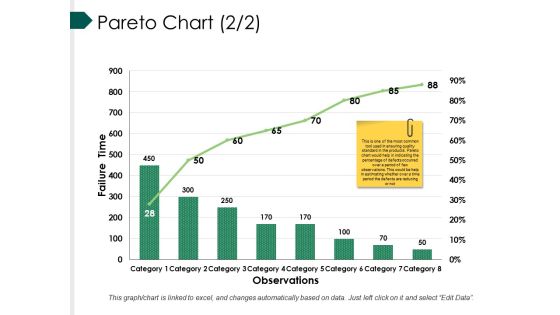
Pareto Chart Template Ppt PowerPoint Presentation Summary Graphic Images
This is a pareto chart template ppt powerpoint presentation summary graphic images. This is a eight stage process. The stages in this process are bar, marketing, strategy, finance, teamwork.

Area Chart Ppt PowerPoint Presentation Infographics Images
This is a area chart ppt powerpoint presentation infographics images. This is a two stage process. The stages in this process are area chart, finance, marketing, analysis, strategy, business.

Bar Chart Ppt PowerPoint Presentation Model Clipart Images
This is a bar chart ppt powerpoint presentation model clipart images. This is a two stage process. The stages in this process are bar chart, finance, marketing, strategy, analysis.
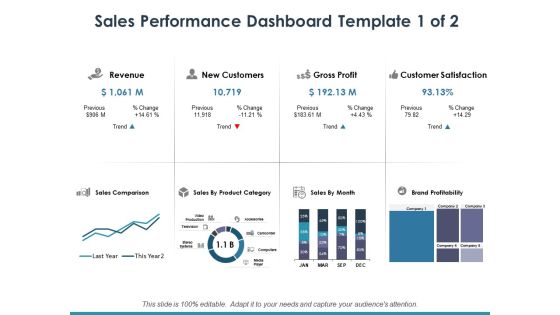
Sales Performance Dashboard Template 1 Ppt PowerPoint Presentation Infographic Template Maker
This is a sales performance dashboard template 1 ppt powerpoint presentation infographic template maker. This is a eight stage process. The stages in this process are dollar, business, finance, marketing.
Sales Target For Current Financial Year Ppt PowerPoint Presentation File Professional
This is a sales target for current financial year ppt powerpoint presentation file professional. This is a four stage process. The stages in this process are dollar, business, finance, marketing, currency.

Area Chart Ppt PowerPoint Presentation Inspiration Background Designs
This is a area chart ppt powerpoint presentation inspiration background designs. This is a two stage process. The stages in this process are business, sales in percentage, area chart, marketing, finance.

Area Chart Ppt PowerPoint Presentation File Format Ideas
This is a area chart ppt powerpoint presentation file format ideas. This is a two stage process. The stages in this process are area chart, marketing, planning, finance, strategy.

Actual Vs Target Sales Ppt PowerPoint Presentation Slides Template
This is a actual vs target sales ppt powerpoint presentation slides template. This is a seven stage process. The stages in this process are bar chart, marketing, strategy, finance, planning.

Area Chart Ppt PowerPoint Presentation Infographic Template Inspiration
This is a area chart ppt powerpoint presentation infographic template inspiration. This is a two stage process. The stages in this process are area chart, marketing, strategy, finance, planning.

Combo Chart Ppt PowerPoint Presentation Layouts Background Image
This is a combo chart ppt powerpoint presentation layouts background image. This is a three stage process. The stages in this process are bar chart, marketing, strategy, finance, planning.

Clustered Column Line Ppt PowerPoint Presentation Model Graphics Tutorials
This is a clustered column line ppt powerpoint presentation model graphics tutorials. This is a three stage process. The stages in this process are business, marketing, in percentage, finance, graph.

filled radar chart ppt powerpoint presentation ideas brochure
This is a filled radar chart ppt powerpoint presentation ideas brochure. This is a two stage process. The stages in this process are radar chart, finance, analysis, business, marketing, strategy.
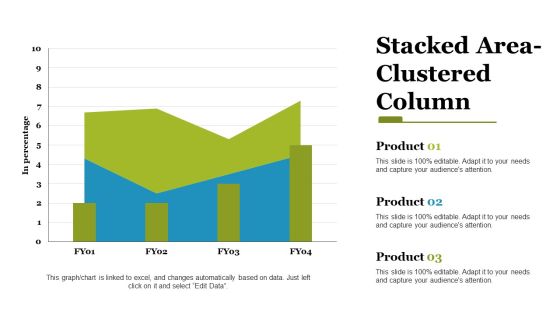
stacked area clustered column ppt powerpoint presentation styles files
This is a stacked area clustered column ppt powerpoint presentation styles files. This is a three stage process. The stages in this process are stacked area, clustered column, finance, marketing, strategy, business.

Pareto Chart Template 1 Ppt PowerPoint Presentation File Ideas
This is a pareto chart template 1 ppt powerpoint presentation file ideas. This is a eight stage process. The stages in this process are business, finance, marketing, strategy, analysis.

Pareto Chart Template 2 Ppt PowerPoint Presentation Outline Model
This is a pareto chart template 2 ppt powerpoint presentation outline model. This is a eight stage process. The stages in this process are pareto chart, finance, marketing, strategy, analysis.

Line Chart Ppt PowerPoint Presentation Slides Clipart Images
This is a line chart ppt powerpoint presentation slides clipart images. This is a two stage process. The stages in this process are line chart, marketing, strategy, planning, finance.

Area Chart Ppt PowerPoint Presentation Layouts Background Designs
This is a area chart ppt powerpoint presentation layouts background designs. This is a two stage process. The stages in this process are business, marketing, in percentage, area chart, finance.
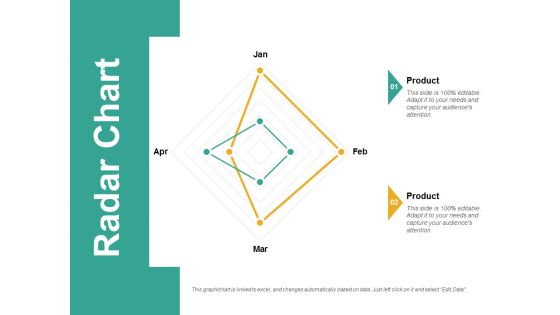
Radar Chart Ppt PowerPoint Presentation Visual Aids Professional
This is a radar chart ppt powerpoint presentation visual aids professional. This is a two stage process. The stages in this process are radar chart, finance, marketing, strategy, business.

Bar Chart Ppt PowerPoint Presentation Slides Model
This is a bar chart ppt powerpoint presentation slides model. This is a two stage process. The stages in this process are bar chart, analysis, business, marketing, strategy, finance.

Combo Chart Ppt PowerPoint Presentation Inspiration Slide Download
This is a combo chart ppt powerpoint presentation inspiration slide download. This is a two stage process. The stages in this process are Combo chart, finance, marketing, strategy, analysis.
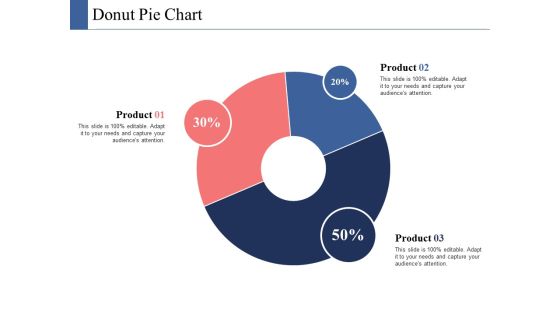
Donut Pie Chart Ppt PowerPoint Presentation Infographics Ideas
This is a donut pie chart ppt powerpoint presentation infographics ideas. This is a three stage process. The stages in this process are donut pie chart, finance, marketing, strategy, analysis.

Column Chart Template 1 Ppt PowerPoint Presentation Portfolio Format
This is a column chart template 1 ppt powerpoint presentation portfolio format. This is a two stage process. The stages in this process are column chart, finance, marketing, strategy, business.

Column Chart Template 2 Ppt PowerPoint Presentation Infographic Template Example Introduction
This is a column chart template 2 ppt powerpoint presentation infographic template example introduction. This is a two stage process. The stages in this process are column chart, finance, analysis, marketing, strategy.

Sales Performance Dashboard Template Ppt PowerPoint Presentation Slides Example File
This is a sales performance dashboard template ppt powerpoint presentation slides example file. This is a eight stage process. The stages in this process are business, marketing, strategy, finance, planning.
Sales Performance Dashboard Ppt PowerPoint Presentation Professional Icons
This is a sales performance dashboard template ppt powerpoint presentation slides example file. This is a six stage process. The stages in this process are business, marketing, strategy, finance, planning.
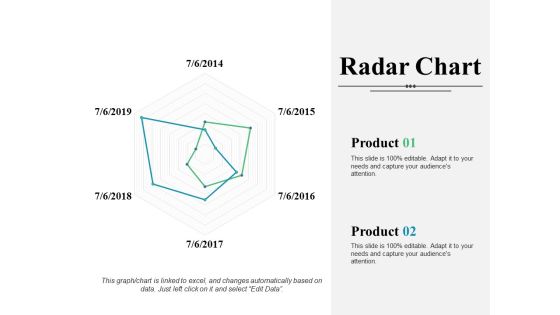
Radar Chart Ppt PowerPoint Presentation Infographic Template Introduction
This is a radar chart ppt powerpoint presentation infographic template introduction. This is a two stage process. The stages in this process are radar chart, finance, marketing, strategy, analysis, business.
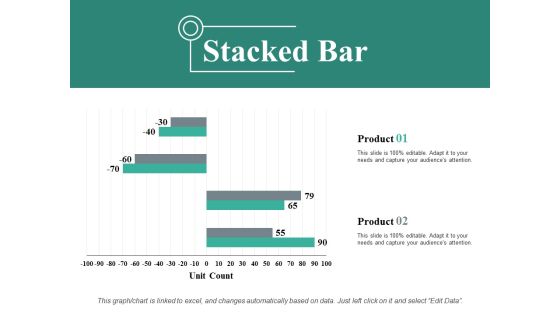
Stacked Bar Ppt PowerPoint Presentation Show Background Designs
This is a stacked bar ppt powerpoint presentation show background designs. This is a two stage process. The stages in this process are stacked bar, business, marketing, finance, unit count.
Sales Target For Current Financial Year Ppt PowerPoint Presentation Show Master Slide
This is a sales target for current financial year ppt powerpoint presentation show master slide. This is a five stage process. The stages in this process are sales target, marketing, strategy, finance, planning.
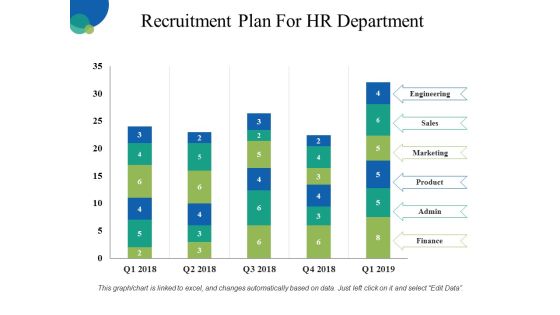
Recruitment Plan For HR Department Ppt PowerPoint Presentation Inspiration Layout Ideas
This is a recruitment plan for hr department ppt powerpoint presentation inspiration layout ideas. This is a five stage process. The stages in this process are engineering, sales, marketing, product, finance.

Area Chart Ppt PowerPoint Presentation Infographic Template Designs
This is a area chart ppt powerpoint presentation infographic template designs. This is a two stage process. The stages in this process are area chart, finance, marketing, strategy, business.

Stock Chart Ppt PowerPoint Presentation Infographics Graphics Example
This is a stock chart ppt powerpoint presentation infographics graphics example. This is a five stage process. The stages in this process are stock chart, finance, business, planning, marketing.

Clustered Bar Ppt PowerPoint Presentation Infographic Template Mockup
This is a clustered bar ppt powerpoint presentation infographic template mockup. This is a four stage process. The stages in this process are clustered bar, finance, marketing, planning, business.

Area Chart Financial Chart Ppt PowerPoint Presentation Design Ideas
This is a area chart financial chart ppt powerpoint presentation design ideas. This is two stage process. The stages in this process are finance, marketing, business, strategy, area chart.
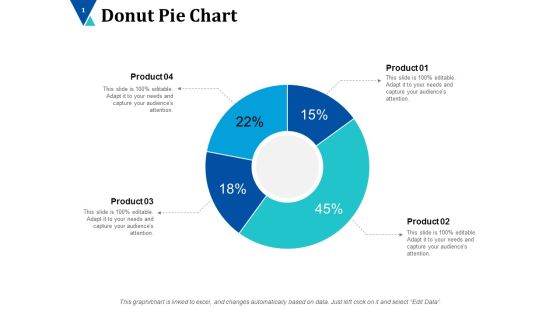
Donut Pie Chart Ppt PowerPoint Presentation Inspiration Designs Download
This is a donut pie chart ppt powerpoint presentation inspiration designs download. This is a four stage process. The stages in this process are donut, business, planning, marketing, finance.

Bar Graph Shows Financial Values Ppt PowerPoint Presentation Infographic Template Gridlines
This is a bar graph shows financial values ppt powerpoint presentation infographic template gridlines. This is a two stage process. The stages in this process are bar, marketing, strategy, finance, planning.
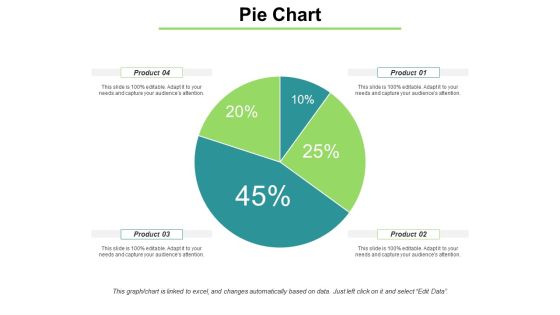
Pie Chart With Distrubation Ppt PowerPoint Presentation Model Ideas
This is a pie chart with distrubation ppt powerpoint presentation model ideas. This is a four stage process. The stages in this process are pie, finance, marketing, strategy, planning.
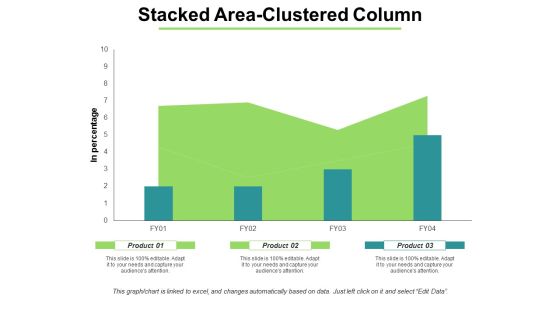
Stacked Area Clustered Column Ppt PowerPoint Presentation Portfolio Microsoft
This is a stacked area clustered column ppt powerpoint presentation portfolio microsoft. This is a two stage process. The stages in this process are business, marketing, strategy, planning, finance.

Stacked Line With Markers Ppt PowerPoint Presentation Pictures Background Designs
This is a stacked line with markers ppt powerpoint presentation pictures background designs. This is a two stage process. The stages in this process are line chart, marketing, strategy, planning, finance.

Clustered Column Ppt PowerPoint Presentation Icon Objects
This is a clustered column ppt powerpoint presentation icon objects. This is a two stage process. The stages in this process are clustered column, product, growth, finance, bar graph.
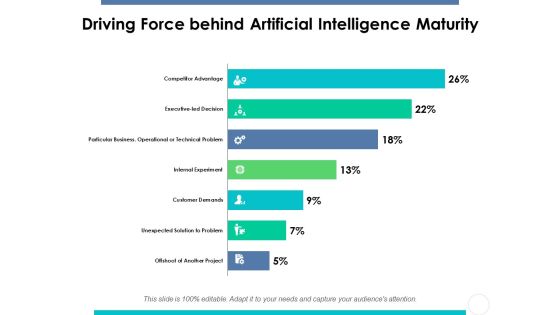
Driving Force Behind Artificial Intelligence Maturity Ppt PowerPoint Presentation Gallery Slides
This is a driving force behind artificial intelligence maturity ppt powerpoint presentation gallery slides. This is a seven stage process. The stages in this process are driving force, artificial, intelligence, maturity, finance.
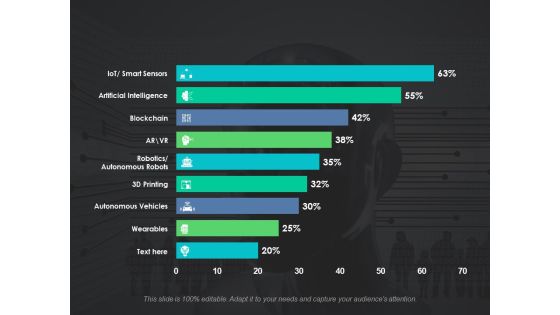
Survey On Adoption Of Emerging Technologies Ppt PowerPoint Presentation Model Format Ideas
This is a survey on adoption of emerging technologies ppt powerpoint presentation model format ideas. This is a nine stages process. The stages in this process are artificial intelligence, blockchain, autonomous robots, autonomous vehicles, wearable, finance.
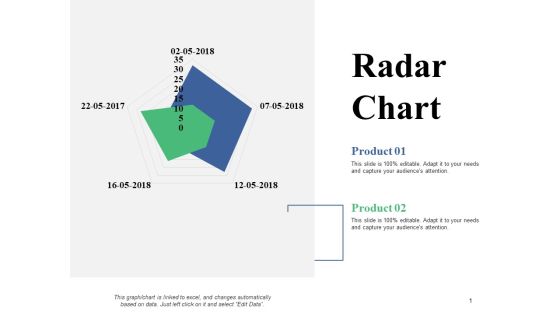
Radar Chart Ppt PowerPoint Presentation Slides Graphics Tutorials
This is a radar chart ppt powerpoint presentation slides graphics tutorials. This is a two stage process. The stages in this process are radar chart, finance, marketing, planning, business.

Bubble Chart Ppt PowerPoint Presentation Inspiration Master Slide
This is a bubble chart ppt powerpoint presentation inspiration master slide. This is a two stage process. The stages in this process are bubble chart, finance, planning, marketing, strategy.

Clustered Column Ppt PowerPoint Presentation Infographic Template Background Images
This is a clustered column ppt powerpoint presentation infographic template background images. This is a eight stage process. The stages in this process are clustered column, finance, planning, marketing, strategy.
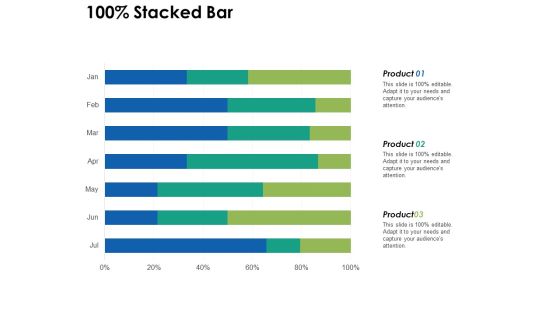
Stacked Bar Ppt PowerPoint Presentation File Design Ideas
This is a stacked bar ppt powerpoint presentation file design ideas. This is a three stage process. The stages in this process are finance, business, planning, marketing, stacked bar.
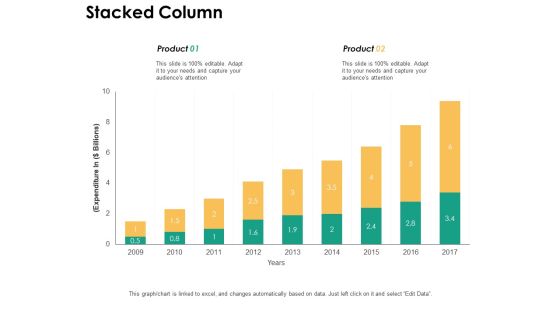
Stacked Column With Growth Ppt PowerPoint Presentation Pictures Guidelines
This is a stacked column with growth ppt powerpoint presentation pictures guidelines. This is a two stage process. The stages in this process are finance, business, planning, marketing, stacked column.

Clustered Bar Ppt PowerPoint Presentation Portfolio Design Templates
This is a clustered bar ppt powerpoint presentation portfolio design templates. This is a three stage process. The stages in this process are clustered bar, finance, business, planning, marketing.

Custom Combination Chart Ppt PowerPoint Presentation Styles Good
This is a custom combination chart ppt powerpoint presentation styles good. This is a three stage process. The stages in this process are custom combination chart, finance, business, planning, marketing.
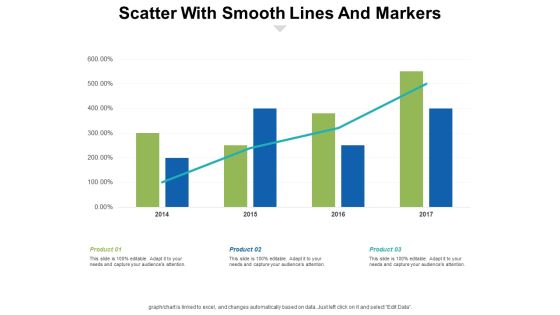
Scatter With Smooth Lines And Markers Ppt PowerPoint Presentation Layouts File Formats
This is a scatter with smooth lines and markers ppt powerpoint presentation layouts file formats. This is a three stage process. The stages in this process are finance, business, marketing, planning, strategy, business.
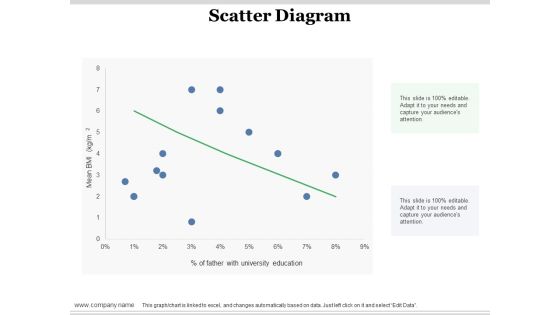
Scatter Diagram Ppt PowerPoint Presentation Infographic Template Design Ideas
This is a scatter diagram ppt powerpoint presentation infographic template design ideas. This is a one stage process. The stages in this process are scatter diagram, finance, in percentage, business, bar graph.
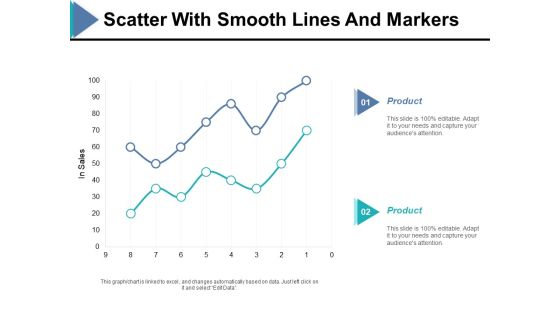
Scatter With Smooth Lines And Markers Ppt PowerPoint Presentation Ideas Example
This is a scatter with smooth lines and markers ppt powerpoint presentation ideas example. This is a two stage process. The stages in this process are in sales, finance, bar graph, product, business.

Clustered Column Chart Ppt PowerPoint Presentation Model Deck
This is a clustered column chart ppt powerpoint presentation model deck. This is a three stage process. The stages in this process are clustered column chart, product, finance, profit, business.
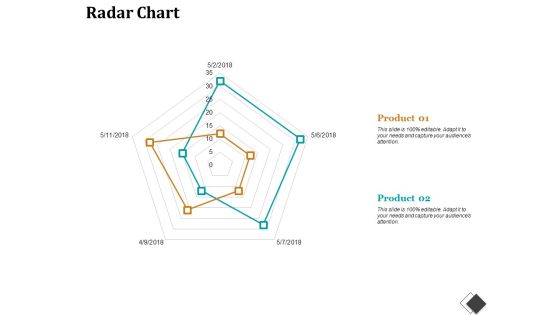
Radar Chart Enterprise Model Canvas Ppt PowerPoint Presentation File Slides
This is a radar chart enterprise model canvas ppt powerpoint presentation file slides. This is a two stage process. The stages in this process are radar chart, finance, marketing, strategy, business.

Bar Graph Companys Business Model Canvas Ppt PowerPoint Presentation Visual Aids Model
This is a bar graph companys business model canvas ppt powerpoint presentation visual aids model. This is a three stage process. The stages in this process are bar graph, finance, marketing, strategy, analysis, business.
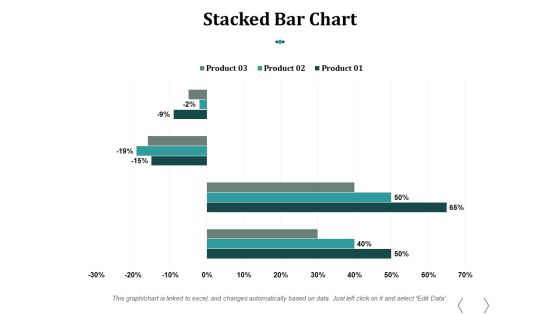
Stacked Bar Chart Ppt PowerPoint Presentation Influencers
This is a stacked bar chart ppt powerpoint presentation influencers. This is a three stage process. The stages in this process are stacked bar chart, product, percentage, finance, business.
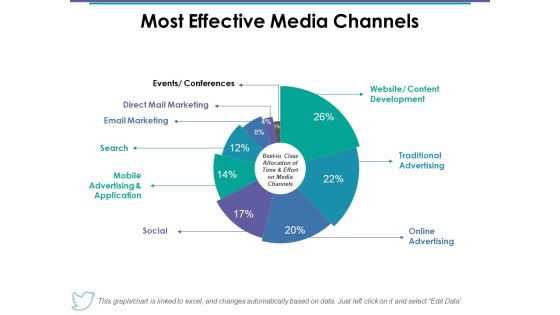
Most Effective Media Channels Ppt PowerPoint Presentation Outline Show
This is a most effective media channels ppt powerpoint presentation outline show. This is a nine stage process. The stages in this process are online advertising, traditional advertising, social, email marketing, finance.

Column Chart Ppt PowerPoint Presentation Layouts File Formats
This is a column chart ppt powerpoint presentation layouts file formats. This is a three stage process. The stages in this process are column chart, product, in percentage, year, finance.

Control Charts Template 1 Ppt PowerPoint Presentation Show Graphics Design
This is a control charts template 1 ppt powerpoint presentation show graphics design. This is a one stage process. The stages in this process are business, finance, marketing, strategy, analysis.

Control Charts Template 2 Ppt PowerPoint Presentation Slides Designs
This is a control charts template 2 ppt powerpoint presentation slides designs. This is a one stage process. The stages in this process are business, finance, marketing, strategy, analysis.

Histogram 7 QC Tools Ppt PowerPoint Presentation Gallery Layout
This is a histogram 7 qc tools ppt powerpoint presentation gallery layout. This is a two stage process. The stages in this process are business, finance, marketing, strategy, analysis.
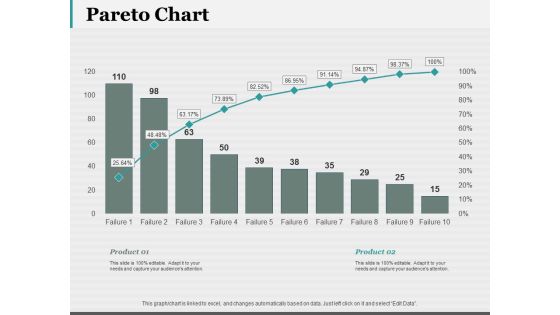
Pareto Chart Ppt PowerPoint Presentation Visual Aids Pictures
This is a pareto chart ppt powerpoint presentation visual aids pictures. This is a two stage process. The stages in this process are pareto chart, finance, marketing, strategy, business.
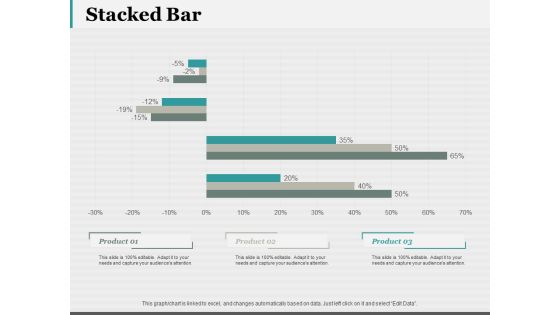
Stacked Bar 7 QC Tools Ppt PowerPoint Presentation Portfolio Smartart
This is a stacked bar 7 qc tools ppt powerpoint presentation portfolio smartart. This is a three stage process. The stages in this process are stacked bar, finance, marketing, strategy, business.
Stacked Column 7 QC Tools Ppt PowerPoint Presentation Icon
This is a stacked column 7 qc tools ppt powerpoint presentation icon. This is a three stage process. The stages in this process are stacked column, finance, marketing, strategy, business.

Area Stacked Analysis Ppt PowerPoint Presentation Inspiration Slideshow
This is a area stacked analysis ppt powerpoint presentation inspiration slideshow. This is a two stage process. The stages in this process are area chart, finance, marketing, strategy, business.

Bubble Chart Analysis Ppt PowerPoint Presentation Gallery Introduction
This is a bubble chart analysis ppt powerpoint presentation gallery introduction. This is a two stage process. The stages in this process are bubble chart, finance, marketing, strategy, business.

Combo Chart Process Ppt PowerPoint Presentation Model Clipart
This is a combo chart process ppt powerpoint presentation model clipart. This is a two stage process. The stages in this process are combo chart, finance, marketing, strategy, business.

Stacked Bar Financial Analysis Ppt PowerPoint Presentation Infographic Template Slides
This is a stacked bar financial analysis ppt powerpoint presentation infographic template slides. This is a two stage process. The stages in this process are stacked bar, finance, marketing, strategy, analysis.

Stacked Column Capability Maturity Matrix Ppt PowerPoint Presentation Model Shapes
This is a stacked column capability maturity matrix ppt powerpoint presentation model shapes. This is a three stage process. The stages in this process are stacked column, product, year, finance, business.
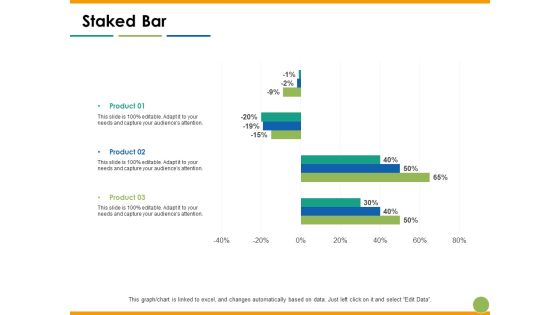
Staked Bar Capability Maturity Matrix Ppt PowerPoint Presentation Slides Outfit
This is a staked bar capability maturity matrix ppt powerpoint presentation slides outfit. This is a three stage process. The stages in this process are staked bar, product, year, finance, percentage.

Bubble Chart Process Analysis Ppt PowerPoint Presentation Ideas Files
This is a bubble chart process analysis ppt powerpoint presentation ideas files. This is a two stage process. The stages in this process are bubble chart, product, profit, finance, business.

Clustered Bar Process Analysis Ppt PowerPoint Presentation Icon Influencers
This is a clustered bar process analysis ppt powerpoint presentation icon influencers. This is a two stage process. The stages in this process are clustered bar, profit, product, finance, business.

Stacked Bar Chart Ppt PowerPoint Presentation Portfolio Templates
This is a stacked bar chart ppt powerpoint presentation portfolio templates. This is a three stage process. The stages in this process are stacked bar chart, product, year, business, finance.

Financial About New Product Ppt PowerPoint Presentation Infographic Template Objects
This is a financial about new product ppt powerpoint presentation infographic template objects. This is a three stage process. The stages in this process are dollar, business, finance, marketing.

Combo Chart Marketing Ppt Powerpoint Presentation Layouts Designs Download
This is a combo chart marketing ppt powerpoint presentation layouts designs download. This is a three stage process. The stages in this process are combo chart, marketing, growth, product, finance.
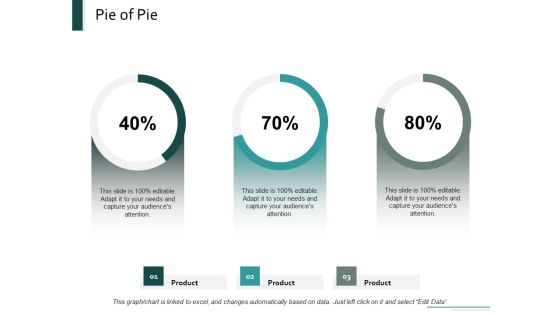
Pie Of Pie Marketing Ppt Powerpoint Presentation Inspiration Designs
This is a pie of pie marketing ppt powerpoint presentation inspiration designs. This is a three stage process. The stages in this process are finance, pie chart, product, marketing, percentage.
Manufacturing Operation Quality Improvement Practices Tools Templates Manufacturing Key Objectives Icons PDF
The following slide displays the key objectives and results that the organizations willing to obtain from the entire process of manufacturing. This is a manufacturing operation quality improvement practices tools templates manufacturing key objectives icons pdf template with various stages. Focus and dispense information on four stages using this creative set, that comes with editable features. It contains large content boxes to add your information on topics like meet customer expectations, engage employees, balancing cost, risk and performance, sustainable financial returns. You can also showcase facts, figures, and other relevant content using this PPT layout. Grab it now.

Implementing DRP IT Data Loss Statistics Due To Lack Of DRP Ppt PowerPoint Presentation Slides Influencers PDF
This slide depicts why a disaster recovery plan is essential for businesses and how small and medium sized enterprises lose their revenue due to downtime and no DR plan.This is a implementing drp it data loss statistics due to lack of drp ppt powerpoint presentation slides influencers pdf template with various stages. Focus and dispense information on five stages using this creative set, that comes with editable features. It contains large content boxes to add your information on topics like downtime costs a minimum, businesses that lose, regular occurrence You can also showcase facts, figures, and other relevant content using this PPT layout. Grab it now.

Quantitative Risk Assessment Mathematical Approach For Software Project Make Or Buy Analysis Portrait PDF
This slide provides the glimpse about the mathematical approach for software project which focuses on make, buy option along with cost difference and solutions. This is a Quantitative Risk Assessment Mathematical Approach For Software Project Make Or Buy Analysis Portrait PDF template with various stages. Focus and dispense information on three stages using this creative set, that comes with editable features. It contains large content boxes to add your information on topics like Mathematical Approach For Software Project Make Or Buy Analysis. You can also showcase facts, figures, and other relevant content using this PPT layout. Grab it now.

Organic Business Growth Strategies Selling Products And Services To Existing Customer Download PDF
The following slide helps the organization in understanding Selling products and services to existing customer as a strategy to obtain organic growth. It also displays key advantages such as cost effective, increase in customer base etc. This is a Organic Business Growth Strategies Selling Products And Services To Existing Customer Download PDF template with various stages. Focus and dispense information on five stages using this creative set, that comes with editable features. It contains large content boxes to add your information on topics like Marketing, Products, Business. You can also showcase facts, figures, and other relevant content using this PPT layout. Grab it now.
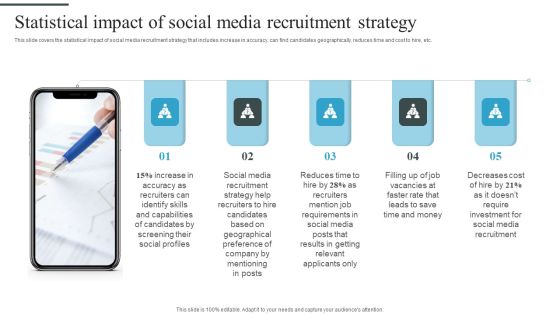
Tactical Process For Social Statistical Impact Of Social Media Recruitment Strategy Slides PDF
This slide covers the statistical impact of social media recruitment strategy that includes increase in accuracy, can find candidates geographically, reduces time and cost to hire, etc. This is a Tactical Process For Social Statistical Impact Of Social Media Recruitment Strategy Slides PDF template with various stages. Focus and dispense information on five stages using this creative set, that comes with editable features. It contains large content boxes to add your information on topics like Social Profiles, Getting Relevant Applicants, Reduces Time. You can also showcase facts, figures, and other relevant content using this PPT layout. Grab it now.

Benefits Of Flexible Work Schedule Model For Employer And Employee Brochure PDF
This slide shows the flexible working arrangements benefits to employers and employees. It includes benefits for the employer such as increase in productivity, employee morale, less turnover etc. Presenting Benefits Of Flexible Work Schedule Model For Employer And Employee Brochure PDF to dispense important information. This template comprises three stages. It also presents valuable insights into the topics including Increase In Productivity, Environment, Costs. This is a completely customizable PowerPoint theme that can be put to use immediately. So, download it and address the topic impactfully.

Business To Business Digital Marketing Stats And Figures Ppt Infographic Template Microsoft PDF
This slide showcases online marketing statistics and figures. The stats covered are lead conversion through webinars, emails, called calls and visual content and decrease in cost. Presenting Business To Business Digital Marketing Stats And Figures Ppt Infographic Template Microsoft PDF to dispense important information. This template comprises six stages. It also presents valuable insights into the topics including Live Chat, Lead Nurturing, Webinars, Cold Calling. This is a completely customizable PowerPoint theme that can be put to use immediately. So, download it and address the topic impactfully.
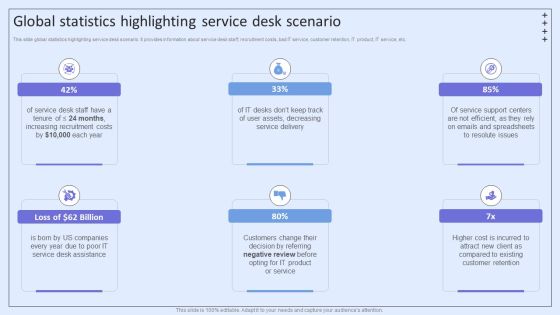
Integrating ITSM To Enhance Service Global Statistics Highlighting Service Desk Scenario Portrait PDF
This slide global statistics highlighting service desk scenario. It provides information about service desk staff, recruitment costs, bad IT service, customer retention, IT product, IT service, etc. Present like a pro with Integrating ITSM To Enhance Service Global Statistics Highlighting Service Desk Scenario Portrait PDF Create beautiful presentations together with your team, using our easy-to-use presentation slides. Share your ideas in real-time and make changes on the fly by downloading our templates. So whether youre in the office, on the go, or in a remote location, you can stay in sync with your team and present your ideas with confidence. With Slidegeeks presentation got a whole lot easier. Grab these presentations today.

Business Process Redesigning Why Do We Require Business Process Reengineering Designs PDF
This slide focuses on the importance of business process reengineering such as total customer satisfaction, cost advantage, competitive advantage and creating value for customers. The Business Process Redesigning Why Do We Require Business Process Reengineering Designs PDF is a compilation of the most recent design trends as a series of slides. It is suitable for any subject or industry presentation, containing attractive visuals and photo spots for businesses to clearly express their messages. This template contains a variety of slides for the user to input data, such as structures to contrast two elements, bullet points, and slides for written information. Slidegeeks is prepared to create an impression.

Business Restructuring Process Why Do We Require Business Process Reengineering Rules PDF
This slide focuses on the importance of business process reengineering such as total customer satisfaction, cost advantage, competitive advantage and creating value for customers. The Business Restructuring Process Why Do We Require Business Process Reengineering Rules PDF is a compilation of the most recent design trends as a series of slides. It is suitable for any subject or industry presentation, containing attractive visuals and photo spots for businesses to clearly express their messages. This template contains a variety of slides for the user to input data, such as structures to contrast two elements, bullet points, and slides for written information. Slidegeeks is prepared to create an impression.

Deploying AI To Enhance Impact Of Industrial Internet Of Things On Manufacturing Guidelines PDF
This slide depicts the impact of the industrial internet of things on the manufacturing industry, including reduced costs, increased operational machine uptime and accessibility, increased operations speed, enhanced product quality, and improved safety. Take your projects to the next level with our ultimate collection of Deploying AI To Enhance Impact Of Industrial Internet Of Things On Manufacturing Guidelines PDF. Slidegeeks has designed a range of layouts that are perfect for representing task or activity duration, keeping track of all your deadlines at a glance. Tailor these designs to your exact needs and give them a truly corporate look with your own brand colors theyll make your projects stand out from the rest.

Search Engine Marketing Draft Sample Campaign Ad Copy Themes PDF
The following slide showcases search engine marketing campaign advertisement copy to encourage potential buyer for purchase action. It mainly includes elements such as ad group, keywords, ad copy, cost etc. Take your projects to the next level with our ultimate collection of Search Engine Marketing Draft Sample Campaign Ad Copy Themes PDF. Slidegeeks has designed a range of layouts that are perfect for representing task or activity duration, keeping track of all your deadlines at a glance. Tailor these designs to your exact needs and give them a truly corporate look with your own brand colors theyll make your projects stand out from the rest.

Designing Strategies For Company Growth And Success Organic Growth Strategies To Improve Profitability Template PDF
This slide outlines various strategies of organic growth of business to increase market share and gain stronger competitive position. It showcases strategies such as increase in sales revenue, reducing costs and improving operational efficiencies. From laying roadmaps to briefing everything in detail, our templates are perfect for you. You can set the stage with your presentation slides. All you have to do is download these easy to edit and customizable templates. Designing Strategies For Company Growth And Success Organic Growth Strategies To Improve Profitability Template PDF will help you deliver an outstanding performance that everyone would remember and praise you for. Do download this presentation today.

Basic And Platinum Cloud Mining Pricing Options For Cryptocurrency Guidelines PDF
This slide showcases pricing options for cloud mining that can help individuals to select the viable option for bitcoin on the basis of cost and available specifications. It outline four types of plans that are basic, gold, diamond and platinum Presenting Basic And Platinum Cloud Mining Pricing Options For Cryptocurrency Guidelines PDF to dispense important information. This template comprises five stages. It also presents valuable insights into the topics including Basic, Gold, Diamond. This is a completely customizable PowerPoint theme that can be put to use immediately. So, download it and address the topic impactfully.


 Continue with Email

 Home
Home


